1. Introduction
Advances in artificial intelligence, particularly the successful development of computer vision (CV) neural networks over the past decade, present new opportunities for the agricultural industry, potentially leading to significant changes in the organization of agricultural enterprises (farms).
Computer vision neural networks, capable of detecting and recognizing objects in photos and videos with high accuracy, are increasingly employed to monitor processes and objects in agricultural production. In addition to the traditional tasks of monitoring and controlling facilities and production areas, agricultural enterprises have specific needs that deep neural networks can address. Notably, the timely detection of plant diseases or pests is crucial in greenhouses and urban farms, where CV neural networks can be effectively utilized [
1,
2,
3,
4,
5]. Another application of CV involves automatically determining product quality and calculating volume [
6,
7].
The operational assessment of the volume of products grown is essential for ensuring the economic efficiency of agricultural enterprises. Unlike long-term forecasts, which utilize machine learning methods [
8,
9], operational assessments of agricultural production volumes facilitate planning for the enterprise’s operations and expected revenues in the medium and short term. This capability enables ordering necessary volumes and types of containers for transporting products to consumers, organizing deliveries and optimal transportation routes and concluding additional supply contracts.
However, review papers [
3,
5,
10] indicate that the tasks of detecting plant diseases and pests have become more popular among researchers than the equally important tasks of counting products. These tasks are vital for key business processes and can be integrated into specialized software systems that support the activities of agricultural enterprises.
In our study, we address a set of tasks to develop a predictive assessment tool for the volume of products grown in greenhouses, using tomatoes as a case study. Tomatoes are among the most popular agricultural products produced in many regions worldwide, necessitating special attention to storage and transportation conditions to prevent damage, which makes short-term (operational) planning for collection, packaging and delivery even more critical.
Modern authors have frequently explored the potential of deep learning technologies to combat diseases or pests affecting tomatoes [
10], and there are numerous examples of research related to yield estimation for this crop [
11,
12].
Researchers’ experience has highlighted several relevant features for training neural network models. Specifically, it is important to consider both the specifics of the applied problem and the conditions and location of tomato cultivation across different regions and farms. In other words, neural networks can achieve sufficient accuracy for real-world applications when training on data that closely reflects these operating conditions. Relying solely on well-known, universal training datasets does not yield high accuracy for solving users’ applied tasks [
5]. Significantly higher accuracy rates are obtained when the neural network model is trained using images from specific locations and growing conditions. However, creating such datasets, evaluating them and verifying their suitability remains time-consuming, requiring specialized expertise and considerable time and effort.
In our study, we propose a framework that employs a systematic tuning process for neural network models. This process begins with fundamental general-purpose models (Task-Agnostic Learning) and progresses to specialize the model for specific product types and tasks (Domain-Task Adaptation). Finally, we customize the model to meet the end user’s usage conditions (Client-Specific Fine-Tuning). To achieve this, we incorporate studying the end user’s needs and the conditions and features of greenhouse use at the target agricultural enterprise into the development and training of the model. Next, we propose a method for estimating the number of tomatoes by filtering and counting the detected objects while considering the characteristics of the images obtained from the greenhouses. The proposed approach is detailed in
Section 2. To experimentally verify this approach, we collected the necessary datasets and conducted additional training and experiments using the YOLO11 detection model along with the tomato counting algorithm. The results of this work are presented in
Section 3. The Discussion and Conclusion Sections analyze the results obtained, including estimates of the model quality metrics and the specifics of applying the proposed approach for practical implementation.
2. Materials and Methods
In this section, we will describe the characteristics of the YOLO model used, the description of a framework with sequential tuning of pre-trained models on different datasets and the algorithm for counting tomatoes, which is capable of highlighting the tomatoes in the front row.
2.1. YOLO Models
The work utilizes pre-trained models from the YOLO11 family developed by Ultralytics [
13]. This family of models is designed to address typical computer vision problems, including object detection, image segmentation and classification. YOLO models have consistently demonstrated their effectiveness in applied research within the agricultural industry, tackling tasks such as disease detection, plant variety identification and fruit detection [
14,
15,
16,
17,
18,
19].
Some studies have focused on enhancing the architecture of YOLO models to improve their performance in meeting end-user requirements. Developers have shown particular interest in modernizing detector models by incorporating attention mechanisms [
17,
19]. The introduction of attention mechanisms enhances the quality of fruit detection against the backdrop of other plant parts by amplifying the frequently repeated combinations of visual features that the model identifies during the learning process while diminishing the influence of elements in the images unrelated to the detected objects. However, achieving this effect necessitates the creation of sufficiently large and diverse training datasets.
The architecture of the YOLO11 model comprises blocks with similar functions that enhance important spatial features and image channels. These include the C2PSA, CPPF and C3k2 units (
Figure 1), where C2PSA stands for Convolutional block with Parallel Spatial Attention, SPPF refers to Spatial Pyramid Pooling—Fast, and C3k2 denotes Cross Stage Partial with a kernel size of 2 [
20].
We examined the YOLO11 model without altering its architecture, allowing us to utilize a ready-made model from the developer’s library and facilitating the seamless transfer of the completed model to applications developed by others. At the same time, we achieved the desired quality results by fine-tuning the model with specialized and custom datasets.
In our work, we employed the YOLO11n model, which is pre-trained on the COCO dataset from the Ultralytics package and contains 2.6 million parameters. This model is the smallest detection model in the series in terms of the number of parameters and operations performed. According to the manufacturer’s documentation, the prediction accuracy of the pre-trained YOLO11n model is slightly lower than that of larger-scale YOLO11 variants such as YOLO11s, YOLO11m, YOLO11l and YOLO11x [
20]. However, it is particularly suitable for use in user software applications, especially in scenarios with limited computing resources, which may arise when implemented in greenhouses.
Table 1 presents a comparative analysis of this model alongside other popular and widely used models of similar size, such as YOLOv5 and YOLOv8 [
20]. The developers’ data indicates that YOLO11 is a lighter and faster version compared to models from previous series, achieving higher detection accuracy metrics (mAP) on benchmarks [
13,
20].
We specifically used YOLO11n to test its capabilities to achieve accuracy values that would be commensurate with the results of similar studies on other models. To assess the quality and performance of the trained models, we used the well-known mean average precision (mAP) metrics—mAP@50, mAP@75, mAP@50-95, which are used by researchers and manufacturers of detecting models for their comparison and validation [
21].
We also evaluated accuracy indicators such as Precision and Recall, which are of particular interest for the task of counting the number of tomatoes.
The following formulas are used to calculate these metrics in detection tasks [
19]:
where TP is the number of objects of the class (tomatoes) correctly highlighted in the image, and FP is the number of objects that are mistakenly assigned to the “tomato” class. The metric characterizes the model’s ability to correctly find tomatoes in an image without including other objects (for example, foreign objects or plant leaves) in this number:
where FN indicates the number of objects of the “tomato” class omitted by the model in the image. In the context of our task, the Recall metric will characterize the completeness with which the model finds all the tomatoes in the image. In this case, the false negative rate, FNR = (1 − Recall), shows the proportion of objects of the “tomato” class that the model skips in the images.
The mAP metric is a comprehensive indicator of model quality and can take values in the range from 0 to 1, where 1 is the highest estimate of the accuracy of the detecting model. This indicator takes into account the average values of the AP metric when N classes are detected. In the problem of detecting tomatoes, N = 1 and mAP = AP, the following formula is used to calculate AP:
where SUM is the sign of the sum at the index k, which takes values from 0 to n − 1, and n is the number of Precision thresholds in the range from 0 to 1.
The accuracy of determining the coordinates of the detected object is taken into account when estimating mAP@50, mAP@75 and mAP@50:95. For this, we estimate how much the frame (bounding box) of the detected object matches the actual box determined in the dataset. The metric of the boxes matches is the Intersection over Union (IoU), which is calculated using the formula [
19]:
where the Area of Overlap is the common area shared by the two bounding boxes (Overlap), and Area of Union is the total area covered by the two bounding boxes. The two bounding boxes refer to the predicted box and the ground truth bounding box.
The mAP@50, mAP@75 scores consider the found objects as true at IoU thresholds of 0.50 and 0.75, respectively, and the mAP@50:95 metric denotes the average accuracy in the IoU range from 0.50 to 0.95.
2.2. Framework for Transfer-Learning, Fine-Tuning and Data Preparation
The overall process of counting tomatoes in images is divided into two tasks: detecting and estimating the number of tomatoes. It is essential to consider the features and limitations that arise from the user’s needs and the operating conditions of the developed models. Clearly, the accuracy of detection directly impacts the accuracy of estimating the number of objects.
Numerous studies on computer vision models for recognizing tomatoes and other agricultural products in images have demonstrated that even large pre-trained models do not consistently yield sufficient accuracy. Research reviews [
5,
10] have repeatedly shown that to enhance the accuracy of classification or detection of agricultural products in images, it is necessary to fine-tune pre-trained models using proprietary data that reflects the characteristics of the recognizable objects and their environments.
However, data collection and annotation represent one of the most time-consuming stages of preparatory work, requiring specialized skills, significant time investment, and ultimately contributing substantially to the cost of implementing neural network models in the agricultural industry.
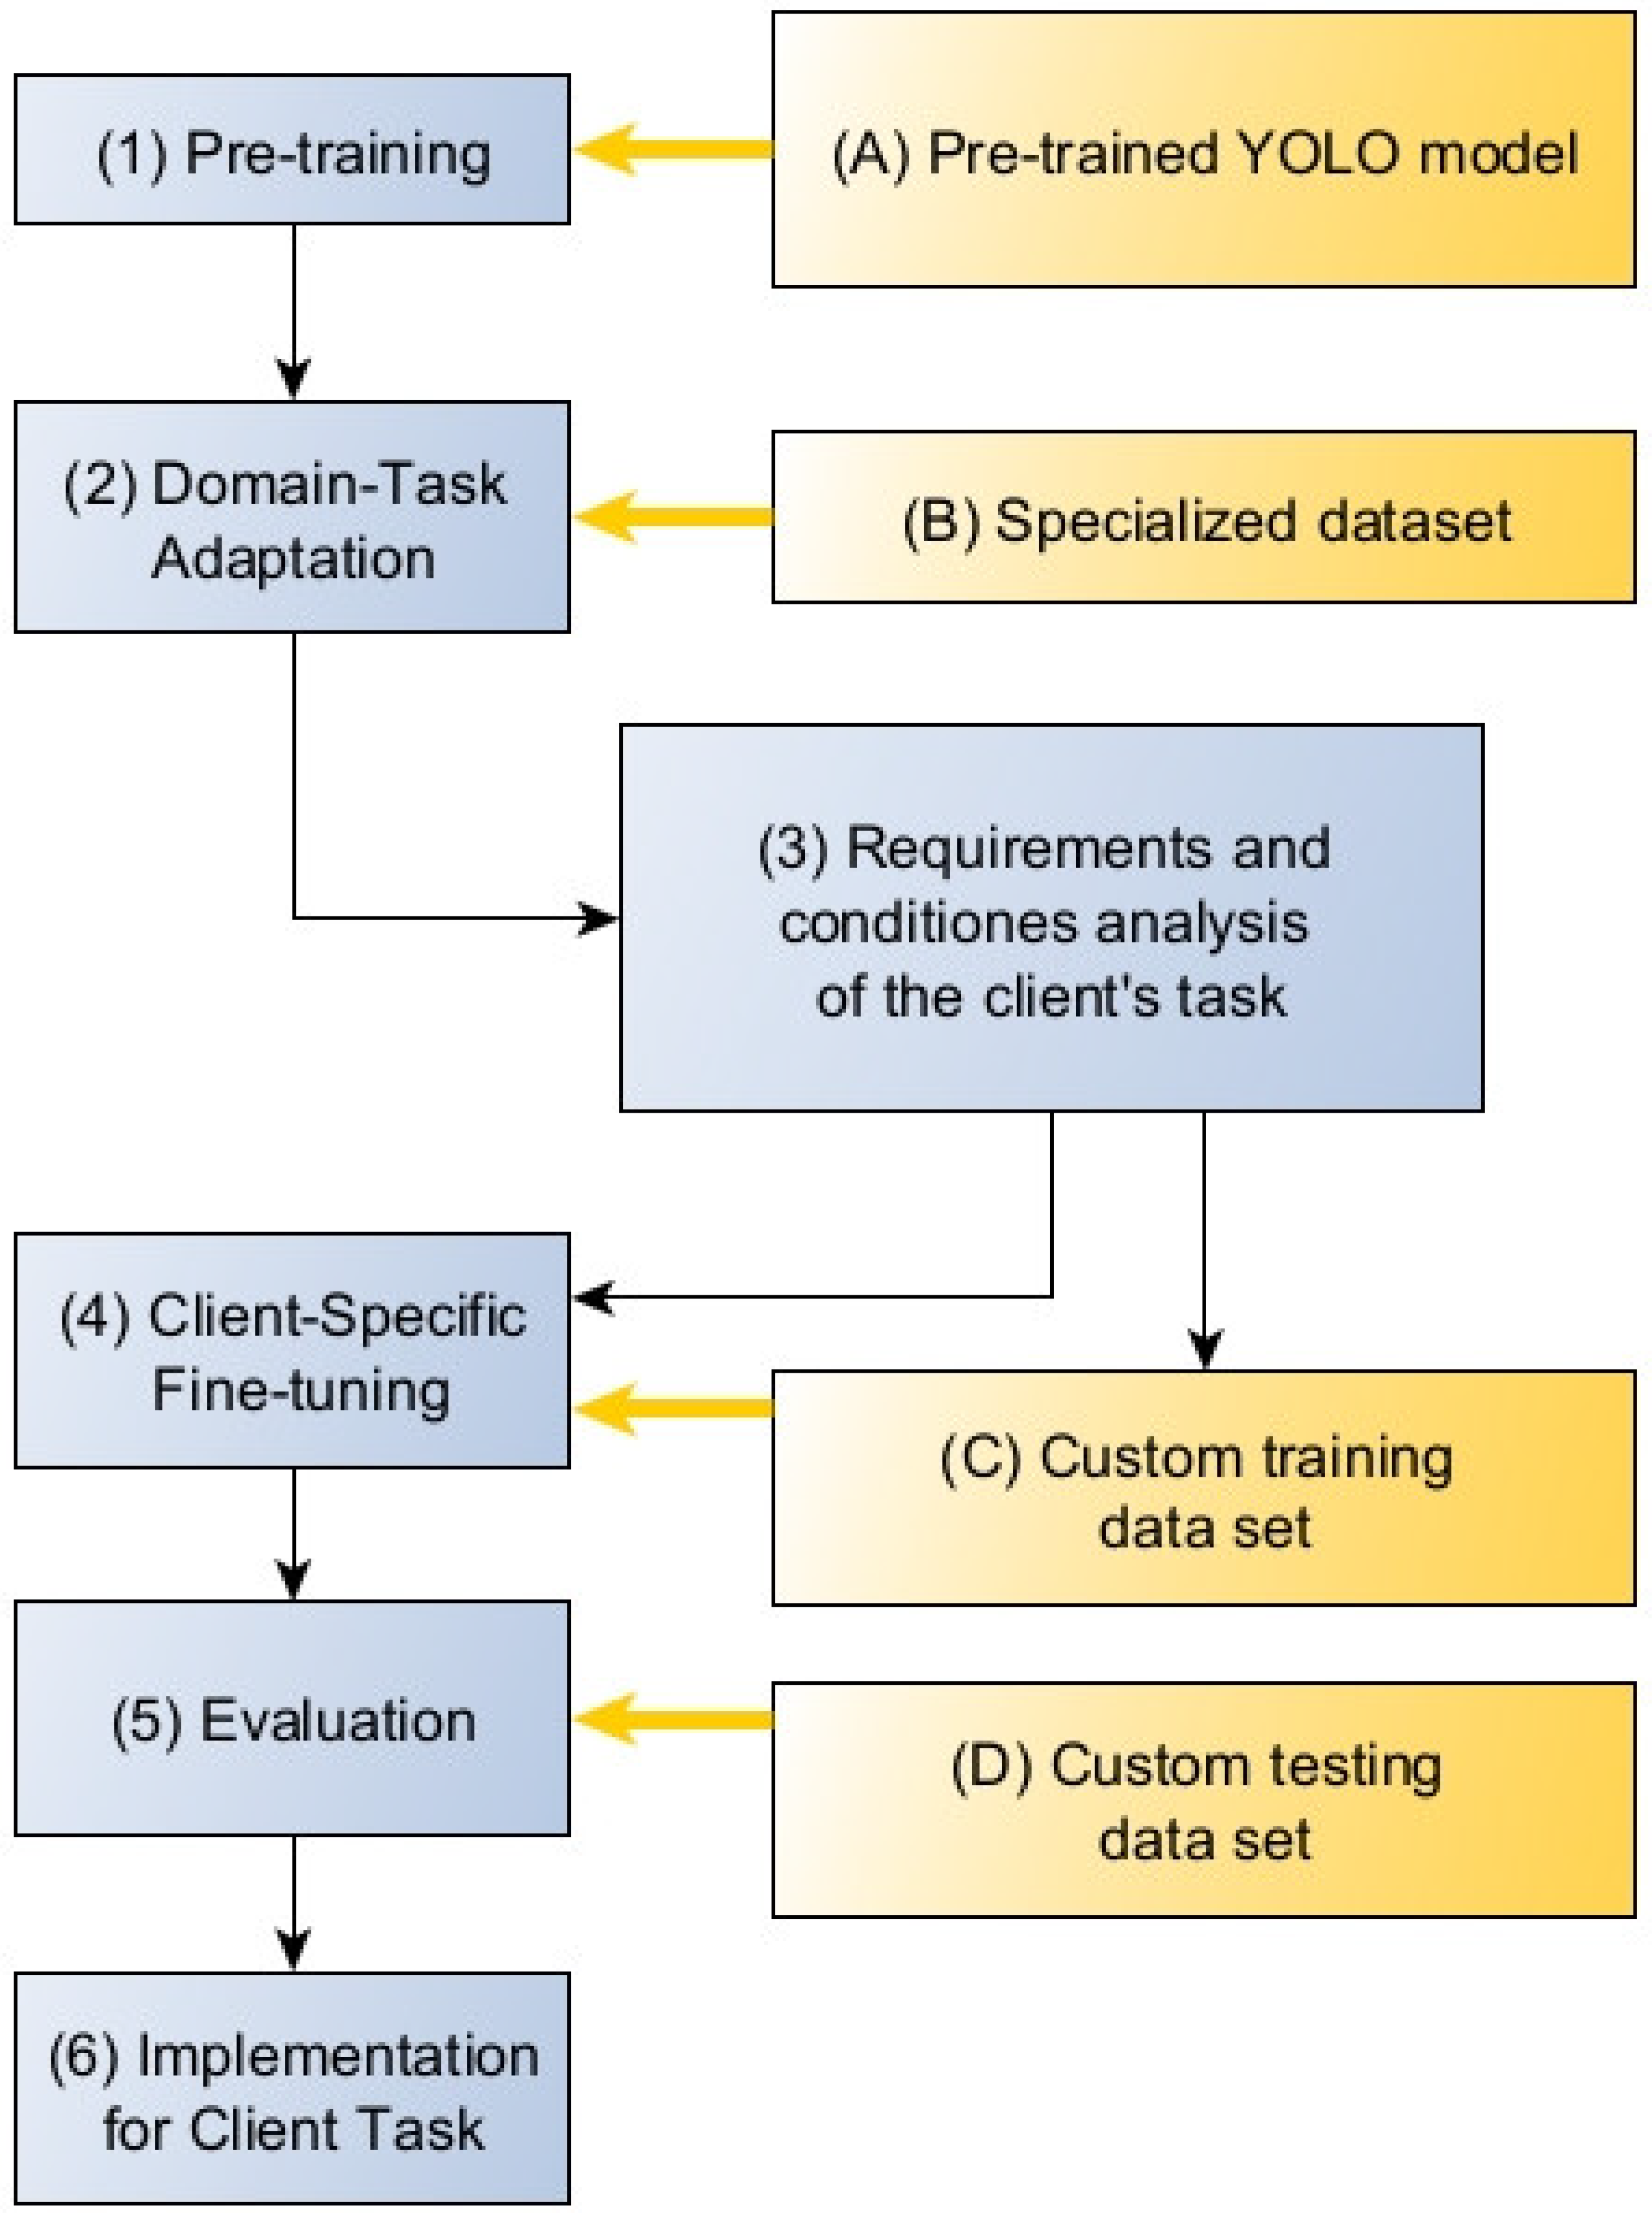
To reduce complexity and accelerate the implementation of neural network models in agricultural enterprises, we propose a framework that involves sequential tuning of pre-trained models on different datasets (
Figure 2). The client model is based on a pre-trained model (block 1), specifically the pre-trained YOLO model (block A) used in this study. The model is then adapted for the specific task area, a step known as Domain Task Adaptation (block 2), utilizing specialized publicly available datasets (block B). The next step involves analyzing the conditions and requirements of the end user’s tasks (block 3). Subsequently, the adapted model undergoes fine-tuning for the client’s specific task (block 4), using a custom dataset (block C) for this purpose. The final step is to evaluate the model’s quality (block 5) using a custom test dataset (block D) before implementing the model (block 6).
Let us provide some clarification for each stage. The pre-trained model (block 1) saves time and resources during training while allowing the use of modern, proven architectures. This is especially relevant in the context of a small dataset. All of this allows developers to focus on fine-tuning and adapting the model to specific tasks rather than starting from scratch.
At the adaptation stage (block 2), the model is trained to identify and utilize object features for recognition in images under conditions that are not related to the specific requirements of end users. In our case, tomato recognition was achieved using a dataset from Kaggle [
22] (block B) for this purpose.
Before fine-tuning (block 4), it is advisable to analyze the conditions and requirements (block 3) to correctly compile the custom dataset (block C). The custom dataset takes into account the specifics of the client’s task and the conditions under which the model will be used. Such specifics may include the nature and location of plant cultivation, the variety and appearance of the fruits, the height and density of plant growth, background features, equipment or other objects appearing in the images, lighting, camera angle and much more. It is not feasible to account for all such specifics in a specialized dataset in advance. However, they can be considered through examples in the custom dataset.
After preliminary adaptation, relatively small training datasets can be used for fine-tuning (block 4). This allows us to avoid the costs and difficulties associated with preparing data on-site for model deployment.
In our study, custom datasets were formed from images obtained from specific greenhouses or city farms for which the neural network model was being prepared. A description of one such dataset will be provided in the Results Section.
To verify the model’s functionality (block 5), we use metric evaluation on specially created test datasets that contain images obtained from the end user. These datasets are referred to as custom test datasets (block D).
Unlike the method of metric evaluation, where they are measured during training on the training and validation parts of the training dataset, using a custom test dataset increases the reliability and validity of the quality assessment of the model for an end-user application.
2.3. The Method of Counting the Tomato Number
To calculate the volume of products produced using computer vision technologies, photo or video cameras are employed in greenhouses across large areas, mounted on mobile self-propelled platforms [
23]. These platforms move along the rows and capture images at a pre-determined fixation frequency. When using video cameras, the required set of images is extracted from the video sequence.
The resulting images are processed using the YOLO11 detection model, which identifies tomatoes within them. This allows for the calculation of the number of fruits, and if necessary, this quantity can be converted into estimates of the expected volume and weight of the crop. However, counting difficulties arise due to the high density of cultivation. In the images, some bushes and fruits may belong to adjacent rows and, therefore, should not be counted from the current camera position.
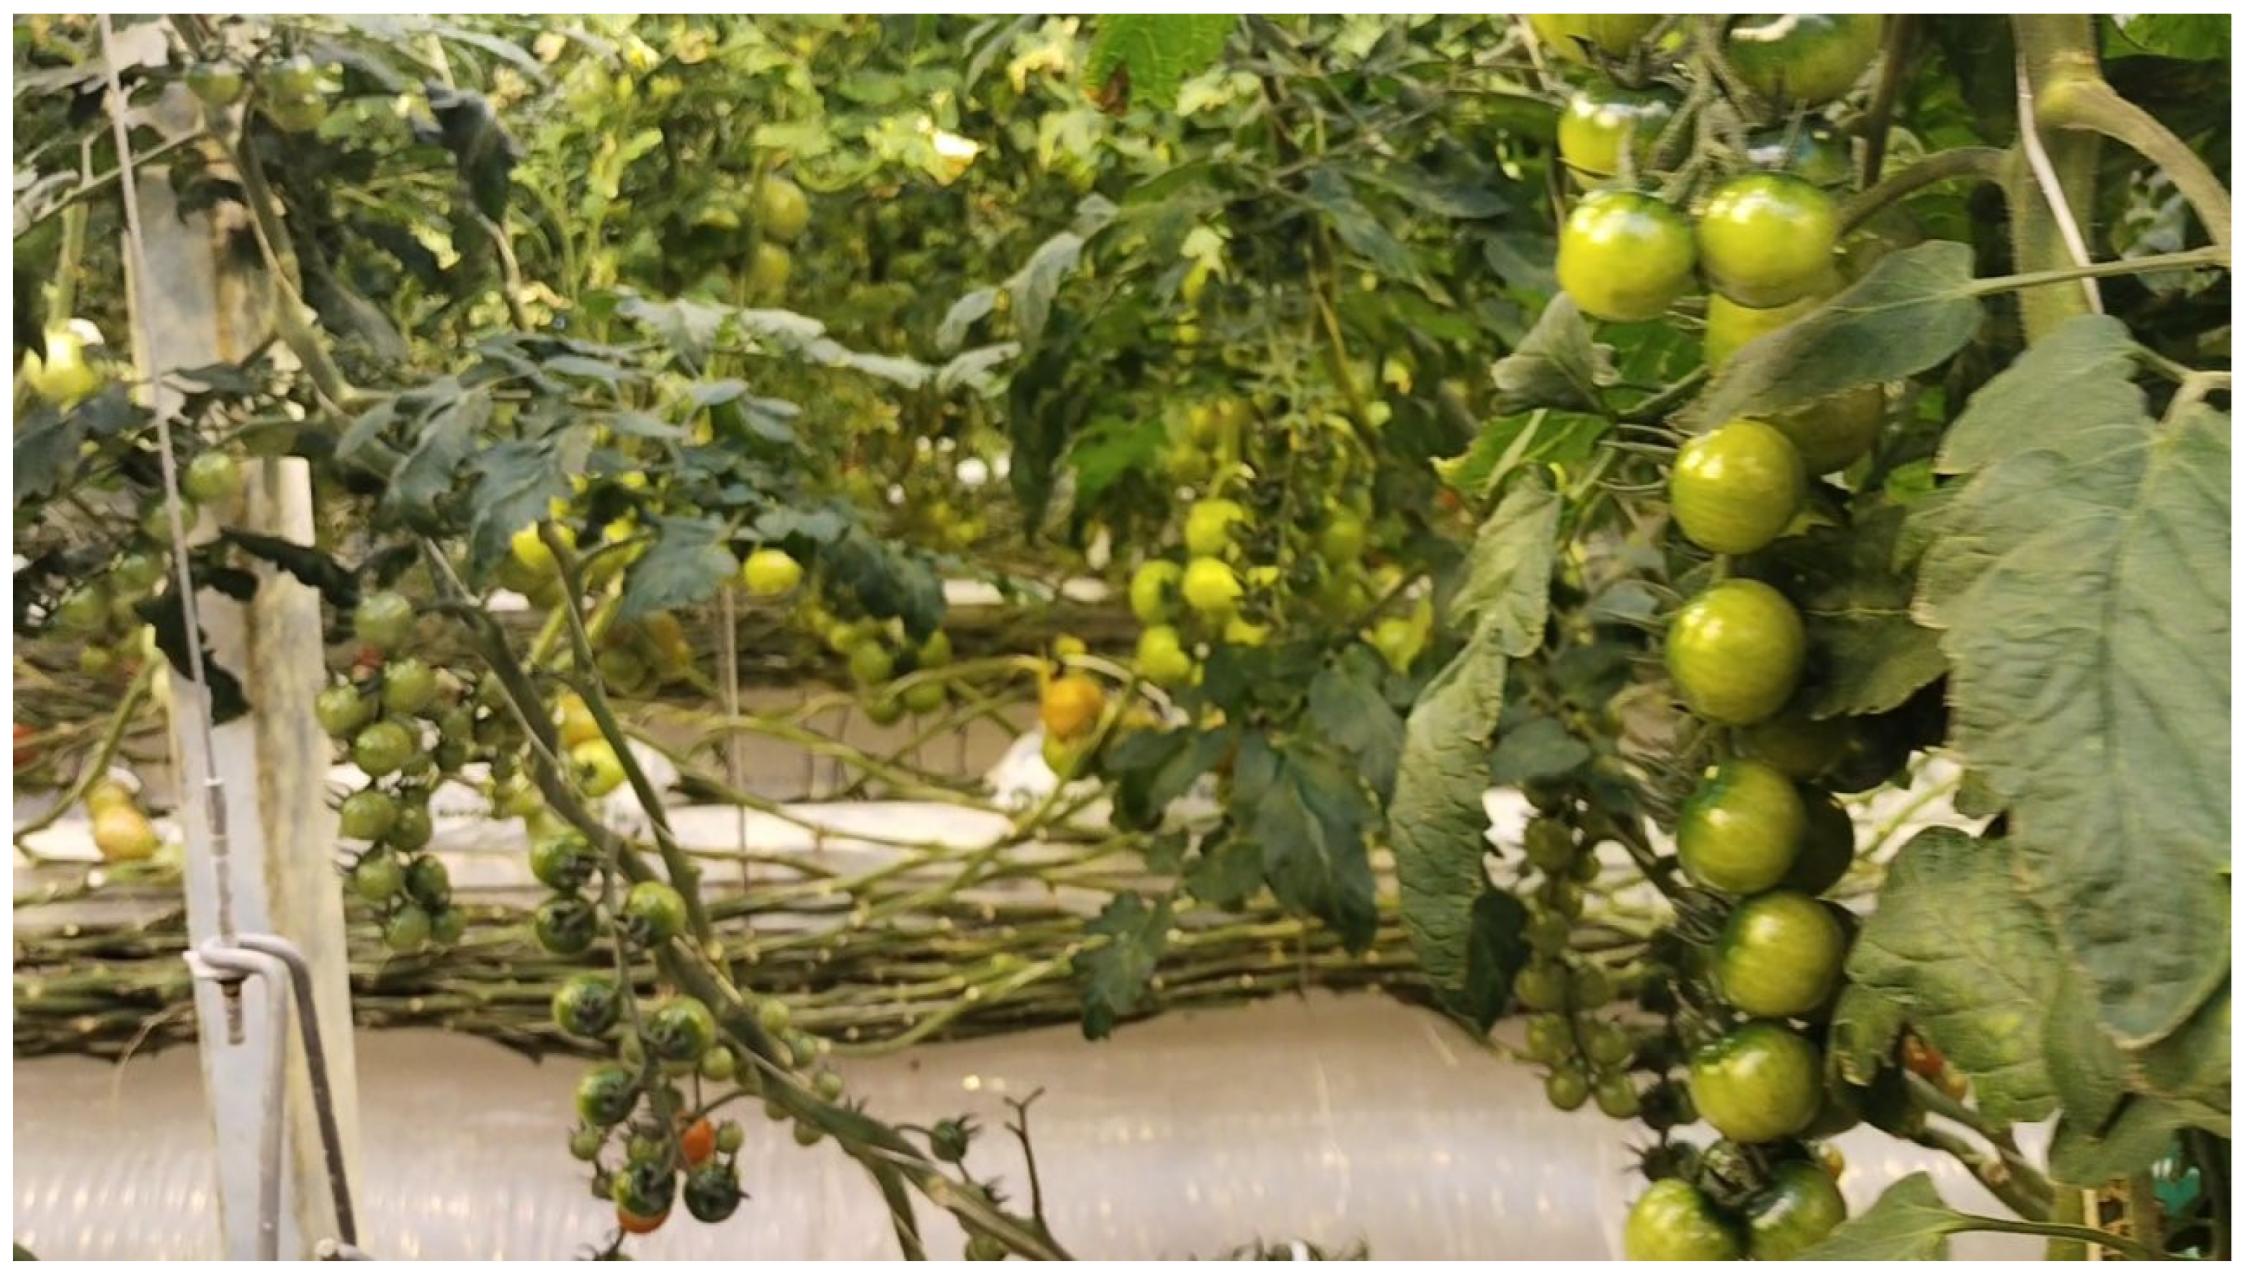
As a result, a simple count of all the tomatoes detected in the image would lead to significant errors. This situation is illustrated by an image of tomato bushes obtained during such video shooting from a mobile platform (
Figure 3).
To avoid counting errors, it is essential to filter the detected tomatoes, ensuring that only those related to the current row are counted.
A hardware implementation approach can address this issue. For instance, in [
23], 4 Intel RealSense D435 cameras were utilized for detection, mounted on an autonomous robot that navigates through the greenhouse along the heating pipes. For each detected tomato, the authors performed post-processing using depth images. Fruits are classified as belonging to the foreground if their median depth value exceeds a predefined threshold. Another study [
24] employed the autonomous robot IRIS! scout, which moves through the greenhouse and is controlled by RFID tags for precise positioning. However, this hardware approach necessitates specialized and expensive equipment. In contrast, our method filters the detected tomatoes without relying on specialized technical means, using only a mathematical method and a computational algorithm.
To solve the aforementioned problem, we applied the k-means clustering method, which divides the set of detected tomatoes into two clusters: foreground (the area of interest related to the current row) and background (objects not involved in counting). Examples of clustering methods used to address computer vision problems in the agricultural industry can be found in studies such as [
12,
25,
26,
27]. For instance, a study by South China University of Technology [
26] utilized k-means in conjunction with a threshold segmentation algorithm and morphological operations to identify the removal points of tomato brushes. In [
12], the k-means method was employed to separate training datasets, allowing for more accurate tuning of the YOLO detection model. In our study, this method is used to automatically divide the data into two groups, representing the coordinates of the bounding boxes for the detected tomatoes. We assume that objects located in the front row are closer than those in the background. Consequently, tomatoes in the target row (front row) have an average larger dimension compared to fruits located in more distant rows of cultivation.
A packet of images obtained after processing the video sequence from the surveillance camera is sent to the input of the counting algorithm. First, the YOLO model determines the coordinates of all tomatoes in the image. Next, the algorithm begins to form a subset of front detections, which includes those tomatoes that will be counted. To achieve this, the entire set of detected tomatoes is divided into two clusters based on the average dimension of the detected bounding boxes, resulting in a subset of front detections that will participate in the final count.
The following Algorithm 1 shows the pseudo-code for counting the number of tomatoes in a clustered image.
| Algorithm 1. Front Tomato Counting Algorithm |
Input: model path, video path, num frames
Output: counts (list of front tomato counts per frame)
Load YOLO model from model path
Open video from video path
total frames ← total number of frames in video
step ← max(total frames/num frames, 1)
counts ← empty list
for frame index = 0 to total frames step do
Read frame
detections ← YOLO detect on frame
front detections ← empty list
remaining ← empty list
for all detection in detections do
width, position ← detection attributes
if width ≥ edge threshold and position near edge then
Add detection to front detections
else if width ≥ centre threshold and position near centre then
Add detection to front detections
else
Add detection to remaining
if length(remaining) ≥ 2 then
Cluster remaining widths (k-means, 2 clusters)
Select cluster with larger average width
if average width ≥ min cluster width then
Add cluster detections to front detections
Append length(front detections) to counts
if length(counts) ≥ num frames then
break
Release video resources
return counts |
To increase the accuracy of calculations, a heuristic filtering rule based on geometric dimensions is applied before clustering. According to this rule, the initial filling of the set of front detections is performed by those objects that are located on the edges of the image and have the largest width and height of the bounding box.
The set of well-known metrics was used to evaluate the accuracy of the counting algorithm [
9]:
Mean Absolute Error (MAE) and Root Mean Squared Error (RMSE)—These allow controlling the absolute error and comparing it with a set threshold, exceeding which may be critical for applying the results of the model. For example, you can set a threshold of 10 tomatoes per image, exceeding which will be unacceptable for applying the calculation results.
Mean Absolute Percentage Error (MAPE)—This allows for the control of the relative accuracy of the model by expressing the error as a percentage. The metric makes it possible to estimate the overall accuracy of the model regardless of the number of objects in the image.
Coefficient of determination R2—This characterizes the ability of the model to explain the variability of the data. It varies in the range from 0 to 1, where a value close to 1 indicates that the model is fully suitable for the available data. If its value is less than 0.5, then the calculation results may be random or related to unknown factors.
The metrics obtained on the test dataset are listed in the Results Section.
3. Results
In this section, we describe the datasets used and present the results of applying the proposed approach (
Figure 2) using the example of greenhouse farming in Western Siberia.
3.1. Datasets
In the pre-trained model (block 1 of
Figure 2), we used Yolo11n. At the Domain-Task Adaptation stage (block 2 of
Figure 2), we utilized a dataset from Kaggle [
22] (block B of
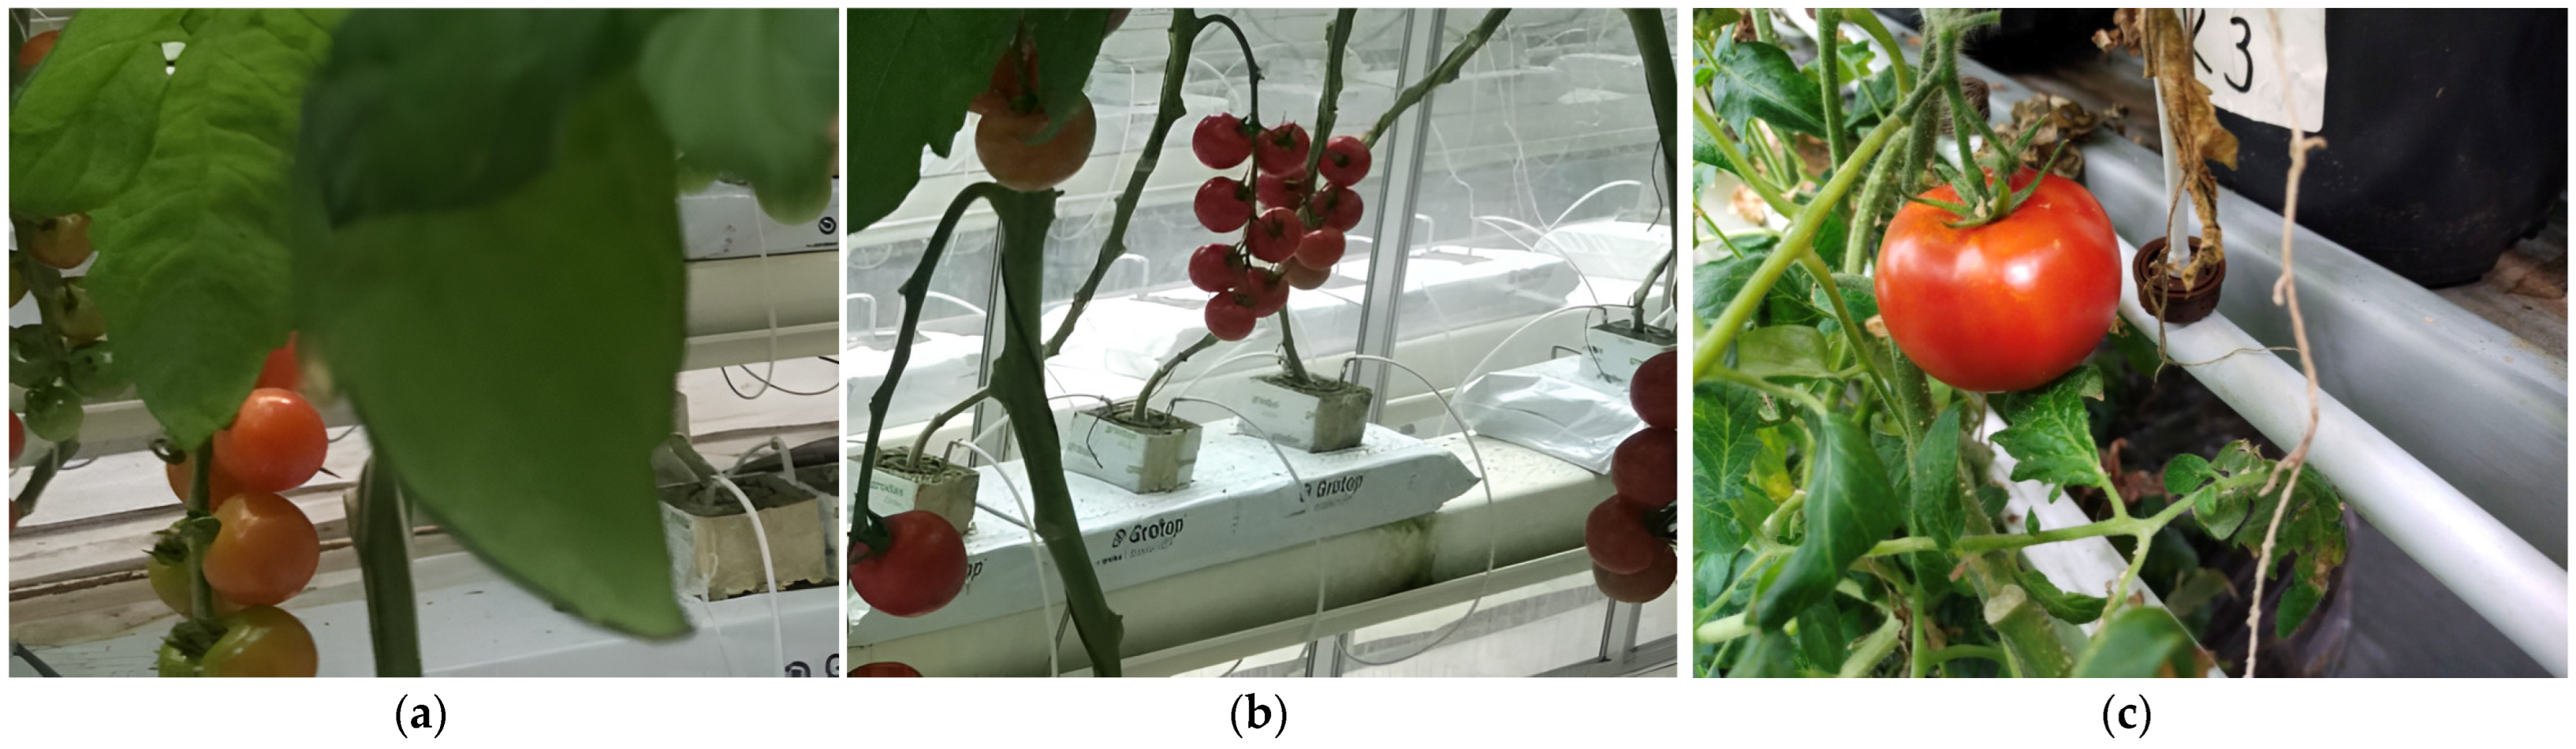
Figure 2). We selected a dataset that contains a relatively small number of 895 annotated images of tomatoes. To increase diversity, this set was supplemented with our own photographs of bushes with fruits at different levels of ripeness. These photos were taken at the agro-biotechnical complex of Tyumen University. The total size of the obtained dataset amounted to 1300 images. Examples of tomato images from a specialized dataset are shown in
Figure 4. Training on this dataset allowed us to adapt the pre-trained Yolo11n model to the task of tomato detection.
The resulting model was then ready for further narrow specialization for implementation in agricultural enterprises, where the images of tomatoes grown could differ significantly from both the images of a specialized dataset and from each other.
Among the main factors that give rise to such differences are the place of cultivation (for example, modular structures on urban farms or rows of plants in greenhouses), the height of bushes, the degree of density and number of fruits in one image, their size, the presence of other objects in the image, etc. In addition, it should be taken into account how the plants will be monitored, in particular, at what height and at what viewing angle the video or camera will be installed.
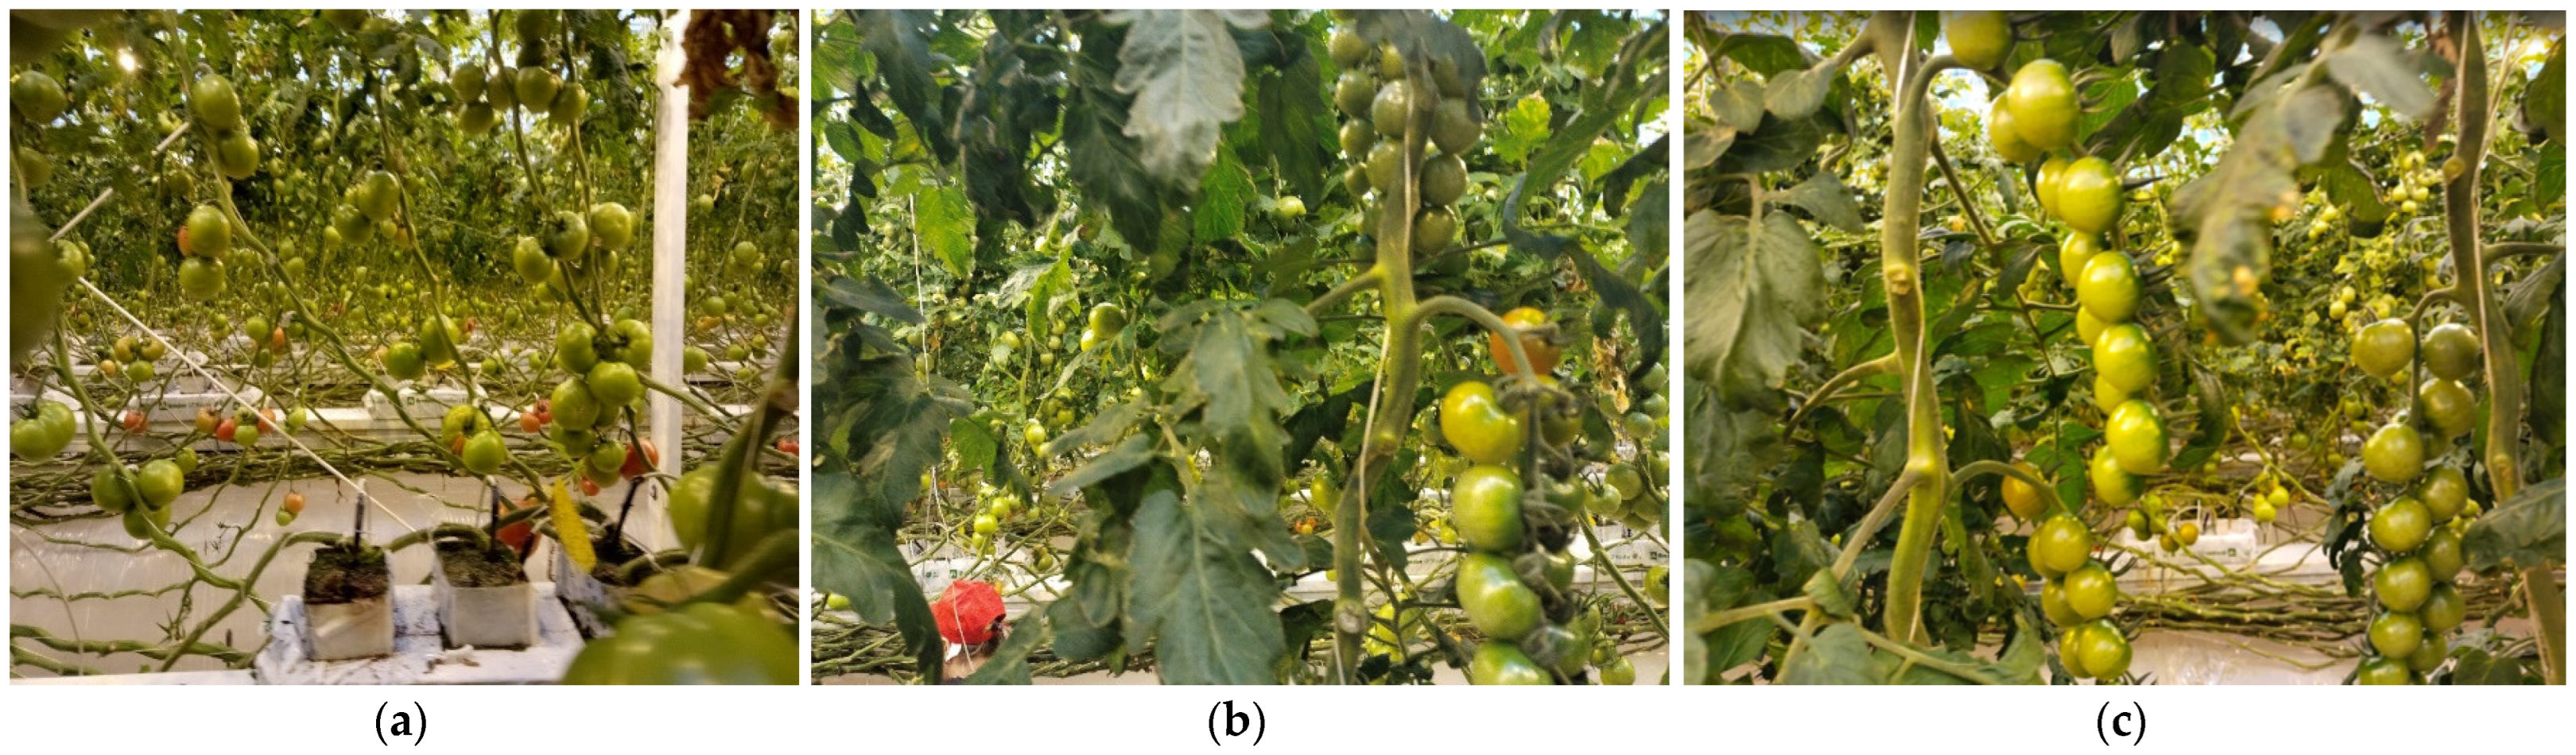
Figure 5 shows examples of images of cultivated tomatoes that were obtained in one of the greenhouses in Western Siberia.
It can be seen that the images of tomatoes obtained in real greenhouse conditions have a number of features that affect the complexity of the detection task. The images contain tomatoes of significantly different sizes, including a large number of small objects. In addition, occlusion is common in photographs when tomatoes are partially hidden by leaves, stems or other objects.
This creates additional difficulties, since the model must be able to select target objects, even if they are only partially visible. There is also noise against the background of vegetation, especially among dense leaves and stems, and there is a similarity in the colour characteristics of the background and target objects, especially green tomatoes. Images often contain areas with shadows and bright highlights, which makes it difficult to recognize objects. In addition, the image may contain other objects that are visually similar to the target objects—tomatoes. Another feature was the presence of blurred tomato fruits in the images, which occurs when working with a moving video camera.
From the collected images (
Figure 5), a custom dataset was formed to fine-tune a specialized YOLO model for further implementation at this agricultural enterprise.
In order to reduce labour costs and to fully reflect the existing operating conditions of the neural network model, the images were not processed. The total number of annotated images of the custom training dataset was 500 examples, and the custom testing dataset was 50 examples. The features of these datasets are shown in
Table 2.
3.2. Model Training Results
After fine-tuning the model on the customer’s specialized dataset, the key metrics have improved significantly, demonstrating its enhanced adaptation to the features of client images. Compared to the model trained during the Domain-Task Adaptation stage, the fine-tuned model shows substantial improvements in mAP performance across various intersection thresholds. The most notable increase was observed in the mAP@75 estimate, which rose by +127.6%. This sharp increase at a stricter IoU threshold indicates that fine-tuning enabled the model to achieve high accuracy even under rigorous evaluation criteria, which is crucial for reliable object detection in challenging conditions.
In parallel with the improvement in average accuracy, there was a significant increase in recall (+54.0%), indicating the model’s enhanced ability to identify true objects. At the same time, precision increased by 16.3%, suggesting that the model has become less prone to false positives, although the primary contribution to the improvement came from the enhanced recall. This balance between metrics demonstrates that the model has not only become more sensitive and capable of detecting objects but has also improved its reliability in practical applications.
These results were obtained by testing the models on a test dataset that includes images from the deployment site of the model. To confirm the statistical validity of the fine-tuned model’s accuracy, we conducted k-fold cross-validation (k = 5, 500 images) on a custom dataset. The average results from the cross-validation (mAP@50 = 0.8, Precision = 0.8, Recall = 0.71) closely matched the metrics obtained from the test dataset.
Table 3 shows a comparative assessment of quality metrics on different models obtained when testing models on a test dataset.
The following notation is used in
Table 3: YOLOv11n.pt, a basic pre-trained model; Task-Adaptation.pt, a model that was trained on a specialized dataset; Client-Specific.pt, a model that was fine-tuned on a custom dataset.
3.3. Tomato Counting Results
When evaluating the performance of the tomato counting method in images, comparisons were made between the actual number of tomatoes in the images and the number of tomatoes returned by the algorithm.
Table 4 shows the results of evaluating the tomato counting algorithm with preliminary detection using a customized YOLO model and using the k-means method to determine the set of front detections of counted objects.
The final Mean Absolute Error (MAE = 0.36) and the Mean Absolute Percentage Error (MAPE = 5.60%) indicate that the model is wrong by an average of 0.36 tomatoes or 5.60% of the true amount. This indicates minimal deviations of the predictions from the actual counts, which is an excellent result for the object counting task. The Root Mean Square Error (RMSE = 0.72), which is slightly higher than MAE, indicates the presence of small outliers in the data, but their effect on the overall accuracy of the model is negligible. The coefficient of determination R2 = 0.98 demonstrates that the model explains 98% of the variance of the target variable, confirming the high quality of the approximation.
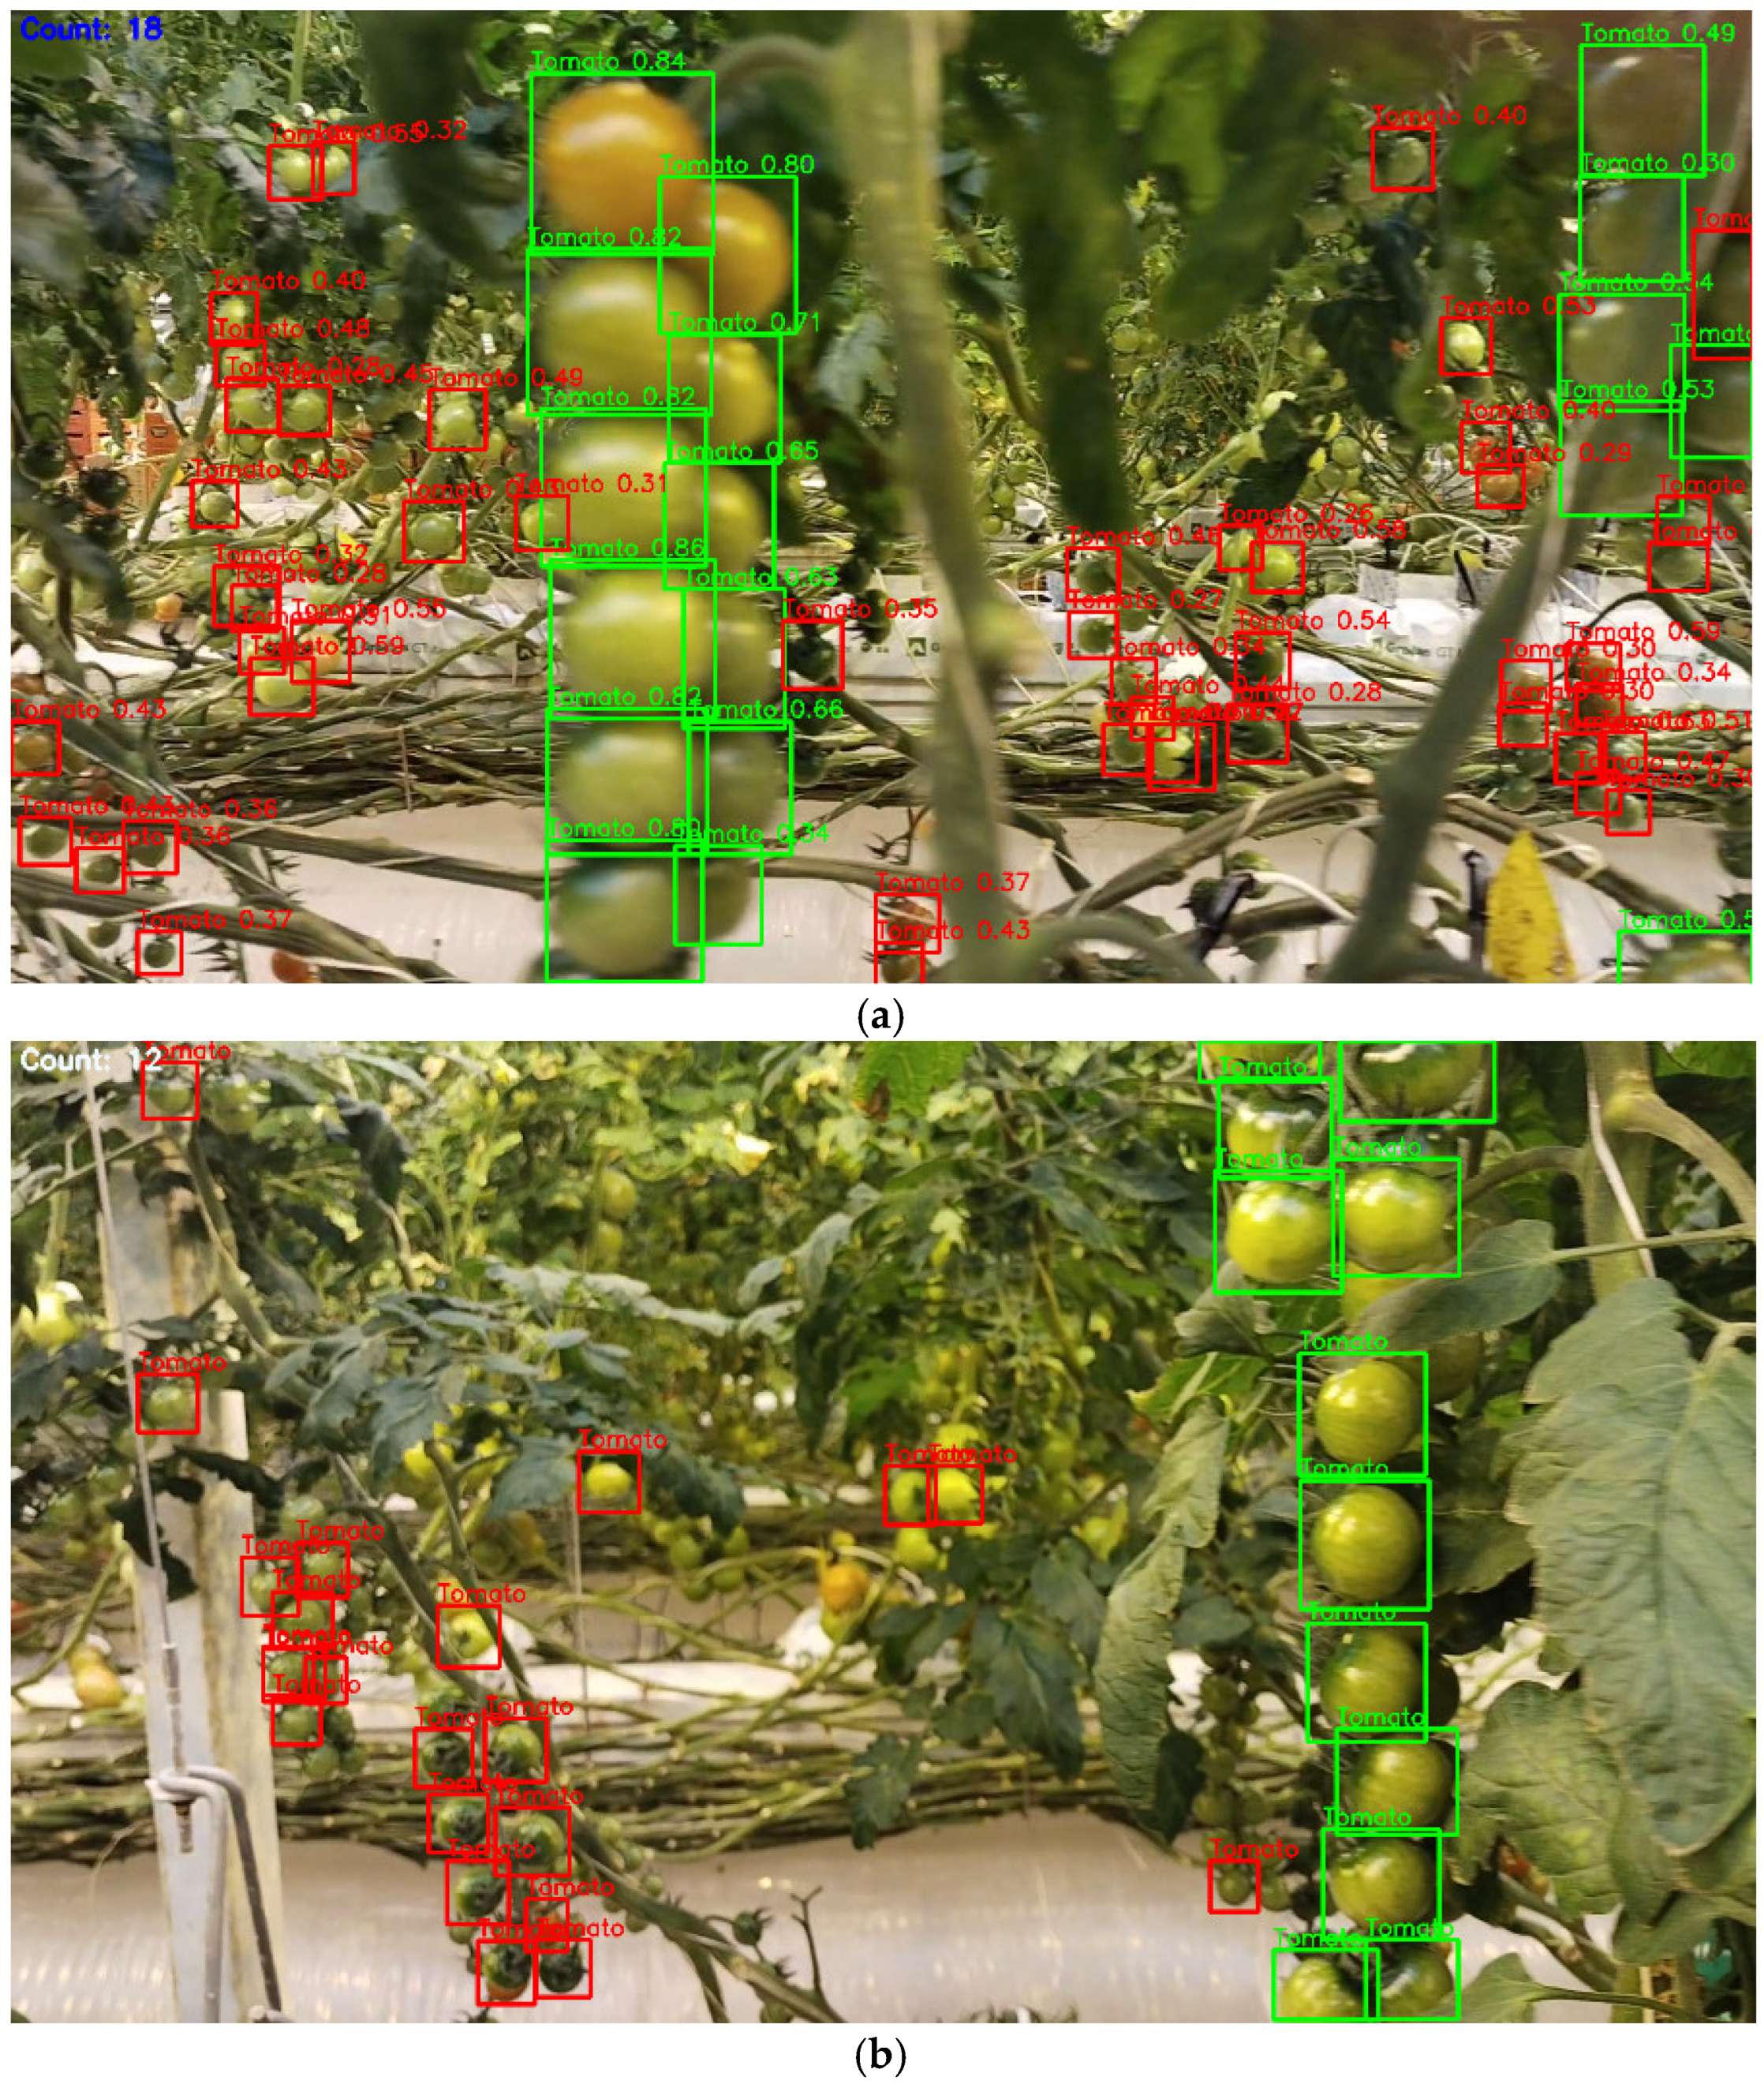
In
Figure 6, examples of images with tomato counting results are provided. Here, the green colour highlights the tomato bounding boxes that the model takes into account when calculating the volume of products grown, and the red colour highlights the tomatoes that the model attributed to the objects in the back rows.
To assess the feasibility of implementation, an analysis of the tomato counting function was conducted, taking into account the filtering of frontal row tomatoes.
Table 5 presents the output speed and execution time metrics on both the graphics and central processors. The detection model is in .pt format.
4. Discussion
The results obtained confirm the effectiveness of the proposed approach for both detecting tomatoes in images and performing the user’s final task, which involves using the detection results to calculate and promptly evaluate the tomato harvest in a greenhouse. The estimated metrics, such as mAP@50 (greater than 0.83) and others, are comparable to the results achieved by other authors on models designed for detecting tomatoes or their diseases [
10,
27,
28]. It is important to note that these results were obtained during model evaluation, not training, on a test dataset created specifically at the site where the model will be deployed.
The accuracy in solving the final problem of counting tomatoes was verified by comparing the algorithm’s calculations with the actual number of tomatoes selected during image analysis and accounting for. The achieved metric values, including MAPE = 5.6% and R
2 = 0.98, indicate high accuracy and the suitability of the trained model and algorithm for rapid assessment of production volumes under the observed greenhouse conditions [
8,
11].
Additionally, we utilized the lightest YOLO11n model, which has the fewest parameters for detection. Generally, using larger models (such as YOLO11s, -m, -l or -x) significantly improves quality metrics for object detection [
20].
The study utilized a ready-made boxed solution, achieving the desired accuracy results without any modifications to the YOLO11 model. On one hand, this opens up possibilities for further improvement through architectural enhancements. On the other hand, using a pre-trained model allows for quicker practical implementation and replication. In recent years, the YOLO family of models has undergone frequent updates [
13], with most of these updates included in the Ultralytics library, providing ready-made solutions for developers. The new models incorporate modifications that have proven effective in studies conducted by various authors, particularly methods and attention blocks. It can be assumed that conducting independent research to modernize YOLO models for increased accuracy may be labour-intensive for practicing engineers. If such a need arises, it is much easier and faster to collect data at a new integration site and fine-tune the model.
It can be argued that the proposed deep learning method, which includes Domain-Task Adaptation and Client-Specific Fine-Tuning of the YOLO model, represents a significant step toward the practical implementation of computer vision in the production processes of agricultural enterprises. This assertion is supported by several considerations. Utilizing this method in a company that implements computer vision allows for the creation of a repository of models adapted to solve specific tasks, such as product counting, disease detection and quality assessment. To address the user’s applied tasks in the greenhouse, these models are customized, or fine-tuned, using customer data, which often involves small training datasets. In our experiments, the customized dataset included 500 annotated images, which is two to three times smaller than the datasets typically used for training computer vision systems in similar tasks.
Fine-tuning enables us to avoid changing the model’s architecture. We use a ready-made model from Ultralytics without altering its architecture, which would require new research. At the same time, the model is trained to account for the specific features of the images and the operating conditions in the greenhouse, ensuring high validity. Having a repository of adapted models allows an implementing company to quickly create its own pipelines for solving multi-step tasks, such as crop counting. The algorithm described in
Section 2 can be further developed and supplemented with models for classifying fruits, assessing the quality of grown products and incorporating decision support modules [
29].
The proposed approach can significantly accelerate the implementation of computer vision in various agricultural enterprises, reducing both the cost and complexity of implementation. Consequently, this will positively impact the overall cost for the end customer.
5. Conclusions
Computer vision technologies open up new opportunities for improving the operations of agricultural enterprises, farms and greenhouses. In addition to the well-known tasks of detecting plant diseases, the operational evaluation of production volumes is becoming increasingly important. This evaluation helps optimize the production processes of agricultural enterprises. For instance, the widely cultivated tomato requires careful monitoring and timely planning for harvesting and packaging, as well as organizing supplies to consumers.
The large-scale implementation of computer vision systems in greenhouses is feasible with approaches and technologies that reduce the cost, time and complexity of implementation, particularly in creating training data and preparing neural network models. However, using publicly available computer vision models pre-trained on universal datasets, such as YOLO, often does not provide the necessary accuracy for applied tasks. Creating datasets for further training of models and preparing these models is a complex process. It requires high qualifications, significant time and effort, especially when developing methods to calculate production volumes while considering the specificities of greenhouse cultivation. This study proposes an approach aimed at addressing this issue. The primary contributions of this work are outlined below.
A method for sequential training on detection models was developed, which includes the Domain-Task Adaptation stage and the Client-Specific Fine-Tuning stage. During domain adaptation, the model is trained on a large, likely public, specialized dataset that is tailored to solve a specific task or set of tasks, particularly the detection of tomatoes. At the fine-tuning stage, a small custom dataset is created, containing images obtained directly from the future operational site of the model. This allows for a more accurate consideration of all the features of the images, growing conditions, plant appearances and other specifics. As a result, the lightweight YOLO11n model achieves high validation accuracy for tomato detection (mAP50 > 0.83, Precision > 0.75, Recall > 0.73), while also reducing the requirements for computing resources needed for training and operating the model. Thus, based on a single specialized model, customized models can be prepared quickly and with minimal effort for implementation in different greenhouses and farms.
A custom training and test dataset was developed for counting tomatoes grown in a greenhouse. Unlike publicly available datasets, which often feature images taken in laboratory settings, the created datasets reflect the real specifics of growing tomatoes in a greenhouse, including dense and tall vegetation, occlusions and the presence of significantly different-sized and small-scale objects. These datasets can be used to train and validate YOLO models for detecting tomatoes grown in similar greenhouse environments.
An algorithm for counting tomatoes based on a detection model was developed, which operates with video frames obtained during the monitoring of plants. This algorithm can identify tomatoes located in the front row of plants in the greenhouse and only count those, making it suitable for organizing video surveillance from a mobile platform that moves between rows of cultivated plants.
To further develop this approach, we plan to create new pipelines where the detection results will be utilized to address other applied problems, such as detecting and accounting for illiquid products, classifying tomatoes by ripeness and identifying fruit diseases.


