Abstract
Cross-border e-commerce (CBEC) is rapidly growing as a global trade engine. Simultaneously, its rapid expansion also poses environmental challenges and worsens supply chain sustainability. Advanced information technology (IT) significantly enhances supply chain visibility and promotes cooperation, thereby improving the efficiency and sustainability of CBEC supply chains. However, the application of IT is accompanied by an increase in service costs, necessitating a comprehensive balance for enterprises. This paper constructs a CBEC supply chain consisting of an overseas supplier and two merchants, where one merchant adopts advanced IT to provide differentiated services. A game-theoretic model is employed to analyze the IT application decisions under price and service competition in supply chain members’ cooperative and non-cooperative scenarios. The results indicate that service differentiation generated by advanced IT is influenced by consumer preferences. Merely applying advanced IT may not necessarily improve competitiveness and efficiency, and may even lead to negative utility. When the products sold are similar and the service cost coefficient is constant, those who apply advanced IT to provide higher service levels can gain competitive advantages and obtain more profits. When the service differentiation between merchants is constant, CBEC supply chains implementing centralized strategies can achieve greater profits.
1. Introduction
The global cross-border e-commerce (CBEC) market has exhibited a significant growth trend in recent years, emerging as a transformative force in international trade. According to a report by Market Data Forecast, the global CBEC market is projected to reach USD 344.116 billion in 2024 and is anticipated to grow at a compound annual growth rate (CAGR) of 21.6% between 2024 and 2032, ultimately reaching USD 1645.029 billion by the end of 2032 [1]. CBEC has emerged as a new engine driving the growth of global trade. It has facilitated the growth of imports and exports by providing businesses with a platform to reach millions of potential customers worldwide. In 2024, China’s foreign trade achieved a new peak in total value. CBEC imports and exports reached a record-breaking CNY 2.63 trillion, marking an increase of CNY 1 trillion from 2020, accounting for nearly six percent of the total foreign trade [2].
CBEC offers numerous benefits to both businesses and consumers. One of the most significant advantages is its ability to overcome geographical constraints, thereby lowering search and transaction costs, making it easier to source products and materials from different parts of the world, enhancing the quality of exported products [3]. This is particularly evident in the way it has enabled businesses to reach a global audience with minimal investment. This global reach not only increases revenue potential, but also provides businesses with the opportunity to diversify their markets, thereby reducing dependency on any single market and enhancing overall stability. For example, Chinese manufacturers have been particularly adept at using CBEC channels to expand their international footprint and build new brands. This has not only improved their competitiveness globally, but also contributed to the upgrading of the entire industrial chain, from design and development to production, warehousing, and logistics [4]. For consumers, CBEC offers competitive pricing and personalized experiences. Platforms utilize AI-driven recommendations to enhance customer satisfaction, while machine learning is employed to reduce search costs. These innovations improve accessibility to global products, fostering consumer loyalty and market diversification [5].
Concurrently, the rapid expansion of CBEC has introduced unprecedented environmental challenges, exacerbating unsustainable practices across global supply chains, particularly in terms of carbon emissions and resource consumption. Logistics and transportation constitute the primary source of CBEC-related emissions, contributing 65–70% of total sectoral emissions [6]. This emissions–growth correlation underscores the environmental cost of unregulated market expansion, which is further complicated by competitive dynamics in delivery time guarantees and logistics strategies [7]. These impacts are amplified by market dynamics: consumer preference for expedited shipping increases carbon-intensive air freight utilization by 18–25%, while price competition discourages green technology adoption [8].
In this context, there is an urgent need for innovative solutions that simultaneously address escalating consumer demands, optimize the operational efficiency of cross-border supply chains, and achieve enhanced sustainability through reduced carbon intensity. Emerging advanced information technologies (IT) have demonstrated transformative potential in fulfilling these dual imperatives. These technologies offer new opportunities for optimizing supply chain operations, improving resource allocation and reducing the environmental footprint of business activities. Technological and strategic interventions demonstrate the potential to mitigate carbon emissions. For example, logistics optimization through AI route planning reduces emissions by 12–15% [9].
This rapid expansion of CBEC is not only a reflection of the growing preference among consumers and businesses for the convenience and efficiency that CBEC offers, but is also a testament to the increasing adoption of information technologies [10].
2. Literature Review
CBEC has not only facilitated the increase in market entities, but has also promoted the digital transformation and innovation of supply chains [11].
The Resource-Based View (RBV) offers a robust theoretical foundation for analyzing the strategic role of advanced IT in enhancing CBEC supply chain sustainability. The RBV posits that firms can achieve competitive advantages by leveraging their unique and valuable resources [12]. In the context of CBEC, advanced IT serves as a strategic resource that is valuable, rare, inimitable, and non-substitutable (VRIN). By adopting IT, firms can enhance supply chain visibility, improve coordination, reduce costs, and create a sustainable competitive edge in the market. Numerous studies have indicated that the application of IT in e-commerce and supply chains, such as cloud computing, blockchain, big data, and artificial intelligence, can optimize resource allocation and improve management efficiency [13,14,15]. For instance, blockchain technology can enhance supply chain transparency, reducing fraud and errors [16]. Big data and IoT can optimize logistics and inventory management, ensuring that businesses can meet demand efficiently [17,18]. On the other hand, customer experience will also be enhanced. IT technologies can enhance customer experience by providing personalized recommendations and improving the overall shopping experience. This, in turn, strengthens the market competitiveness of enterprises [17]. By constantly monitoring market changes and collecting consumers’ real-time feedback, businesses can make accurate predictions and adjust their production accordingly [19]. This flexible supply chain model, characterized by small orders and quick responses, minimizes inventory and waste, improves operational efficiency, and reduces costs. As a result, businesses can offer more competitive prices, further enhancing their market position [20]. Thus, IT-enabled service differentiation allows firms to provide unique services that are difficult for competitors to replicate. This differentiation can lead to increased customer loyalty and higher profit margins. This aligns with the RBV’s emphasis on utilizing organizational resources to enhance performance and gain a competitive advantage. Additionally, IT can optimize the utilization of renewable energy and reduce carbon emissions, contributing to the sustainability of global supply chains [21]. For example, blockchain-based traceability systems enhance the reusability of returned goods in CBEC, reducing resource waste and carbon emissions associated with cross-border returns [22]; the advanced analytics can help businesses make more informed decisions about energy use and carbon footprint reduction [23].
However, enterprises need to make significant upfront investments when implementing IT, which may exert pressure on their financial conditions, especially for small- and medium-sized enterprises that may find it difficult to bear these costs due to financial constraints [24,25]. Enterprises are only willing to apply these technologies to improve service quality and increase profits when the adoption costs are relatively low [26,27]. Moreover, this implementation decision is also influenced by consumer acceptance [28,29], as while IT can enhance efficiency and reduce certain transaction costs, these savings are not always fully translated into benefits for consumers. Sometimes, due to additional services and features, the prices paid by consumers may actually increase [30,31]. Guided by utility maximization principles, consumers evaluate purchasing options by comparing the aggregated benefits of goods and services against transaction costs. Purchases occur exclusively when perceived value exceeds monetary and psychological expenditure. Consequently, market demand dynamics become jointly determined by rival enterprises’ pricing structures and service delivery mechanisms. Consumers exhibit varying sensitivities towards the prices paid and the services received, and their preferences subsequently influence the pricing decisions of supply chain members as well as the overall profit levels [32,33]. Consumer preferences increasingly influence sustainable IT adoption. Studies show that consumers are willing to pay a premium for products with verified carbon labels, creating “green service differentiation” opportunities [34]. Profit maximization in dual-competitive markets necessitates strategic equilibrium between pricing and service quality. However, service enhancement initiatives inherently demand substantial operational expenditure. Overcommitment to service excellence during pricing wars risks triggering profit margin erosion through cost overruns. Consequently, business entities must reconcile value generation with cost escalation and weigh the employment of service differentiation when devising competitive strategies.
Most prior research on IT application in e-commerce supply chains predominantly utilized empirical approaches, neglecting the influence of consumer choices on strategic implementation, often overlooking the trade-offs between IT adoption cost and service-driven competitive advantages. In light of this, to achieve the sustainability of CBEC supply chains, it becomes crucial to examine the balance between the cost increases and service enhancements associated with IT application, as well as to explore enterprise IT decision making. In order to overcome these limitations, this study develops a multi-channel game model that takes into account consumer preferences for service quality and price and analyzes optimal strategies across diverse scenarios. The results provide significant insights for businesses, governments, and investors, advancing the practice of supply chain sustainability management.
3. Methods and Modeling
3.1. Methods
This study utilizes game theory to model the strategic decision-making processes of entities within the CBEC supply chain. This approach is particularly suitable for analyzing decision-making processes under different governance structures [30,32,34]. In the centralized decision-making scenario (hereinafter referred to as CD), channel members collaborate to maximize overall supply chain profit. In contrast, the decentralized decision-making scenario (hereinafter referred to as DD) involves a Stackelberg game, where the IT-adopting merchant acts as the leader, leveraging its technological edge to set strategies first, followed by responses from the non-IT-adopting merchant. This framework provides a clear lens through which to observe how decision-making structures influence supply chain strategies and interactions.
Simultaneously, to better understand consumer behavior and its impact on supply chain decisions, we incorporate a consumer utility. This method is instrumental in modeling consumer purchasing decisions by constructing a utility function that incorporates factors such as product valuation, prices, and service levels [28,29,32]. By analyzing this function, we can derive demand functions for different channels and investigate how consumers’ sensitivity to price and service affects market demand and channel selection. This analysis is vital for grasping market responses to supply chain strategies and aids in formulating supply chain decisions that align with consumer expectations.
In the CBEC market, consumers exhibit varying degrees of sensitivity towards price and service. For some consumers, fluctuations in product pricing significantly influence their purchasing decisions, indicating a high level of price sensitivity. Conversely, other consumers place greater emphasis on the quality of the service provided, with changes in service levels having a more pronounced impact on their utility. This divergence in consumer behavior allows us to categorize them into two distinct groups: price-sensitive consumers and service-sensitive consumers. The differences between these groups are evident in how they perceive the value of product pricing and service quality.
Since the same product or service can yield different levels of utility for different consumers, the utility function should incorporate a parameter to represent the consumer type. Additionally, as different products or services can have varying impacts on the same consumer, the utility function should also include a parameter that reflects the degree of differentiation among products and services.
3.2. Modeling
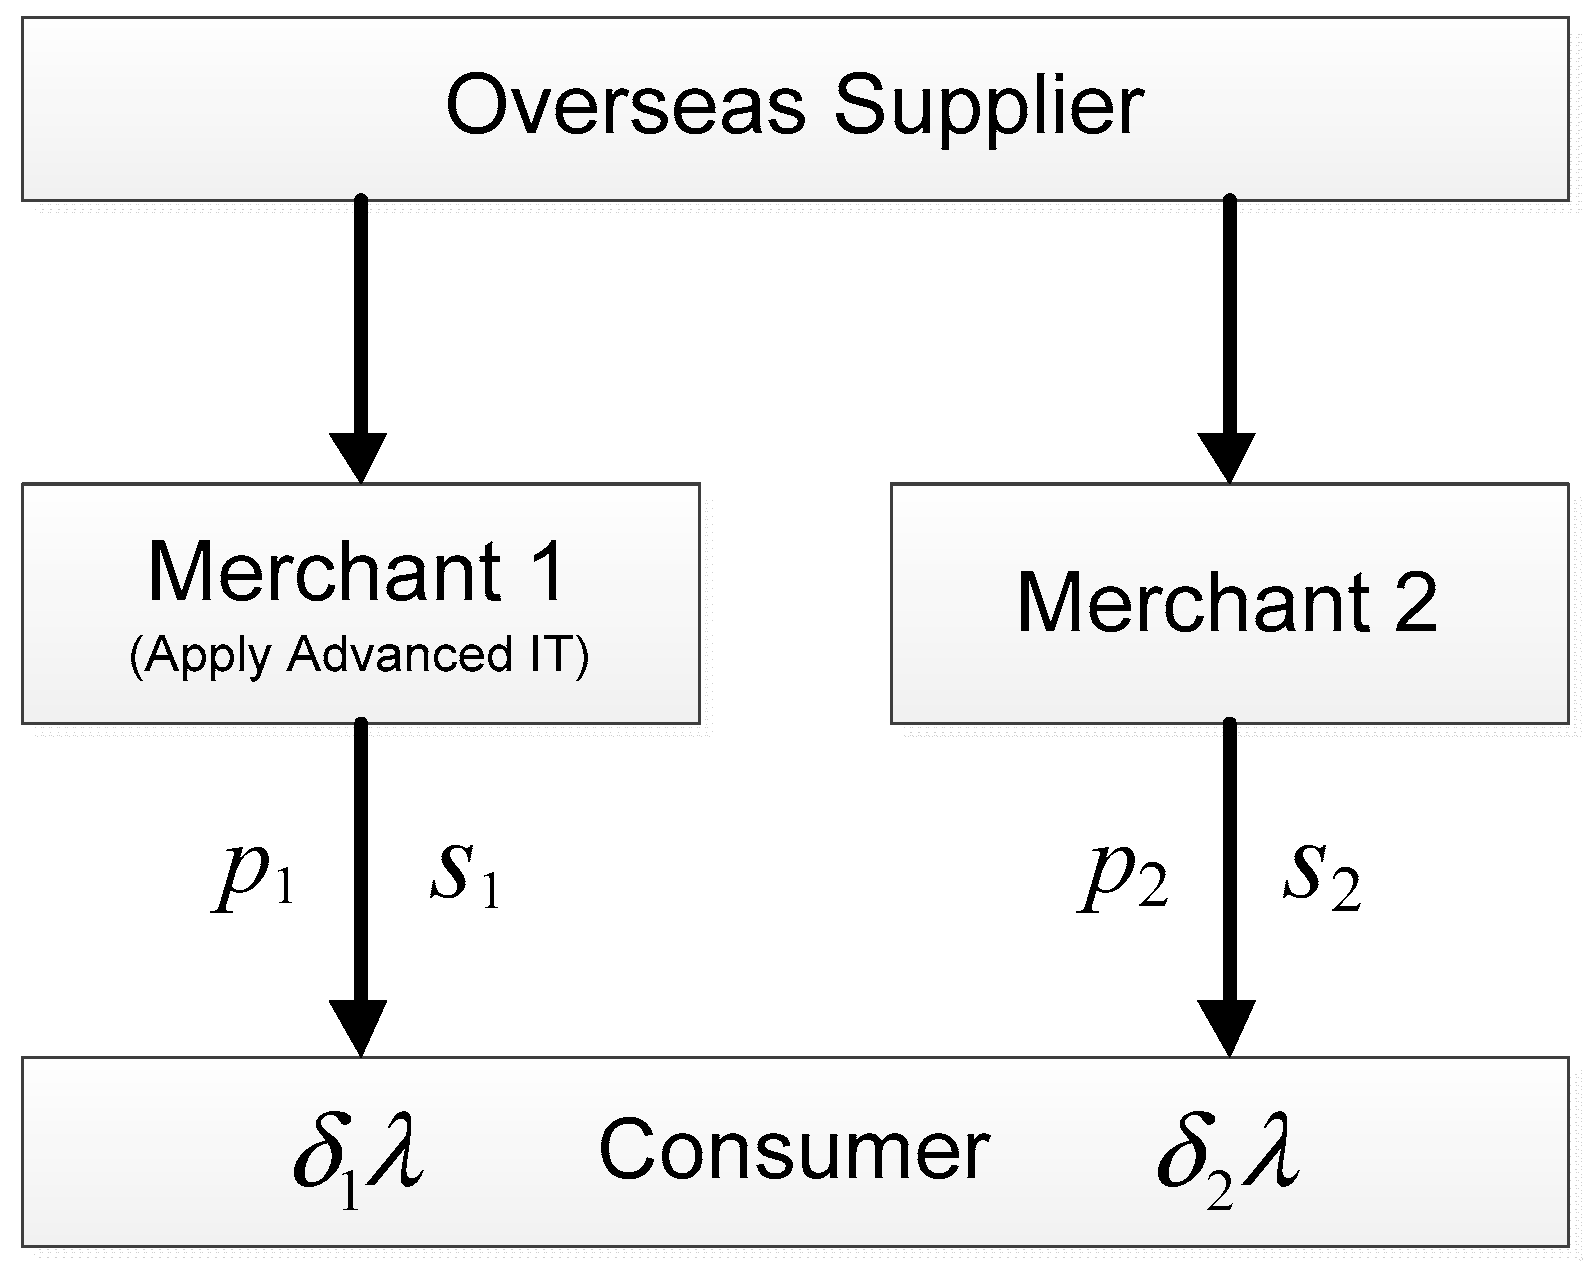
Considering that a dual-channel cross-border supply chain consists of one overseas supplier and two CBEC merchants, one applied advanced IT in the supply chain (hereinafter referred to as Merchant 1), while the other did not (hereinafter referred to as Merchant 2).
The cross-border supply chain model was constructed as below (Figure 1).
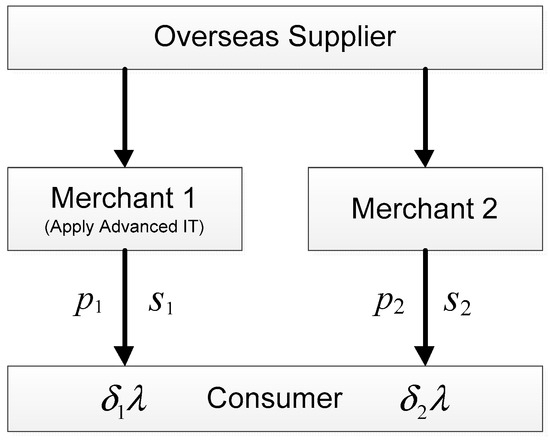
Figure 1.
The structure of the cross-border supply chain.
The parameters in the model are presented as follows (Table 1).

Table 1.
The parameters in the channel model.
To effectively analyze price and service competition, the following assumptions are made:
- The dual-channel products are identical. Specifically, the product from Merchant 1 is the same as that from Merchant 2. This assumption is adopted to focus on the competition in service differentiation rather than product attributes, as the core of this research lies in exploring how IT-enabled service differentiation influences supply chain decisions and performance. By abstracting away product attribute differences, we can more clearly observe the role of service quality in driving consumer choice and merchant competition.
- Consumers are assumed to be rational actors who make purchasing decisions based on utility maximization. This assumption is grounded in the reality of e-commerce environments, where consumers typically have access to ample product and service information. Rational consumer choice provides a solid foundation for formulating demand functions and analyzing market equilibrium. It enables us to model consumer responses to different service and pricing strategies, thereby offering insights into how merchants can optimize their decisions to attract consumers and enhance profitability.
- Without loss of generality, both merchants are assumed to confront unit market demand and only account for service costs, with other costs being zero. This assumption reflects the characteristics of cross-border e-commerce, particularly in scenarios involving digital services and information-based offerings. In such contexts, once the initial setup is complete, the marginal cost of replicating and delivering digital services is negligible. By focusing on service costs, we can isolate the impact of service differentiation on supply chain decisions and profitability, providing a clearer understanding of the strategic value of IT investments in enhancing service quality.
To simplify calculations and better highlight the impact of service differentiation, it is assumed that Merchant 2’s service level equals the industry average. Consumers perceive extra service utility only from Merchant 1’s service differentiation . This study employs game theory grounded in the RBV to model the strategic decision-making processes of entities within the CBEC supply chain. Service differentiation () is operationalized as a VRIN resource. Accordingly, consumer utility from purchasing from the respective merchants can be formulated as follows (the derivation process is provided in Appendix A.1).
The demand functions for Merchant 1 and Merchant 2 can be, respectively, articulated as follows.
The profits of the individual merchants and the overall cross-border supply chain can be, respectively, delineated as follows.
The parameters and equations in this model are designed to quantify the trade-offs faced by CBEC traders when adopting advanced IT. Specifically, (price sensitivity) and (service sensitivity) reflect how consumer behavior directly influences pricing and service strategies. By modeling utility functions and demand scenarios, we capture the equilibrium where traders balance IT-induced service differentiation () against cost increments (). In the context of price and service competition, the scenarios of merchants operating under CD and DD will be analyzed separately in the following sections.
3.3. Centralized Decision in the Supply Chain (CD)
In this scenario, the merchants strive to maximize the overall profit of cross-border supply chain ; they collaborate closely with each other and jointly develop sales strategies. The optimal pricing, the profit, and the optimal service differentiation in CD are as follows (the derivation process is provided in Appendix A.2).
The optimal pricing strategies for the merchants are as follows.
The profit of merchants and the overall cross-border supply chain are as follows.
The optimal service differentiation can be derived as follows.
3.4. Decentralized Decision in the Supply Chain (DD)
In this scenario, merchants base their decisions on the principle of maximizing their own profits, forming a dynamic oligopolistic market game model, specifically, the Stackelberg game. Given that the implementation of advanced IT incurs service improvement and additional costs, and to avoid being at a disadvantage in the price war, Merchant 2 opts to set its prices after Merchant 1. The sequence of the game is as follows: first, Merchant 1 formulates a strategy to maximize its own profit, and then Merchant 2 determines its profit level based on Merchant 1’s pricing. However, Merchant 1 is aware of Merchant 2’s behavior, so Merchant 1 will make its final strategy based on Merchant 2’s reaction function and its own pricing. The inverse deducing method is employed to calculate the optimal solution of the model. The optimal pricing, the profit, and the optimal service differentiation in DD are as follows (the derivation process is provided in Appendix A.3).
The optimal pricing strategies for the merchants are as follows.
The profit of merchants and the overall cross-border supply chain are as follows.
In Equation (8), are represented as follows.
The optimal service differentiation can be determined as follows.
4. Equilibrium Analysis and Inference
4.1. The Impacts on the Service Level
When the products provided by merchants are homogeneous, the difference in service differentiation between CD and DD scenarios can be articulated as follows.
In Equation (11), are represented as follows.
Given that , , , it follows that and . When , ; if the opposite is true, then . Therefore, the service differentiation is influenced by consumer behavior () and operation cost (). This further demonstrates that CBEC merchants should consider these factors comprehensively when formulating their service strategies. Furthermore, by analyzing the impact of various variables on the degree of service level differentiation, the following corollaries can be drawn.
Theorem 1.
The service differentiation
is monotonically related to customer channel preference
in the CD, but is non-monotonically related in DD.
Proof of Theorem 1.
In CD, the first-order derivatives of the with respect to are denoted as follows.
Since , it follows that and . This indicates that the service differentiation is negatively correlated with but positively correlated with .
In DD, the first-order derivatives of the with respect to are denoted as follows.
In Equation (14), are represented as follows.
The positive or negative of depends on . This indicates that the relationship between and is affected by a combination of factors, similar to the relationship between and . QED. □
Theorem 2.
The service differentiation is monotonically related to the consumers’ sensitivity to product price and service level .
Proof of Theorem 2.
The first-order derivatives of and with respect to and are denoted as follows.
Given that and are all greater than 0, it follows that < 0, < 0, , and . This indicates that the service differentiation is negatively correlated with consumers’ price sensitivity and positively correlated with consumers’ service sensitivity . QED. □
Theorem 3.
The service differentiation
is negatively correlated with the service cost coefficient
.
Proof of Theorem 3.
The first-order derivatives of and with respect to are denoted as follows.
Given that > 0 and are all greater than 0, it follows that and . This indicates that the service differentiation decreases as the service cost coefficient increases. QED. □
4.2. The Impacts on the Profit
The comparison of the overall profit of merchants between the CD and DD can be articulated as follows.
Given that and are all greater than 0, it follows that . This indicates that the overall profit of merchants in the CD scenario is greater than in the DD scenario. In other words, when merchants collaborate closely to jointly determine product prices and service levels, it can yield greater benefits for the entire supply chain. A detailed analysis of the impact of various variables on the overall profit leads to the following inference.
Theorem 4.
The overall profit is monotonically related to the consumers’ sensitivity to product price and service level .
Proof of Theorem 4.
The first-order derivatives of and with respect to α and β are denoted as follows.
Since are all greater than 0, it follows that , , , and . This indicates that the overall profit is negatively correlated with consumers’ price sensitivity and positively correlated with consumers’ service sensitivity . QED. □
Theorem 5.
The overall profit is negatively correlated with the service cost coefficient .
Proof of Theorem 5.
The first-order derivatives of and with respect to are denoted as follows.
It can be observed that and . This indicates that the profit of the CBEC supply chain decreases as the service cost coefficient increases. QED. □
Theorem 6.
The overall profit is non-monotonically related to the service differentiation . The relationship between them is influenced by comprehensive factors.
Proof of Theorem 6.
The first-order derivatives of and with respect to are denoted as follows.
In the CD scenario, when , , meaning that is a monotonically increasing function of ; otherwise, it is a monotonically decreasing function. In the DD scenario, when , , meaning that is a monotonically increasing function of ; otherwise, it is a monotonically decreasing function. This demonstrates that the relationship between the overall profits and service differentiation in the cross-border supply chain is influenced by consumer behavior () and operation cost (), regardless of whether it is in the CD or DD scenario. QED. □
5. Numerical Analysis
To visually demonstrate the impact of enterprises applying advanced IT to improve their service differentiation in CBEC supply chains, this section employs specific numerical values for simulation analysis. The parameter ranges () for the numerical analysis of the cross-border channel model are in line with existing numerical studies on dual-channel supply chains [27,28,29,30] and the assumptions of this study (see Section 3.2). Without loss of generality, we posit , , which aligns with real-world observations where consumers exhibit a stronger preference for channels leveraging advanced IT technologies to deliver enhanced services, coupled with heightened price sensitivity. To ensure clarity in visualizing the impact of parameter interactions within constrained graphical space, specific parameters are assigned integer values or simplified intervals for computational tractability.
5.1. The Numerical Analysis Related to the Service Differentiation
5.1.1. Service Differentiation and Consumer Preferences
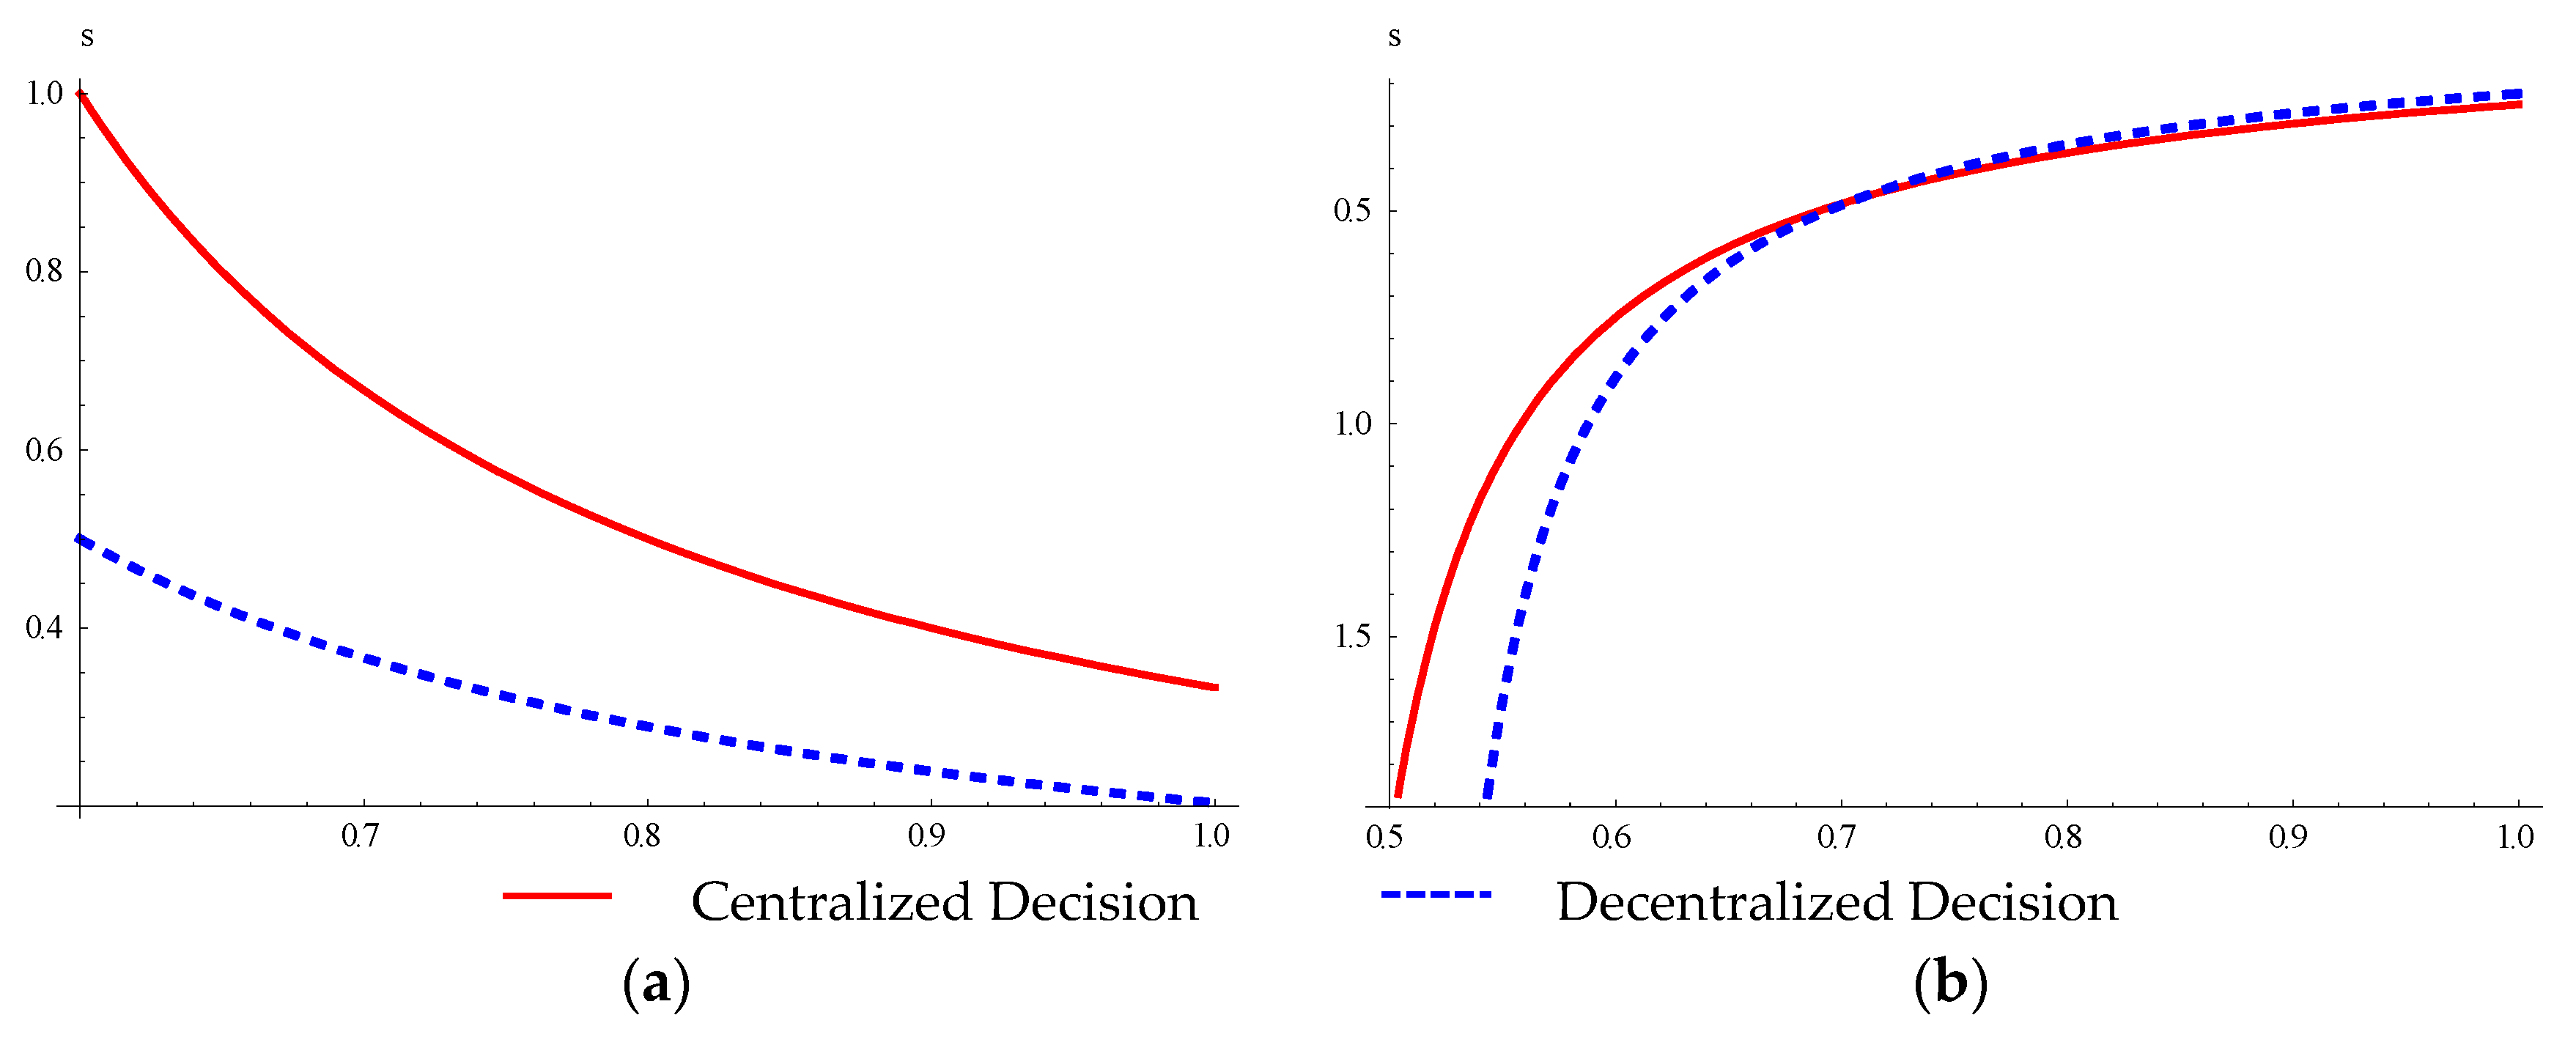
Given that = [0.6, 1], = [0.4, 1], = 0.5, and = 0.4, = 1, the impact of consumer preferences on the service differentiation under centralized and decentralized decision making is depicted in Figure 2.
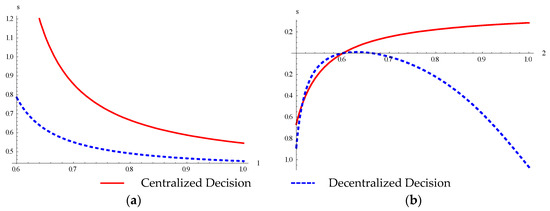
Figure 2.
(a) The relationship between service differentiation and consumer preference in channel 1. (b) The relationship between service differentiation and consumer preference in channel 2.
It can be seen that, in the CD scenario, as customer preferences increase, service differentiation decreases with preference but increases with preference . This indicates that, when consumers prefer to purchase products from Merchant 1, brand loyalty reduces the necessity for IT-driven differentiation; advertising and brand power are crucial for attracting consumers and maintaining their loyalty. In this market, brand reinforcement is prioritized over IT upgrades. However, when consumers prefer Merchant 2, to avoid price wars, Merchant 1 must utilize advanced IT to enhance their service quality for a competitive edge. In such a situation, they should invest in IT to offset weaker brand appeal. In the DD scenario, merchants who do not employ advanced IT technologies attract more customers through advertising or discounts to compensate for the service differences. Nevertheless, there exists a threshold: when excessive resources are allocated to non-technical means, the differences brought by technology become increasingly pronounced, which may ultimately fail to meet customer needs.
5.1.2. Service Differentiation and Consumers’ Sensitivity
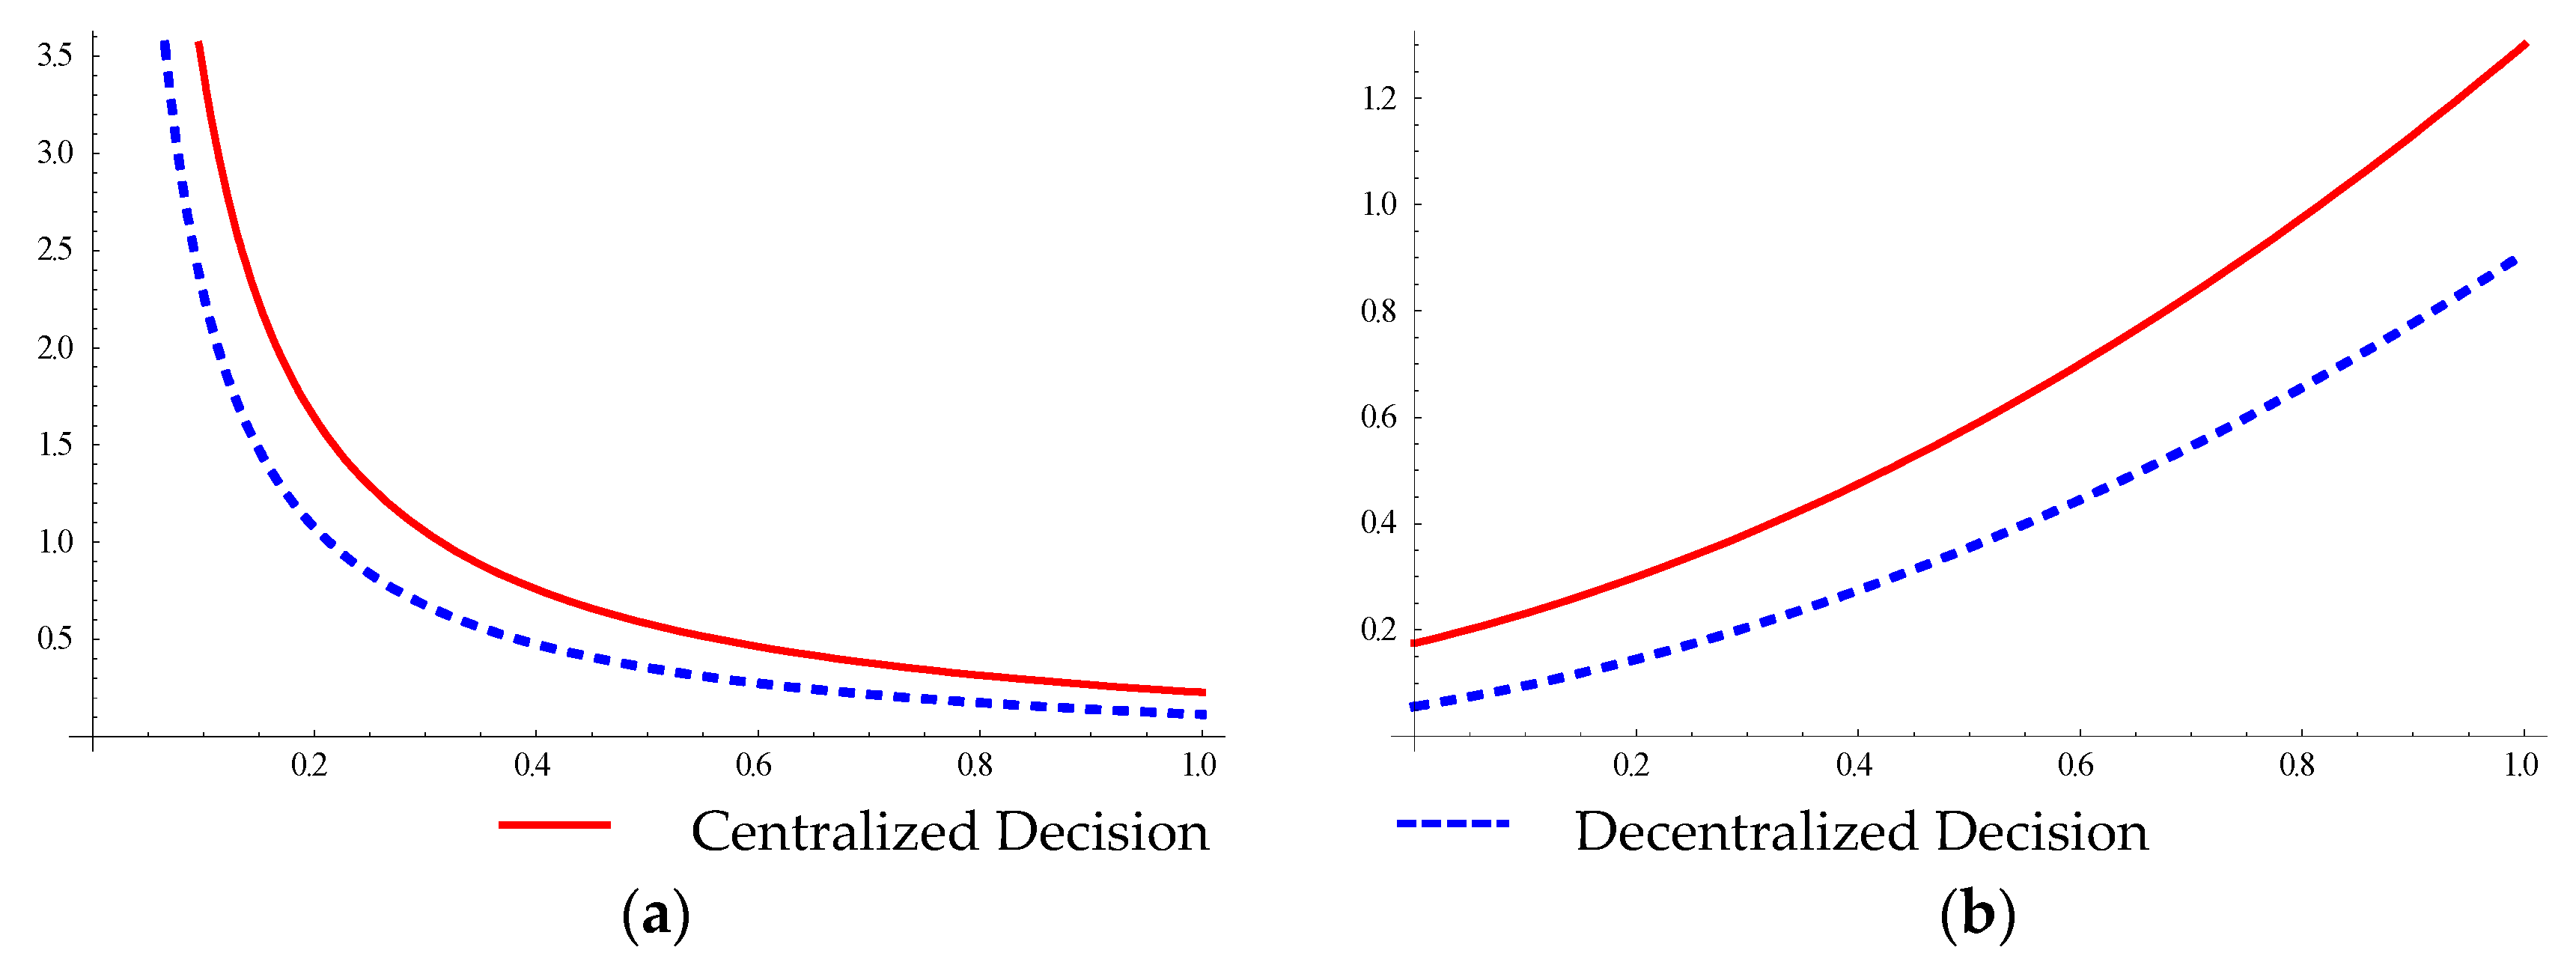
Given that = 0.6, = 0.4, = [0.5, 1], = [0.4, 1], and = 1, the impact of consumers’ sensitivity to the service differentiation under centralized and decentralized decision making is depicted in Figure 3.

Figure 3.
(a) The relationship between service differentiation and consumer’s price sensitivity. (b) The relationship between service differentiation and consumer’s service sensitivity.
It can be observed that, under any strategy, the service differentiation decreases as customers’ price sensitivity increases and increases as customers’ service sensitivity increases. When consumers become more sensitive to product prices, they are attracted to lower prices, making service differentiation less critical for merchants, who then tend to adopt low price competition strategies to attract more consumers. On the contrary, when service sensitivity rises, consumers pay more attention to the utility of services. Enhanced service levels through advanced IT can attract more consumers, which is an effective way for CBEC to avoid price competition.
5.1.3. Service Differentiation and Service Cost Coefficient
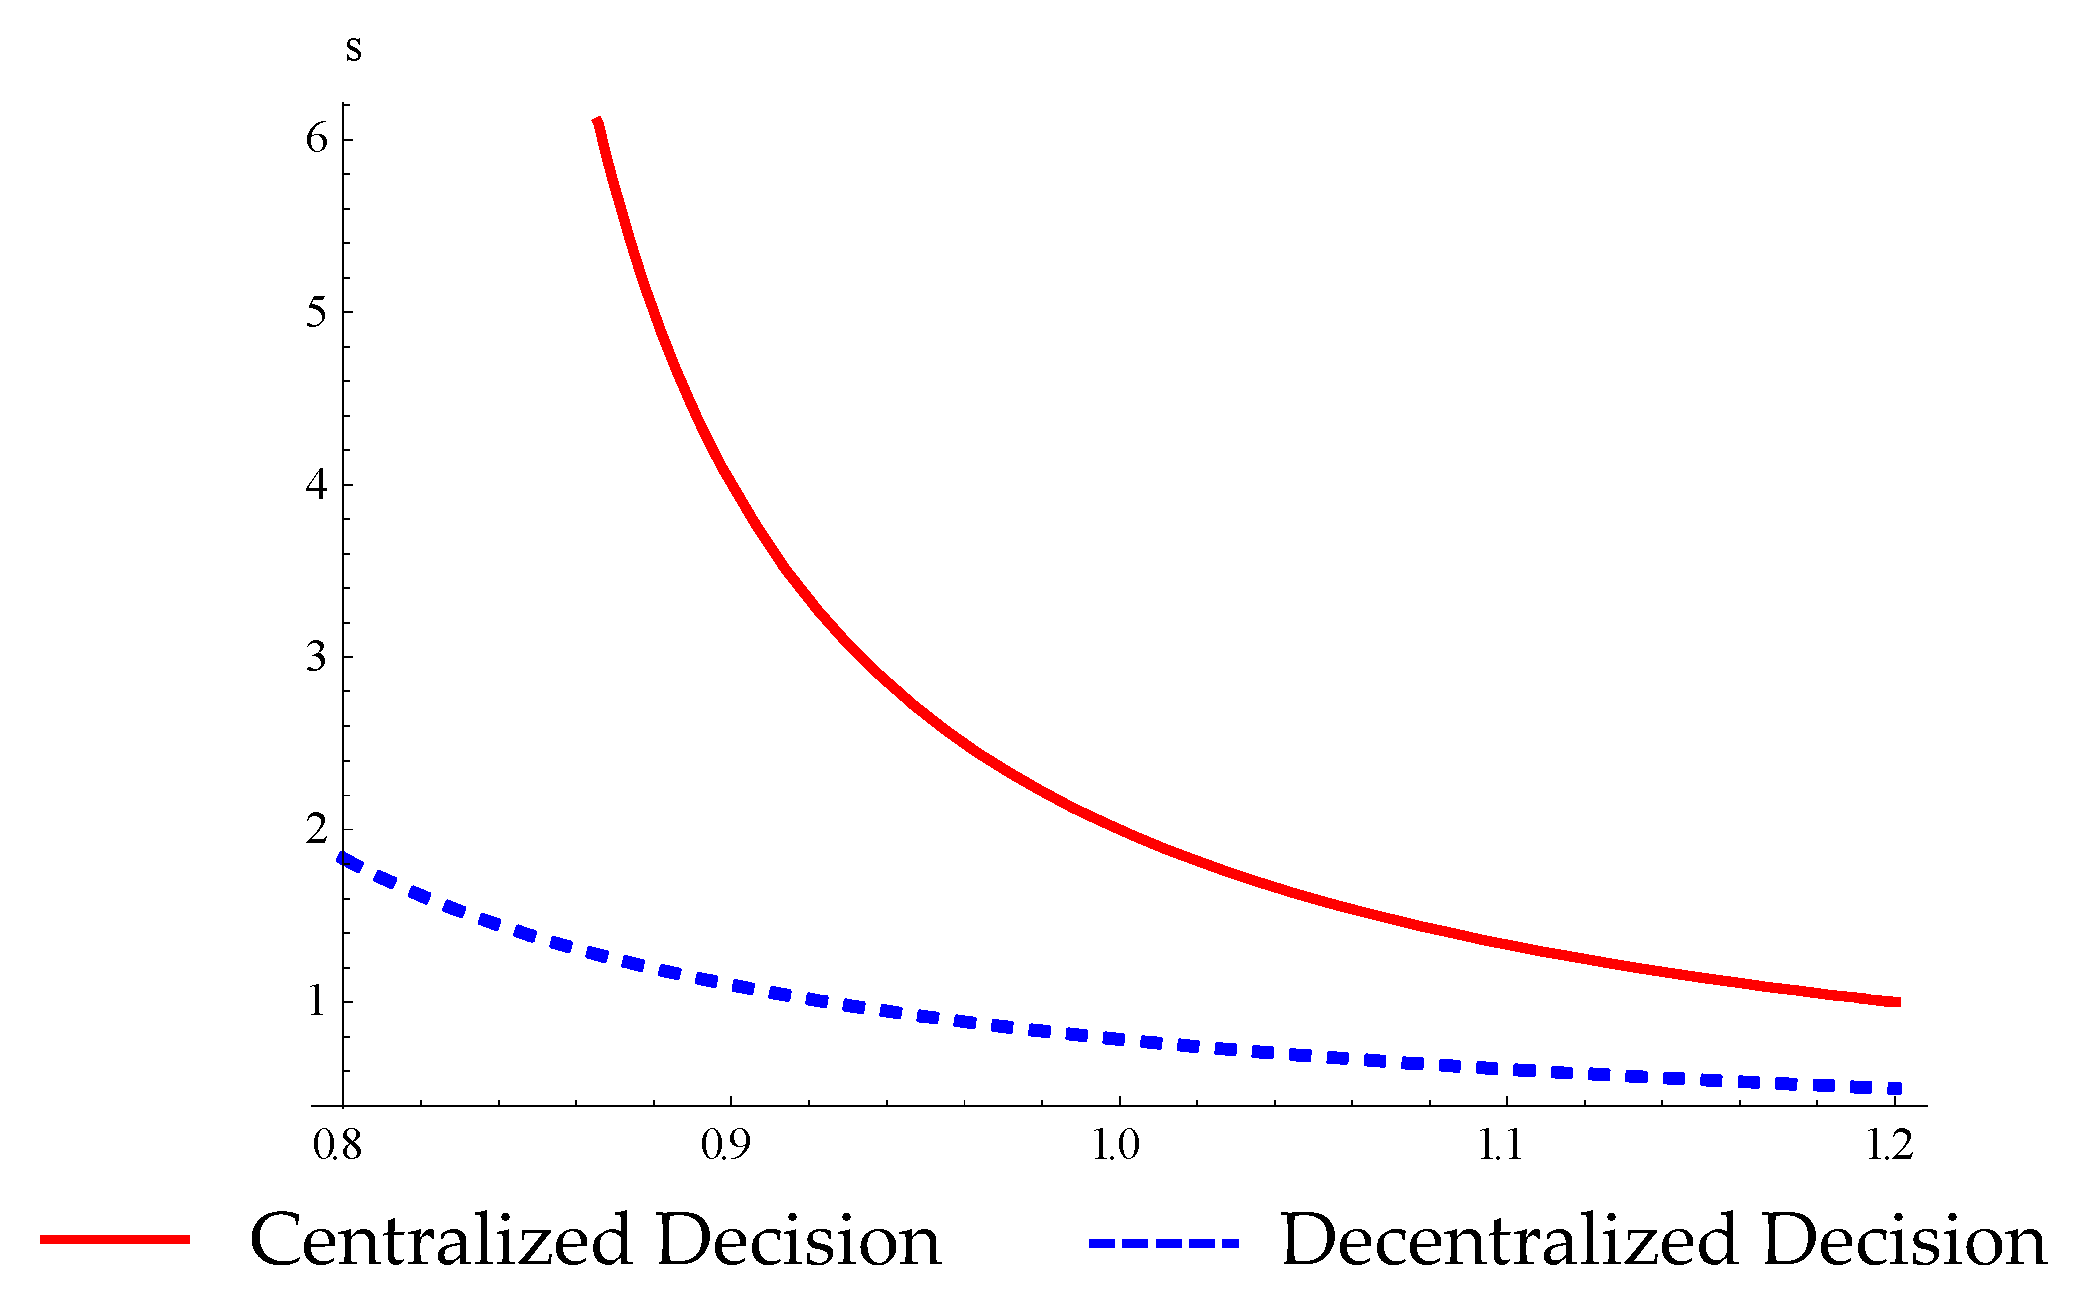
Given that = 0.6, = 0.4, = 0.5, = 0.4, and = [0.8, 1.2], the impact of the service cost coefficient on the service differentiation under centralized and decentralized decision making is depicted in Figure 4.
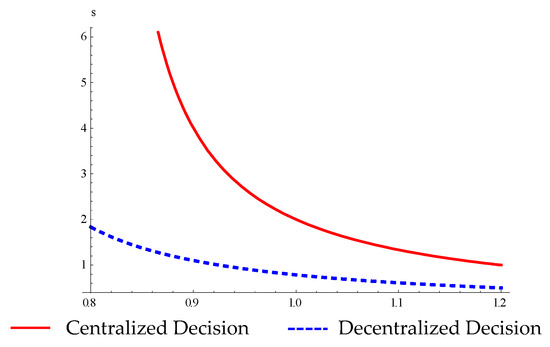
Figure 4.
The relationship between service differentiation and service cost coefficient.
It can be observed that, under any strategy, the service differentiation decreases as the service cost coefficient increases. When the service cost coefficient rises, or when the cost–benefit efficiency of adopting advanced IT is relatively low, providing the same level of service requires more investment. Merchants, being rational and profit-maximizing, will inevitably reduce their emphasis on service differentiation.
5.2. The Numerical Analysis Related to the Profit
5.2.1. Overall Profit and Consumers’ Sensitivity
Given that = 0.6, = 0.4, = [0, 1], = [0, 1], = 0.5, and = 1, the impact of consumers’ sensitivity on the overall profit of supply chain under centralized and decentralized decision making is depicted in Figure 5.
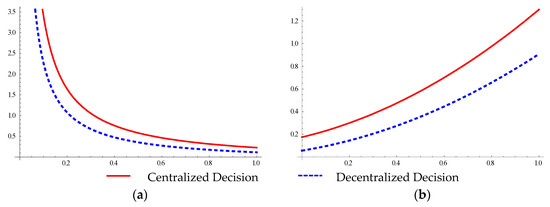
Figure 5.
(a) The relationship between overall profit and consumer’s sensitivity on the product price. (b) The relationship between overall profit and consumer’s sensitivity on the service level.
It can be observed that, under any strategy, the overall profit decreases as customers’ price sensitivity increases and increases as customers’ service sensitivity increases. As consumers become more sensitive to product prices, they are attracted to lower prices, prompting CBEC merchants to adopt competitive strategies that involve reducing product prices. This action leads to a decline in the overall profits of the cross-border supply chain. When consumers become more sensitive to service levels, merchants are inclined to adopt advanced IT to enhance service levels. Therefore, price competition is detrimental to the overall supply chain. Both enterprises and governments should actively guide consumers to pay more attention to the quality of products and services.
5.2.2. Overall Profit and Service Cost Coefficient
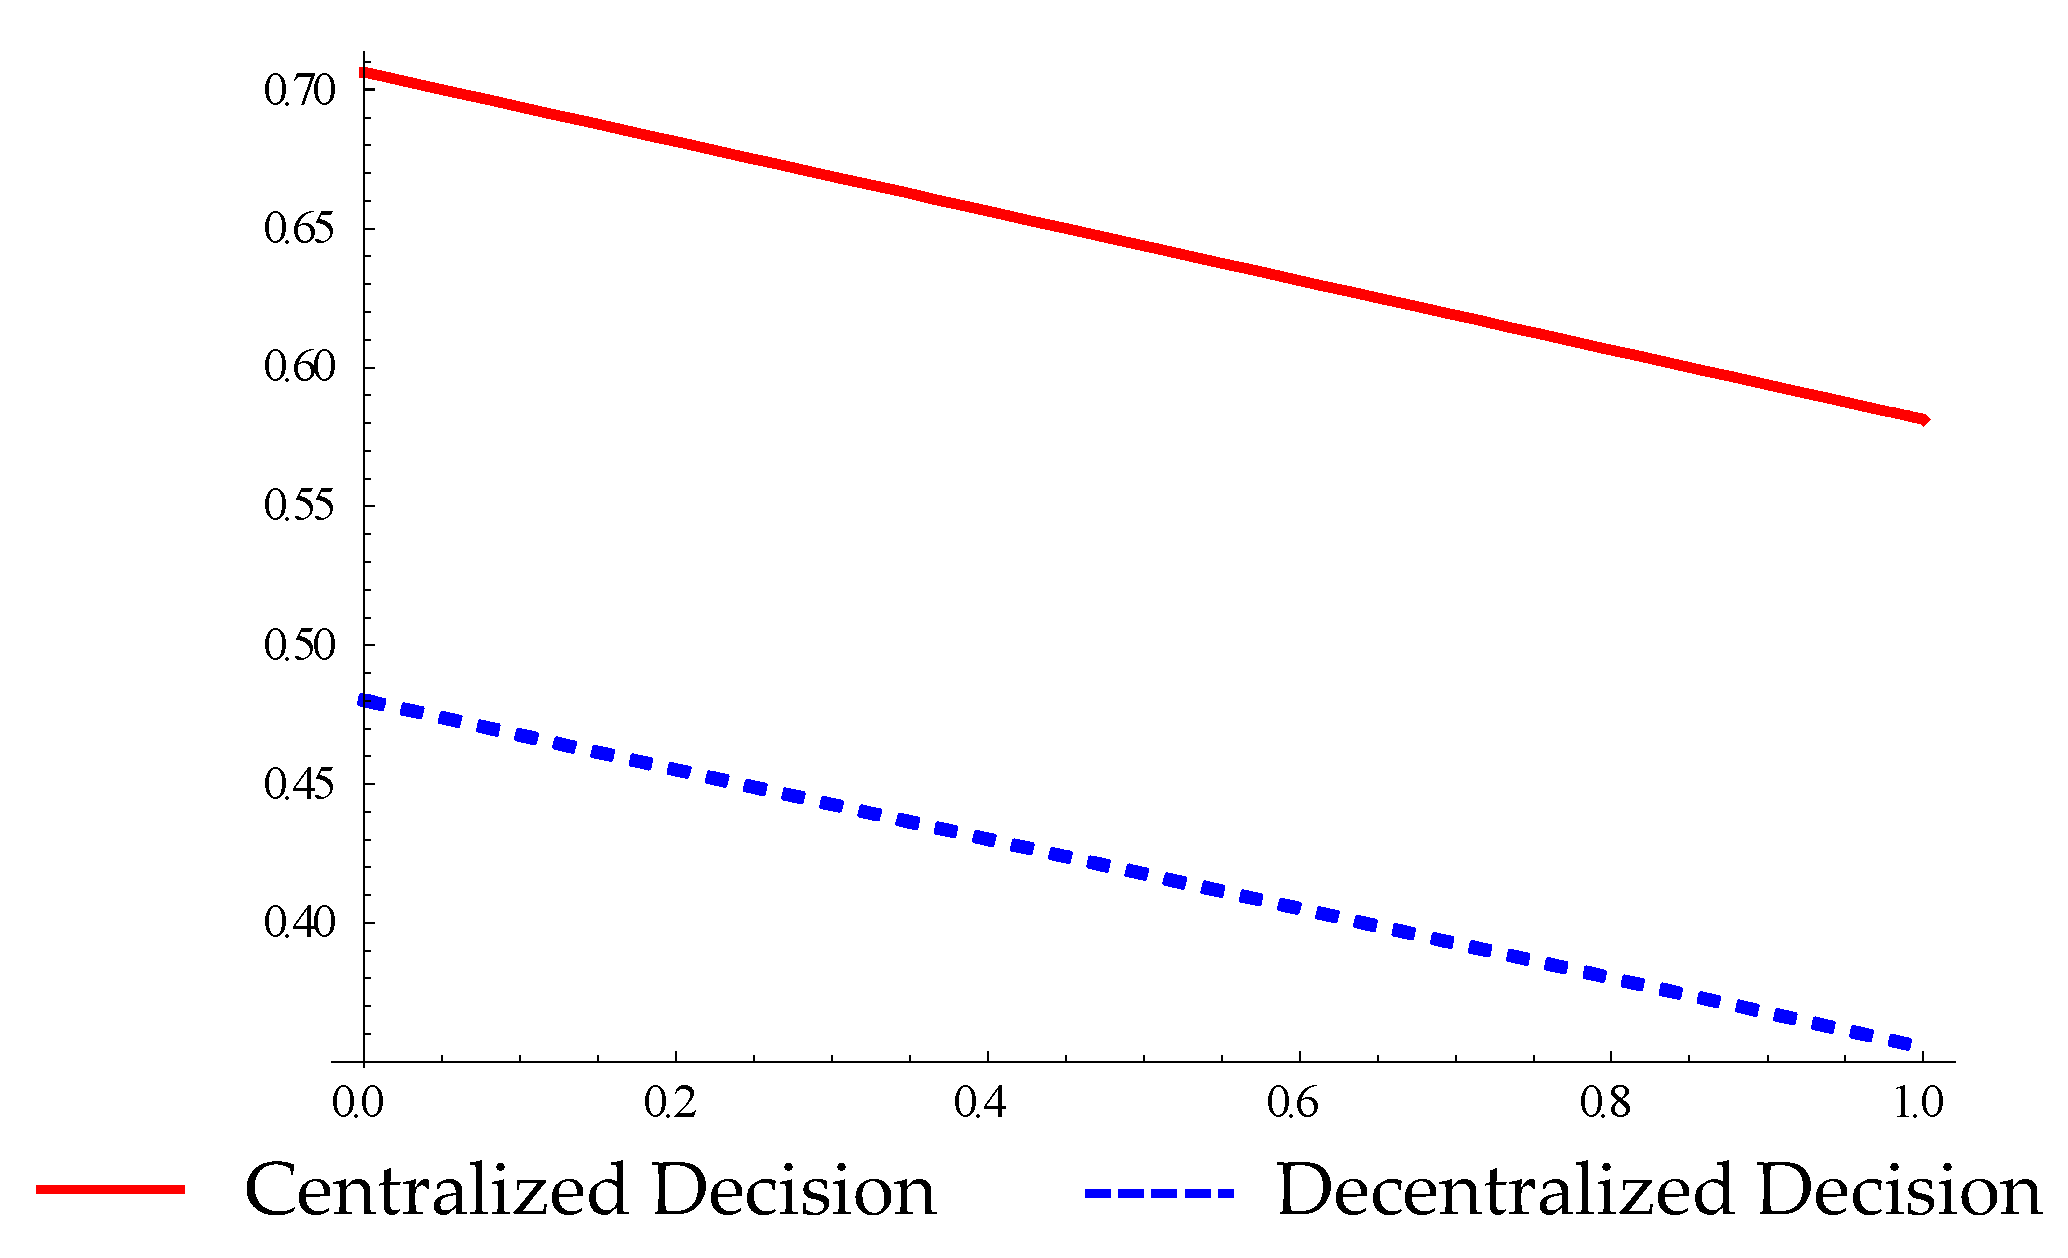
Given that = 0.6, = 0.4, = 0.5, = 0.5, = 0.5, and = [0, 1], the impact of the service cost coefficient on the overall profit of supply chain under centralized and decentralized decision making is depicted in Figure 6.
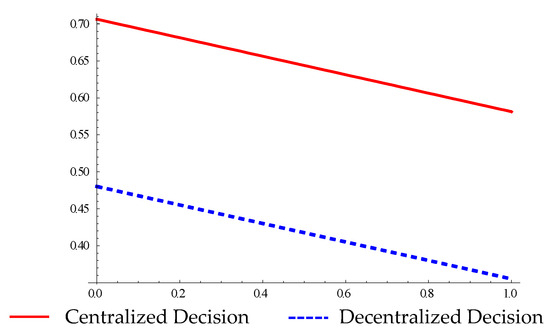
Figure 6.
The relationship between overall profit and service cost coefficient.
It can be observed that, under both centralized and decentralized decision making, when the service cost coefficient rises, in other words, when the efficiency of IT investment is low, providing the same level of service requires more investment, inevitably leading to a decrease in overall profits for the cross-border supply chain. In such cases, the government should provide certain subsidies and improve the corresponding infrastructure to reduce the service costs of enterprises, thereby promoting the sustainable development of CBEC.
5.2.3. Overall Profit and Service Differentiation
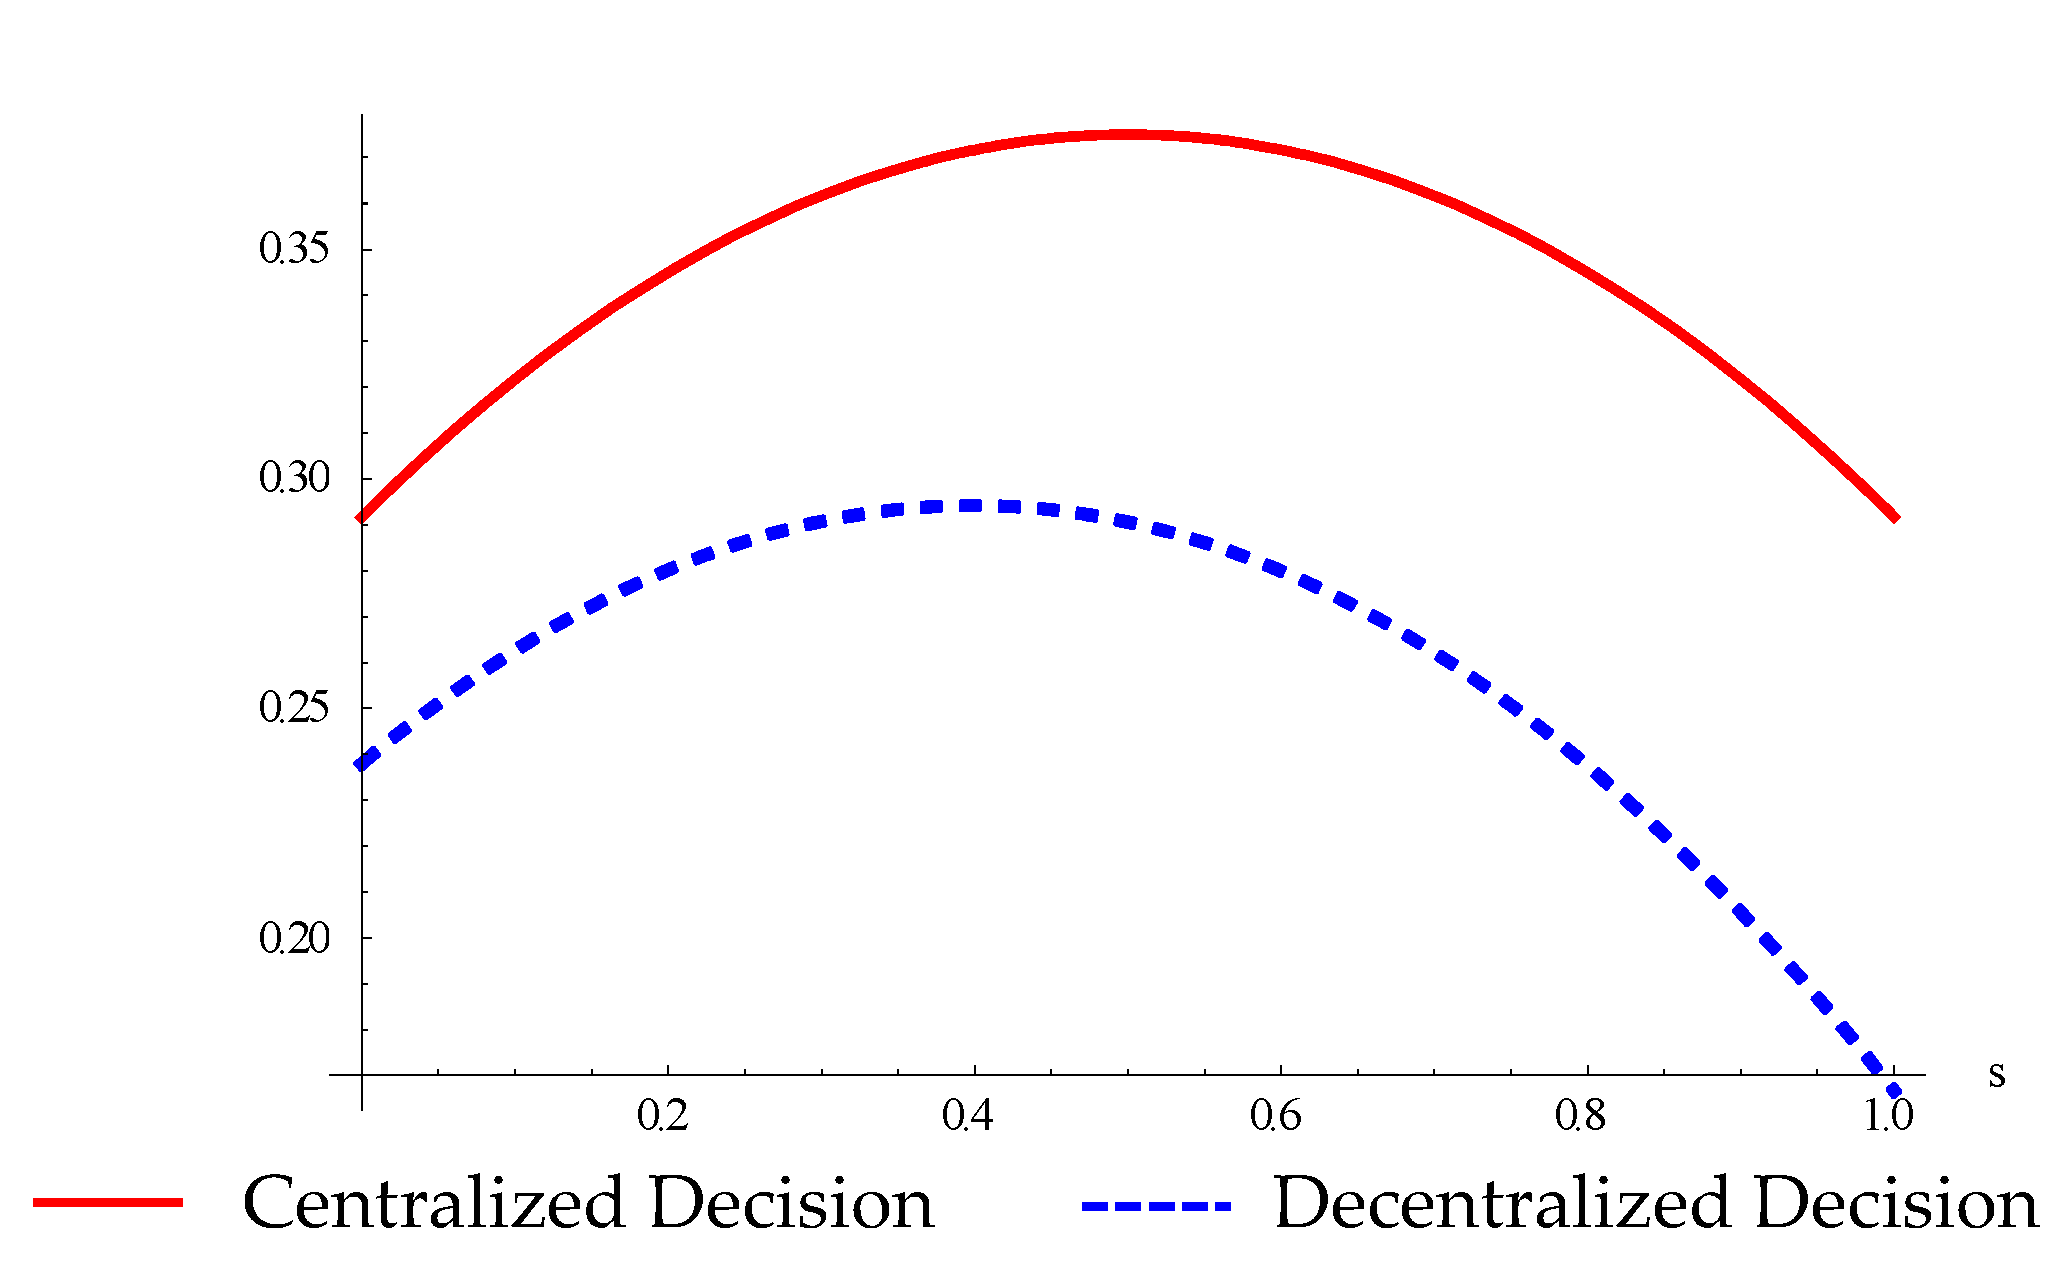
Given that = 0.7, = 0.3, = 0.6, = 0.5, = [0, 1], and = 1, the impact of service differentiation on the overall profit of supply chain under centralized and decentralized decision making is depicted in Figure 7.

Figure 7.
The relationship between overall profit and service differentiation.
It can be observed that, in both centralized and decentralized strategies, the profit function of the CBEC supply chain exhibits an inflection point , representing the optimal service differentiation threshold. When , the overall profit of the CBEC supply chain increases with the degree of service differentiation. Conversely, when , the overall profit decreases as the degree of service differentiation increases, highlighting the risks of overinvestment. To operationalize this insight, is defined as the Service Elasticity Index (SEI), which quantifies the marginal profit impact of service differentiation per unit cost. This index provides a novel metric to prioritize IT investments by identifying the inflection point where additional service enhancements yield diminishing returns (see Theorem 6 and Table 1 for derivations). In addition, given a certain level of service differentiation, a supply chain adopting a centralized strategy can achieve greater profits. When formulating service differentiation strategies, enterprises should comprehensively consider these influencing factors. Simply increasing the degree of service differentiation may not necessarily benefit the CBEC supply chain and could even lead to negative utility. IT initiatives should be aligned with SEI to avoid diminishing returns. This approach is particularly critical for SMEs with constrained budgets, enabling them to target IT solutions that deliver measurable competitive advantages.
6. Conclusions
CBEC is experiencing robust growth globally. The integration of advanced IT significantly enhances the operational efficiency and service levels of enterprises, thereby strengthening their competitiveness and driving sustainable development within the supply chain. IT-enabled process automation leads to cost reductions and enhances financial performance, while also contributing to the environmental pillar of supply chains by increasing visibility for the proactive identification of environmental risks and opportunities for improvement. Nevertheless, the increased costs associated with technology adoption present a dilemma for enterprises. Therefore, a comprehensive balance is required when making decisions.
In terms of theoretical implications, first of all, this study investigates the role of advanced IT in enhancing service differentiation and sustainability within CBEC supply chains by integrating the RBV and game-theoretic models. The results demonstrate that service differentiation () is a double-edged sword. While it enhances profitability when aligned with consumer service sensitivity () and low service cost coefficients (), excessive differentiation () leads to diminishing returns (Theorem 6), which confirms IT as a VRIN resource but emphasizes the necessity of cost–benefit calibration. Secondly, centralized decision making (CD) consistently outperforms decentralized models (DD), achieving higher profits () through coordinated pricing and service strategies (Theorem 4). This extends prior work on supply chain collaboration, highlighting the critical role of centralized governance in balancing IT investments with market demands. The existing literature predominantly focuses on the static benefits of IT but lacks dynamic metrics to assess the trade-offs between service differentiation and costs. Thus, the Service Elasticity Index () is proposed, which quantifies the sensitivity of profit to variations in service levels (see Section 5.2.3).
In terms of practical implications, especially for SMEs, incremental IT solutions targeting operational bottlenecks (e.g., smart inventory systems) should be adopted rather than full-scale digital transformation. Cost–benefit analysis should guide IT adoption, prioritizing technologies that directly address inefficiencies while avoiding overinvestment. The focus should be on scalable IT tools (e.g., AI-driven demand forecasting) to address specific challenges like inventory management or logistics optimization. The solution results under the centralized strategy confirm the strategic value of integrated IT infrastructure in sustaining a competitive advantage. Practically, this suggests that industry consortia or public–private partnerships could play a pivotal role in developing shared IT platforms, particularly for SMEs. Governments could subsidize cloud platforms (e.g., logistics optimization SaaS) to reduce and lower entry barriers for SMEs. Large enterprises should lead consortia to standardize IT interfaces (e.g., IoT protocols for smart warehouses), enabling SMEs to plug into agile supply networks.
This paper represents the initial step in investigating the operational strategies of CBEC supply chains in the context of modern IT development. Since CBEC encompasses both international and domestic supply chains, the operational strategies are complex and extensive. In future research, in order to refine competitive strategies, decision-making mechanisms under incomplete information will be considered, and contracts will be introduced to obtain optimal strategies. Some findings could extend to the environmental dimension of the Technology Organization Environment (TOE). For example, policymakers can optimize the sustainable development path of the supply chain by subsidizing to reduce costs (environmental intervention) or promoting industry standards to increase quality (such as carbon label certification).
Author Contributions
Conceptualization, F.D.; methodology, F.D. and J.H.; software, F.D.; validation, F.D.; formal analysis, F.D.; investigation, F.D.; resources, F.D. and J.H.; data curation, F.D.; writing-original draft preparation, F.D.; writing-review and editing, J.H.; supervision, J.H.; project administration, J.H. All authors have read and agreed to the published version of the manuscript.
Funding
This research was funded by Natural Science project of Shanghai Zhongqiao Vocational and Technical University [ZQZR202424].
Data Availability Statement
The original contributions presented in this study are included in the article. Further inquiries can be directed to the corresponding author.
Conflicts of Interest
The authors declare no conflict of interest.
Abbreviations
The following abbreviations are used in this manuscript:
| CBEC | Cross-border E-commerce |
| IT | Information Technology |
| CC | Centralized Decision |
| DC | Decentralized Decision |
Appendix A
Appendix A.1. The Derivation Process of Consumer Utility Function
Referring to the linear demand function constructed by Ali et al. [35], the utility of consumer purchasing from the merchants can be, respectively, expressed as follows.
Rational consumers will only make a purchase when the utility is positive. When presented with multi-channel options, their selection process adheres to comparative utility optimization governed by max behavioral patterns. The decision framework establishes parametric thresholds () through product valuation analysis, corresponding to three pivotal operational scenarios .
The disparities existing between the parametric thresholds can be designated as follows.
When , so ; thus, . Combining can obtain and, finally, we can deduce that . When , so ; thus, . Combining can obtain , finally, we can deduce that .
According to the magnitude of the utility, consumers’ purchasing decisions can be divided into four situations:
- 1.
- When , which implies that , the consumers will not make a purchase from either Merchant 1 or Merchant 2, as the utility derived from the purchase would be negative;
- 2.
- When and , which indicates that and , the consumers are more inclined to purchase from Merchant 1, as this offers a higher utility, while Merchant 2 would not receive any purchases;
- 3.
- When and , which implies that and , the consumers are more likely to purchase from Merchant 2, as this provides a higher utility, while Merchant 1 would not receive any purchases;
- 4.
- When , which means that and , the consumers are indifferent between purchasing from Merchant 1 or Merchant 2, as the utilities are the same.
Consequently, given different product valuations, the demand for merchants across various price ranges can be articulated as three distinct scenarios (Figure A1).

Figure A1.
Purchase decision under different product valuation.
Figure A1.
Purchase decision under different product valuation.
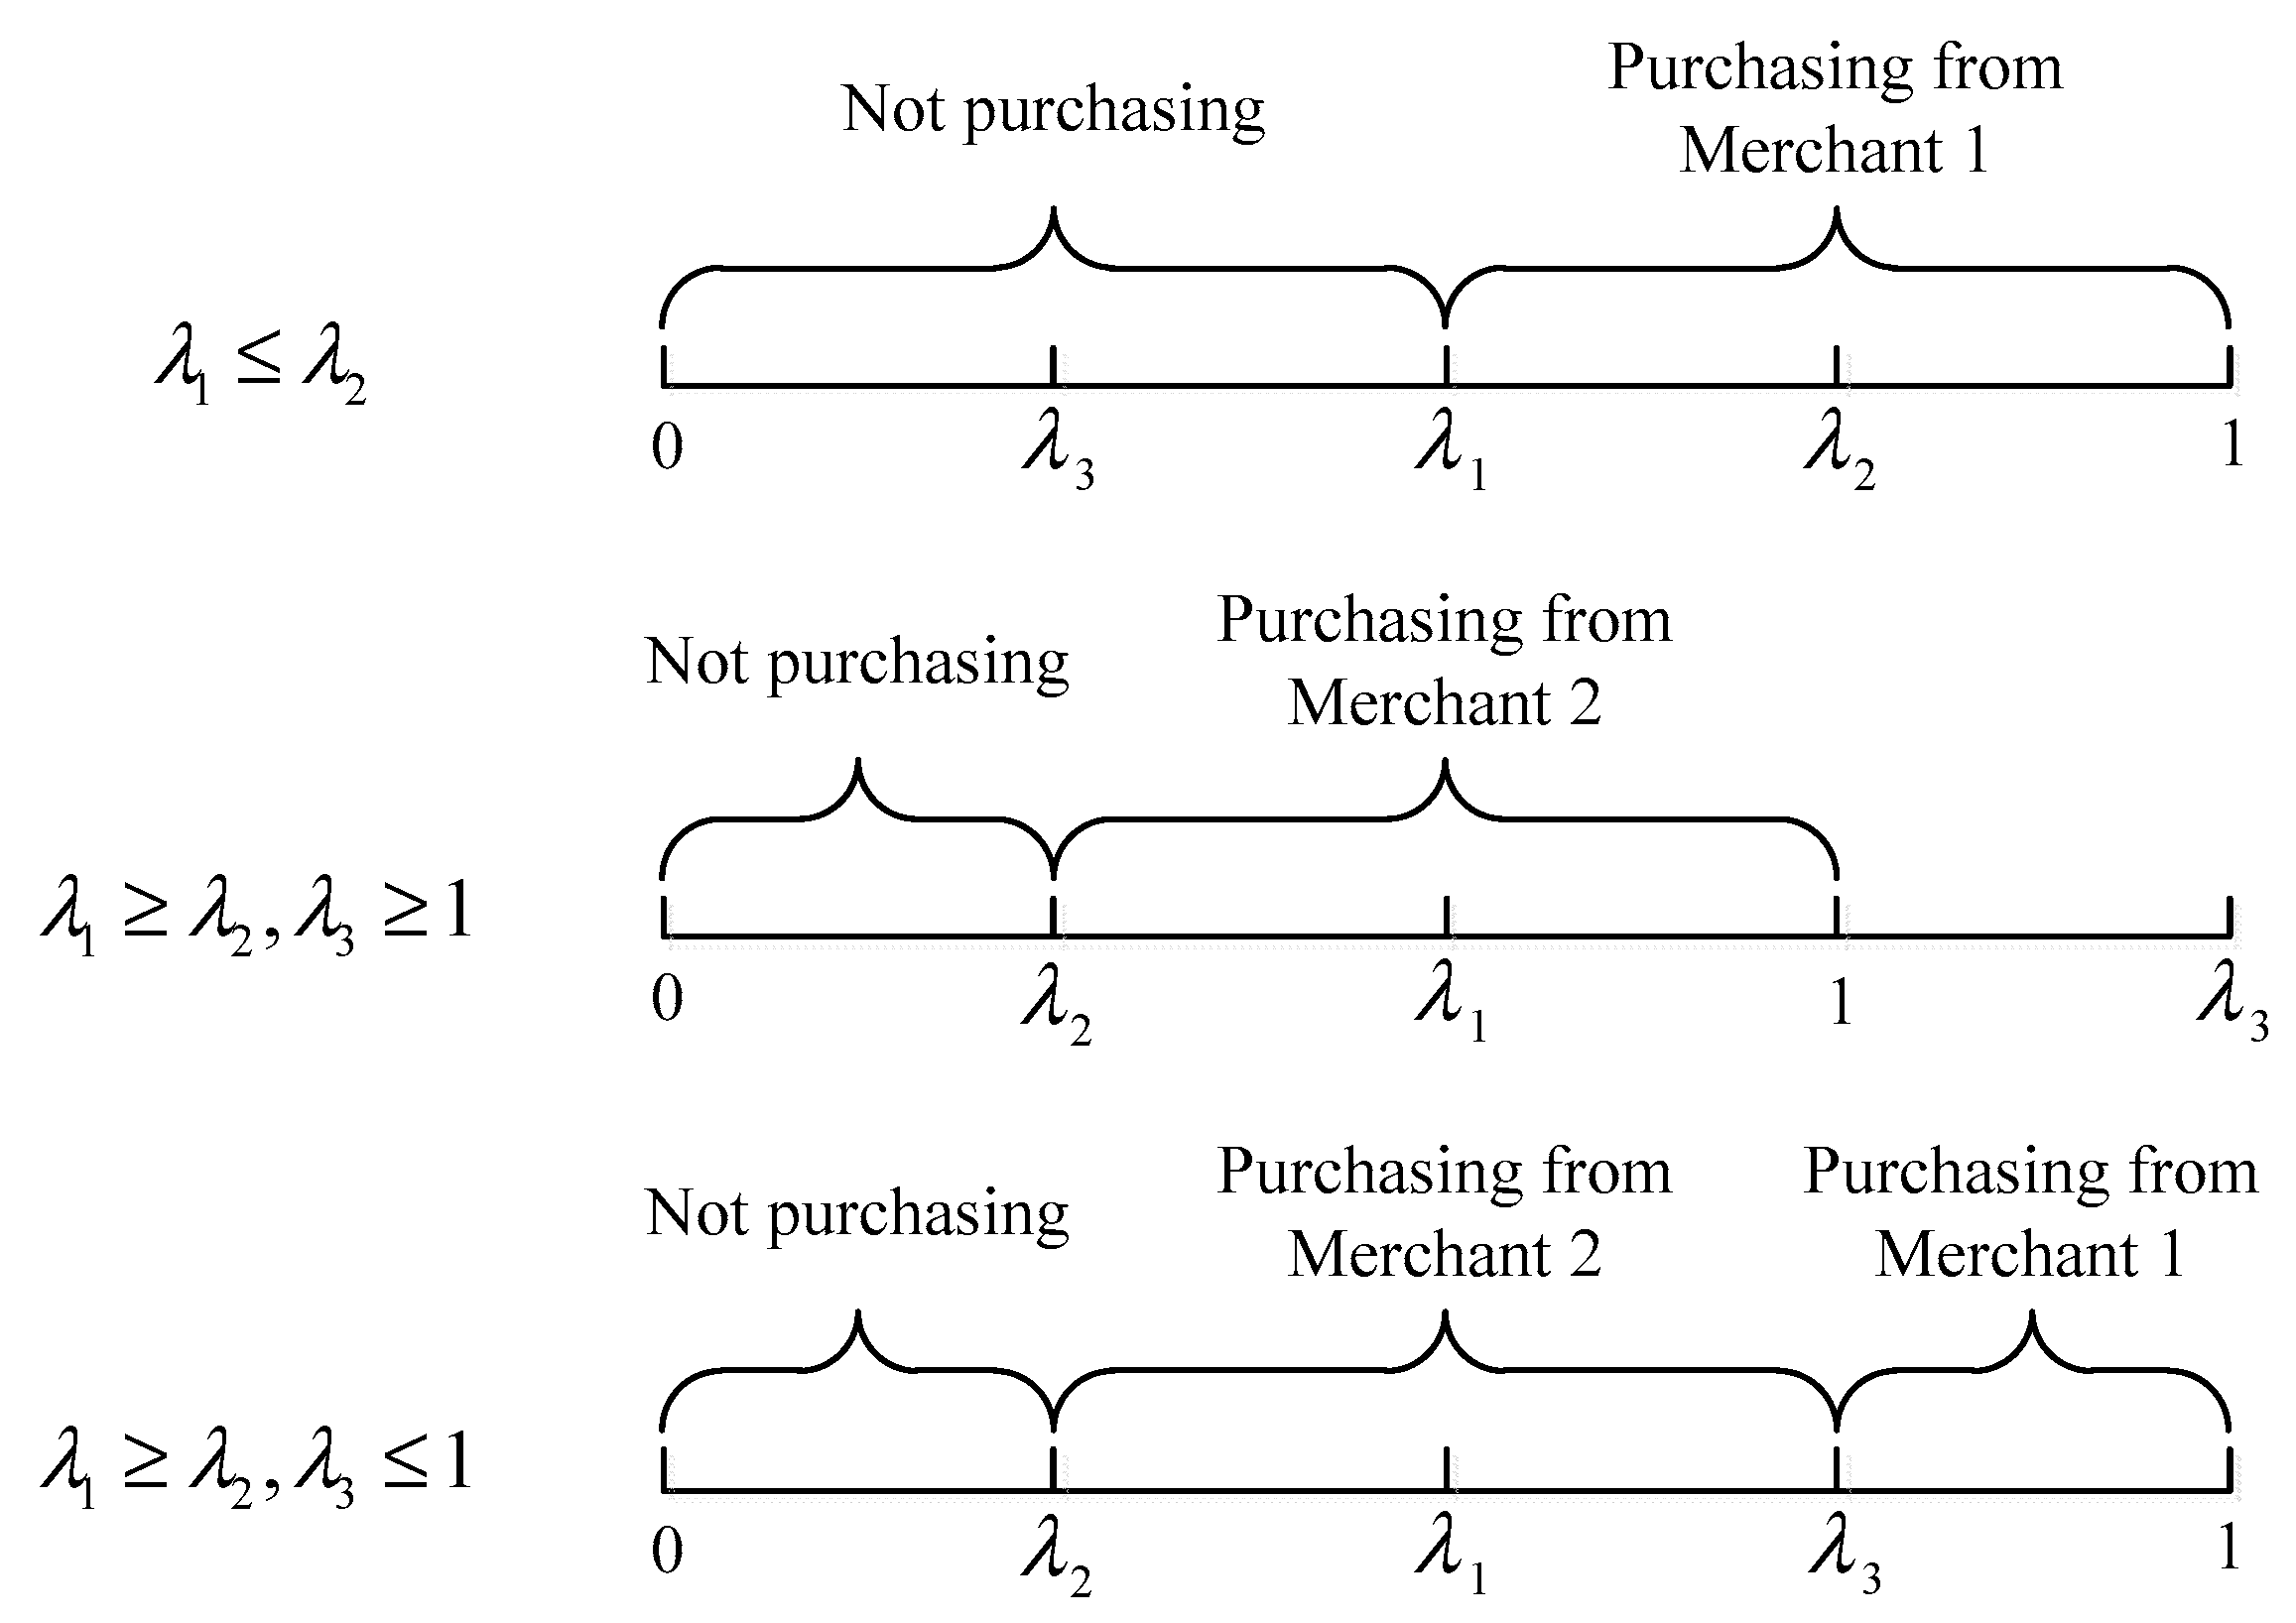
Given varying product valuations, the demand for merchants across different price ranges can be outlined in the following three scenarios:
- 1.
- In case , it follows that ; consumers do not make purchases from Merchant 2, resulting in a demand of . When , consumers purchase from Merchant 1, with the demand expressed as ; when , no purchase behavior occurs. As a result, the price range satisfies the following conditions.
- 2.
- In cases and , consumers do not make purchases from Merchant 1, leading to a demand of . When , consumers purchase from Merchant 2, with the demand given by ; when , no purchase behavior takes place. Consequently, the price range adheres to the subsequent conditions.
- 3.
- In cases and , when , consumers purchase from Merchant 1, and the demand is ; when , consumers purchase from Merchant 2, with the demand calculated as . As a result, the price range complies with the following conditions.
The main purpose of this study is to examine the service discrepancies resulting from the use of IT technology in decision-making strategies across multiple channels. Consequently, the initial two scenarios, which pertain to single-channel issues, will not be discussed further.
Appendix A.2. The Solution Process of Optimal Strategy in CD Scenario
The first-order derivative of with respect to and is denoted as follows.
The Hessian Matrix for this optimization problem, under the second-order conditions, is constructed as follows.
The determinants of the principal minors can be calculated in the following manner.
Because , it follows that ; thus, and , indicating that the Hessian Matrix is negative-definite. This implies the existence of an optimal pricing strategy , which can maximize the overall profit of CBEC merchants. The optimal pricing strategies for the merchants can be determined by solving the system of equations simultaneously. The profit of merchants and the overall cross-border supply chain can be obtained by substituting into . Finally, by solving the first-order equation , the optimal service differentiation can be derived.
Appendix A.3. The Solution Process of Optimal Strategy in DD Scenario
By solving the first-order equation , the pricing that maximizes Merchant 1’s profit can be determined.
Subsequently, by substituting into Merchant 2’s profit function, we can obtain the following.
Solving the first-order equation , the optimal pricing that maximizes Merchant 2’s profits can be determined. Then, by substituting into , the optimal pricing for Merchant 1 can be obtained. The profit of merchants and the overall cross-border supply chain can be obtained by substituting into . Finally, by solving the first-order equation , the optimal service differentiation can be determined.
References
- Marketdataforecast. Global Cross Border E-Commerce Market—Size, Share, Trends, & Growth Forecast Report. Available online: https://www.marketdataforecast.com/market-reports/cross-border-e-commerce-market (accessed on 15 June 2024).
- Xinhua. China’s Foreign Trade Hits New High in 2024. Available online: https://english.www.gov.cn/archive/statistics/202501/13/content_WS6784a546c6d0868f4e8eec59.html (accessed on 13 January 2025).
- Fei, X. Driving economic transition: The impact of cross-border e-commerce policy on the upgrading of service industry structure. Econ. Anal. Policy 2024, 84, 941–956. [Google Scholar]
- Sun, X.; Huang, Q.; Zhang, H.; Zhao, X. Comprehensive pilot zones for cross-border E-commerce propel the digital transformation of manufacturing enterprises: New evidence from China. In Electronic Commerce Research; Springer: Berlin/Heidelberg, Germany, 2024. [Google Scholar]
- Zhu, J. Application Analysis of Artificial Intelligence Technology in the Development of Cross-border E-commerce. In Proceedings of the AIAM2021: 2021 3rd International Conference on Artificial Intelligence and Advanced Manufacture, Manchester, UK, 23–25 October 2021; pp. 1112–1116. [Google Scholar]
- Qin, X.L.; Liu, Z.X.; Yang, Z.; Tian, L. Carbon footprint reduction in an e-commerce market: Impacts of logistics service sharing. Omega 2025, 131, 103205. [Google Scholar] [CrossRef]
- Gong, C.; Song, H.; Chen, D.; Day, S.J.; Ignatius, J. Logistics sourcing of e-commerce firms considering promised delivery time and environmental sustainability. Eur. J. Oper. Res. 2024, 317, 60–75. [Google Scholar] [CrossRef]
- Cheah, L.; Huang, Q. Comparative carbon footprint assessment of cross-border e-commerce shipping options. Transp. Res. Rec. 2022, 2676, 584–595. [Google Scholar] [CrossRef]
- Feng, Y. Green progress of cross-border e-commerce industry utilizing random forest algorithm and panel Tobit model. Appl. Artif. Intell. 2023, 37, 2219561. [Google Scholar] [CrossRef]
- Yang, Y.; Chen, N.; Chen, H. The Digital Platform, Enterprise Digital Transformation, and Enterprise Performance of Cross-Border E-Commerce-From the Perspective of Digital Transformation and Data Elements. J. Theor. Appl. Electron. Commer. Res. 2023, 18, 777–794. [Google Scholar] [CrossRef]
- Zhu, Q.; Ruan, Y.L.; Liu, S.; Yang, S.; Wang, L.; Che, J.H. Cross-border electronic commerce’s new path: From literature review to AI text generation. Data Sci. Manag. 2023, 6, 21–33. [Google Scholar] [CrossRef]
- Elia, S.; Giuffrida, M.; Mariani, M.M.; Bresciani, S. Resources and digital export: An RBV perspective on the role of digital technologies and capabilities in cross-border e-commerce. J. Bus. Res. 2021, 132, 158–169. [Google Scholar] [CrossRef]
- Zhao, L.; Wan, Y. A Study of Cross-Border E-Commerce Supply Chain Research Rrends: Based on Knowledge Mapping and Literature Analysis. In Proceedings of the 2024 IEEE 6th Advanced Information Management, Communicates, Electronic and Automation Control Conference (IMCEC), Chongqing, China, 24–26 May 2024; pp. 1944–1955. [Google Scholar]
- Wang, W. A IoT-Based Framework for Cross-Border E-Commerce Supply Chain Using Machine Learning and Optimization. IEEE Access 2024, 12, 1852–1864. [Google Scholar] [CrossRef]
- Chen, C.F. The Development Dilemma and Countermeasures of Chinese Cross-border E-commerce Enterprises Under the Background of Big Data. J. Comput. Methods Sci. Eng. 2023, 23, 1087–1099. [Google Scholar] [CrossRef]
- Tiwari, S.; Sharma, P.; Choi, T.M.; Lim, A. Blockchain and third-party logistics for global supply chain operations: Stakeholders’ perspectives and decision roadmap. Transp. Res. Part E Logist. Transp. Rev. 2023, 170, 103012. [Google Scholar] [CrossRef]
- Ran, J.F.; Ma, H.; Ran, R.Y. The Role of Big Data and IoT in Logistics Supply Chain Management of E-commerce. J. Comput. Methods Sci. Eng. 2024, 24, 813–822. [Google Scholar] [CrossRef]
- Yuan, L.; Zhuojim, Z.; Mingzhu, Z.O.; Ziqi, L. How does digital trade impact urban carbon emissions efficiency? Evidence from China’s cross-border e-commerce pilot zones. J. Clean. Prod. 2024, 456, 142363. [Google Scholar]
- Barata, F.A. Information technology Mediating Influence Supply Chain Management on Competitive Advantage at PT. Ritelteam Sejahtera Indonesia. Qual.-Access Success 2022, 23, 217–223. [Google Scholar]
- Dallocchio, M.; Lambri, M.; Sironi, E.; Teti, E. The Role of Digitalization in Cross-Border E-Commerce Performance of Italian SMEs. Sustainability 2024, 16, 508. [Google Scholar] [CrossRef]
- Qu, C.; Kim, E. Reviewing the Roles of AI-Integrated Technologies in Sustainable Supply Chain Management: Research Propositions and a Framework for Future Directions. Sustainability 2024, 16, 6186. [Google Scholar] [CrossRef]
- Kouhizadeh, M.; Sarkis, J. Blockchain technology and the sustainable supply chain: Theoretically exploring adoption barriers. Int. J. Prod. Econ. 2021, 231, 107831. [Google Scholar] [CrossRef]
- He, Y.; Wang, Z.; Liu, S.; Du, X. Construction and implementation of cross-border e-commerce supply chain system under the background of green and low-carbon. J. Internet Digit. Econ. 2024, 4, 1–11. [Google Scholar] [CrossRef]
- Karhade, P.P.; Dong, J.Q. Information Technology Investment and Commercialized Innovation Performance: Dynamic Adjustment Costs and Curvilinear Impacts. MIS Q. 2021, 45, 1007–1024. [Google Scholar] [CrossRef]
- Nour, R. Enhancing the Logistics 4.0 Firms through Information Technology. Sustainability 2022, 14, 15860. [Google Scholar] [CrossRef]
- Zhou, F.L.; Zhang, C.C.; Chen, T.F.; Lim, M.K. An evolutionary game analysis on blockchain technology adoption in cross-border e-commerce. Oper. Manag. Res. 2023, 16, 1766–1780. [Google Scholar] [CrossRef]
- Wang, L.H.; Wang, H.Y.; Huang, M.; Dai, W. The impacts of blockchain adoption in fourth party logistics service quality management. Int. J. Ind. Eng. Comput. 2024, 15, 737–754. [Google Scholar] [CrossRef]
- Zhang, R.; Xia, Z.W.; Liu, B. Optimal Pricing Decisions for Dual-Channel Supply Chain: Blockchain Adoption and Consumer Sensitivity. Complexity 2022, 2022, 4605455. [Google Scholar] [CrossRef]
- Zhao, L. Blockchain adoption and contract coordination driven by supplier encroachment and retail service: An analysis from consumers’ information traceability awareness. Technol. Soc. 2023, 73, 102237. [Google Scholar] [CrossRef]
- Modak, N.M.; Senapati, T.; Simic, V.; Pamucar, D.; Saha, A.; Cárdenas-Barrón, L.E. Managing a sustainable dual-channel supply chain for fresh agricultural products using blockchain technology. Expert Syst. Appl. 2024, 244, 122929. [Google Scholar] [CrossRef]
- Zhou, K. Financial model construction of a cross-border e-commerce platform based on machine learning. Neural Comput. Appl. 2023, 35, 25189–25199. [Google Scholar] [CrossRef]
- Zhang, Z.Y.; Yu, L.Y. Research on optimal pricing decisions of the service supply chain oriented to strategic consumers. J. Ind. Manag. Optim. 2023, 19, 3509–3553. [Google Scholar] [CrossRef]
- Hamzaoui, A.F.; Turki, S.; Rezg, N. Unified strategy of production, distribution and pricing in a dual-channel supply chain using leasing option. Int. J. Prod. Res. 2024, 62, 7167–7185. [Google Scholar] [CrossRef]
- Liu, X.; Du, W.; Olasehinde, T.; Fan, Y. Balancing competition and sustainability: Strategic supply chain configurations in response to consumer low-carbon preferences. Sustain. Futures 2025, 9, 100411. [Google Scholar] [CrossRef]
- Ali, S.M.; Rahman, M.H.; Tumpa, T.J.; Rifat, A.A.M.; Paul, S.K. Examining price and service competition among retailers in a supply chain under potential demand disruption. J. Retail. Consum. Serv. 2018, 40, 40–47. [Google Scholar] [CrossRef]

Disclaimer/Publisher’s Note: The statements, opinions and data contained in all publications are solely those of the individual author(s) and contributor(s) and not of MDPI and/or the editor(s). MDPI and/or the editor(s) disclaim responsibility for any injury to people or property resulting from any ideas, methods, instructions or products referred to in the content. |
© 2025 by the authors. Published by MDPI on behalf of the International Institute of Knowledge Innovation and Invention. Licensee MDPI, Basel, Switzerland. This article is an open access article distributed under the terms and conditions of the Creative Commons Attribution (CC BY) license (https://creativecommons.org/licenses/by/4.0/).