Abstract
This study investigated the predictive performance of three regression models—Gradient Boosting (GB), Random Forest (RF), and XGBoost—in forecasting mortality due to endocrine, nutritional, and metabolic diseases across Italian provinces. Utilizing a dataset encompassing air pollution metrics and socio-economic indices, the models were trained and tested to evaluate their accuracy and robustness. Performance was assessed using metrics such as coefficient of determination (), mean absolute error (MAE), and root mean squared error (RMSE), revealing that GB outperformed both RF and XGB, offering superior predictive accuracy and model stability ( = 0.55, MAE = 0.17, and RMSE = 0.05). To further interpret the results, SHAP (SHapley Additive exPlanations) analysis was applied to the best-performing model to identify the most influential features driving mortality predictions. The analysis highlighted the critical roles of specific pollutants, including benzene and socio-economic factors such as life quality and instruction, in influencing mortality rates. These findings underscore the interplay between environmental and socio-economic determinants in health outcomes and provide actionable insights for policymakers aiming to reduce health disparities and mitigate risk factors. By combining advanced machine learning techniques with explainability tools, this research demonstrates the potential for data-driven approaches to inform public health strategies and promote targeted interventions in the context of complex environmental and social determinants of health.
1. Introduction
Non-communicable diseases, particularly endocrine, nutritional, and metabolic disorders, represent a growing public health concern worldwide. These conditions, which include diabetes, thyroid disorders, and malnutrition-related complications, are influenced by complex interactions between genetic, environmental, and socio-economic factors [1]. In Italy, substantial regional disparities in mortality rates from such diseases suggest a significant role for external determinants, including air pollution and socio-economic conditions [2]. The incidence of these disorders varies across age groups, with type 1 diabetes often emerging in childhood or adolescence, posing lifelong management challenges [3], while type 2 diabetes and thyroid dysfunctions predominantly affect middle-aged and elderly populations due to aging, lifestyle factors, and dietary habits [4]. Malnutrition-related complications, though less frequent in high-income countries, disproportionately impact vulnerable groups such as infants, the elderly, and socio-economically disadvantaged populations [5]. These conditions carry severe health consequences, including chronic complications like cardiovascular disease, kidney failure, cognitive impairments, and heightened susceptibility to infections, which significantly reduce quality of life and life expectancy [6]. Socio-economic and social costs are equally profound, covering direct expenses for medical care, diagnostics, and treatment, as well as indirect costs arising from productivity losses, absenteeism, early retirement, and financial strain on families and caregivers [7]. In Italy, diabetes management alone consumes a substantial portion of healthcare resources, highlighting the immense pressure these diseases place on public health systems [8]. Socio-economically disadvantaged areas bear a disproportionate burden, exacerbating health inequalities and underscoring the need for comprehensive public health strategies that integrate preventive measures, early detection programs, and equitable access to care and support systems [9].
Air pollution has been widely recognized as a major contributor to various health conditions, including endocrine and metabolic disorders. Studies have linked exposure to pollutants such as particulate matter (PM10, PM2.5), nitrogen oxides (NO and NO2), and ozone (O3) to systemic inflammation, hormonal disruptions, and metabolic imbalances [10,11,12]. Concurrently, socio-economic variables, such as income, education levels, healthcare access, and urbanization, are known to modulate health outcomes, acting as either risk amplifiers or protective buffers [13]. However, the interplay between these factors remains underexplored, particularly in the context of mortality associated with endocrine, nutritional, and metabolic diseases.
The advent of machine learning (ML) offers powerful tools to analyze large, complex datasets and uncover hidden patterns that traditional statistical methods may overlook. ML models can integrate diverse data sources, ranging from environmental pollution metrics to socio-economic indicators, to predict health outcomes with a high accuracy [14]. Moreover, explainable artificial intelligence (XAI) frameworks, such as Shapley Additive Explanations (SHAP), enable the interpretation of model predictions, shedding light on the relative importance and interplay of contributing factors [15]. This combination of predictive capability and interpretability makes ML a valuable approach to addressing public health challenges [16,17,18,19].
This study applied ML techniques to assess the likelihood of mortality from endocrine, nutritional, and metabolic diseases across Italian provincial units. By integrating air quality data and economic and social condition indices with mortality statistics obtained from ISTAT (Italian National Institute of Statistics), we aimed to identify key predictors and quantify their contributions to health outcomes.
This paper has the following structure: Section 2 provides the description of the data used and the analysis methods used. In particular, Section 2.1 defines the dataset composition and its preparation for ML analysis; Section 2.2 presents the reduction of the features through a multicollinearity analysis; Section 2.3 describes the leave-one-group-out cross-validation; Section 2.4 introduces the regression models and the metrics used to compare their performances; Section 2.5 presents the SHAP method used to evaluate the feature importance. Section 3 shows the comparison of the results obtained for the regression models that are discussed in Section 4. Section 5 contains the final consideration of this work.
2. Materials and Methods
2.1. Data Preparation Description
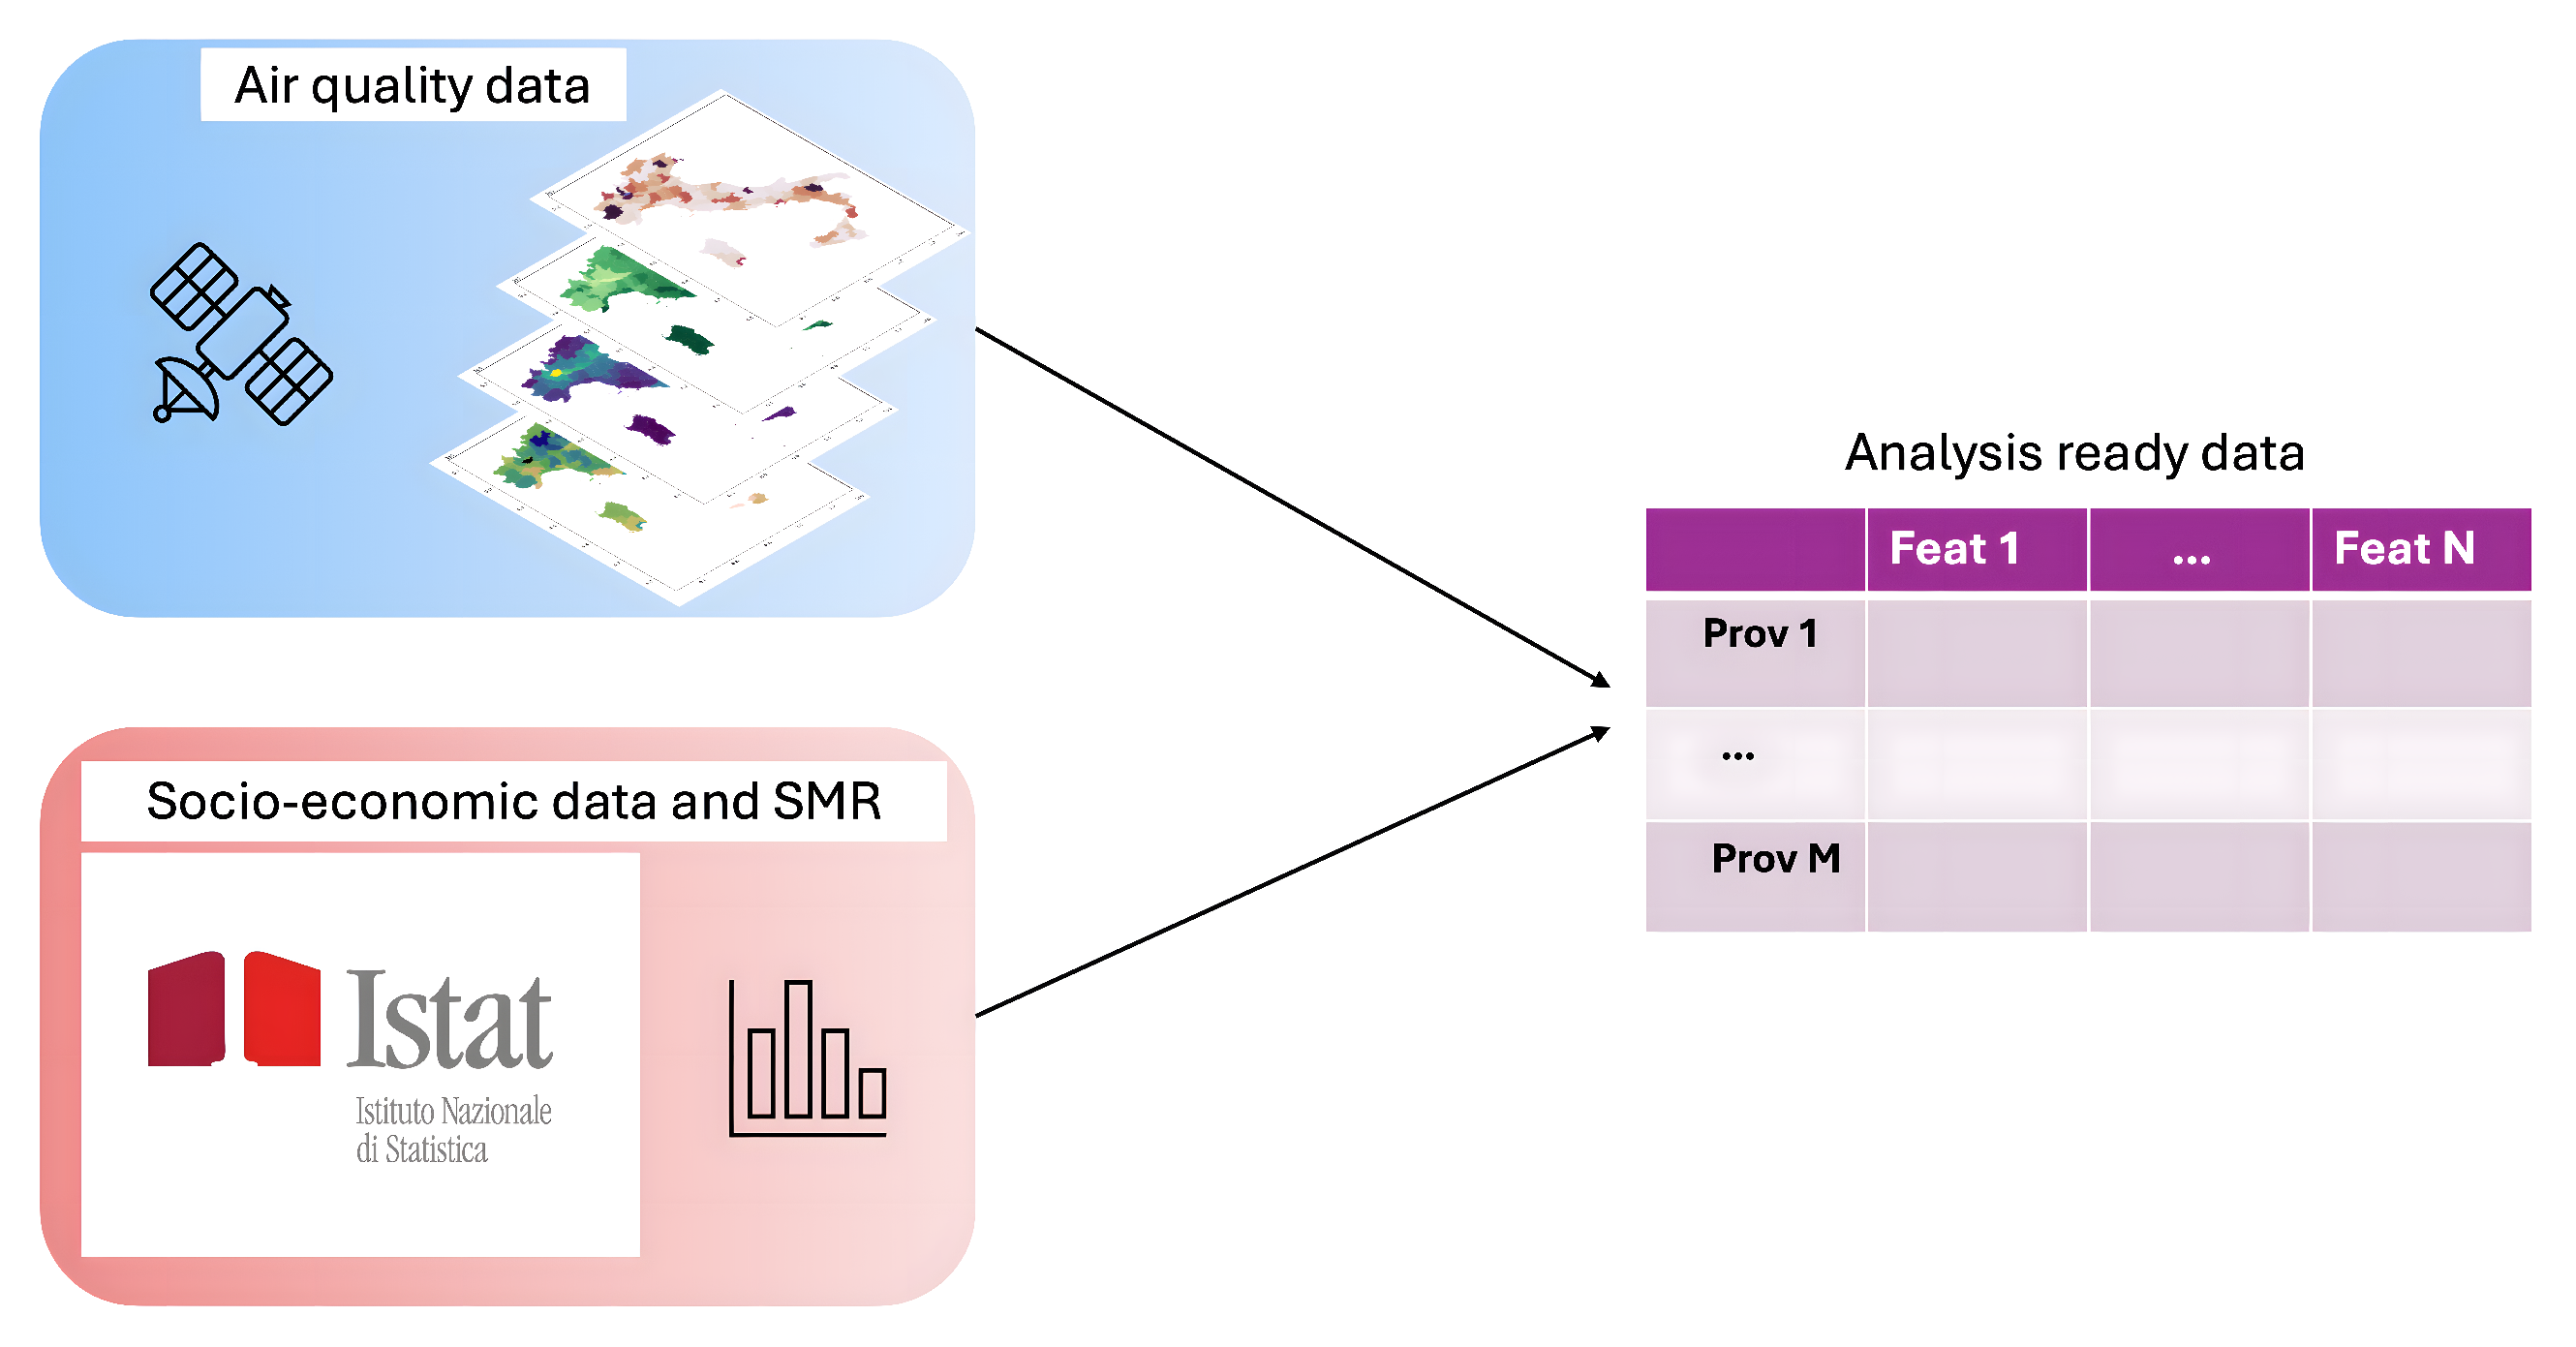
The data used were those of a previously conducted study [16] on air quality and atmospheric composition, acquired by Copernicus Atmosphere Monitoring Service (CAMS) (https://ads.atmosphere.copernicus.eu/#!/search?text=&type=dataset&keywords=((%20%22Product%20type:%20Reanalysis%22%20)%20AND%20(%20%22Varia-ble%20domain:%20Atmosphere%20(composition)%22%20)%20AND%20(%20%22Spatial%20coverage:%20Europe%22%20)%20AND%20(%20%22Temporal%20coverage:%20Past%22%20)) accessed on 1 November 2023). In particular, the pollutant data provided by CAMS are derived from the median ensemble of nine numerical air quality models [20,21,22,23,24,25,26,27]. In this study, which examined the relationship between air pollution and mortality for endocrine nutritional and metabolic diseases, specific pollutant concentrations such as CO, NO, NO2, O3, PM10, PM2.5, and SO2 were analyzed using the Python library Geopandas (https://geopandas.org/en/stable/) (version 0.14.1, 1 November 2023). To enhance data consistency, additional variables related to pollution and socio-economic factors were included. Figure 1 presents an outline of the data preparation workflow. The dataset thus constructed consisted of 107 Italian provinces, each described by 28 environmental and socio-economic variables.
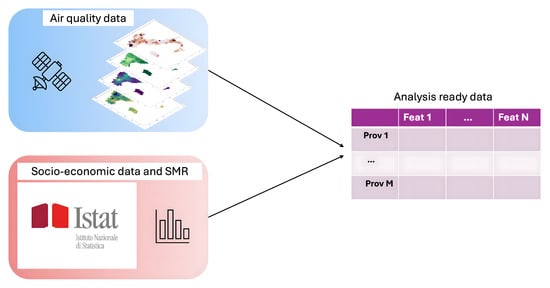
Figure 1.
Dataset preparation workflow.
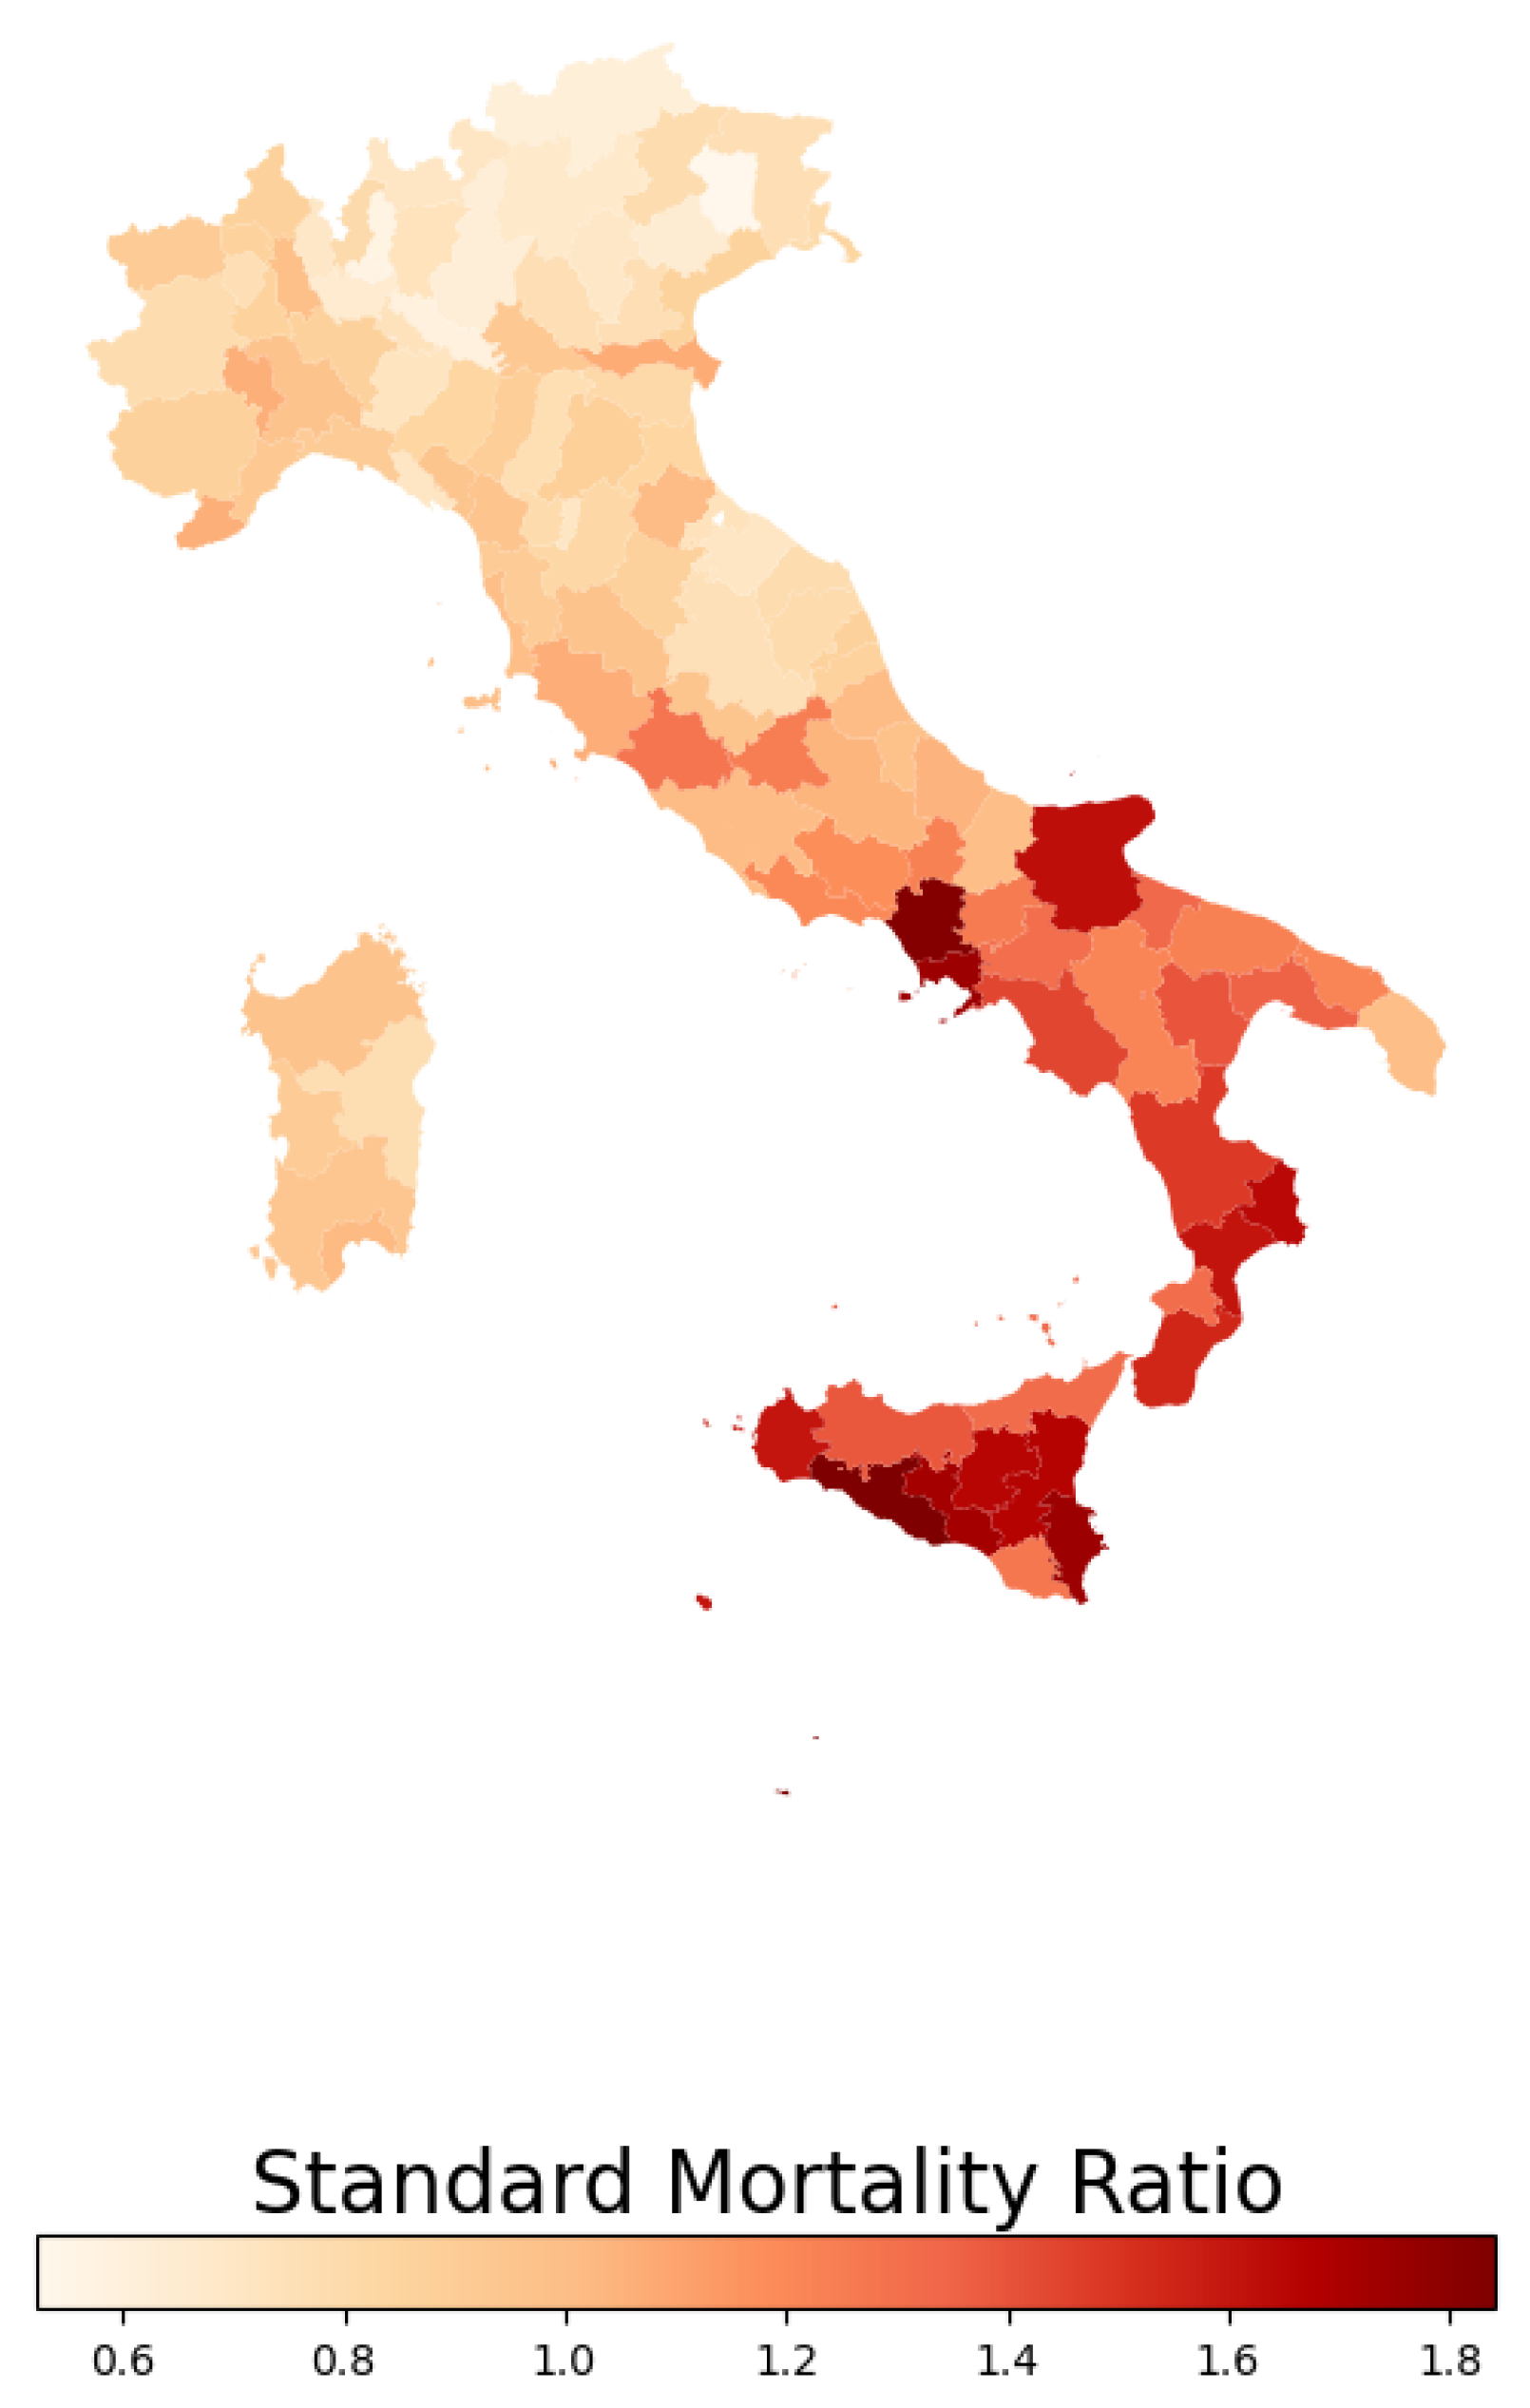
In this study, we calculated the standardized mortality ratio (SMR), which represents the ratio of observed deaths in a given area to the number of the expected ones. The expected mortality count was estimated through the age mortality rates from a reference population (in this case, the national population) to the mean annual population, stratified by age groups, within each province. Figure 2 illustrates the spatial distribution of the SMR for endocrine, nutritional, and metabolic diseases across Italian provinces in 2019.

Figure 2.
Standardized mortality ratio distribution in 2019 for endocrine, nutritional, and metabolic diseases within Italian provinces.
Figure 3 provides a visual overview of the analytical process carried out in this study. The first step of this work was to create a well-structured dataset of the Italian provinces with multiple types of data: the air pollution data were collected from the CAMS platform, while the socio-economic indices, such as life quality distribution and density of urban green areas, and the mortality data related to endocrine, nutritional, and metabolic diseases were obtained from the database of ISTAT. During the preliminary phase of the analysis, the multicollinearity of the dataset’s variables was assessed by calculating Variation Inflation Factor (VIF). All variables with a VIF greater than 10 were iteratively removed from the dataset.
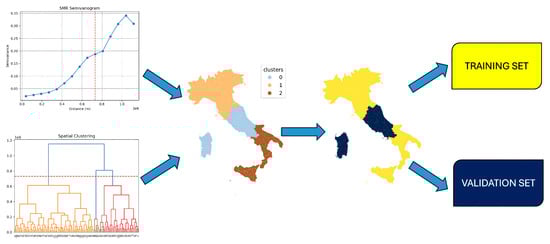
Figure 3.
Application of a hierarchical clustering algorithm combined with a semivariogram plot of standardized mortality ratio rates. This integrated approach delineates three spatially contiguous communities, effectively addressing potential spatial data leakage.
We identified groups of neighboring provinces (clusters) that were used separately in the training and testing phases to prevent data leakage between spatially correlated observations. These clusters of provinces were determined using a combination of methods. The analysis involved utilizing a hierarchical clustering approach on the matrix containing Euclidean distances calculated between provinces. Additionally, the semivariogram graph of the standardized mortality ratios (SMRs) was employed to determine the optimal stopping point for the hierarchical clustering process. The spatial range derived from the semivariogram, which indicates the distance at which data points are considered to no longer exhibit correlation, was visually estimated. This was performed by identifying the point where the plot leveled off (the plateau), indicating that the variance no longer increased significantly with distance.
To minimize spatial bias during the assessment of the regression performance, we implemented a leave-one-cluster-out cross-validation approach. This method was used to evaluate the predictive accuracy of three ensemble models: Gradient Boosting [28], Random Forest [29], and XGBoost [30]. To compare the performance of these models, we calculated the coefficient of determination (), the mean absolute error (MAE), and the root mean squared error (RMSE). In addition, we identified the most influential features for the model using the SHAP algorithm, an approach from explainable artificial intelligence.
2.2. Multicollinearity Analysis
The Variation Inflation Factor (VIF) is a statistical measure used to quantify the severity of multicollinearity in a regression analysis. It measures how strongly the independent variables are correlated and indicates how much the variance of the regression coefficients is inflated due to this correlation.
In this study, we computed VIF to identify and address multicollinearity in the dataset. We applied an iterative method, where the VIF was recalculated multiple times, removing the variable with the highest VIF in each step if its value exceeded 10. This approach helped to minimize multicollinearity; it improved the reliability of the coefficient estimates and allowed us to obtain more accurate results with the SHAP algorithm [31].
The variables removed after this analysis were as follows: mean pm2.5, income, bed number, mean CO, and mean NO.
2.3. Leave-One-Group-Out Cross-Validation
To prevent information leakage between observations with spatial dependencies, we employed a leave-one-group-out cross-validation (LOGOCV) approach, where the groups were defined based on spatial clusters identified through the semivariogram of the standardized mortality ratios (SMRs).
The semivariogram, a geostatistical tool, was used to quantify spatial autocorrelation and determine the spatial range at which SMR values became uncorrelated. This range informed the creation of spatially contiguous clusters using hierarchical clustering applied to the Euclidean distances between provinces. During LOGOCV, each cluster was sequentially held out as the validation set, while the model was trained on the remaining clusters.
This method ensured that spatially correlated data were not split between training and validation phases, thereby maintaining the integrity of the evaluation process and providing a robust assessment of the model’s predictive performance in the presence of spatial dependencies.
From the semivariogram of the SMRs, we defined three clusters by applying a threshold to the dendrogram created from the hierarchical clustering of geographic distances between Italian provinces.
2.4. Machine Learning Models
The goal of our analysis was to compare the performance of three different machine learning models, Gradient Boosting (GB), Random Forest (RF), and XGBoost (XGB), to predict mortality for endocrine, nutritional, and metabolic diseases through geolocalized data. Furthermore, a linear regression model was trained to show how decision tree-based models perform better for this type of analysis than a simpler regression model.
Gradient Boosting is an ensamble machine learning model that combines the strengths of multiple weak learners to create a stronger one. The algorithm works iteratively, where each subsequent model is trained to minimize the residual errors (i.e., the differences between predicted and actual values) of the preceding model using a gradient descent approach. By sequentially adding models, Gradient Boosting reduces bias and variance, improving overall performance. Hyperparameters such as the learning rate, maximum tree depth, and number of estimators play a critical role in controlling the model’s complexity and preventing overfitting. We optimized the regression in cross-validation by varying the GB parameters, including the following:
Random Forest regressor is an ensemble learning algorithm used for its robustness and ability to handle high-dimensional data. It operates by constructing a multitude of decision trees during training and combines their outputs to produce a final prediction through averaging. The algorithm introduces randomness by using bootstrapped samples of the data to train each tree and by selecting a random subset of features at each split. This approach reduces overfitting and improves generalization compared to individual decision trees. We improved regression performance during cross-validation by tuning the RF parameters, such as the following:
XGBoost (Extreme Gradient Boosting) is a high-performance implementation of the Gradient Boosting algorithm and is designed to optimize both computational efficiency and predictive accuracy. XGBoost builds an ensemble of decision trees sequentially, where each tree aims to reduce the residual errors of its predecessors using a gradient descent method. Its enhancements include tree pruning, regularization terms in the loss function, and support for parallel and distributed computation, making it faster and more robust than traditional gradient boosting techniques. We enhanced the regression accuracy in cross-validation by adjusting the following XGB parameters:
We evaluated the performance of the three machine models by computing the coefficient of determination , the mean absolute error , and the root mean squared error :
- Coefficient of determination:
- Mean absolute error:
- Root mean squared error:where are the observed values, are the predicted ones, and is their average value.
2.5. Explanation of the Features
To interpret the results of our machine learning models and identify the most influential predictors, we utilized SHAP (SHapley Additive exPlanations), a state-of-the-art algorithm for explainable artificial intelligence (XAI). SHAP provides a unified framework for quantifying the contribution of each feature to the model’s predictions, offering both global and local interpretability.
The SHAP method is based on cooperative game theory, where each feature is treated as a “player” in a predictive game, and its contribution to the final prediction is assessed in terms of Shapley values. These values are calculated by considering the marginal contribution of a feature across all possible subsets of features, ensuring fairness and consistency. Unlike traditional feature importance methods, SHAP assigns feature contributions in a manner that accounts for interactions and dependencies among predictors:
where x is an instance, the sum is over all the subsets S of features that include the feature j, is a weight parameter that multiplies all of the permutations of S! by the potential permutations of the remaining class that does not belong to S, and and denote the regression score obtained by including and removing, respectively, feature j.
In this study, we used SHAP to generate explanations for the predictions of our ensemble models. Specifically, SHAP summary plots were employed to visualize the overall importance of each feature across the dataset. This analysis provided valuable insights into how different variables, such as pollution levels, socio-economic indicators, and mortality data, influenced the model’s predictions.
3. Results
The aim of this work was to quantify whether and how much air pollution and socio-economic indices impact mortality due to endocrine, nutritional, and metabolic diseases.
3.1. Regression Performance
In order to validate the regression performance, we grouped the Italian provinces into three distinct clusters. To ensure a reliable evaluation of model performance, we implemented a leave-one-cluster-out validation approach on each of the three different models. The performance of the models was evaluated quantitatively by calculating the average metrics obtained from the validation set. The results of the models’ metrics are shown in Table 1.

Table 1.
Performance of different regression models.
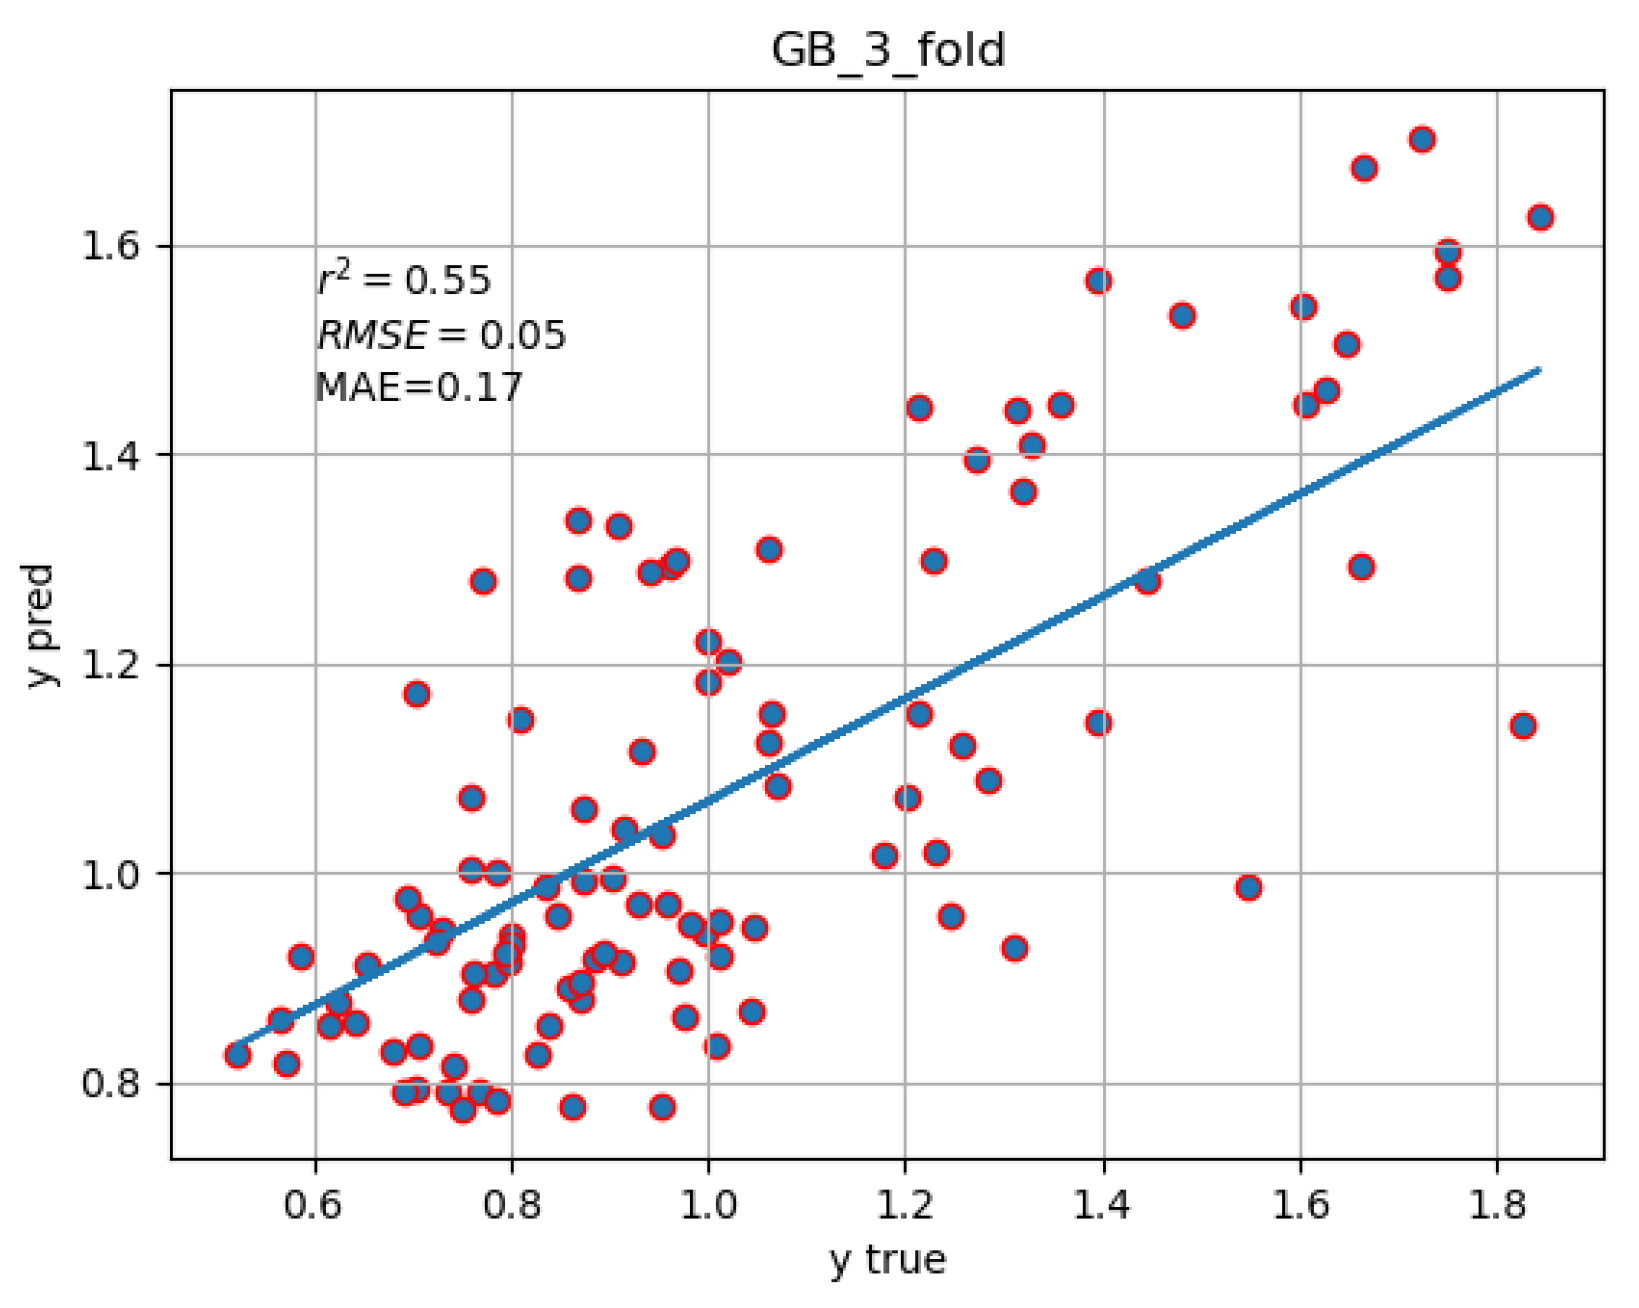
The Gradient Boosting regressor emerged as the best in predicting the SMR for endocrine, nutritional, and metabolic diseases with an of 0.55. The scatter plot of the predicted SMR vs. the real ones is shown in Figure 4.

Figure 4.
Scatter plot of the predicted SMR values (y-axis) generated by the Gradient Boosting (GB) model against the observed SMR values (x-axis) for endocrine, nutritional, and metabolic diseases across 107 Italian provinces. The blue line represents the line of best fit, illustrating the correlation between the predicted and observed values.
3.2. Interpretation of Models Through SHAP Values
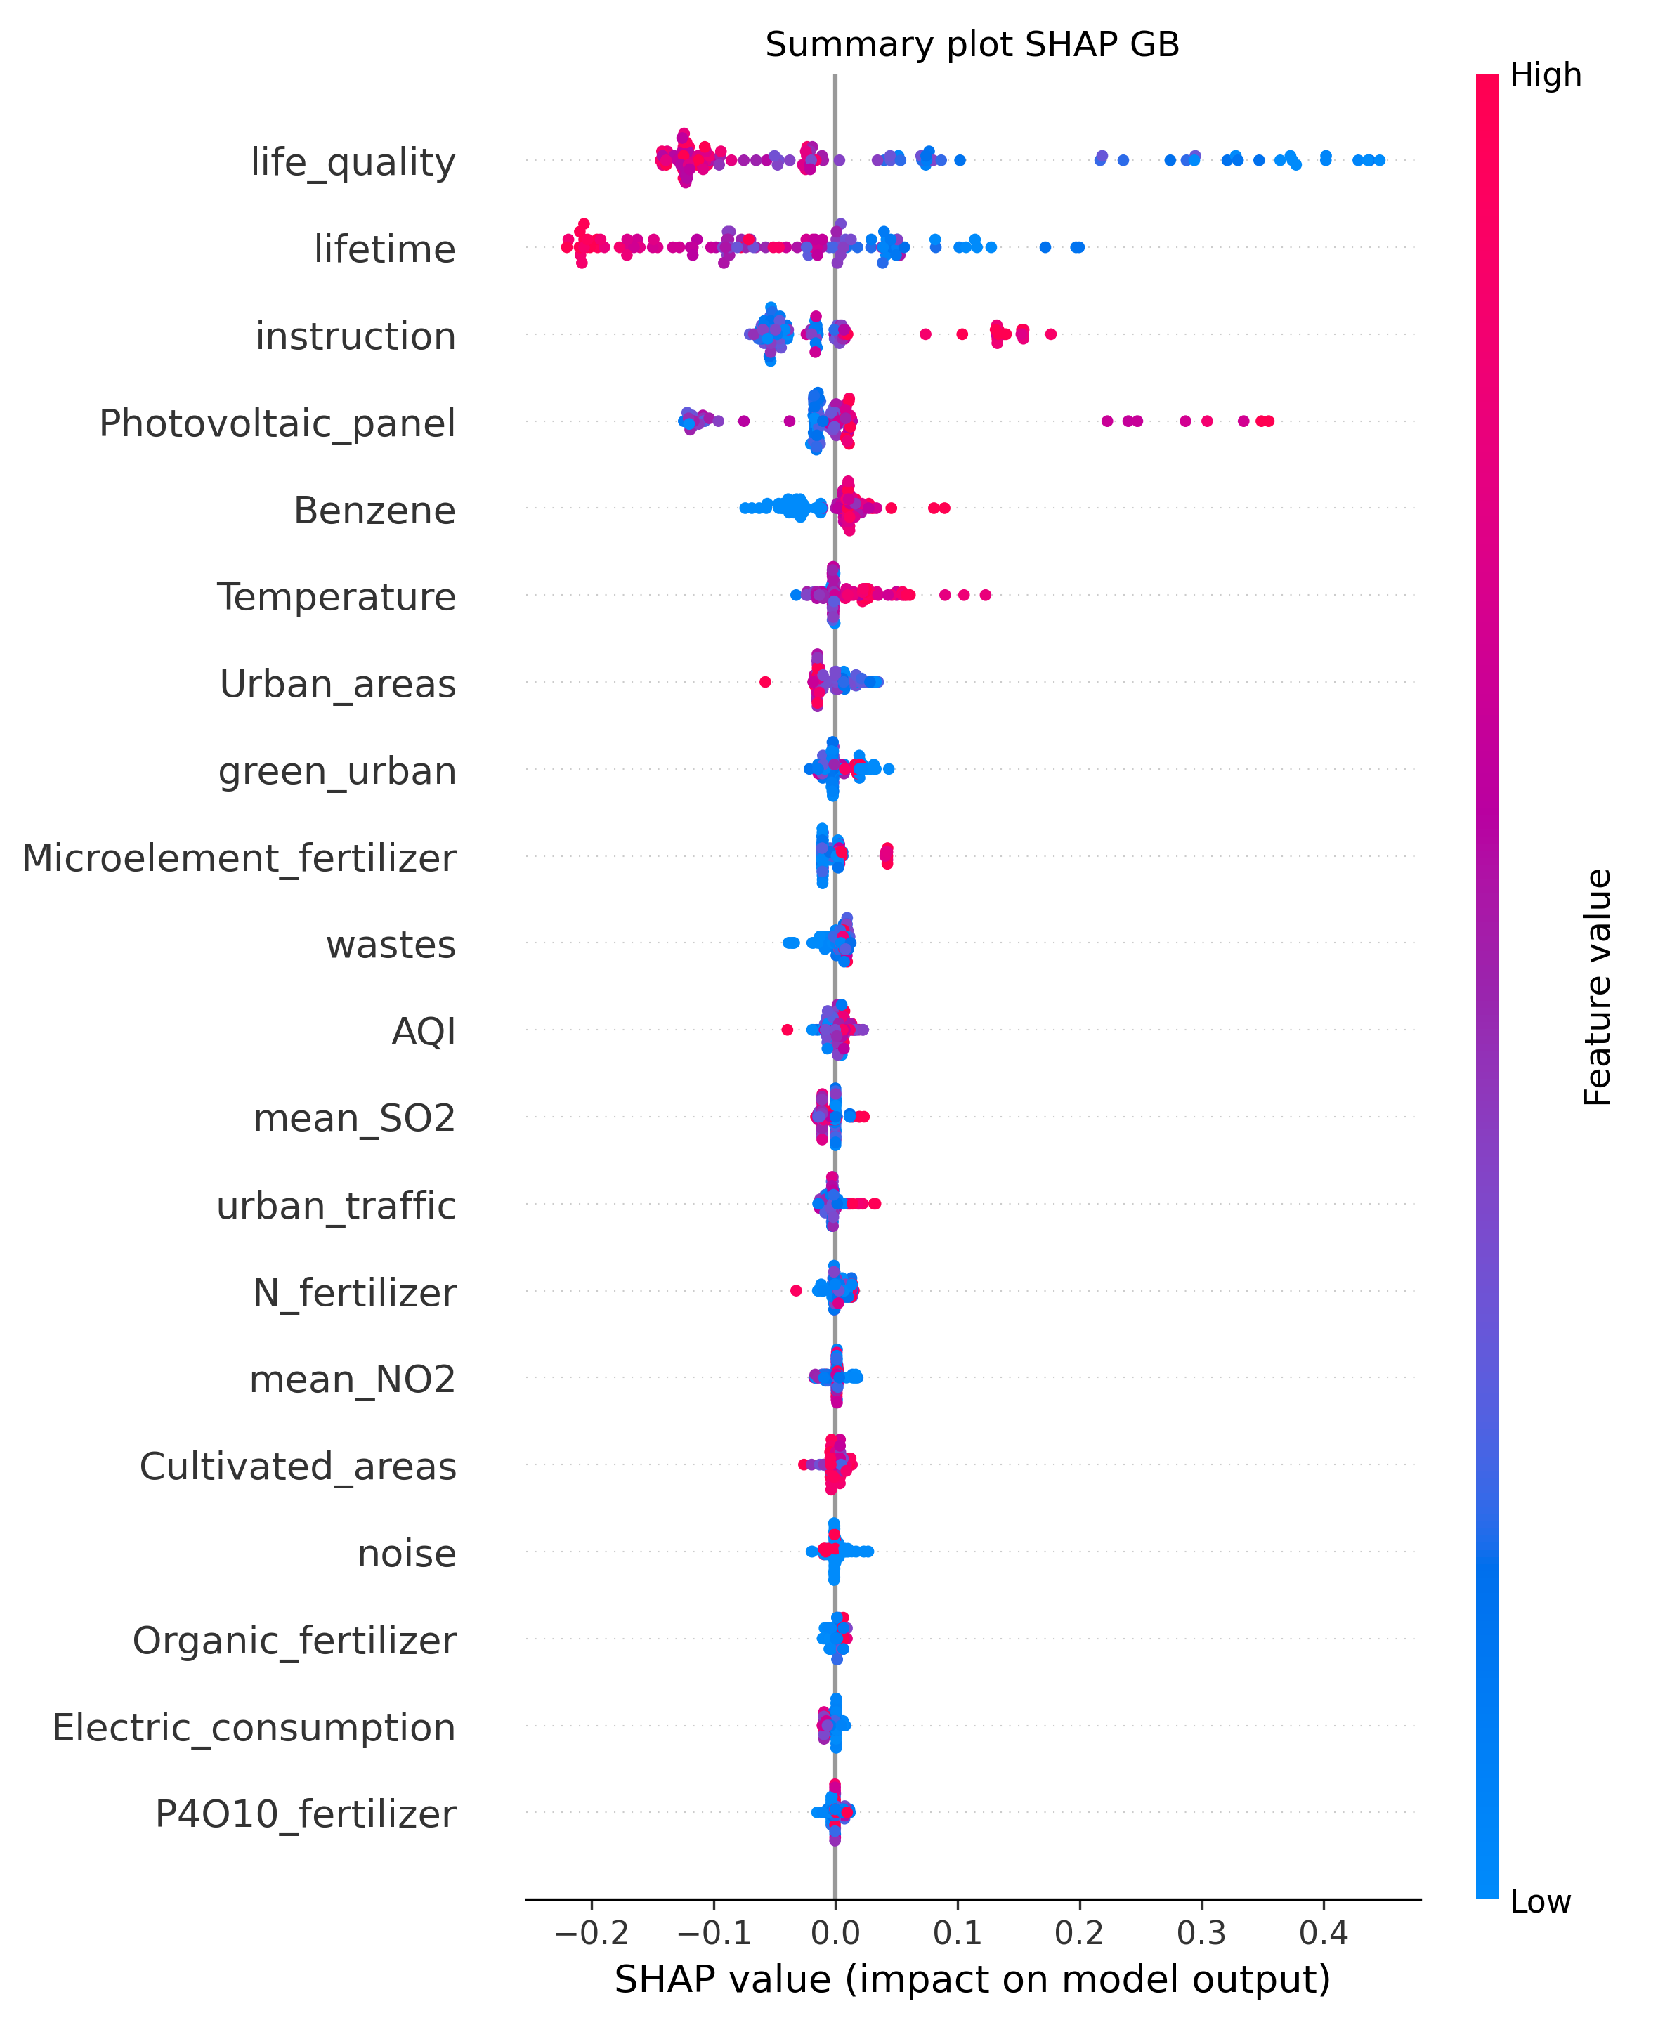
Figure 5 shows the feature importance obtained with SHAP from the best regression model, GB. The analysis identifies life quality and lifetime as the most influential features. Features such as instruction, benzene, and temperature also contribute to the predictions, although with lower SHAP values. The plot shows both the magnitude and direction of the impact for each feature, with higher SHAP values indicating a stronger influence on the predicted mortality rates. The x-axis represents the SHAP values, showing the range and direction of the impact a feature has on the model’s predictions. Positive SHAP values indicate an increase in the prediction of a higher value of outcome, while negative values indicate an increase in the prediction of a lower value of outcome. Points are color-coded to reflect the feature’s value for the observation. Red is used for high feature values and blue for low values, helping to show how the feature value correlates with its impact.

Figure 5.
SHAP summary plot that visualizes the relative importance of features in the Gradient Boosting (GB) model for predicting mortality due to endocrine, nutritional, and metabolic diseases. The y-axis lists the features ranked by their average SHAP value, with the most influential features at the top. The x-axis represents the SHAP values, indicating the impact of each feature on the model’s predictions.
4. Discussion
This study analyzed the association between air pollution and mortality from endocrine, nutritional, and metabolic diseases, including geolocalized data on CO, NO, NO2, O3, PM10, PM2.5, and SO2, and considering demographic and socio-economic variations such as age and gender. The standardized mortality ratio (SMR) was calculated as the ratio between observed deaths in a provincial area and expected ones. Our analysis revealed that the majority of the input variables examined in this study exhibited weak correlations with the target variable, the standardized mortality ratio (SMR). However, the Gradient Boosting model demonstrated a strong predictive accuracy, particularly for provinces with SMR values above the mean. The model achieved a coefficient of determination (r2) of 0.55 and a mean absolute error (MAE) of 0.17, indicating its effectiveness in capturing the relationship between environmental pollution and mortality from endocrine, nutritional, and metabolic diseases. These results highlight the significant role of environmental factors in influencing health outcomes and suggest that such findings should be integrated with other risk factors in studies exploring individual-level risk assessments, including personalized health contexts. Additionally, the application of Explainable AI (XAI) techniques provided valuable insights into the most influential global and local variables driving the model’s predictions. The SHAP algorithm was used to identify the most influential variables in the model, highlighting the link between environmental factors, socio-economic factors, and population health. Quality of life emerged as the most important factor: in areas where it was higher, lower mortality rates were observed [32,33]. This result emphasizes how a healthy lifestyle, access to services, and a favorable environment can positively impact health. At the same time, life expectancy is closely linked to mortality rates: in areas where people live shorter lives, the impact of endocrine diseases seems to be particularly relevant. High values of the variable photovoltaic panel significantly influenced the GB regressor’s predictions of elevated mortality rates for endocrine, nutritional, and metabolic diseases. However, this pattern can be attributed to the geographic distribution of photovoltaic panels in Italy. Provinces with a density of solar panels per square kilometer exceeding the national average are predominantly located in southern Italy, the same region with a higher SMR for these diseases. Although no scientific studies have examined a direct correlation between the percentage of students who did not complete primary education (variable instruction) and deaths from endocrine, nutritional, and metabolic diseases, it is well established that lower education levels are associated with less healthy behaviors and reduced access to health information factors that can negatively impact overall health [34,35]. Education plays a crucial role in the prevention and management of chronic diseases, including endocrine, nutritional, and metabolic disorders. Therefore, while there is no direct evidence of a specific correlation, it is plausible that a higher dropout rate may indirectly contribute to an increase in mortality from these conditions. Among the pollutants analyzed, benzene stands out for its correlation with higher mortality rates. This is concerning, considering that benzene is often produced by activities such as vehicular traffic and combustion [36]. A higher average annual temperature was associated with a greater probability of mortality from endocrine, nutritional, and metabolic diseases according to the model used, in line with the results presented in the literature [37]. Air quality and the average concentration of NO2 were also strongly linked to mortality, confirming the role of air pollution in the development of chronic diseases [38,39,40]. As for socio-economic and agricultural factors, such as the use of fertilizers, especially those with microelements, they suggested a relationship with rural environments and chemical exposures linked to agriculture. Research has revealed that individuals working in the fertilizer industry tend to have elevated levels of Cd and Pb in their biological samples, compared to healthy individuals who are either unexposed or exposed across all age groups. This outcome is likely linked to the buildup of toxic metals stemming from fertilizer contamination [41]. The study in question has limitations that may influence the interpretation of the results and their applicability in a broader context. Below are the main critical aspects explained. The analysis was based on data collected at the provincial level, treating each province as a homogeneous entity. However, within provinces, there are significant differences in population density, such as those between densely populated urban areas and sparsely inhabited rural areas. In this work, it was assumed that the entire population of a province is exposed to the same levels of air pollutants. Moreover, the moderate suggests that some predictors may have been omitted from the model, likely due to their absence from the dataset used for analysis. This limitation should be acknowledged, as it may affect the model’s ability to fully capture the complexity of the interactions between air pollutants and endocrine, metabolic, and nutritional diseases. In fact, it is known from the literature that eating habits and physical activity have an impact on the onset of these types of diseases [42,43]. Although the study was observational in nature and identified associations between air pollutants and endocrine/metabolic diseases, it could not establish a direct causal relationship. This means that the results could be influenced by confounding factors not considered, necessitating further analysis to confirm the actual causes. Finally, the feature benzene, identified as a pollutant with a significant impact on mortality, was not considered in terms of its specific sources (e.g., vehicle traffic or industrial activities) nor were other exposures that could interact with benzene considered, making it difficult to assign precise responsibility to this pollutant.
5. Conclusions
This study demonstrates the potential of machine learning (ML) models to identify the likelihood of mortality from endocrine, nutritional, and metabolic diseases by analyzing environmental pollution and socio-economic data at the provincial level in Italy. By integrating diverse data streams, including air quality metrics, socio-demographic variables, and health records, we provided a comprehensive framework for investigating complex relationships between environmental exposures and public health outcomes.
Our findings reveal that key predictors of mortality are not limited to air pollutant concentrations but also encompass socio-economic factors such as life quality. The use of interpretable ML techniques, such as Shapley Additive Explanations (SHAP), allowed us to uncover the relative importance of each feature and provided valuable insights into the underlying mechanisms linking environmental and social factors to health risks.
The performance of the models, while promising, highlights the need for further refinement. Future work should focus on incorporating additional datasets, such as longitudinal data, to improve the robustness and generalizability of the models. Moreover, enhancing spatial resolution and integrating behavioral and genetic data could provide a more granular understanding of individual and community-level risks.
This work underscores the importance of leveraging data-driven approaches to address pressing public health challenges. Policymakers and stakeholders can use these findings to design targeted interventions aimed at reducing health disparities and mitigating the effects of environmental pollution on vulnerable populations. By advancing our understanding of the interplay between environmental, socio-economic, and health conditions, this research lays the groundwork for more informed and equitable public health strategies.
Author Contributions
Conceptualization, D.R. and S.T.; methodology, D.R., P.N., D.D. and S.T.; software, D.R. and D.D.; validation, D.R., P.N., D.D., P.D.B., R.B. and S.T.; investigation, D.R. and P.N.; data curation, D.R.; writing—original draft preparation, D.R., M.M., P.N. and S.T.; writing—review and editing, D.R., M.M., P.N., P.D.B., D.D., N.A., A.M., R.B. and S.T.; visualization, D.R., D.D. and S.T.; supervision, S.T. All authors have read and agreed to the published version of the manuscript.
Funding
This paper was supported by the METROFOOD-IT project, funded by the European Union—NextGenerationEU, PNRR—Mission 4 “Education and Research” Component 2: from research to business, Investment 3.1: Fund for the realization of an integrated system of research and innovation infrastructures—IR0000033 (D.M. Prot. n.120 del 21 June 2022), research project INFN-CSN5 AIM_MIA (Artificial Intelligence in Medicine: focus on Multi-Input Analysis); The National Recovery and Resilience Plan (NRRP), Mission 4 Component 2 Investment 1.4—Call for tender No. 3138 of 16 December 2021 of Italian Ministry of University and Research funded by the European Union—NextGenerationEU. Project title: “National Centre for HPC, Big Data and Quantum Computing”, Project code: CN00000013, Concession Decree No. 1031 of 17 February 2022 adopted by the Italian Ministry of University and Research, CUP H93C22000450007.
Institutional Review Board Statement
Not applicable.
Data Availability Statement
The data that support the findings of this study are either publicly available on databases cited in the bibliography or available from the corresponding author on request.
Acknowledgments
The authors are thankful for the resources made available by ReCaS, a project funded by the MIM (Italian Ministry for Education and Merit) in the “PON Ricerca e Competitività 2007–2013-Azione I-Interventi di rafforzamento strutturale” , Avviso 254/Ric, Universitá degli Studi di Bari.
Conflicts of Interest
The authors declare no conflicts of interest.
References
- World Health Organization. Noncommunicable Diseases Progress Monitor 2018; World Health Organization: Geneva, Switzerland, 2018. [Google Scholar]
- The Italian National Institute of Statistics. Italian National Health Statistics Report 2021; ISTAT: Chicago, IL, USA, 2021. Available online: https://www.istat.it (accessed on 1 November 2023).
- Michels, A.W.; Redondo, M.J.; Atkinson, M.A. The pathogenesis, natural history, and treatment of type 1 diabetes: Time (thankfully) does not stand still. Lancet Diabetes Endocrinol. 2022, 10, 90–92. [Google Scholar] [PubMed]
- Kim, S.H.; Lee, S.Y.; Kim, C.W.; Suh, Y.J.; Hong, S.; Ahn, S.H.; Seo, D.H.; Nam, M.S.; Chon, S.; Woo, J.T.; et al. Impact of socioeconomic status on health behaviors, metabolic control, and chronic complications in type 2 diabetes mellitus. Diabetes Metab. J. 2018, 42, 380. [Google Scholar] [PubMed]
- Myers, S.S.; Smith, M.R.; Guth, S.; Golden, C.D.; Vaitla, B.; Mueller, N.D.; Dangour, A.D.; Huybers, P. Climate change and global food systems: Potential impacts on food security and undernutrition. Annu. Rev. Public Health 2017, 38, 259–277. [Google Scholar] [PubMed]
- Yen, F.S.; Wei, J.C.C.; Chiu, L.T.; Hsu, C.C.; Hwu, C.M. Diabetes, hypertension, and cardiovascular disease development. J. Transl. Med. 2022, 20, 9. [Google Scholar]
- Bommer, C.; Heesemann, E.; Sagalova, V.; Manne-Goehler, J.; Atun, R.; Bärnighausen, T.; Vollmer, S. The global economic burden of diabetes in adults aged 20–79 years: A cost-of-illness study. Lancet Diabetes Endocrinol. 2017, 5, 423–430. [Google Scholar]
- Pagano, E.; De Rosa, M.; Rossi, E.; Cinconze, E.; Marchesini, G.; Miccoli, R.; Vaccaro, O.; Bonora, E.; Bruno, G. The relative burden of diabetes complications on healthcare costs: The population-based CINECA-SID ARNO Diabetes Observatory. Nutr. Metab. Cardiovasc. Dis. 2016, 26, 944–950. [Google Scholar]
- Di Cesare, M.; Khang, Y.H.; Asaria, P.; Blakely, T.; Cowan, M.J.; Farzadfar, F.; Guerrero, R.; Ikeda, N.; Kyobutungi, C.; Msyamboza, K.P.; et al. Inequalities in non-communicable diseases and effective responses. Lancet 2013, 381, 585–597. [Google Scholar]
- Pope, C.A.; Dockery, D.W. Health effects of fine particulate air pollution: Lines that connect. J. Air Waste Manag. Assoc. 2006, 56, 709–742. [Google Scholar]
- Thurston, G.D.; Kipen, H.; Annesi-Maesano, I.; Balmes, J.; Brook, R.D.; Cromar, K.; De Matteis, S.; Forastiere, F.; Forsberg, B.; Frampton, M.W.; et al. A joint ERS/ATS policy statement: What constitutes an adverse health effect of air pollution? An analytical framework. Eur. Respir. J. 2017, 49, 1600419. [Google Scholar]
- Monaco, A.; Lacalamita, A.; Amoroso, N.; D’Orta, A.; Del Buono, A.; di Tuoro, F.; Tangaro, S.; Galeandro, A.I.; Bellotti, R. Random forests highlight the combined effect of environmental heavy metals exposure and genetic damages for cardiovascular diseases. Appl. Sci. 2021, 11, 8405. [Google Scholar] [CrossRef]
- Braveman, P.A.; Egerter, S.; Williams, D.R. The social determinants of health: Coming of age. Annu. Rev. Public Health 2011, 32, 381–398. [Google Scholar] [CrossRef] [PubMed]
- Rajkomar, A.; Dean, J.; Kohane, I. Machine learning in medicine. N. Engl. J. Med. 2019, 380, 1347–1358. [Google Scholar] [CrossRef] [PubMed]
- Lundberg, S.M.; Lee, S.I. A Unified Approach to Interpreting Model Predictions. In Proceedings of the Advances in Neural Information Processing Systems, NeurIPS, Long Beach, CA, USA, 4–9 December 2017; Volume 30. [Google Scholar]
- Romano, D.; Novielli, P.; Diacono, D.; Cilli, R.; Pantaleo, E.; Amoroso, N.; Bellantuono, L.; Monaco, A.; Bellotti, R.; Tangaro, S. Insights from Explainable Artificial Intelligence of Pollution and Socioeconomic Influences for Respiratory Cancer Mortality in Italy. J. Pers. Med. 2024, 14, 430. [Google Scholar] [CrossRef] [PubMed]
- Tangaro, S.; Amoroso, N.; Brescia, M.; Cavuoti, S.; Chincarini, A.; Errico, R.; Inglese, P.; Longo, G.; Maglietta, R.; Tateo, A.; et al. Feature selection based on machine learning in MRIs for hippocampal segmentation. Comput. Math. Methods Med. 2015, 2015, 814104. [Google Scholar] [CrossRef]
- Novielli, P.; Romano, D.; Magarelli, M.; Diacono, D.; Monaco, A.; Amoroso, N.; Vacca, M.; De Angelis, M.; Bellotti, R.; Tangaro, S. Personalized identification of autism-related bacteria in the gut microbiome using explainable artificial intelligence. iScience 2024, 27, 110709. [Google Scholar] [CrossRef] [PubMed]
- Romano, D.; Novielli, P.; Cilli, R.; Amoroso, N.; Monaco, A.; Bellotti, R.; Tangaro, S. Air pollution and mortality for cancer of the respiratory system in Italy: An explainable artificial intelligence approach. Front. Public Health 2024, 12, 1344865. [Google Scholar] [CrossRef]
- Thunis, P.; Degraeuwe, B.; Pisoni, E.; Meleux, F.; Clappier, A. Analyzing the efficiency of short-term air quality plans in European cities, using the CHIMERE air quality model. Air Qual. Atmos. Health 2017, 10, 235–248. [Google Scholar] [CrossRef]
- Hass, H.; Ebel, A.; Feldmann, H.; Jakobs, H.; Memmesheimer, M. Evaluation studies with a regional chemical transport model (EURAD) using air quality data from the EMEP monitoring network. Atmos. Environ. Part A Gen. Top. 1993, 27, 867–887. [Google Scholar] [CrossRef]
- Duarte, E.D.S.F.; Franke, P.; Lange, A.C.; Friese, E.; da Silva Lopes, F.J.; da Silva, J.J.; dos Reis, J.S.; Landulfo, E.; e Silva, C.M.S.; Elbern, H.; et al. Evaluation of atmospheric aerosols in the metropolitan area of São Paulo simulated by the regional EURAD-IM model on high-resolution. Atmos. Pollut. Res. 2021, 12, 451–469. [Google Scholar] [CrossRef]
- Hinestroza-Ramirez, J.E.; Lopez-Restrepo, S.; Yarce Botero, A.; Segers, A.; Rendon-Perez, A.M.; Isaza-Cadavid, S.; Heemink, A.; Quintero, O.L. Improving Air Pollution Modelling in Complex Terrain with a Coupled WRF–LOTOS–EUROS Approach: A Case Study in Aburrá Valley, Colombia. Atmosphere 2023, 14, 738. [Google Scholar] [CrossRef]
- Persson, C.; Langner, J.; Robertson, L. Air pollution assessment studies for Sweden based on the MATCH model and air pollution measurements. In Air Pollution Modeling and Its Application XI; Personalized identification of autism-related bacteria in the gut microbiome using explainable artificial intelligence; Springer: Boston, MA, USA, 1996; pp. 127–134. [Google Scholar]
- Joly, M.; Josse, B.; Plu, M.; Arteta, J.; Guth, J.; Meleux, F. High-Resolution Air Quality Forecasts with MOCAGE Chemistry Transport Model. In Air Pollution Modeling and its Application XXIV; Springer: Cham, Switzerland, 2016; pp. 563–565. [Google Scholar]
- Van Loon, M.; Vautard, R.; Schaap, M.; Bergström, R.; Bessagnet, B.; Brandt, J.; Builtjes, P.; Christensen, J.; Cuvelier, C.; Graff, A.; et al. Evaluation of long-term ozone simulations from seven regional air quality models and their ensemble. Atmos. Environ. 2007, 41, 2083–2097. [Google Scholar]
- Neary, L.; Kaminski, J.W.; Lupu, A.; McConnell, J.C. Developments and results from a global multiscale air quality model (GEM-AQ). In Air Pollution Modeling and Its Application XVII; Springer: Boston, MA, USA, 2007; pp. 403–410. [Google Scholar]
- Mayr, A.; Binder, H.; Gefeller, O.; Schmid, M. The evolution of boosting algorithms. Methods Inf. Med. 2014, 53, 419–427. [Google Scholar]
- Parmar, A.; Katariya, R.; Patel, V. A review on random forest: An ensemble classifier. In Proceedings of the International Conference on Intelligent Data Communication Technologies and Internet of Things (ICICI) 2018, Coimbatore, India, 7–8 August 2018; Springer: Cham, Switzerland, 2019; pp. 758–763. [Google Scholar]
- Azmi, S.S.; Baliga, S. An overview of boosting decision tree algorithms utilizing AdaBoost and XGBoost boosting strategies. Int. Res. J. Eng. Technol 2020, 7, 6867–6870. [Google Scholar]
- Aas, K.; Jullum, M.; Løland, A. Explaining individual predictions when features are dependent: More accurate approximations to Shapley values. Artif. Intell. 2021, 298, 103502. [Google Scholar] [CrossRef]
- Webb, S.M.; Crespo, I.; Santos, A.; Resmini, E.; Aulinas, A.; Valassi, E. Management of endocrine disease: Quality of life tools for the management of pituitary disease. Eur. J. Endocrinol. 2017, 177, R13–R26. [Google Scholar] [PubMed]
- Sonino, N.; Fava, G.A.; Fallo, F.; Boscaro, M. Psychological distress and quality of life in endocrine disease. Psychother. Psychosom. 1990, 54, 140–144. [Google Scholar] [PubMed]
- Klinker, C.D.; Aaby, A.; Ringgaard, L.W.; Hjort, A.V.; Hawkins, M.; Maindal, H.T. Health literacy is associated with health behaviors in students from vocational education and training schools: A Danish population-based survey. Int. J. Environ. Res. Public Health 2020, 17, 671. [Google Scholar] [CrossRef]
- Zajacova, A.; Lawrence, E.M. The relationship between education and health: Reducing disparities through a contextual approach. Annu. Rev. Public Health 2018, 39, 273–289. [Google Scholar]
- Cui, Y.; Mo, Z.; Ji, P.; Zhong, J.; Li, Z.; Li, D.; Qin, L.; Liao, Q.; He, Z.; Guo, W.; et al. Benzene exposure leads to lipodystrophy and alters endocrine activity in vivo and in Vitro. Front. Endocrinol. 2022, 13, 937281. [Google Scholar]
- Li, Y.; Cheng, Y.; Cui, G.; Peng, C.; Xu, Y.; Wang, Y.; Liu, Y.; Liu, J.; Li, C.; Wu, Z.; et al. Association between high temperature and mortality in metropolitan areas of four cities in various climatic zones in China: A time-series study. Environ. Health 2014, 13, 65. [Google Scholar]
- Saleem, A.; Awan, T.; Akhtar, M.F. A comprehensive review on endocrine toxicity of gaseous components and particulate matter in smog. Front. Endocrinol. 2024, 15, 1294205. [Google Scholar]
- Darbre, P.D. Overview of air pollution and endocrine disorders. Int. J. Gen. Med. 2018, 11, 191–207. [Google Scholar] [PubMed]
- Gea, M.; Fea, E.; Racca, L.; Gilli, G.; Gardois, P.; Schilirò, T. Atmospheric endocrine disruptors: A systematic review on oestrogenic and androgenic activity of particulate matter. Chemosphere 2024, 349, 140887. [Google Scholar] [PubMed]
- Ning, J.; Akhter, T.; Sarfraz, M.; Afridi, H.I.; Albasher, G.; Unar, A. The importance of monitoring endocrine-disrupting chemicals and essential elements in biological samples of fertilizer industry workers. Environ. Res. 2023, 231, 116173. [Google Scholar]
- Klasing, K.C. Nutritional diseases. In Diseases of Poultry; John Wiley & Sons: Hoboken, NJ, USA, 2013; pp. 1203–1232. [Google Scholar]
- Kerr, N.R.; Booth, F.W. Contributions of physical inactivity and sedentary behavior to metabolic and endocrine diseases. Trends Endocrinol. Metab. 2022, 33, 817–827. [Google Scholar]

Disclaimer/Publisher’s Note: The statements, opinions and data contained in all publications are solely those of the individual author(s) and contributor(s) and not of MDPI and/or the editor(s). MDPI and/or the editor(s) disclaim responsibility for any injury to people or property resulting from any ideas, methods, instructions or products referred to in the content. |
© 2025 by the authors. Published by MDPI on behalf of the International Institute of Knowledge Innovation and Invention. Licensee MDPI, Basel, Switzerland. This article is an open access article distributed under the terms and conditions of the Creative Commons Attribution (CC BY) license (https://creativecommons.org/licenses/by/4.0/).