1. Introduction
The socioeconomic development of a country directly influences the in demand for energy, resulting in the expansion of the infrastructure that supports it. This is reflected in the implementation of new substations, transmission, and distribution lines, and improvements to existing electrical networks, in which transformers play a crucial role. Oil power transformers represent assets with high added value, essential for the efficient operation of electrical energy transmission and distribution infrastructure [
1].
In the event of faults in these transformers, negative socioeconomic impacts occur, such as fines, legal proceedings, interruption in production, safety concerns, and environmental damage, among others. These impacts affect both energy suppliers and consumers [
2].
These elements have significantly impacted research and the development of methodologies with predictive and preventive maintenance approaches, aiming to mitigate the causes and consequences of unscheduled service stops. Therefore, understanding the health condition of the transformer and identifying possible initial failures has become an area of intense interest for both researchers and companies in the electrical sector, as evidenced by [
3]. The main objective of this focus is to reinforce security and continuity in energy supply.
Faults in transformers can originate from several sources, and, consequently, there are several assays and tests available for their detection. Among the possible causes, thermal and electrical stresses triggered by certain events, which result in the degradation of the insulating system, composed of oil and paper, can be diagnosed in the early stages [
3,
4,
5].
The dissolved gas analysis (DGA) can be measured using either the more popular method of extracting periodic samples and analyzing them in a laboratory or on-site using portable analytical equipment or continuous gas monitoring equipment installed in the transformer (high value added). Since significant gas concentration growth over a short period of time is a strong indicator of internal evolution failure, in this last example, the time interval between the periodic analyses varies according to the evolution of the gas concentrations detected between the previous and the new measurements. Under normal circumstances, this is usually reviewed once or twice a year; if failure is suspected, this period is decreased to months, weeks, or days, according to the degree of severity [
6,
7].
In this context, several approaches and algorithms have been developed with the support of computational intelligence, seeking to provide an accurate and effective diagnosis of the condition of oil transformers [
3,
4,
5]. However, the immediate adoption of these techniques by energy utilities is not yet common. This is due to the deep-rooted traditional use of standardized analytical methods, such as gas ratios, key gas, and relative percentage graphs (triangle, pentagon), among others, which are widely used in the evaluation of transformers. These procedures have encouraged companies to invest in tools aimed at optimizing the performance of power transformers (PT). Artificial neural networks (ANN) stand out as one of these tools.
Convolutional neural network (CNN) based approach is presented for classifying six types of discharge faults in power transformers in reference [
8]. The results obtained in the experiments demonstrate that the proposed method significantly outperforms conventional algorithms, such as linear and nonlinear support vector machines. In reference [
9], the potential of employing deep neural networks to uncover concealed patterns within vibration time series for early-stage prediction of transformer under-excitation, over-excitation, and interturn fault progression is explored.
The developed network designed for excitation voltage prediction demonstrates outstanding performance, achieving a relative absolute error of 0.56%. However, predicting interturn faults poses a more intricate challenge, with the constructed RNN for this task exhibiting a relative absolute error of 17.58%.
Artificial neural network (ANN) is employed to improve the precision of the Rogers ratio method in reference [
10]. However, it is important to acknowledge that the intricacy of an ANN requires substantial storage and computational resources. To tackle this challenge, an optimization approach is utilized with the aim of maximizing accuracy while minimizing the architectural complexity of the ANN. Consequently, post-optimization, the implemented ANN demonstrated a notable level of accuracy, reaching up to 90.7%.
A novel intelligent system utilizing dissolved gas analysis (DGA) with a dual purpose: to address the limitations of conventional methods and to enhance transformer diagnosis efficiency through the application of artificial intelligence techniques. The obtained area under the ROC curve and sensitivity average percentages of 98.78–95.19% (
p-value < 0.001), respectively, underscore the impressive performance of the proposed system, offering a fresh perspective on DGA analysis is presented in is presented in [
11].
In reference [
12], a multimodal mutual neural network is introduced for assessing the health of power transformers. The experimental findings demonstrate that the proposed approach achieves a high level of classification accuracy and provides precise health assessments for power transformers. Topics related to the application of artificial neural networks (ANNs) in the analysis of the operating conditions of power transformers and electrical energy systems have currently received attention [
13,
14,
15]. In recent years, a series of studies and research have been published in this field, demonstrating the growing interest and relevance of these approaches [
16,
17,
18,
19].
In this context, this study presents an innovative approach using a pattern recognition artificial neural network (PRN), aiming to diagnose the operating conditions of power transformers (normal operation, thermal faults, and electrical faults) based on combustible gases (H2 (hydrogen), CH4 (methane), C2H2 (acetylene), C2H4 (ethylene), and C2H6 (ethane)) present inside over time of use. The difference between this methodology and existing approaches in the literature lies in its remarkable accuracy, achieving a 98% accuracy rate in classification, with model validation reaching 100% accuracy and with a training time of just 2 s for the network with 5 neurons in the hidden layer and with 10 neurons, just 10 s of processing.
In contrast to conventional approaches that are limited to identifying a certain class of transformer failure, this research proposes a framework that allows for systematic testing with different configurations to optimize the performance of artificial neural networks. To put it simply, the method that was developed starts the training program over and again while adjusting the settings until the ideal weights are found and noted. Because the most effective parameters are stored, accuracy and efficiency are maximized throughout every training period. Selecting the best artificial neural networks (ANN) model architecture provides a more reliable methodology for practical applications, including pattern recognition skills that efficiently capture nonlinear interactions between input variables.
2. Dissolved Gas Analysis (DGA) Dataset
Three groupings of constituent gases are generated during the breakdown of transformer oil: H
2, CH
4, C
2H
2, C
2H
4, C
2H
6, and carbon oxides (CO and CO
2). The type and concentration of gas created because of the breakdown of insulating oil give clues about the potential transformer incipient fault type, as the creation of these fault gases is dependent on temperature [
5,
6].
Table 1 lists the gases that can originate because of insulation failure and potential transformer early failure [
6].
In thermal faults below 300 °C, ethane points to overheating of the paper or mineral oil, while methane suggests degradation of the insulating materials. At higher temperatures, between 300 °C and 700 °C, methane and ethylene indicate more serious faults, such as carbonization of the paper. Above 700 °C, the predominance of ethylene signals extreme conditions that can cause severe damage to the insulating system.
Electrical faults, on the other hand, are characterized by the presence of hydrogen in low-energy discharges and acetylene in high-energy arcs, indicating more intense and destructive electrical events. Regular analysis of dissolved gases is crucial for the early detection of these faults, allowing quick and effective interventions to prevent further damage and guarantee the continued safe operation of power transformers.
Reference [
20] is the standard for analyzing gases generated and dissolved in transformer-insulating oil. It covers everything from recommended practices for monitoring, analysis, diagnosis, and maintenance to the theory of gas creation and how it relates to faults. A totally dissolved combustible gas study examines the evolution rates of the gases (by kind and total value) and connects them to criteria for maintenance and monitoring during the transformer’s operational life. Under typical working conditions, the following are the limit values for gas concentrations specified in the standard [
20], expressed in μL/L (or ppm): H
2 = 100, CH
4 = 120, C
2H
2 = 1, C
2H
4 = 50, and C
2H
6 = 65.
The dataset is composed of 815 samples used for training and validation phases obtained from reference [
19,
20,
21,
22,
23,
24,
25]. The data is distributed as 691 normal operation samples, 52 thermal fault samples, and 72 electrical fault samples for five types of combustible gases (H
2, CH
4, C
2H
2, C
2H
4, and C
2H
6). The CO and CO
2 data were not used due to the absence of such data in some of the sources and because they were related to paper degradation [
20].
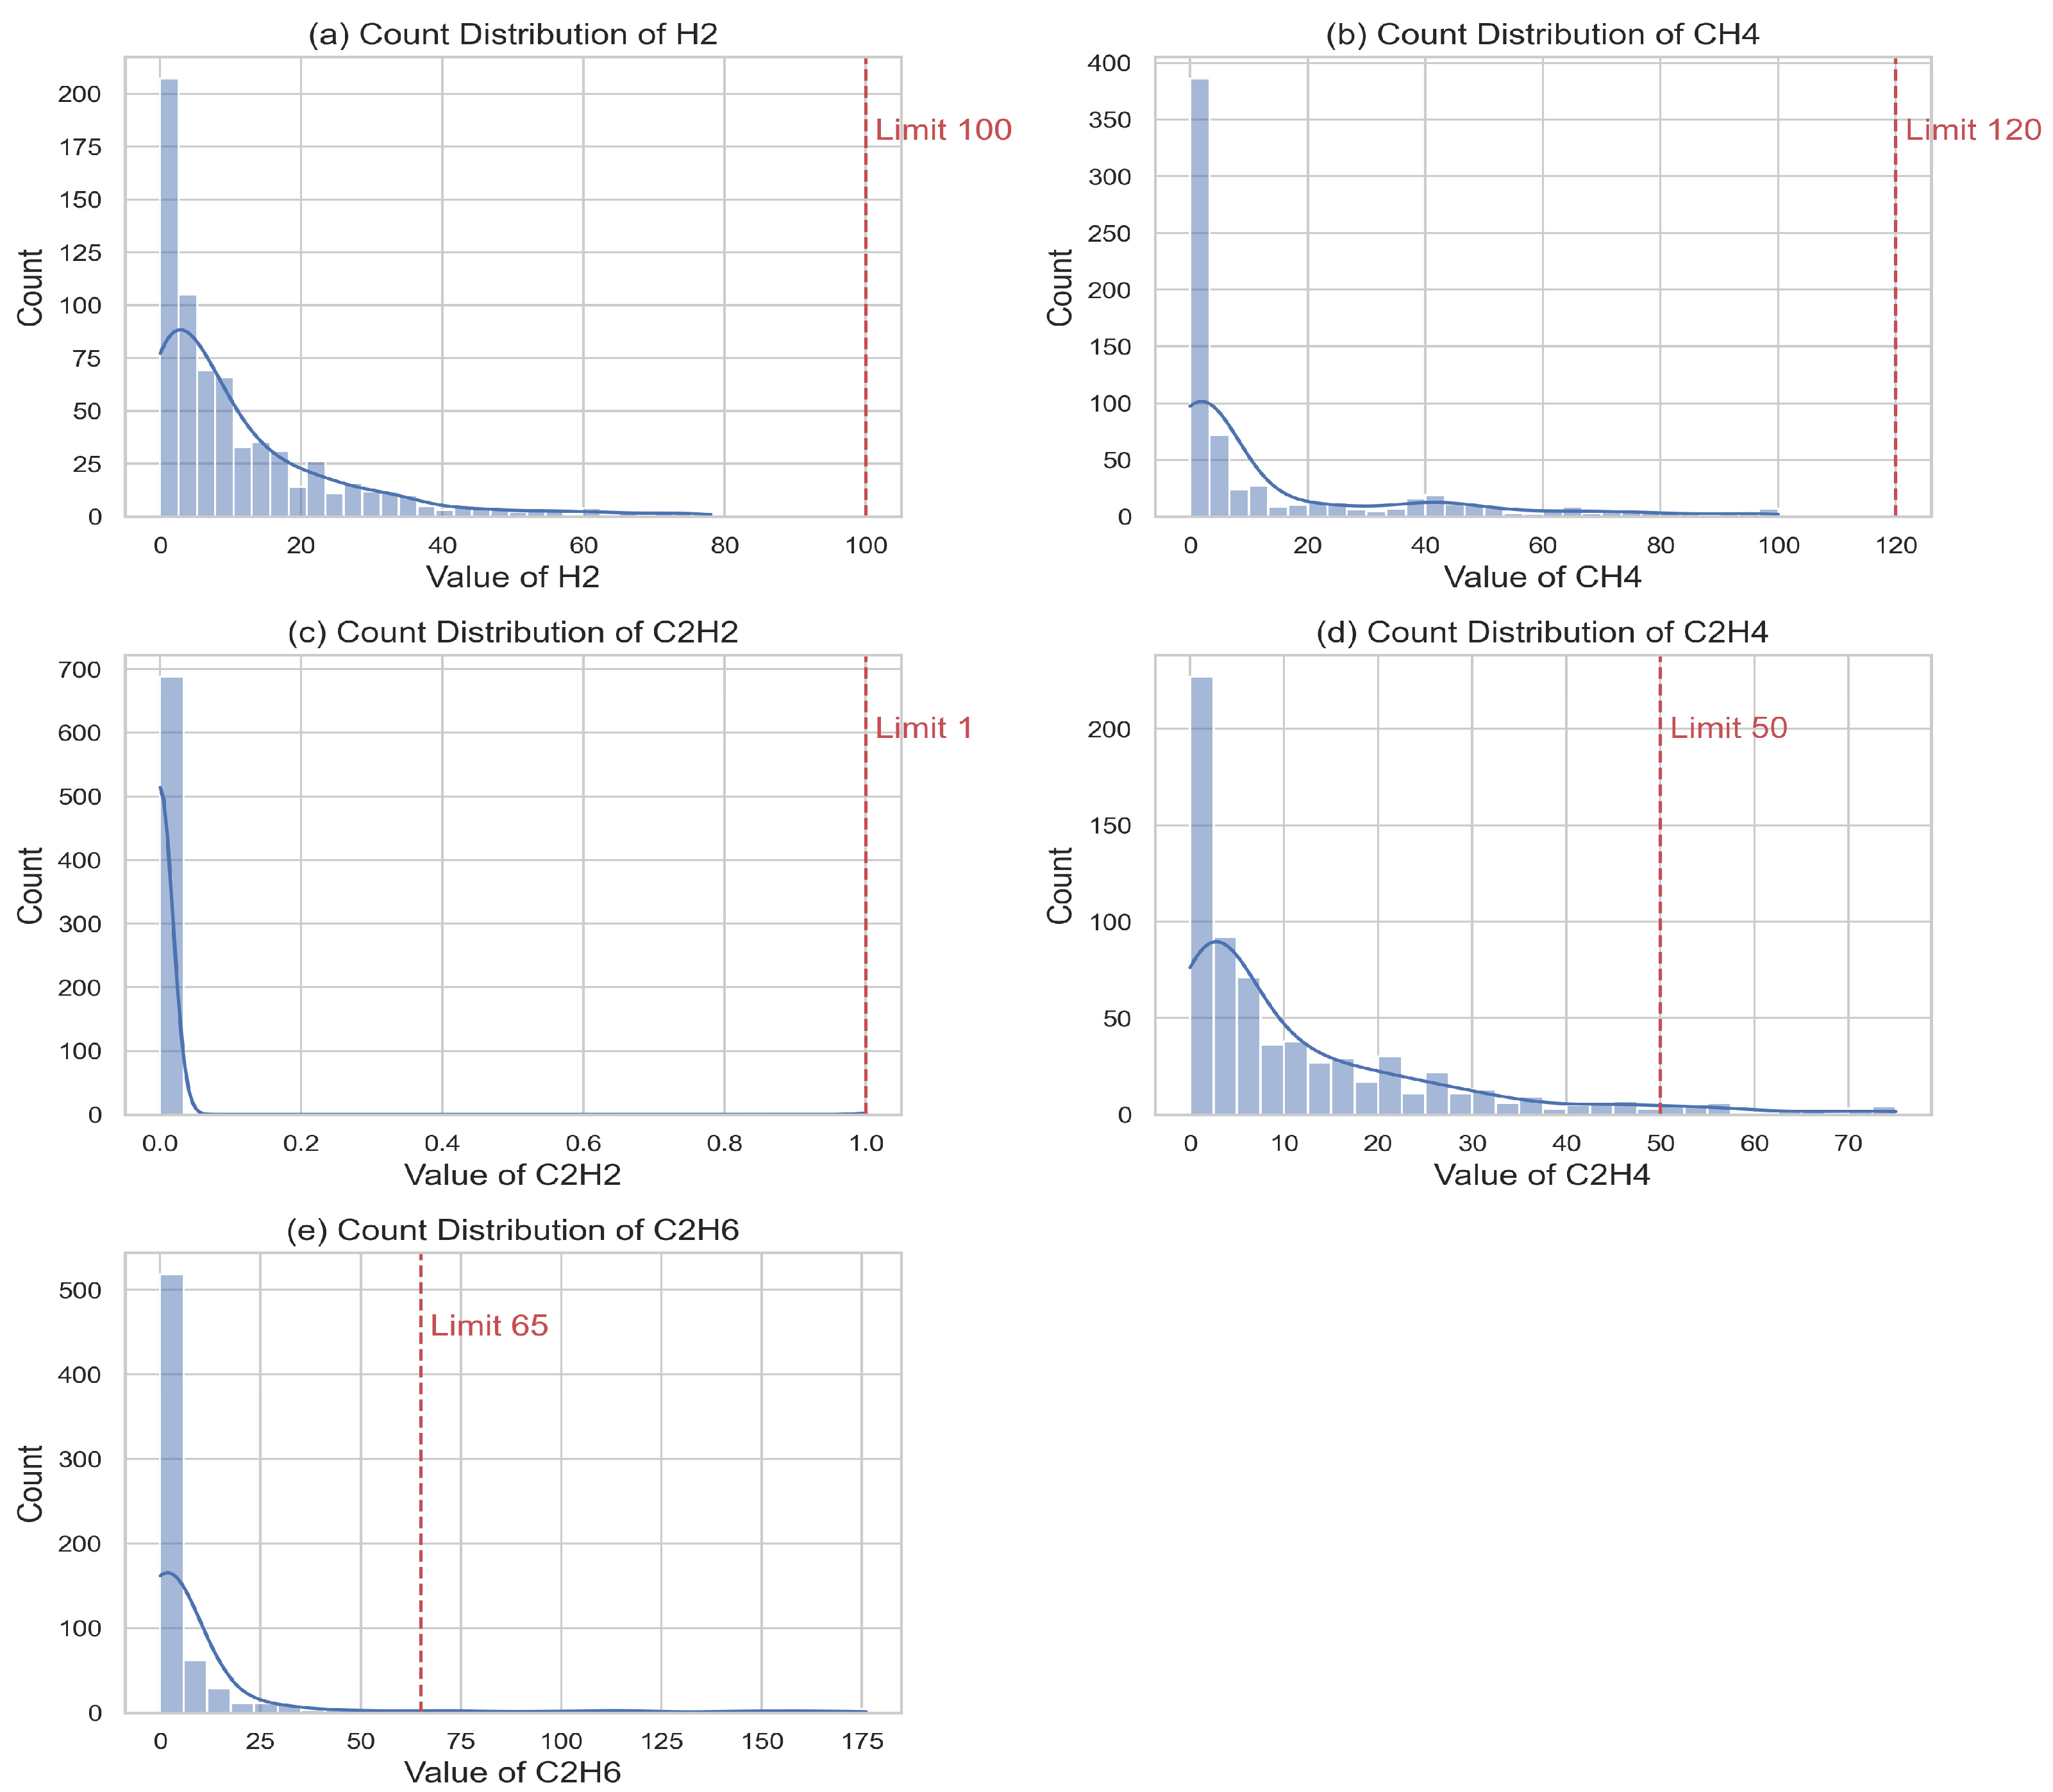
The histograms of the 691 normal concentration samples for a particular type of gas are shown in
Figure 1. The concentration limit for each gas at the transformer’s typical operating condition is shown by the dotted red vertical line. A condition that requires care may be indicated by values that exceed this limit.
In general, analysis of gases dissolved in insulating oil shows that power transformers function normally. Most of the hydrogen (H2) and methane (CH4) concentrations are below the 100 ppm and 120 ppm standards, respectively; therefore, they do not indicate impending electrical failures. Because the concentration of acetylene (C2H2) is less than the threshold limit of 1 ppm, there are no potentially harmful electrical arcs present. It is evident that certain samples of ethylene (C2H4) and ethane (C2H6) surpassed 50 ppm and 65 ppm in that order. However, the limits shown are references for evaluation, but the final decision on the condition of the transformer must consider the wider context, including age, loading, and rated power of the equipment. The analysis should be complemented with an expert assessment that considers all these factors.
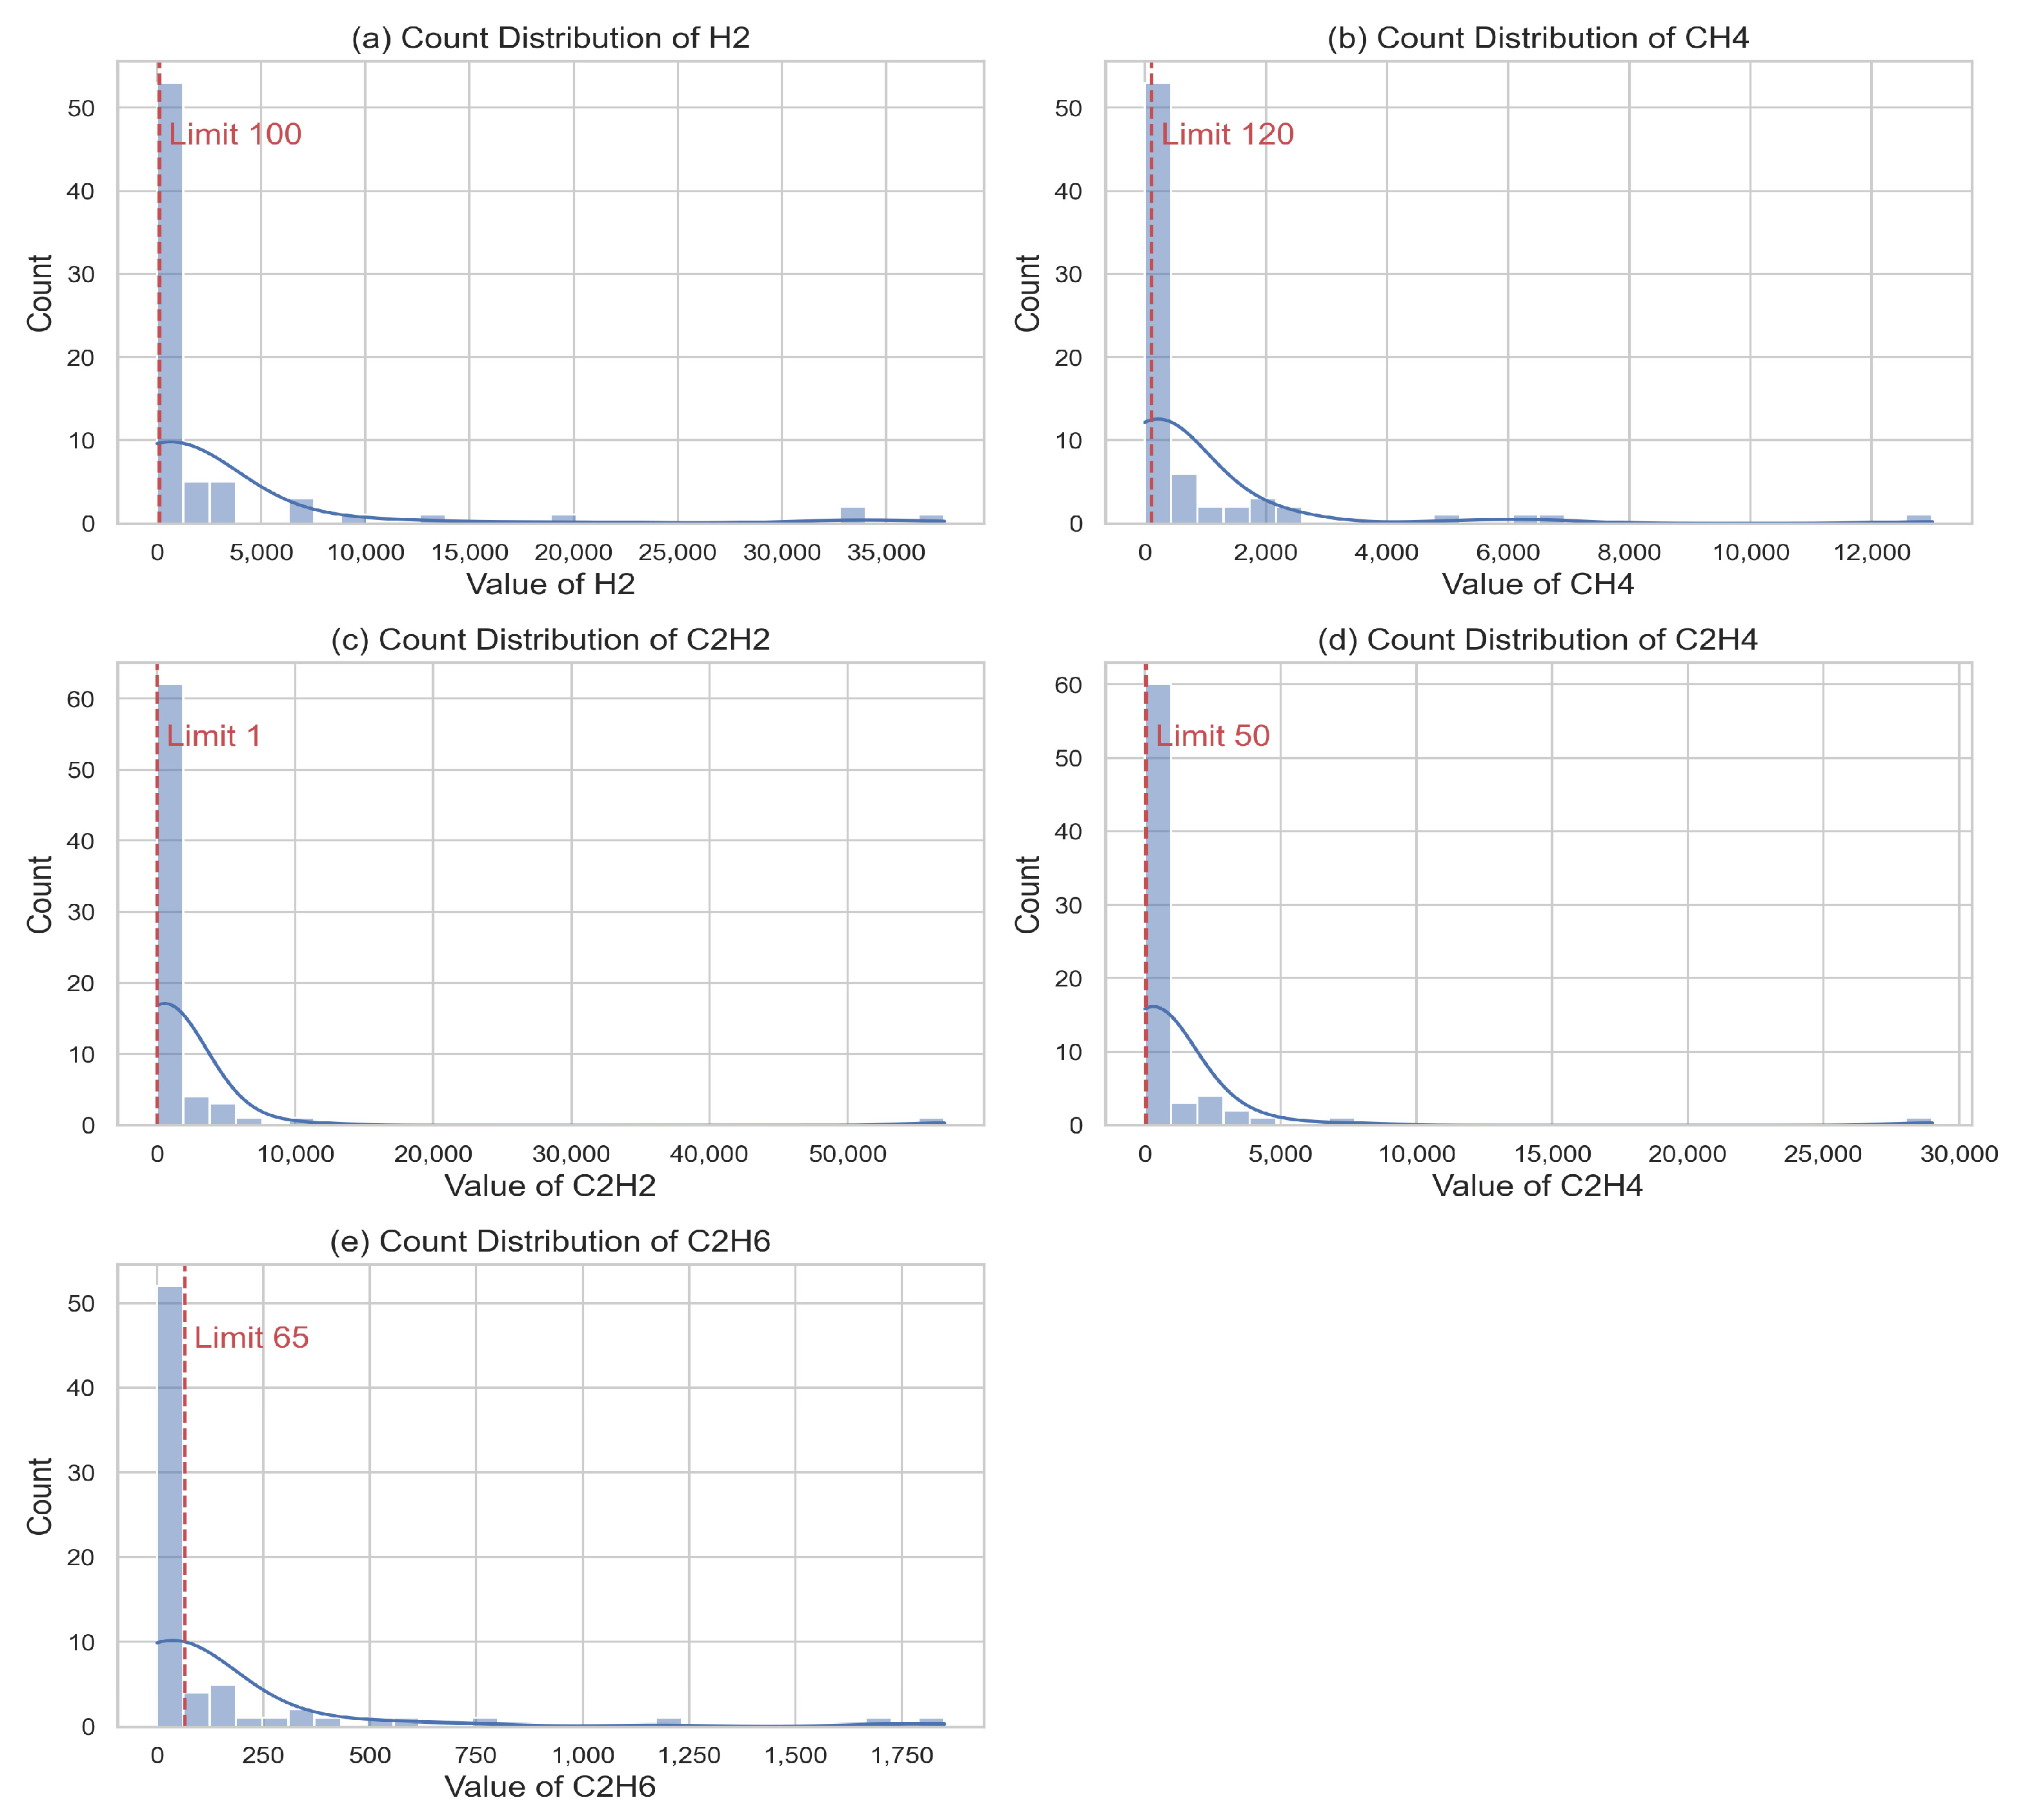
Figure 2 and
Figure 3 display the histograms for the 52 thermal fault samples and the 72 electrical fault samples, respectively.
Except for a few acetylene samples of electrical failures, all the gas concentration samples are shown to be above the standard limits.
The characteristics and nonlinear evolution of the samples are categorized as being in normal condition, electrical fault, and thermal fault, which are frequently different. It should be noted that a variety of factors could influence how early transformer insulation system problems manifest, including age, construction details, cooling methods, nominal power and voltage, and other factors.
3. Materials and Methods
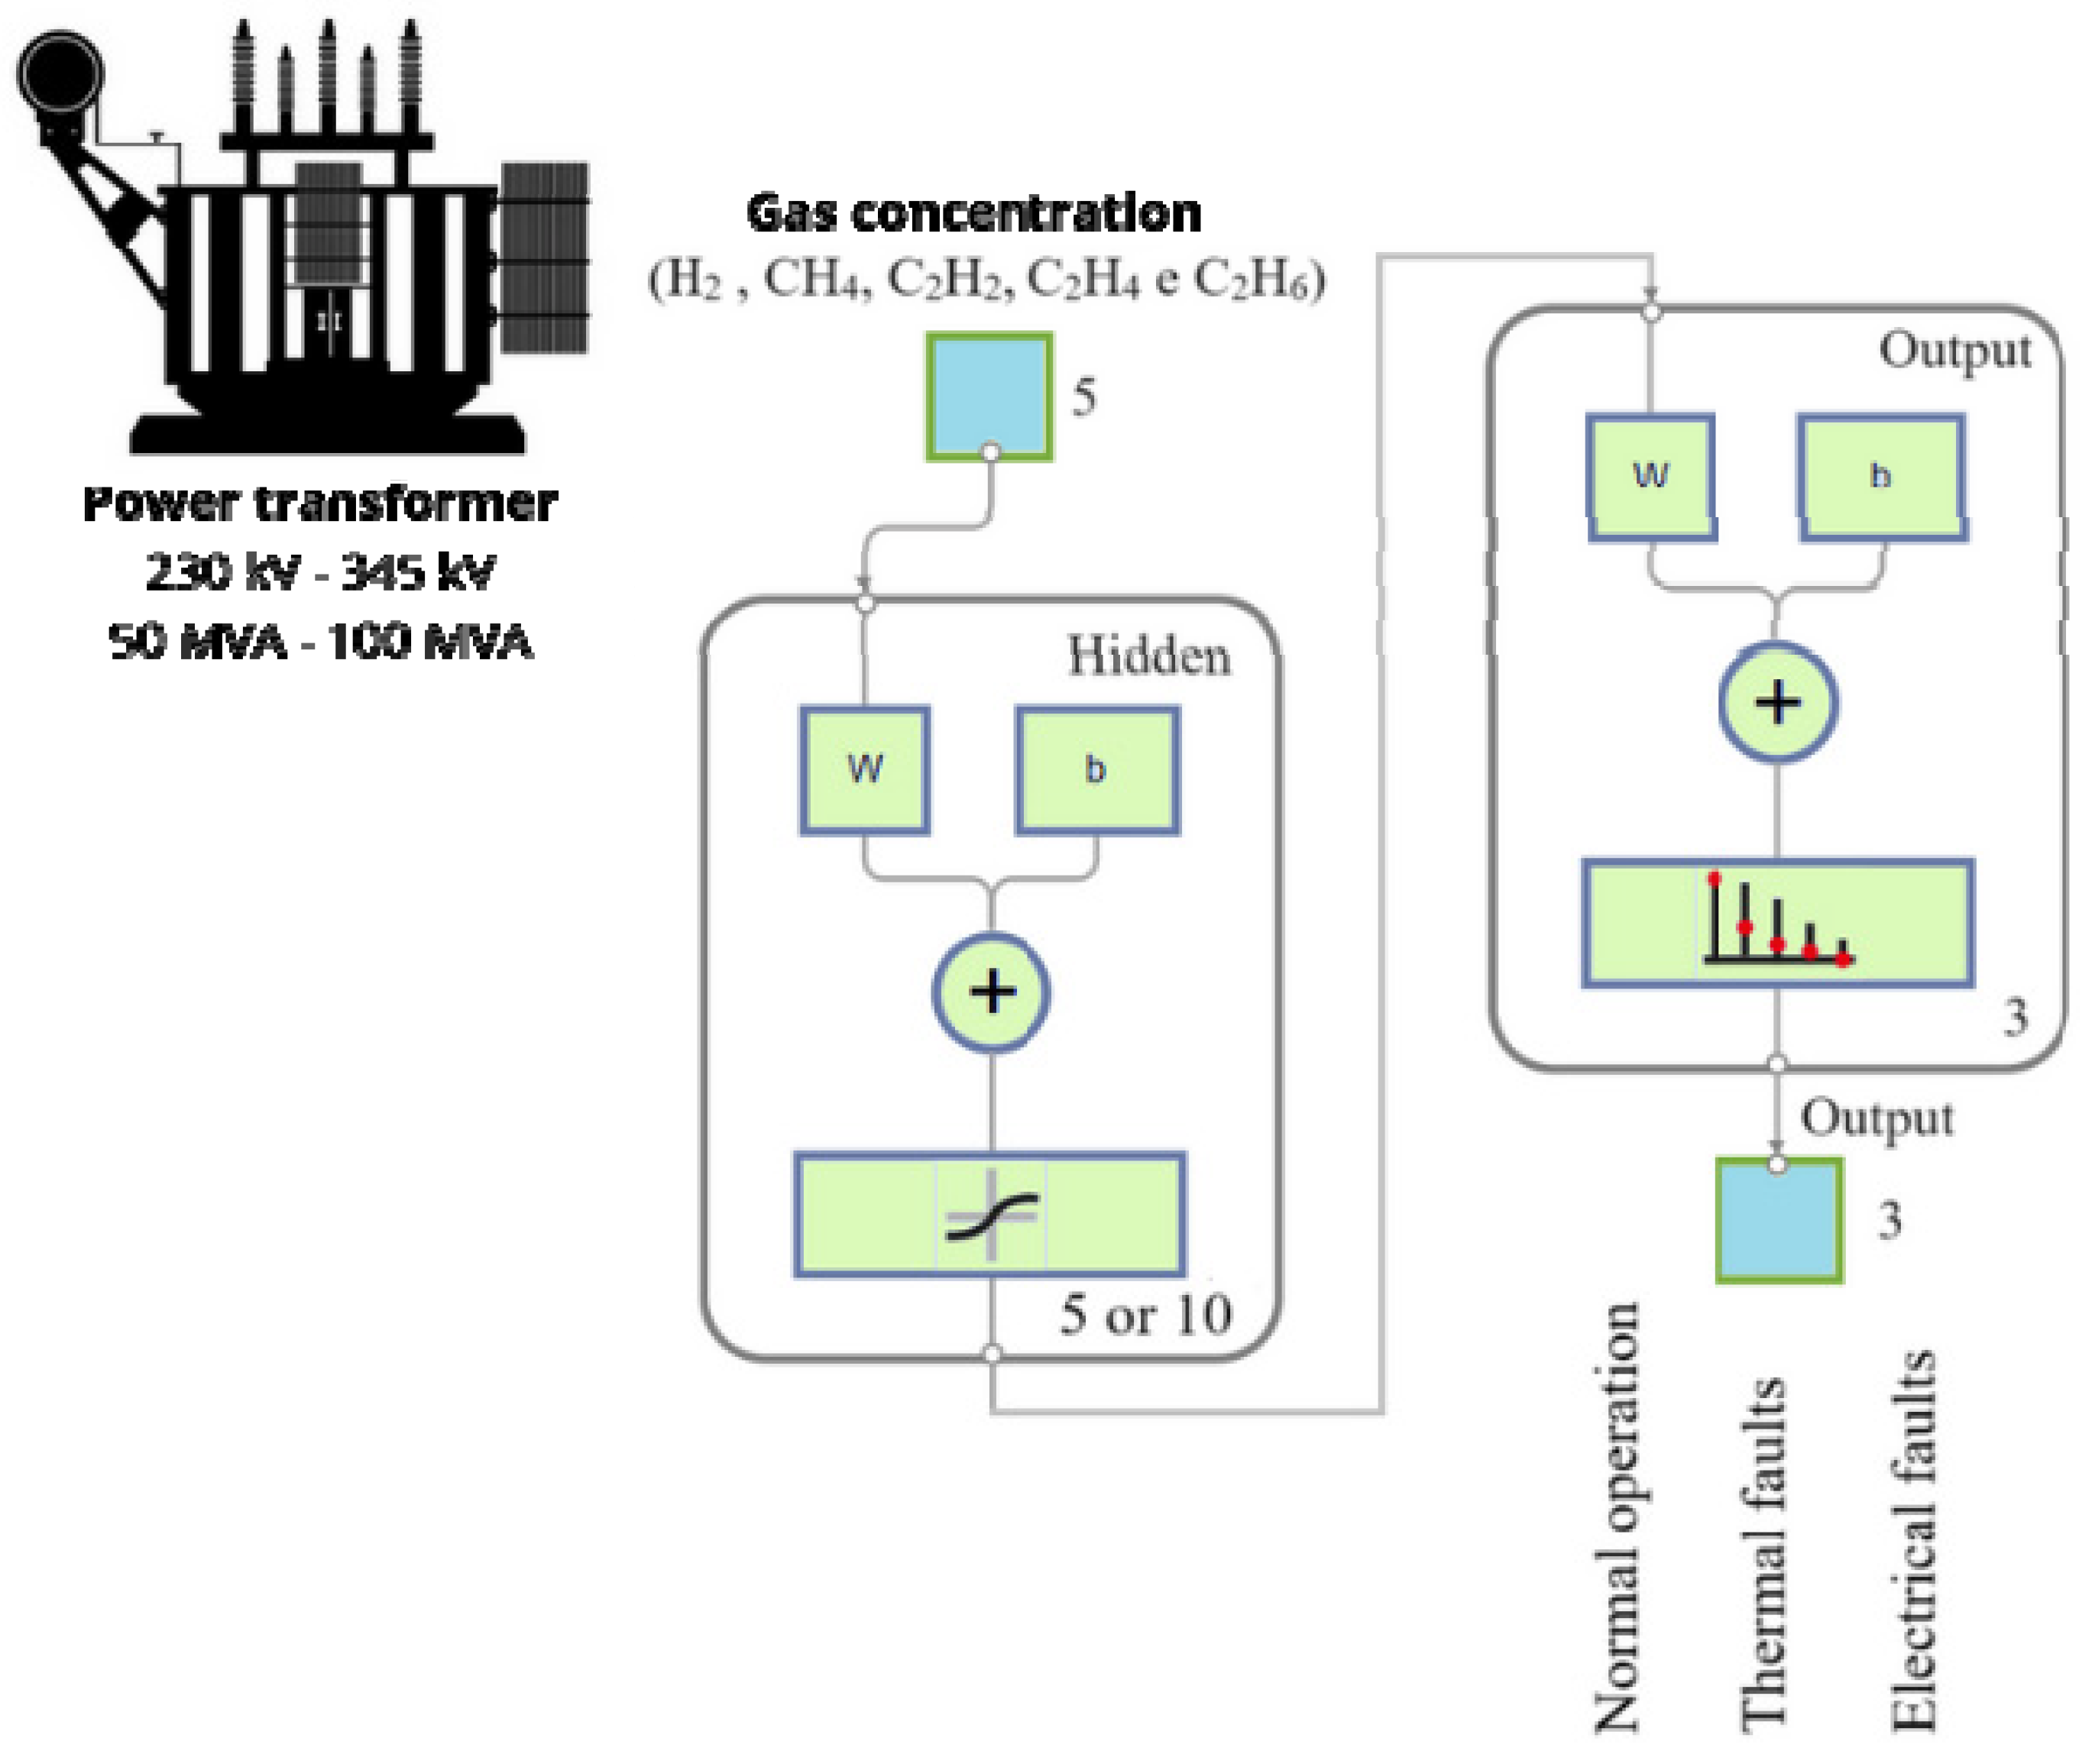
The artificial neural network (ANN) used in this study, as shown in
Figure 4, was the pattern recognition artificial neural network (PRN) composed of 5 neurons in the input layer (represented by the production of the combustible gases H
2 (hydrogen), CH
4 (methane), C
2H
2 (acetylene), C
2H
4 (ethylene) and C
2H
6 (ethane)), 5 or 10 neurons in the hidden layer (a comparison) and 3 neurons in the output layer, represented by 1—the transformer normal operating condition, 2—thermal faults, and 3—electrical faults.
After an extensive series of tests, it was concluded that it would be essential to allocate 10 neurons in the hidden layer instead of 5. This decision was motivated by the striking similarity between the samples, mainly the samples that produced the fault outputs, 2—thermal and 3—electrical, resulting from the common characteristics they presented, which justified the need to increase the number of neurons in the hidden layer. From 10 neurons on in the hidden layer, training started to get worse.
Pattern recognition artificial neural networks (PRNs) are feedforward networks designed to classify inputs into predefined target classes. In pattern recognition networks, the target data typically comprises vectors containing all zeros except for a 1 in the element corresponding to the class it represents [
26]. In pattern recognition problems, it is desired that a neural network classifies inputs into a set of target categories. For example, classify the operating condition of a power transformer as normal, thermal faults, or electrical faults based on combustible gases concentrated inside them. There are two classification methods in pattern recognition: supervised and unsupervised. To apply supervised pattern recognition, a large set of labeled data is required. If these are not available, an unsupervised approach can be applied. This work presents a supervised approach.
The scaled conjugate gradient backpropagation (SCG) is a training function for neural networks that iteratively updates weight and bias values. It utilizes the scaled conjugate gradient method, which is applicable to any network, provided its weight, net input, and transfer functions possess derivative functions. Backpropagation is employed to compute the derivatives of performance concerning the weight and bias variables [
26]. SCG was the training function used in this work.
The PRN network employed the hyperbolic tangent function as activation in the hidden layer, defined by Equation (1). On the other hand, for the output layer, the softmax function was adopted, represented by Equation (2).
where
t is an arbitrary constant, corresponding to the slope of the curve.
The softmax function accepts a vector u containing K real numbers as input and transforms it into a probability distribution comprising K probabilities. These probabilities are proportional to the exponentials of the input numbers, ensuring normalization. In other words, before applying the softmax, some components of the vector may be negative or greater than one and may not sum to 1. However, after applying the softmax, each component will be in the range (0, 1), and the components will sum to 1 so that they can be interpreted as probabilities. Additionally, higher input components will correspond to higher probabilities [
21].
The mean square error (
MSE) vector of the neural networks is calculated using (3):
where
Yob and
Ydes are the obtained and desired outputs of the artificial neural network (PRN), compared during the network training, and p is the number of samples.
Neural networks employing the backpropagation algorithm, such as SCG, along with various other types of artificial neural networks, are often perceived as ‘black boxes.’ This is because it is largely unclear why these networks produce specific outcomes, as they lack explicit justifications for their predictions. Recognizing this limitation, numerous studies have focused on extracting knowledge from artificial neural networks and developing explanatory techniques to provide insights into the network’s behavior in particular situations [
15,
27]. Hence, it should be observed that each time the network undergoes retraining, a distinct value will be obtained [
13,
27].
Figure 5 presents the flowchart of the PRN network used to classify the operating conditions of a power transformer.
During training using the backpropagation algorithm (SCG), the network follows a two-step process. Initially, a pattern is introduced to the network’s input layer. The resulting activity propagates through the network, layer by layer, until the output layer generates a response. In the second step, this output is compared to the desired output for that specific pattern. If they do not match, the error is computed. This error is then propagated backward from the output layer to the input layer, and the connection weights of the internal layer units are adjusted accordingly. This process underscores the potential of the PRN application, which can function both as a classification and prediction tool. Based on this, a procedure was developed to initialize the training program multiple times, using different configurations, both for the number of hidden layers and the number of neurons (varying in increments of 1), as well as for the proportions of training and validation samples (varying in increments of 5%), as presented in the flowchart in
Figure 6. After repeating the process
n times, the best result obtained was stored, corresponding to the most effective configuration (optimal number of hidden layers and neurons) that resulted in the highest accuracy percentage in the validation phase. In the study in question, the most successful configuration consisted of one hidden layer with 10 neurons, with 20% of the samples reserved for validation.
In the present situation, the most effective configuration for artificial neural network (ANN) after n = 132 training was the following: nh = 1 intermediate layer composed of nn = 10 neurons, with a = 90% of the samples intended for training and b = 10% for the validation phase. The second-best result found was with 5 neurons in the hidden layer.
4. Test Results and Discussion
Of the 815 samples randomly, 90% were used for training (733 samples) and 10% for validation (82 samples). The samples allocated for validation (82) are those that were not part of the initial training process. In other words, after the training, these samples (input data—gases) were introduced to the network to simulate which of the outputs (1, 2, or 3) the network classified. Two configurations were used for the hidden layer, one with 5 and the other with 10 neurons.
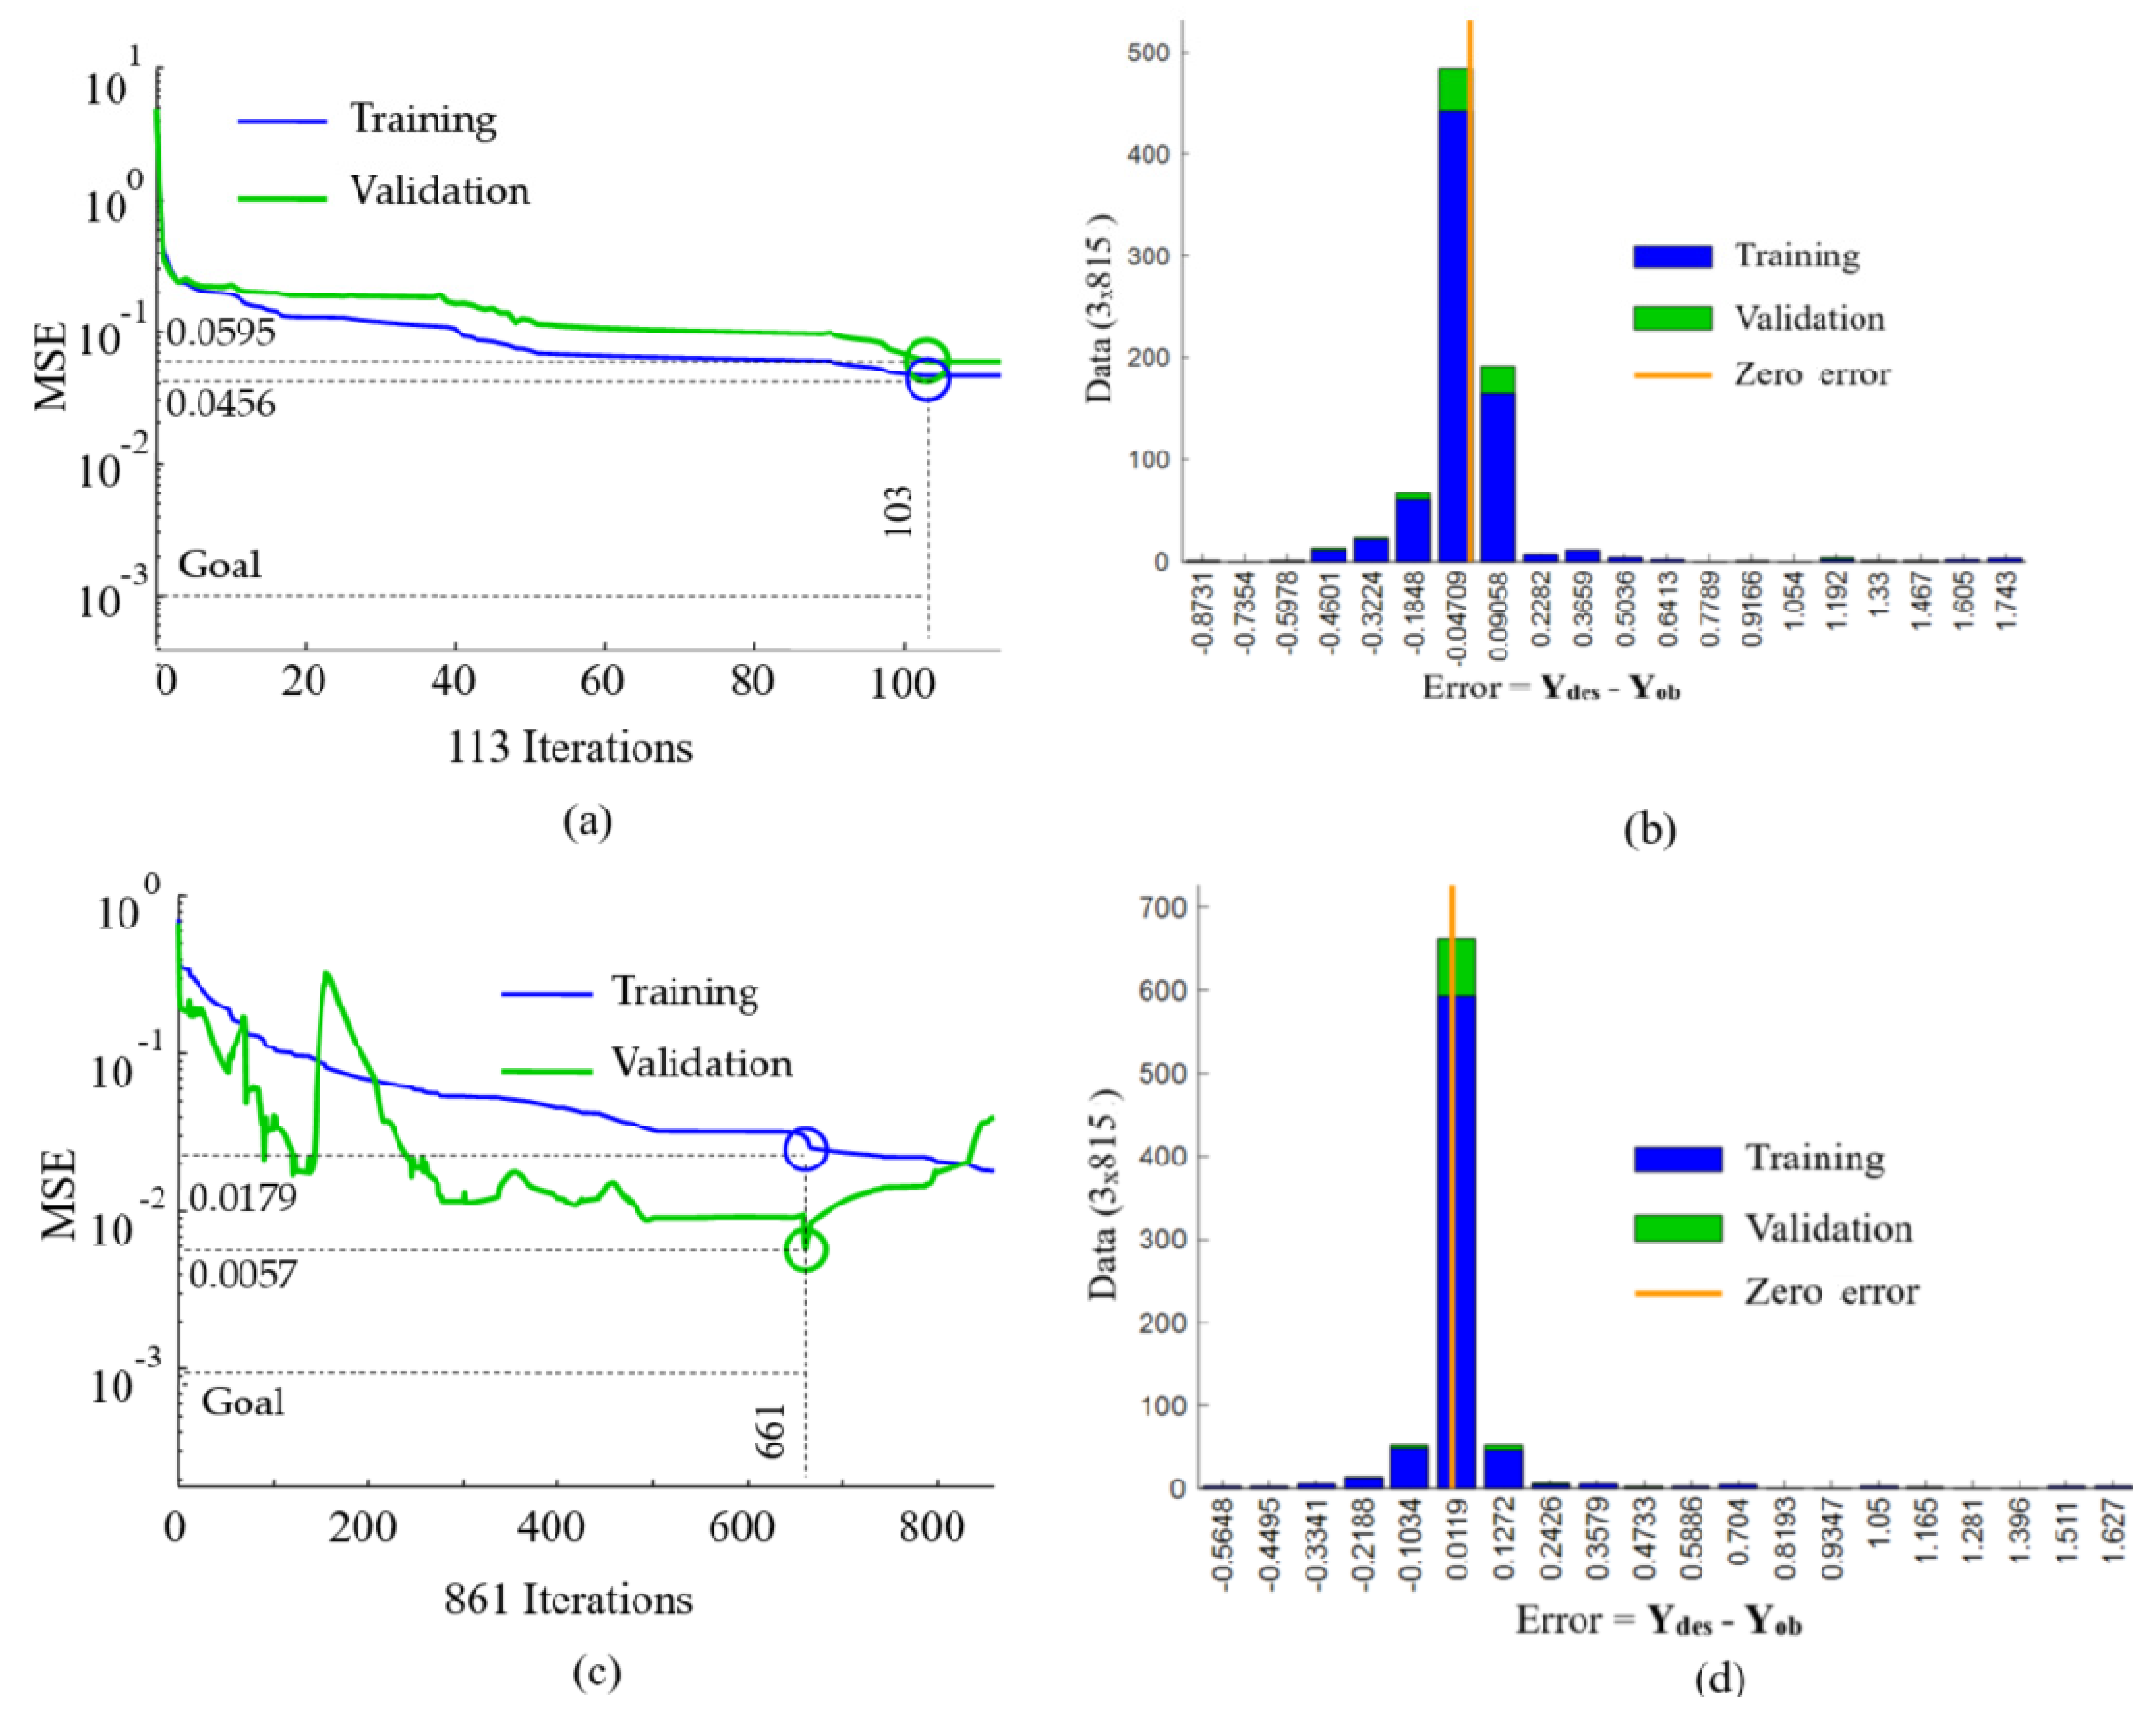
Figure 7 shows the training and validation performances of the artificial neural networks (PRN) used in this study.
Figure 7a shows the
MSE for each iteration of the PRN with five neurons in the hidden layer; the value achieved for the
MSE was 0.0456 for training and 0.0595 for validation.
Figure 7b shows the histogram of the error (obtained output
Yob relative to the desired output
Ydes), with 20 intervals for the 2445 data in the training and validation related to
Figure 7a. The errors were around zero for most of the data. Better results were found for the PRN with 10 neurons in the hidden layer,
MSE at 0.0179 for training and 0.0057 for validation, which is close to what was expected (0.001), as shown in
Figure 7c, with higher data accumulation and with errors around zero for the histogram, as shown in
Figure 7d.
Table 1 proves these results. The training and validation parameters were iterations, time, performance, and correlation. For the PRN with five neurons in the hidden layer, the values achieved were 10 s, with 113 iterations (10 validation checks achieved with 103 iterations), a correlation between the desired and obtained outputs of 0.8769 and 0.7599 to training and validation, respectively. Similar results are presented for the PRN with 10 neurons in the hidden layer, which are better results but with greater training time and number of iterations.
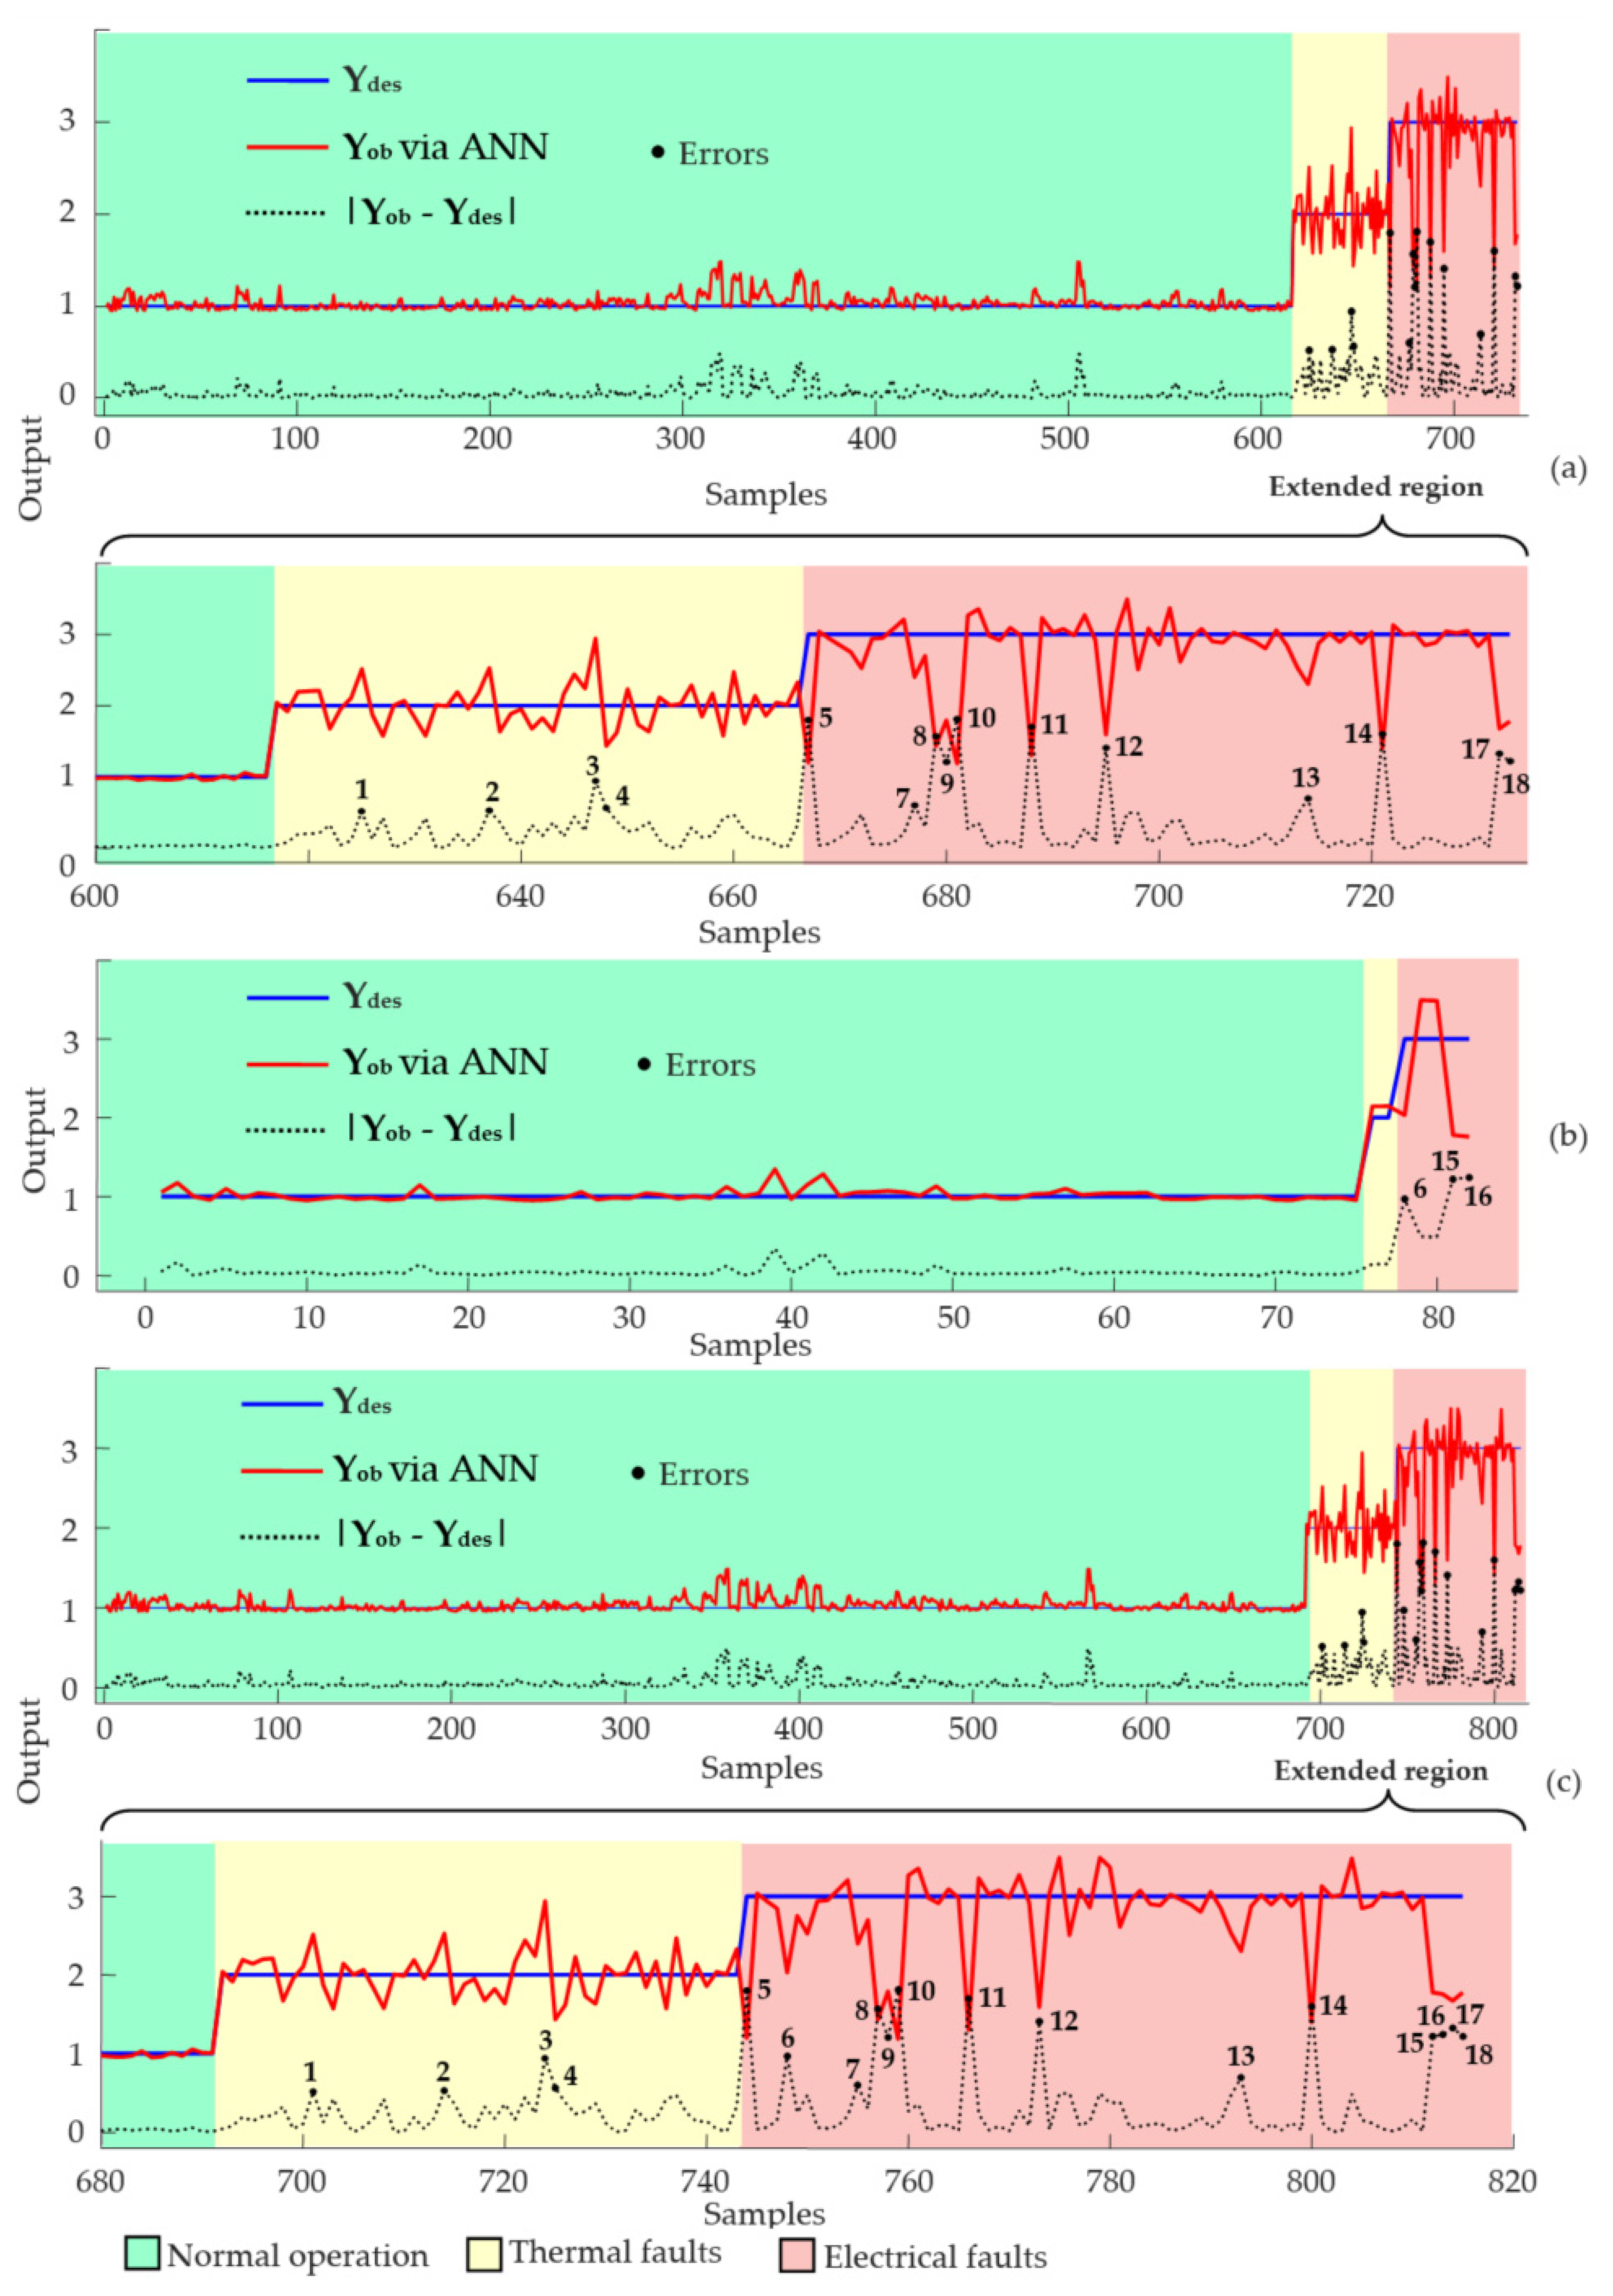
Figure 8a displays the results with five neurons in the hidden layer, comprising a comparison between the outputs obtained by the ANN (
Yob) and the desired outputs (
Ydes) derived from experiments during the training phase (90%, 733 samples). A notable resemblance between the
Yob and
Ydes outputs is observed, indicating effective network training, as illustrated in
Figure 7 and described in
Table 2. Consequently, the ANN is now capable of estimating data (such as composition) for samples that were not part of the training process. An automated model has been developed to estimate these parameters based on new sets of input data (combustible gases H
2 (hydrogen), CH
4 (methane), C
2H
2 (acetylene), C
2H
4 (ethylene) and C
2H
6 (ethane)).
Figure 8b presents the results of the network validation phase for 82 samples (10%) of the input data that were not part of the training, with the desired and obtained output values. Again, there is a similarity between the outputs, proving the effectiveness of the model created via ANN. The
MSE between outputs for this phase was 0.0595, similar to the specified value.
Figure 8c represents the results for 100% of the samples (815 in total), encompassing both the training and validation phases simultaneously. There were a total of 18 errors, with 15 errors during training and only 3 errors during validation, demonstrating the effectiveness of the model.
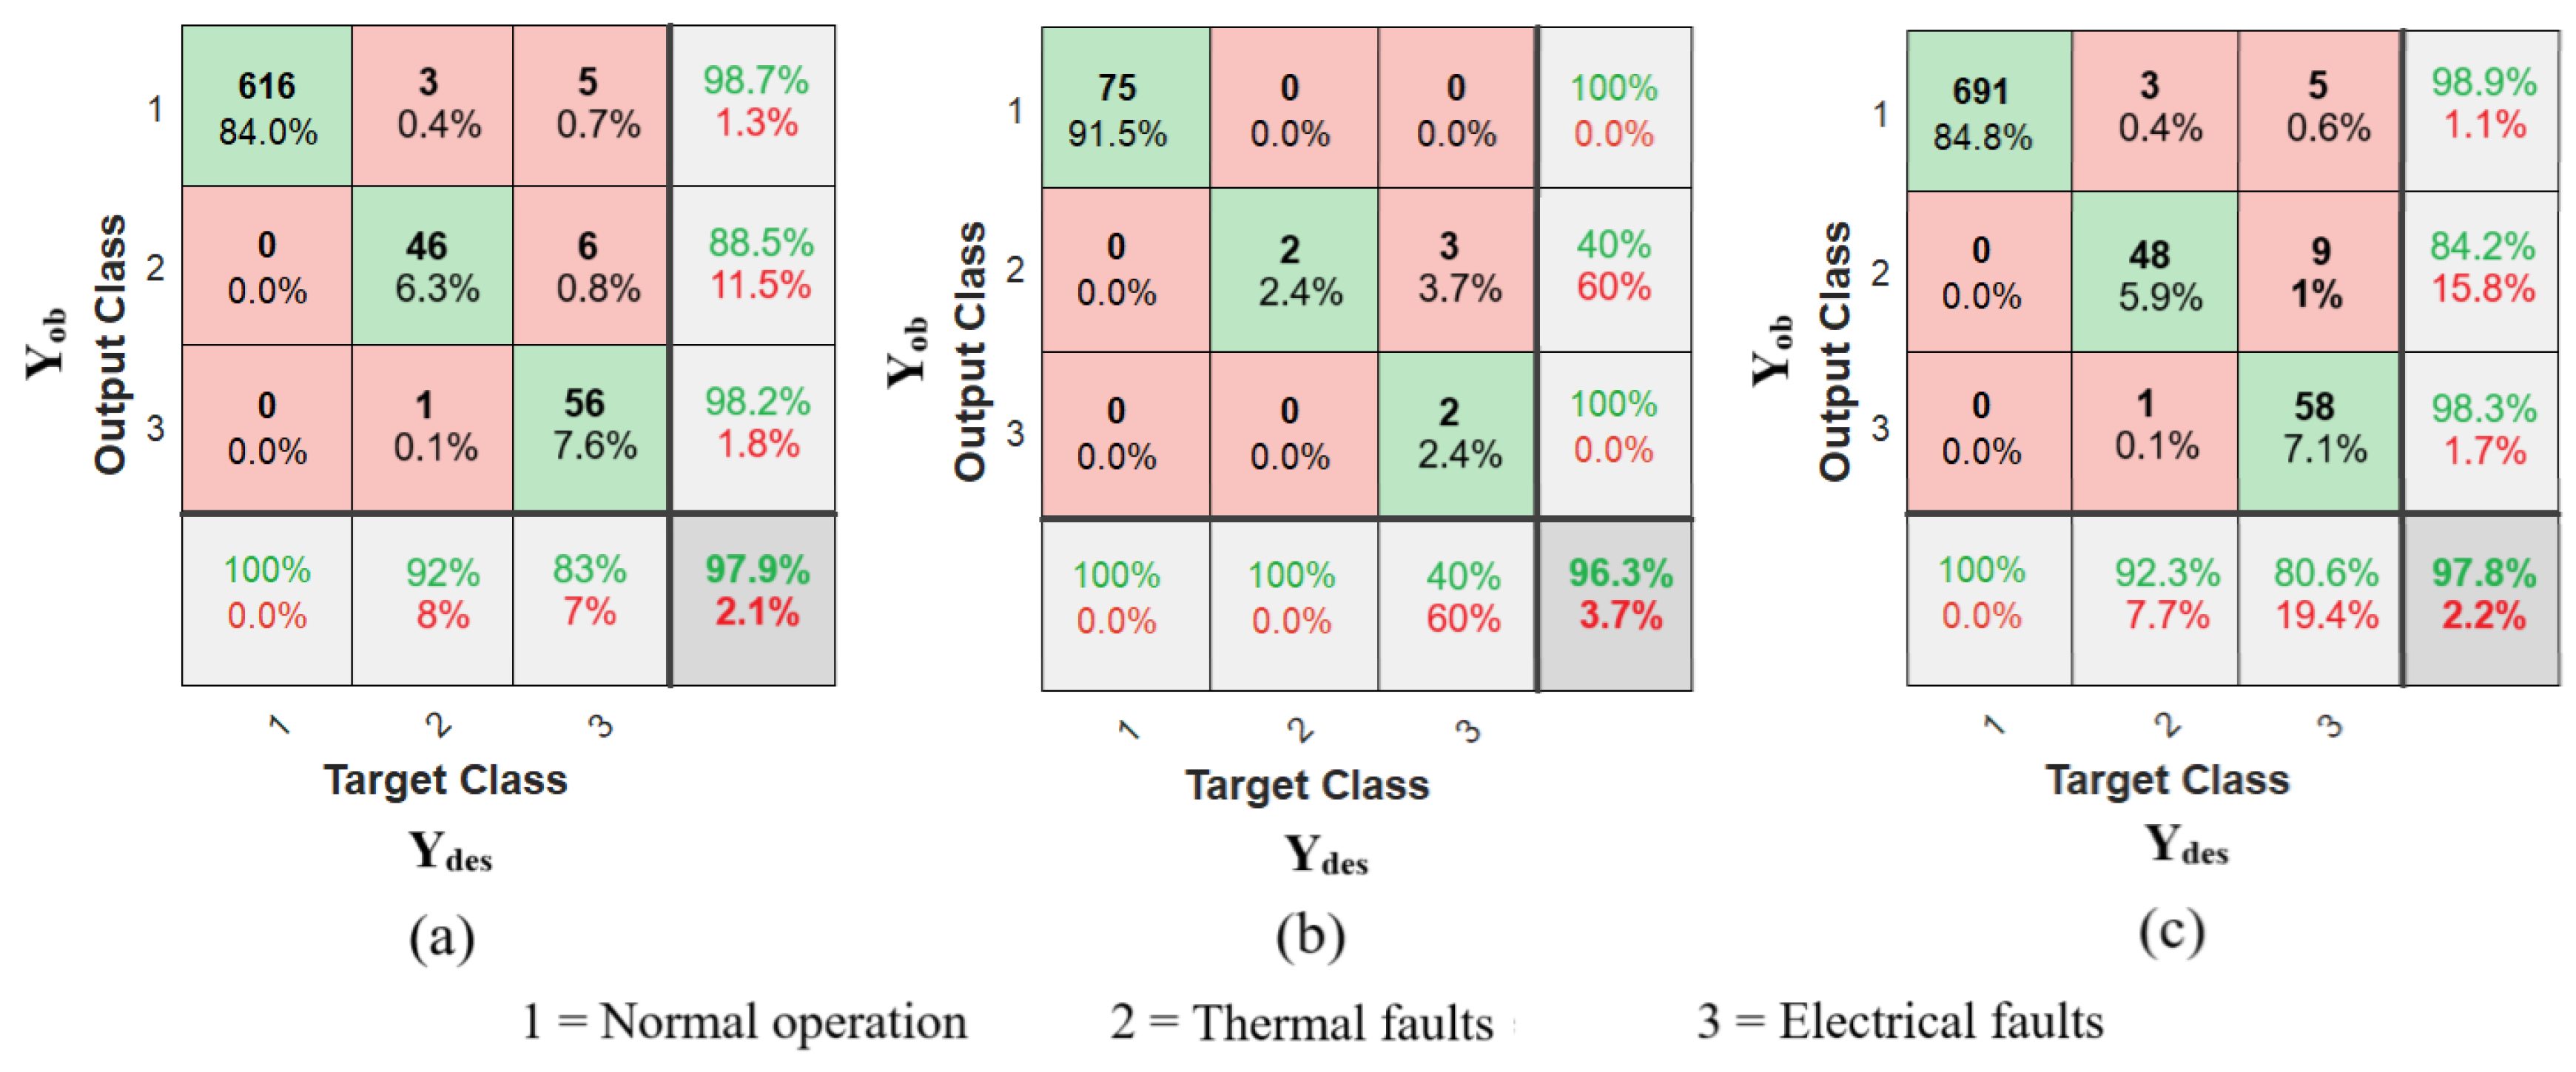
As a result, the following confusion matrix,
Figure 9, was obtained. On the confusion matrix plot, the rows correspond to the predicted class (
Yob—obtained via ANN), and the columns correspond to the true class (
Ydes—Target). The cells along the diagonal represent instances that are accurately classified, while those of the diagonal denote misclassified observations. Each cell displays both the count and the percentage of observations relative to the total.
The rightmost column provides the percentages of all predicted examples for each class that are correctly and incorrectly classified. These metrics are commonly known as precision (or positive predictive value) and false discovery rate, respectively [
20].
Similarly, the bottom row displays the percentages of all examples belonging to each class that are correctly and incorrectly classified. These metrics are often referred to as recall (or true positive rate) and false negative rate, respectively. Finally, the cell in the bottom right corner of the plot indicates the overall accuracy [
26].
In
Figure 9, the first three diagonal cells show the number and percentage of correct classifications after the training (
Figure 9a) and validation (
Figure 9b) of the network, respectively. For example, in
Figure 9a, 616 samples are correctly classified as class 1 (normal operation). This corresponds to 84% of all 733 samples. Similarly, 46 cases are correctly classified as class 2 (thermal faults). This corresponds to 6.3% of all samples. Finally, 56 samples were classified as class 3 (electrical faults), corresponding to 7.6% of all samples.
Overall, 97.9% of the predictions are correct, and 2.1% are wrong for training. Similar results are presented for validation in
Figure 9b: it is observed that 96.3% of the predictions are correct and 3.7% are wrong. In both phases, the network achieved an accuracy of 97.8%, hitting 797 samples and an error rate of just 2.2%, as shown in
Figure 9c.
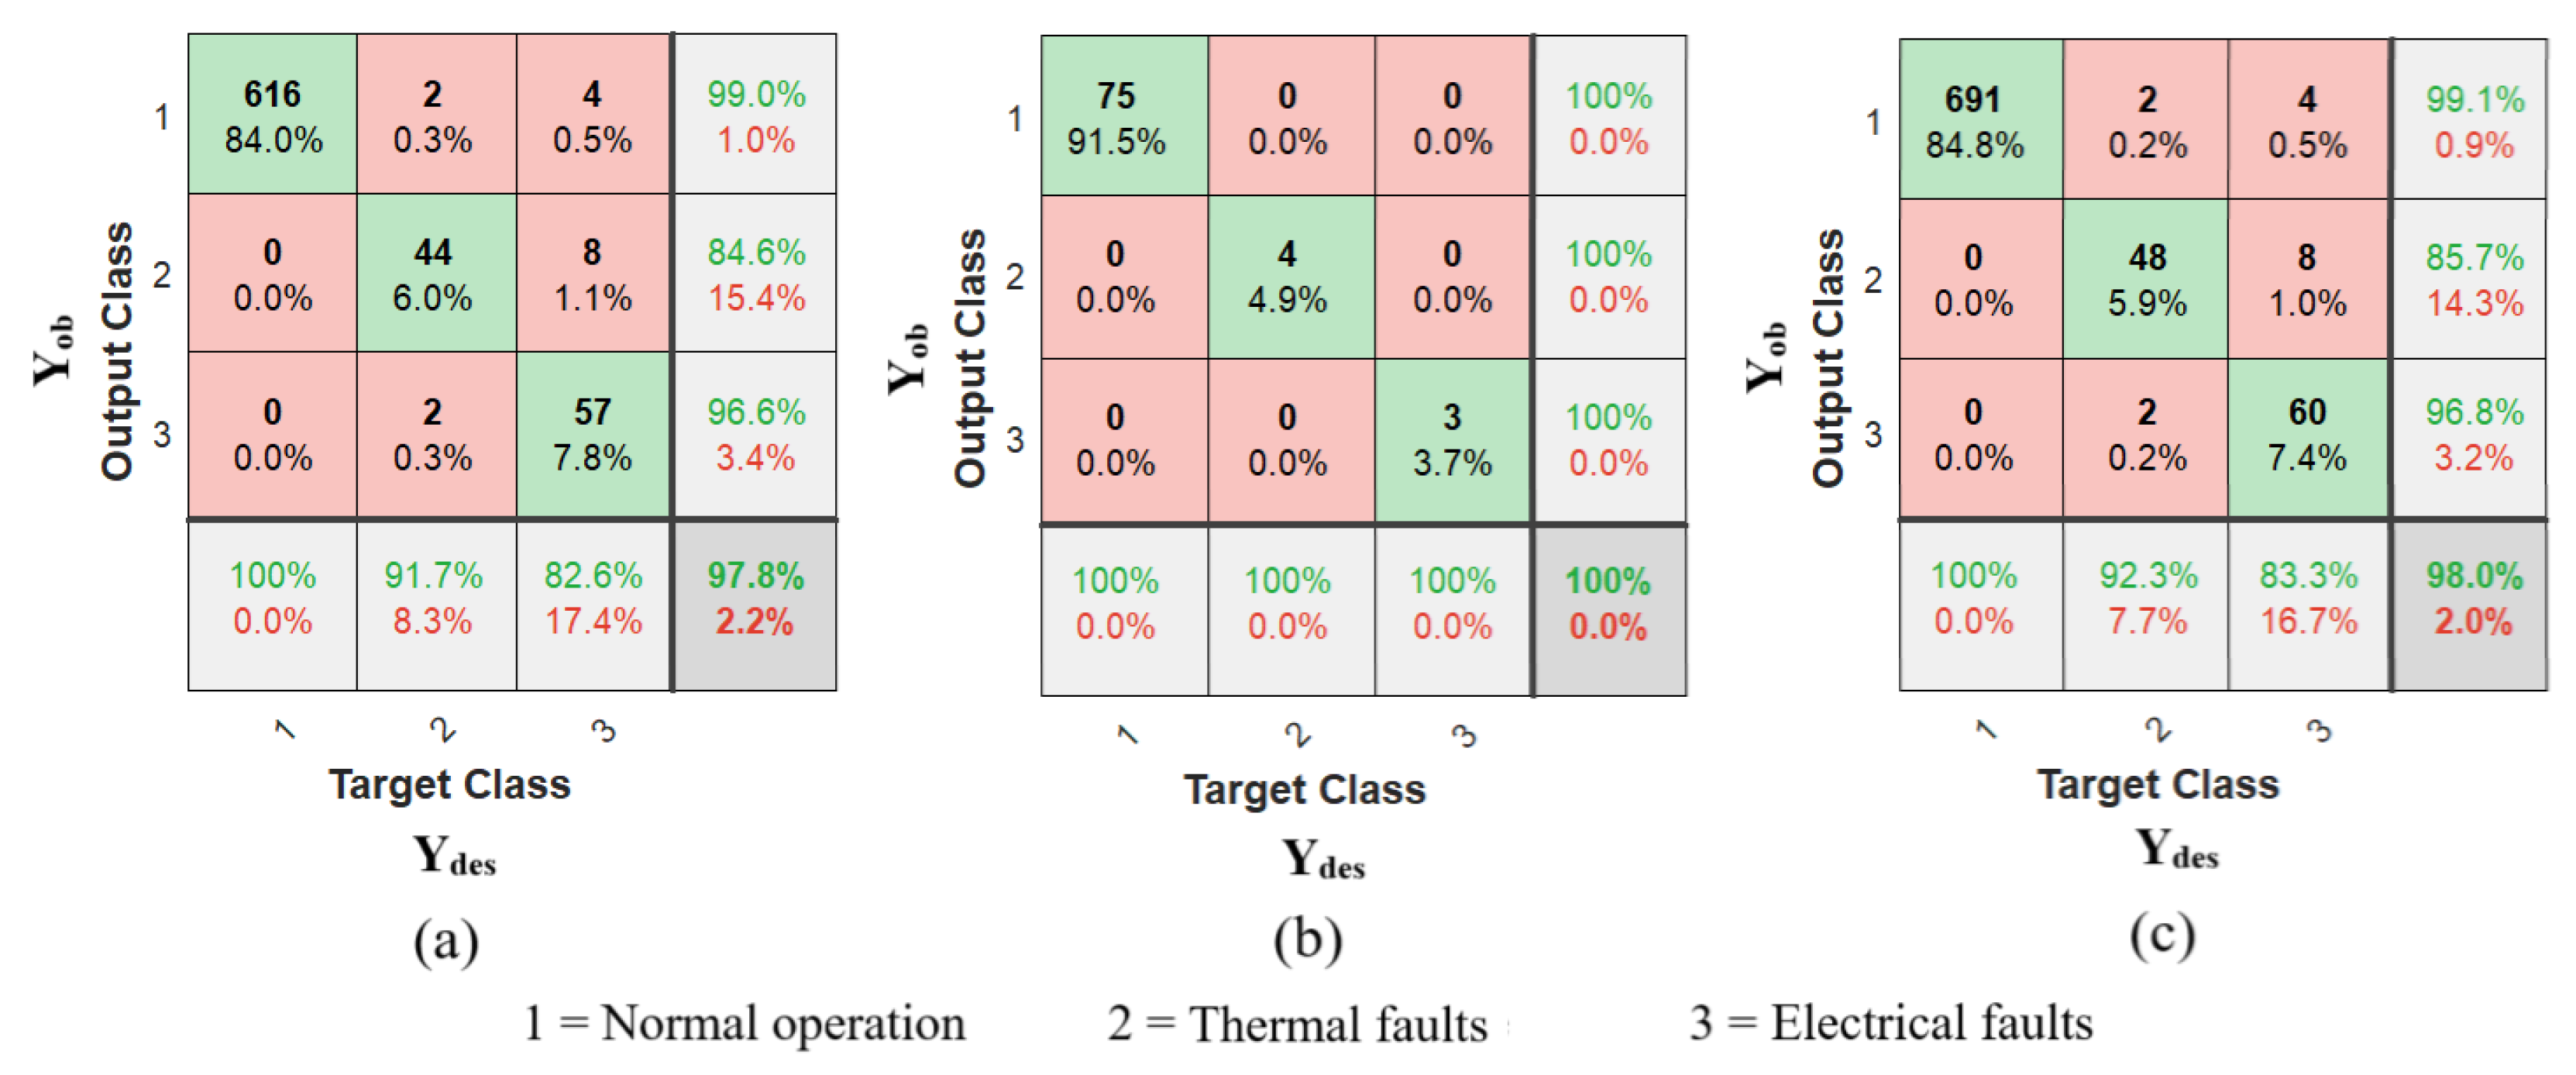
Figure 10 presents results for the PRN network with 10 neurons in the hidden layer. Better outcomes were achieved for both training and validation, as shown in
Figure 10a,b. During network training, there were a total of 16 errors, resulting in an accuracy rate of 97.8%, as illustrated in the confusion matrix presented in
Figure 11a. During the model validation, the ANN (PRN) classified with 100% accuracy the samples that were not included in the training. Of the 82 classified samples, all were correctly assigned to their corresponding outputs (75 samples for normal operation—class 1, 4 samples for thermal failure—class 2, and 3 samples for electrical failure—class 3), as illustrated in
Figure 10b and in the confusion matrix presented in
Figure 11b.
The results regarding the training and validation of the PRN network applied to 100% of the samples are shown in
Figure 10c, as well as in the confusion matrix presented in
Figure 11c. It is observed that, when using 10 neurons in the hidden layer, the network recorded only 14 errors, occurring exclusively in the training phase, resulting in a success rate of 97.8%. Overall, the accuracy rate achieved was 98%, slightly surpassing the 97.8% achieved with five neurons in the hidden layer.
Both configurations proved to be effective as automatic models for classifying the operating conditions of power transformers based on the gases present inside them.
Table 3,
Table 4 and
Table 5 present the weights of the connections between the input and hidden layers, from the hidden layer to the output, and the respective bias weights of the hidden and output layers for the network with 10 neurons in the hidden layer.
5. Conclusions
This study presented a methodology via PRN artificial neural networks to obtain the operating conditions of power transformers (normal, thermal faults, or electrical faults) as a function of the combustible gases (H2 (hydrogen), CH4 (methane), C2H2 (acetylene), C2H4 (ethylene), and C2H6 (ethane)) presented therein.
In the two configurations presented (5 and 10 neurons in the hidden layer), the network had good training, a little better when using 10 neurons, with 10 s of processing and MSE at 0.0175. In the validation phase (data that was not part of the training), the MSE was 0.0057, and a correlation between the obtained output and the desired output was 0.9718, showing the effectiveness of the model.
In the best results, the network was able to classify the samples for both training and validation with low error. The network presented only 14 errors out of 815 samples, all in the training phase. In the validation phase, the network presented 100% accuracy. In total, for 815 samples in both phases (training and validation), the hit rate was 98%.
As a result, the methodology presented via ANN (PRN) proved to be efficient in classifying the operating conditions of power transformers (normal—class 1, thermal faults—class 2, and electrical faults—class 3) depending on the combustible gases created inside of the same (H2, CH4, C2H2, C2H4, and C2H6).
Energy utilities can improve their annual predictive and preventive maintenance planning process by implementing this proposed method. In Brazil, dissolved gas analysis (DGA) tests are often carried out annually or every six months. However, depending on the severity of the DGA results, the interval between these tests can be reduced, which can promote a change in maintenance planning, preventing further damage to the equipment and ensuring continuity of service.


 ,
, 


