Article

Soft Sensor Technology for the Determination of Mechanical Seal Friction Power Performance

1
Department of Mechanical Engineering and Power Engineering, THM University of Applied Sciences, 35390 Giessen, Germany
2
Herborner Pumpentechnik GmbH & Co. KG, 35745 Herborn, Germany
3
Institute of Experimental Physics I, Justus Liebig University, 35390 Giessen, Germany
*
Author to whom correspondence should be addressed.
Appl. Syst. Innov. 2024, 7(3), 39; https://doi.org/10.3390/asi7030039
Submission received: 13 March 2024 / Revised: 15 April 2024 / Accepted: 29 April 2024 / Published: 4 May 2024
(This article belongs to the Section Industrial and Manufacturing Engineering)

Abstract

:
Mechanical seals ensure the internal sealing of centrifugal pumps from the surrounding environment. They are one of the most critical components in a centrifugal pump. For this reason, the condition of mechanical seals should be monitored during operation. Mechanical seal friction power is an important component of mechanical losses in centrifugal pumps and is used as an indicator of wear and therefore seal condition. The soft sensor described in this paper is based on temperature measurements at the seal and can be used for determining the frictional power performance. A major factor in determining frictional power performance is the heat transfer between the mechanical seal and the medium inside the pump. For calculating the heat transfer, the stationary temperature fields in the rings of the mechanical seal are described by transmission efficiencies. The root mean squared error was determined for steady-state operating conditions to assess the quality of the soft sensor calculation. The frictional power performance can be determined by recording the temperature at the mechanical seal mating ring and the medium. The algorithm detects when the steady-state operating conditions change but does not map the dynamic changes between the stationary operating conditions.

1. Introduction

Mechanical seals play a crucial role in the operation of centrifugal pumps. They seal the medium inside of the pump from the surrounding atmosphere in the area where the shaft passes through the pump housing. Monitoring methods have been developed recently due to their importance for the operation of the pump. Y. Luo et al. demonstrated the ability to detect damage to the mechanical seal of a centrifugal pump during operation [1]. This was achieved by analysing the vibrations of the pump. It has been recognised that damage to the mechanical seal causes higher-frequency vibration signals than those that normally occur in the centrifugal pump during operation. J. Zou et al. analysed the power consumption of a centrifugal pump driven by an asynchronous motor under different mechanical seal conditions [2]. Their analysis was limited to the scenario of an increased leakage rate in a mechanical seal. They showed that the characteristic curves of the centrifugal pump are also affected by increasing leakage at the mechanical seal. Depending on the pump design, the mechanical seal is responsible for most of the mechanical losses inside the pump. The mechanical losses are part of the pump characteristic curves. The pump characteristic curve can be used to determine the flow rate of the pump. Because of the importance of the flow rate delivered by the pump as a process variable, there are many algorithms for determining the flow rate using the pump curve. R. Susan-Resiga et al. have studied the application of the affinity laws to the pump curve at a reduced pump speed [3]. They showed that changing the pump speed over a wide range results in significant differences between the calculated and observed pump curve. We included the mechanical power loss of the pump in a physical model for determining the set of performance curves for radial centrifugal pumps [4]. As a result, the prediction of the pump characteristic curves at a reduced pump speed was considerably improved compared to that under the affinity laws. Frictional torque is currently measured using torque sensors that require integration onto the mating ring of the mechanical seal to determine the friction power performance. This method has been demonstrated in several papers [5,6,7,8]. Soft sensing methods can be used to determine the frictional power of mechanical seals, overcoming the challenges of implementing physical sensors. In their paper, Jiang et al. provide an overview of the most important developments in the field of soft sensors in recent years [9]. They present how soft sensors are developed and identify current challenges. They divide soft sensor development into four phases: variable selection, preprocessing, modelling and validation. Various methods can be employed for modelling. These can be categorised into the following groups: multivariate statistical assumptions, data-driven assumptions, machine learning, filtering methods, and first-principles methods [9]. First-principles models and filtering methods are based on the physical relationships of the systems and require comprehensive knowledge. This makes their application in complex systems more challenging. Multivariate statistical, data-driven, and machine learning models are capable of accurately describing complex systems. However, they require a significant amount of data for characterisation and training. Dai et al. developed a denoising diffusion probabilistic model for time series denoising (TimeDDPM) to handle the large amounts of data required for model training [10]. TimeDDPM has the ability to generate new data sets from existing samples to enhance LSTM training. Dai et al. demonstrated, in two examples, that TimeDDPM can reduce prediction errors compared with other methods, such as a simple LSTM without dataset extension. In addition to the required data volumes, the measurement noise from the physical sensors is also a significant factor in the modelling. Zhu et al. propose a method for noise filtering [11]. Ideal data, filtered for measurement noise, are used to train kernel learning models. Zhu et al. demonstrated, in two examples, that this approach can enhance prediction accuracy. However, it is stated that further research is needed to generalise the improvements in the estimation error, specifically regarding the influences of the incorrect modelling of the model error. Jiang et al. also identified hyperparameters of the models as a challenge in soft sensor development [9]. Soft sensors can serve as substitutes for variables that are challenging to measure and as backups in the case of sensor failure. Frafjord et al. describe two data-driven methods for calculating differential pressure in a district heating network [12]. If the pressure sensor fails, the system should still be controlled by using the soft sensor as a substitute. Various convolutional neural network and long short time memory approaches, as well as transfer function approaches, were analysed. It was demonstrated that the simplest model structures yielded the best results, despite the complex interrelationships within the district heating network. Recently, machine learning and data-driven models have gained popularity. This enabled the accurate determination of target values, even in complex systems. The challenges presented by low data volumes and noise behaviour were addressed with innovative methods. The review by P. Nunes et al. also identifies collecting and analysing data as a major challenge in condition monitoring [13]. Frafjord et al. demonstrated that even in complex systems, simplified approaches can achieve decreased errors [12]. Although many models perform well in the laboratory, their implementation in industrial applications requires significant effort and a robust database, especially for data-driven models [9]. However, Frafjord et al.’s results motivate the investigation of simple modelling approaches for complex systems.
Given the critical role of mechanical seal temperature in operational performance and early failure detection, several studies have focused on the analysis of heat flows and temperature fields within mechanical seals. The studies’ findings can aid in the development of a soft sensor. T. A. Shihab et al. demonstrated that the selection of an appropriate material combination for mechanical seal rings can effectively reduce the sliding face temperature during dry running compared with alternative material combinations [14]. They calculated the temperature fields in the mechanical seal analytically. Therefore, the half-infinite model was used. Their conclusion was that the lower sliding surface temperatures were due to the lower coefficient of friction (COF). In the initial phase, the analytical model reproduces the temperature–time behaviour of the sliding surface with deviations. However, the calculated temperature at the sliding surface in a steady-state shows good agreement. R. L. Phillips et al. investigated the heat flows at a mechanical seal [8]. The frictional torque of the mechanical seal was also measured using a torque sensor. The seal was installed in a centrifugal pump. The local Nusselt number was determined at several positions. The results were compared with the literature data. They found that surrogate models, such as those that use cylinder geometries to calculate the Nusselt number, do not adequately represent the actual Nusselt numbers observed in mechanical seals. The work of G. S. Buck has shown that the predominant consideration in determining heat flows within mechanical seals is the heat transfer to the surrounding fluid [15]. In his analysis, G. S. Buck used a one-dimensional model of the heat flows transferred from the sliding surface to the surrounding fluid. The concept of the model is based on the fin theory described in [16]. Transmission efficiencies are used to account for the effects of the multi-dimensional temperature field. Z. Luan and M. Khonsari (2007) also used this approach [17]. N. Brunetiére and B. Modolo have analysed a mechanical seal using numerical simulation [18]. They determined the local and averaged Nusselt number for the primary and mating ring of a mechanical seal. To determine the average Nusselt number, they defined an equation. They showed that the Nusselt number is influenced not only by the Reynolds and Prandl numbers, but also by the ratio of the thermal conductivity between the pumped medium and the materials of the mechanical seal. M. Mosavate et al. studied the influence of thermal radiation and different geometries and materials on the thermal behaviour of mechanical seals and fins [19]. They show that thermal radiation influences the temperature distribution in mechanical seals. In addition, metallic materials such as Hastelloy exhibit good performance in mechanical seals, particularly at elevated temperatures.
A new approach to determining the frictional power performance of a mechanical seal is presented in this paper. The model for the soft sensor is based on a first-principles approach, describing it through the conservation of energy. This task demands an understanding of the heat transfer that occurs between the mechanical seal and the surrounding medium. The objective of our model is to ensure that it can be easily implemented in mechanical seals in centrifugal pumps, based on a small amount of data and the simplicity of the model. This model does not require the use of complex simulation methods or measurements.

2. Development of Soft Sensor Technology for Determination of Frictional Power Performance of Mechanical Seals

2.1. Derivation of Mechanical Seal Heat Flow Model

Figure 1a shows the design of a mechanical seal made up of several components used in a centrifugal pump. The mating ring is the stationary element of the mechanical seal and is sealed to the pump housing by means of an O-ring. The primary ring rotates with the pump shaft and is pressed against the mating ring by a spring via the pump impeller disc. An elastomer prevents leakage between the pump shaft and the primary ring. When the primary ring is rotating and the pumped mediums are present, the gap between the primary ring and the mating ring increases. Only a small amount of leakage escapes from the pump due to the small size of the gap, in the range of one micron [20]. G. S. Buck and Z. Luan and M. Khonsari (2007) use the analytical description of heat flows in fins to calculate the temperature of the sliding surface ( ϑ 0 ). They define transmission efficiencies ( E ) for different mechanical seal geometries in accordance with Equation (1) [15,17]. Equation (1) establishes a relationship between the heat flow ( Q ˙ ) through the mechanical seal and the heat flow expected at a temperature difference between a reference temperature and the temperature of the medium inside the pump. This is calculated from the heat transfer coefficient between the mechanical seal and the surrounding medium ( α ), the area of the mechanical seal in relation to the surrounding medium ( A ), and the difference between the reference temperature ( ϑ r e f ) and the temperature of the medium inside the pump ( ϑ M ).
E Q ˙ α A ϑ r e f ϑ M
The model used to derive the heat flows in the mechanical seal is shown in Figure 1b. The model was developed based on the form coefficient method. This method has been described, for example, by B. Glück [21]. The form coefficient method balances heat flows at specific points. Heat flows or temperatures can therefore be calculated for stationary temperature fields in bodies.
The sliding surface temperature ( ϑ 0 ) increases due to the friction power ( P R ). It is assumed that the heat flows generated in the rings can only be dissipated to the medium inside the pump with the temperature, ϑ M . All other surfaces should be considered to be insulating. In the mating ring, heat flows from surface 0 to surface 2 ( Q ˙ 20 ) where a temperature sensor can be mounted. There is also a heat flow from the sliding surface to surface 1 ( Q ˙ 10 ) where heat is transferred to the medium. Heat flows from surface 2 to surface 1 due to the temperature gradient ( Q ˙ 12 ). Heat flows in the primary ring from the seal face to face 3 ( Q ˙ 30 ) where the heat transferred to the seal ring is dissipated. It is assumed that the sliding surface temperature in the mating and primary rings is the same, as suggested by G.S. Buck [15]. In addition to the form coefficient method being used, transmission efficiencies are also calculated for stationary temperature fields [15,17,21]. Generally, heat flows from surface j to surface i ( Q ˙ i j ) can be represented below based on the form coefficient method [21]:
Q ˙ i j k i j ( ϑ i ϑ j ) .
The form factor ( k i j ) includes factors for conduction (e.g., thermal conductivity, λ ) and convective heat transfer (e.g., the heat transfer coefficient, α ). When convective heat transfer occurs, k i j : R 2 R applies, as the heat transfer coefficient depends on the medium temperature and the flow state of the convective flow. The heat transfer coefficients for mechanical seals have already been studied, as described in the introduction. These can be represented by the Nusselt number ( N u ), as follows [22]:
N u α L λ .
A characteristic length ( L ) and the thermal conductivity of the medium are used to standardise the heat transfer coefficient. As shown by N. Brunetiére and B. Modolo, there are correlations that can be used to describe the averaged Nusselt number ( N u ¯ ) for mechanical seals [18]. Contrary to Equation (3), the averaged Nusselt numbers apply to the whole area considered. In general, Equation (4) [22] can be used to describe the functional relationships of the averaged Nusselt numbers:
N u ¯ c R e m P r h P r P r W b .
Depending on the geometry and considering the heat transfer conditions, the coefficients c ,   m ,   h , and b vary. R e is the Reynolds number, P r is the Prandl number of the medium at its temperature, and P r W is the Prandl number of the medium at the temperature of the solid wall. Instead of describing the heat flows, Q ˙ i j , with the form coefficients in accordance with Equation (2), Equations (5) and (6) are introduced:
Q ˙ i j a i j ( ϑ i ϑ j ) .
a i j α A i E i j
The form coefficient is now k i j a i j . The advantage of this representation is that it explicitly includes the heat transfer coefficient, so that the Nusselt number approaches can be applied. The transmission efficiency from surface j to surface i ( E i j ) now describes the influence of geometry on the specific heat flows. This is calculated as follows:
E i j ϑ i ϑ M ϑ j ϑ M     i 2
It can be seen from Equation (7) that the transmission efficiency, E 20 , is excluded from the definition. This is because there is no heat transferred from the mechanical seal to the medium at face 2. Figure 1b shows that Q ˙ 20 = Q ˙ 12 . From this context, E 20 can be derived:
E 20 ϑ 1 ϑ M ϑ 0 ϑ 2   .
Furthermore, the temperature at the sliding surface can be calculated from Q ˙ 20 = Q ˙ 12 in accordance with Equation (9), taking into account Equation (10):
ϑ 0 a 0 + 1 ϑ 2 a 0 ϑ M
a 0 a 12 a 20

2.2. Development of the Soft Sensor for Friction Power Performance Determination

The model shown in Figure 1b is also used to derive the soft sensor for determining the frictional power ( P R ) of a mechanical seal. Friction power can be represented as the sum of all heat flows transferred to the pumped medium, as shown in Figure 1b:
P R Q ˙ 10 + Q ˙ 12 + Q ˙ 30
The frictional power can be calculated, in accordance with Equation (12), when Equation (5) is taken into account in Equation (11). Here, A _ denotes the column matrix from Equation (13). It contains the form coefficients. The column matrix, Θ _ , in Equation (14) summarises the temperatures required for the calculation. See Appendix A for the complete derivation.
P R = A _ · Θ _
A _ a 10 + a 30 ,   a 12 ,   a 10 + a 12 + a 30
Θ _ ϑ 0 ,   ϑ 2 ,   ϑ M T
All temperatures in Θ _ can be measured by sensors with little effort, except the sliding surface temperature. However, Equation (9) can be used to calculate the sliding surface temperature. Equation (12) also requires the calculation of each form coefficient. The number of calculation steps can be significantly reduced by replacing the form factor matrix ( A _ ) and reducing the temperature matrix ( Θ _ ). This can be achieved with a small number of transformations. In this way, the form factor matrix can be reduced to an equivalent form coefficient ( a a e q ):
a a e q a 10 + a 30 a 0 + 1 + a 12 .
The advantage of defining the equivalent form coefficient is that it eliminates the need for matrix operations in Equation (12), thus simplifying the calculation of the frictional power, as shown below:
P R = a a e q ϑ 2 ϑ M .
See Appendix B for the full derivation of the equivalent form coefficient. Note that the heat transfer coefficient also applies to the equivalent form coefficient, so a a e q : R 2 R , as described in Section 2.1. The condition of the flow around the mechanical seal can be described by the speed of the primary ring ( n ). With little effort, the temperature of the pumped medium and the temperature of the mating ring can be measured in addition to the speed. For the visualisation of the equivalent form coefficient, a dimensional analysis was performed in accordance with the description of H. Schade et al. [23]. Equation (17) gives the equivalent dimensionless form coefficient ( A a e q ), where η is the dynamic viscosity of the medium, c v is the specific heat capacity of the medium, and D G R is the outer diameter of the mating ring.
A a e q a a e q η c v D G R .
It can be deduced that A a e q N u ¯ due to the dependence of the equivalent form coefficient on the heat transfer coefficient. This allows a regression function to be defined in accordance with the structure shown in Equation (4). Algorithm 1 below summarises the soft sensor principle described. The index t denotes the discrete time steps. Algorithm 1 incorporates a low-pass filter to attenuate sensor signal noise. The damping characteristics are controlled by the damping factor, d f . The soft sensor requires input variables, namely the measured signals for speed, medium temperature, and mating ring temperature at a discrete time step, t ( n e x p t ,   ϑ M , e x p t ,   ϑ 2 , e x p t ). The outer diameter of the counter ring ( D G R ) is used as the characteristic length to calculate the Reynolds number ( R e ):
R e π n D G R 2 ν .
This kinematic viscosity is known as ν . For all medium parameters of the column matrix M _ , M _ : ϑ M P r ; c v ;   ρ ;   λ ; ν ;   η applies.
Algorithm 1: Soft sensor for determining the frictional power of a mechanical seal.
define d f , M
define c , m , h , b
n t n e x p t d f + n t ( 1 d f )
ϑ M t ϑ M , e x p t d f + ϑ M t 1 d f
ϑ 2 t ϑ 2 , e x p t d f + ϑ 2 t 1 d f
Calculation of R e t , P r t , P r W t , c v t ,   ρ t ,   λ t ,   ν t ,   η t
A a e q t = c ( R e t ) m ( P r t ) h P r t P r W t b
a a e q t = A a e q t · η t · c v t · D G R
P R t = a a e q t ϑ 2 t ϑ M t

3. Evaluation of the Accuracy of the Soft Sensor Determination

3.1. Soft Sensor Validation Test Bench

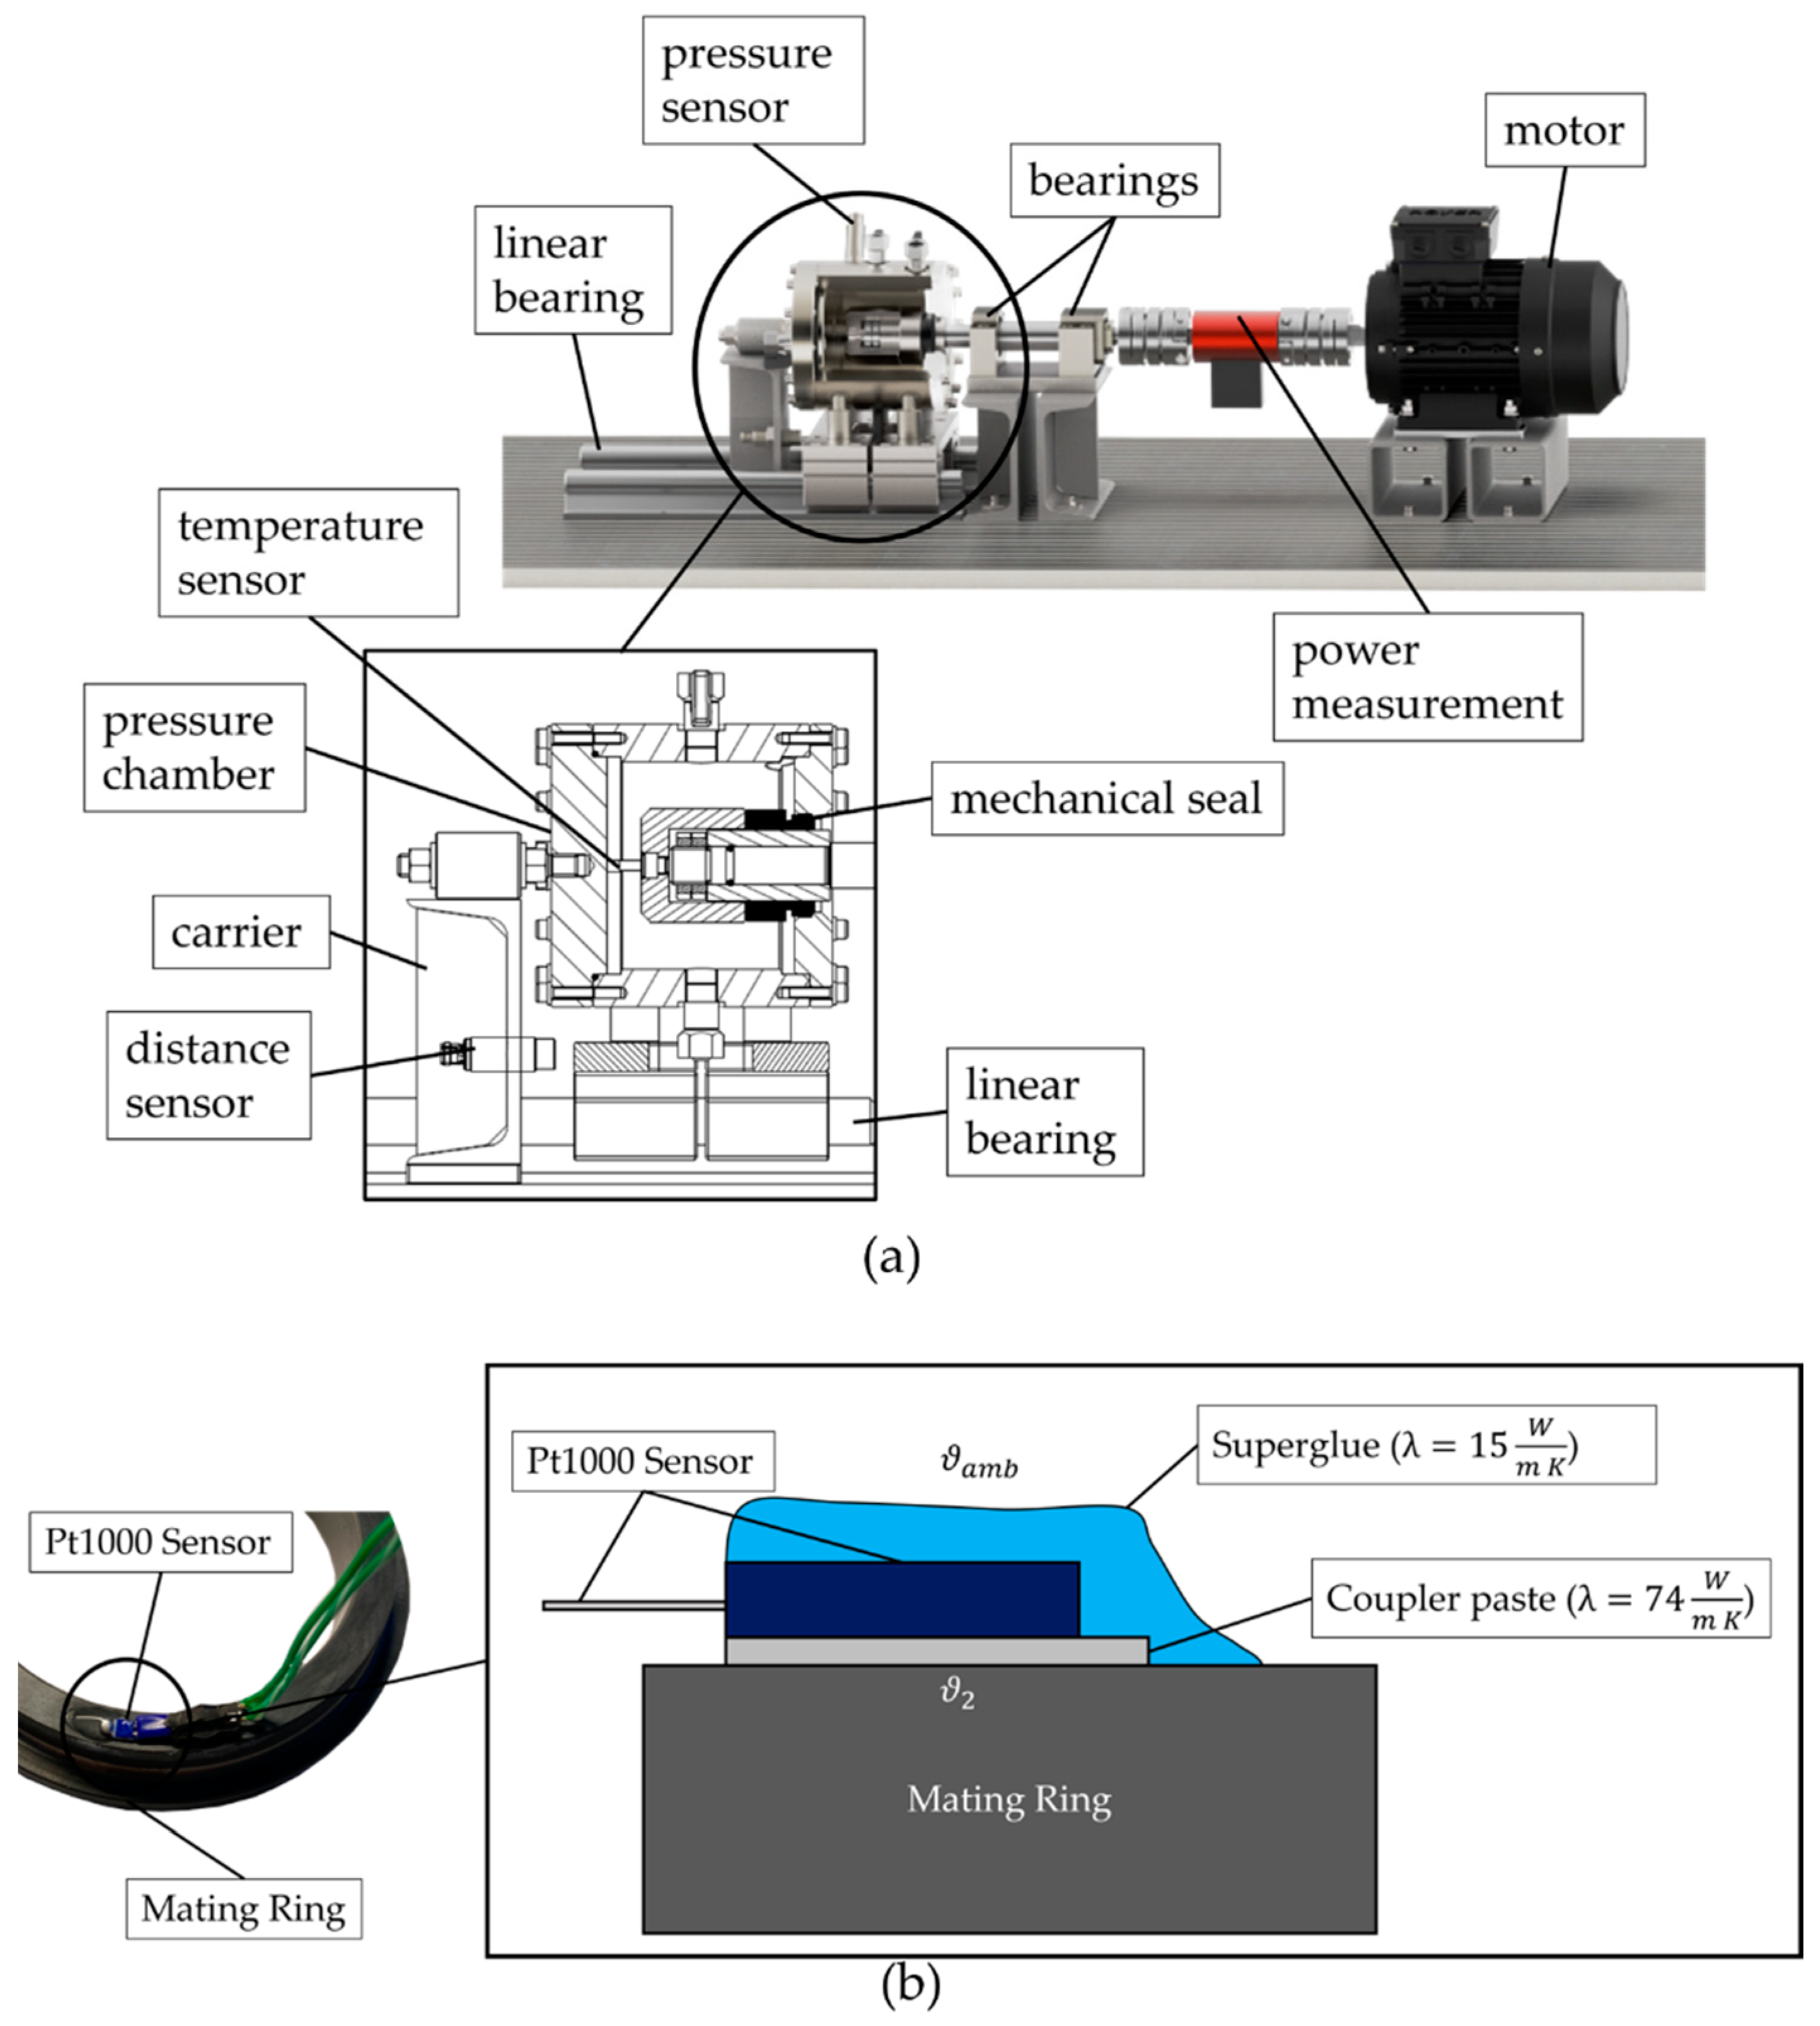
To validate the soft sensor algorithm (Algorithm 1), a test bench was developed. Mechanical seals of various sizes can be tested. Figure 2a shows the structure of the test bench. The mechanical seal is located in a pressure chamber. Linear bearings allow the pressure chamber to be moved. By pulling the pressure chamber against a carrier, the preload on the primary ring can be adjusted. The change in preload is measured by a distance sensor. Water is used as the medium in the pressure chamber. The temperature of the medium is measured by a PT1000 temperature sensor. The pressure in the pressure chamber can be varied. This is measured by a pressure sensor. The primary ring is mounted on a shaft with two bearing supports. A motor with variable speed allowed via a frequency converter drives the shaft. A torque transducer measures the power delivered by the motor to the shaft. This records the torque and speed. The power consumption of the bearing is measured in addition to the power consumption of the mechanical seal ( P S ). This determination of the power consumption of the bearing is based on experimentation and is expressed by a regression function. The power losses of the bearings are subtracted from the measurement signals of the power consumption.
The power of the mechanical seal ( P S ) consists of the friction power ( P R ) and the ventilation power ( P V ) resulting from the power transfer between the mechanical seal and the medium [24]:
P S P R + P V .
Due to speeds n ≤ 3000 rpm and low-viscosity media such as water, it holds P R P V [24], and, as a good approximation, it is P S P R . Figure 2b shows the coupling of the PT1000 temperature sensor to the mating ring. A coupling paste facilitates heat transfer between the temperature sensor and the mating ring with a surface temperature, ϑ 2 . The coupling paste has a thermal conductivity of λ = 74 W m K . The temperature sensor is attached to the mating ring using superglue. The thermal conductivity of the superglue can be assumed to be λ = 15 W m K . Placing a temperature sensor on the surface of the mechanical seal causes a localised temperature change due to variations in the thermal conductivity against the base material [25]. In order to assess the impact of the sensor on the surface temperature in its vicinity, the coupling factor ( B S ) was calculated using Equation (20) [25]. To calculate B S , the temperature measured by PT1000 ( ϑ S ), the ambient temperature ( ϑ a m b ) and the actual surface temperature at the measuring point ( ϑ 2 ) are required. The coupling factor for the sensor coupling is assumed to be B S = 5 e 3 .
B S ϑ S ϑ 2 ϑ a m b ϑ 2
A PT1000 sensor was also used to record the ambient temperature ( ϑ a m b ). The sampling frequency for all measured quantities was f S = 500 Hz. The Gaussian law of error propagation was used to calculate the maximum relative errors for the variables P R and ϑ . ϑ is the temperature difference between the temperature of the mating ring ( ϑ 2 ) and the temperature of the medium in the pressure chamber ( ϑ M ). The maximum relative errors of all variables are summarised in Appendix C. To validate the soft sensor approach, three mechanical seals were measured. Table 1 shows the parameters of the three mechanical seals. These are labelled as test objects (POs). The table contains ring material information in addition to the geometric parameters. It can be seen that the mechanical seals have different dimensions. They also have different material combinations. All of the seals are made of silicon carbide (SiC). This has been further optimised by the manufacturer, in particular for the improvement of emergency running characteristics [26]. The optimised material is called “SiC1”. It can be seen that PO001 and PO002 have the same dimensions. These two seals differ in the material of the mating ring. In case of PO002, the material of the mating ring is called “SiC2”.
In addition to the different material properties of SiC1 and SiC2, closer inspection of the sliding surfaces also reveals different surface morphologies. These are shown in Figure 3 below. The left-hand-side photograph shows a view of the slide surface of PO002. The material is SiC2. The grooves are the result of the lapping of the surface, and only minor other surface changes can be detected. The right-hand-side photograph depicts the slide surface of PO001. The material is SiC1. In contrast to SiC2, one can observe spherical indentations, distributed over the entire surface.

3.2. Comparison of Equivalent Dimensionless form Coefficient between Numerical and Experimental Results

The temperature field of the mechanical seal must be resolved to calculate the transmission efficiencies. The temperature fields were calculated using the two-dimensional steady-state heat conduction equation, Equation (21). The equation is derived from the three-dimensional transient heat conduction equation [22]. The equation assumes a uniform temperature distributed around the mechanical seal, i.e., that the thermal conductivity, λ , of the mechanical seal is constant. The heat conduction equation was solved using Matlab’s PDE Modeler.
1 r r r λ ϑ r + x λ ϑ x = 0
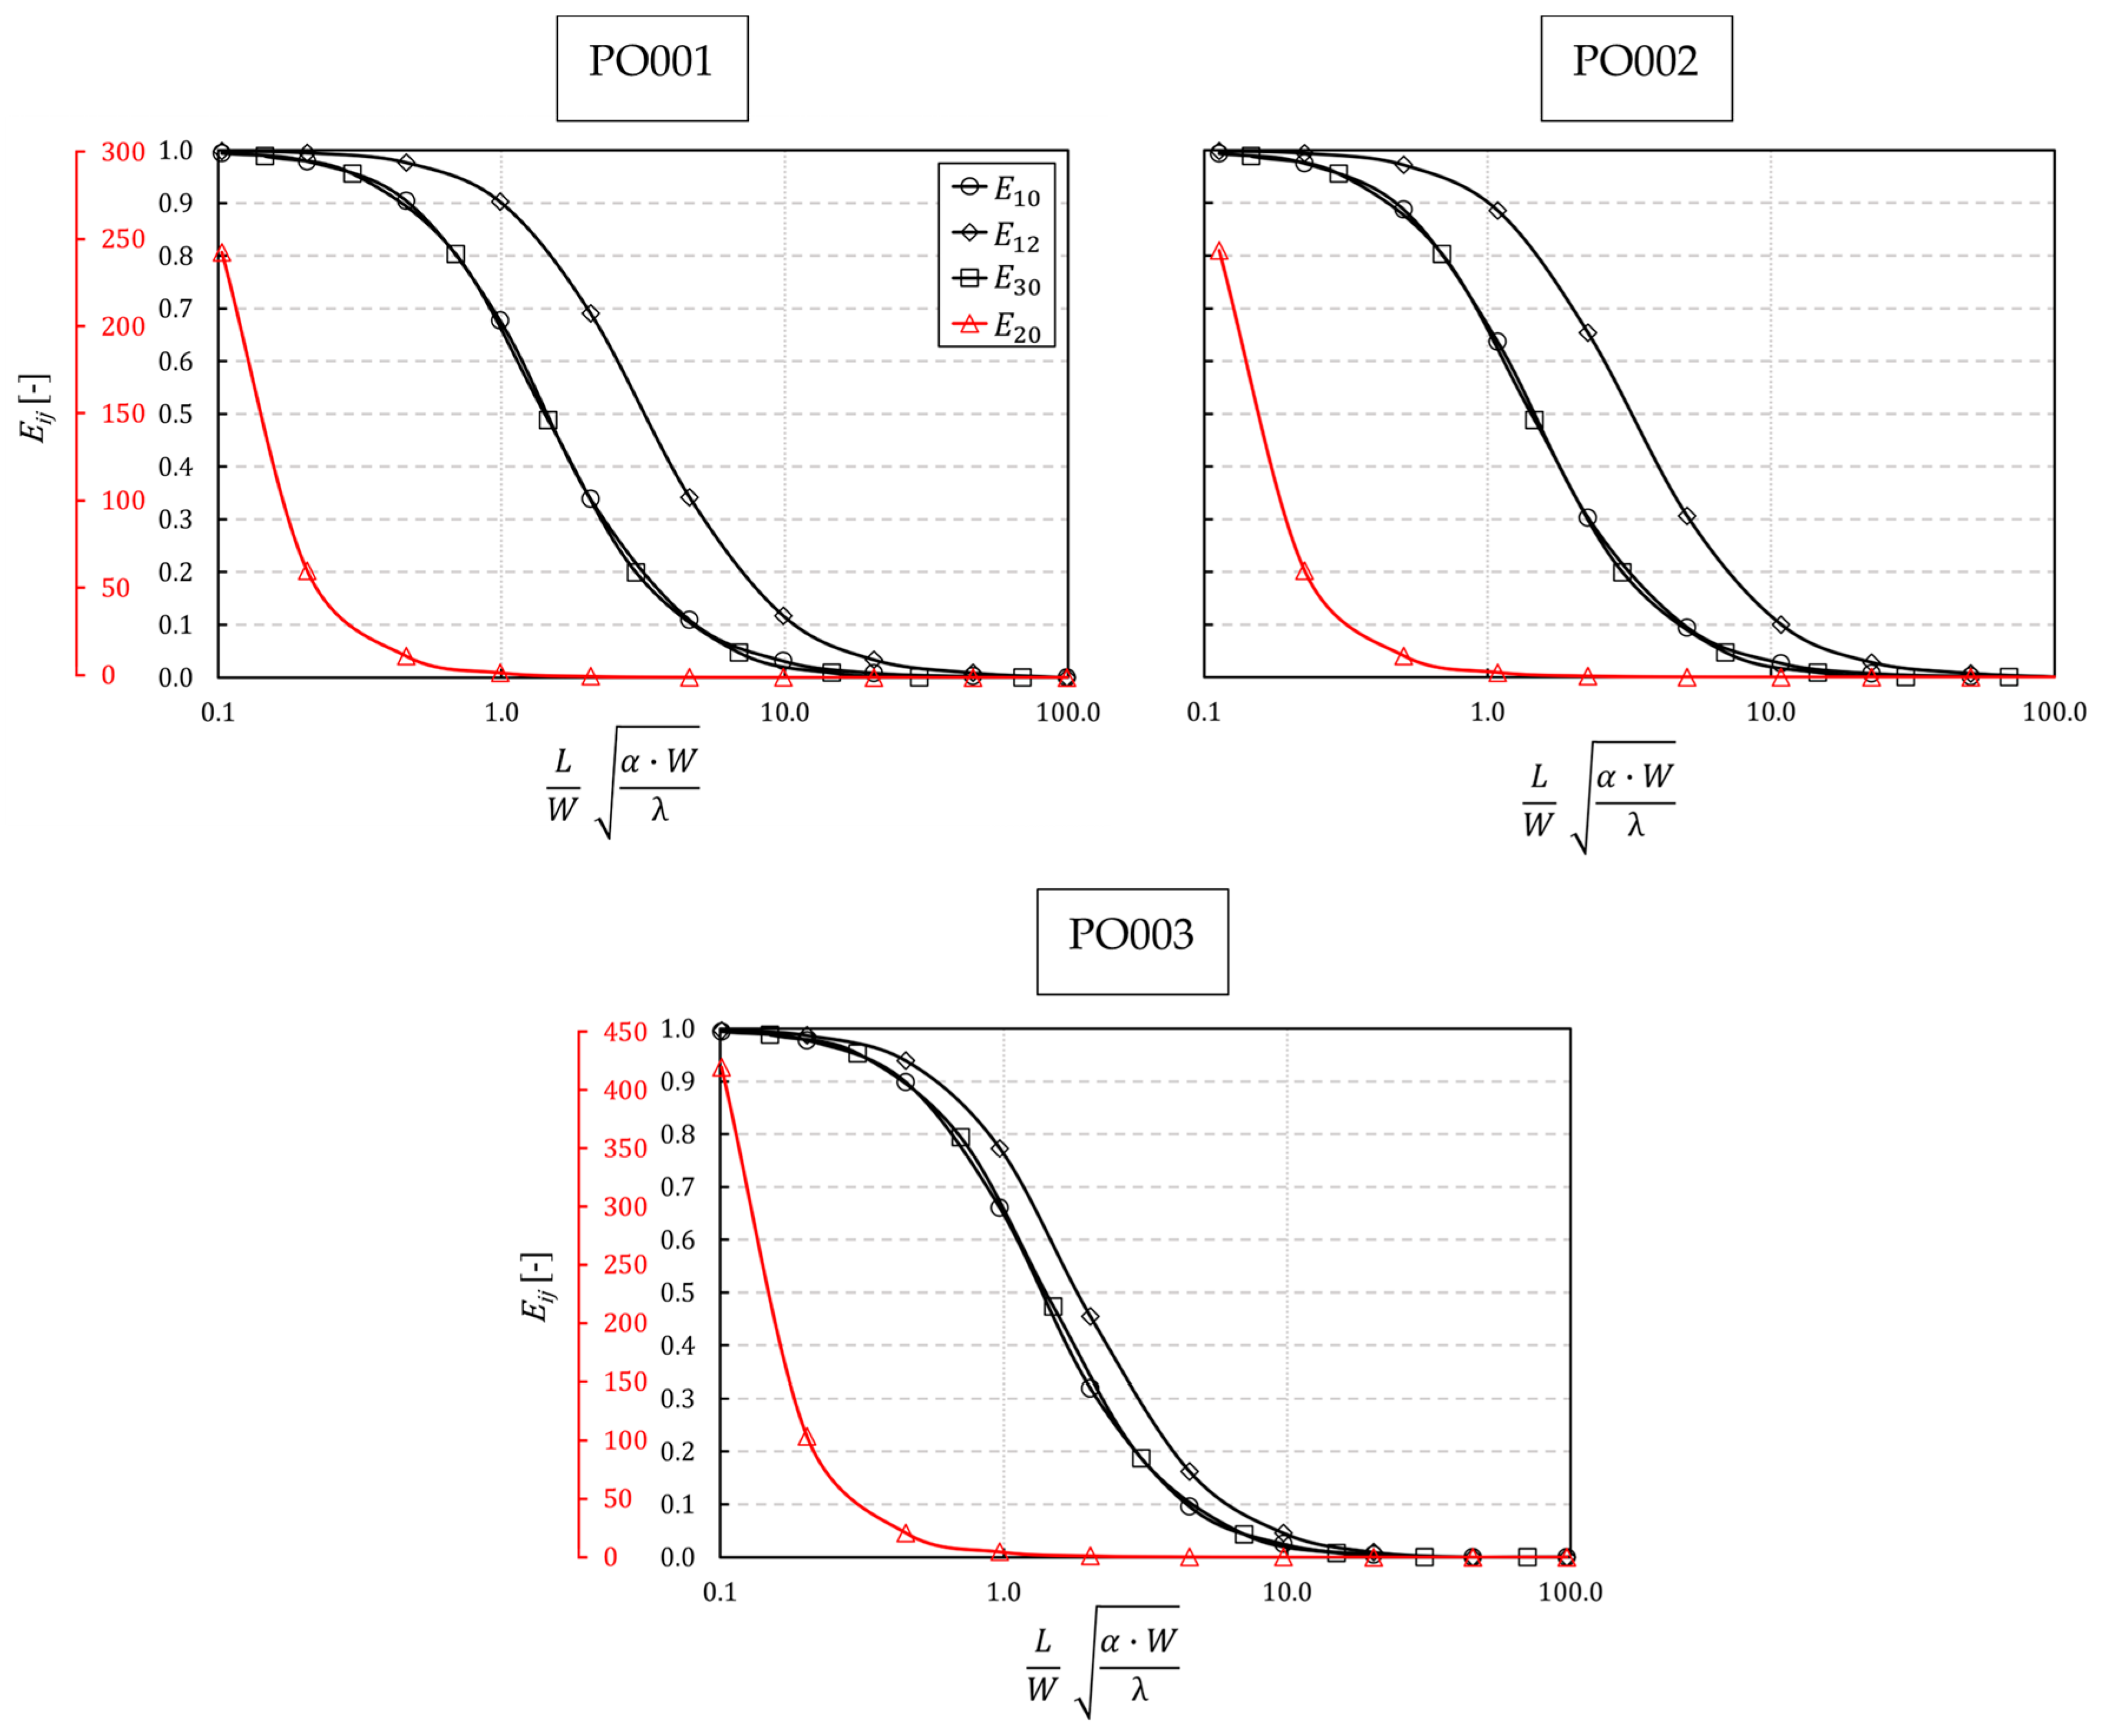
Figure 4 shows the calculated transmission efficiencies from Equations (7) and (8) for the three mechanical seals. To calculate the transmission efficiency, the averaged surface temperatures were used. A constant friction power of P R = 100 W was applied to each of the rings as a boundary condition at the sliding surface. A constant medium temperature of ϑ M = 20 °C was also assumed. As suggested by Luan and Khonsari (2007) [17], the transmission efficiencies are plotted against the parameter L W α   W λ . In addition to the heat transfer coefficient and thermal conductivity, the characteristic lengths ( L ) and widths ( W ) from Table 1 also contribute to the parameter. At the surfaces to the medium (surfaces 1 and 3 ), a constant heat transfer coefficient was considered. Depending on the parameter L W α   W λ , α was varied. The convective heat flows ( Q ˙ C , i ) at the surfaces were considered due to the assumed constant medium temperature and heat transfer coefficient, neglecting the time dependence of the temperature field, as shown in Equation (21).
The transmission efficiency, E 20 (red graph), converges to zero as the heat transfer coefficient increases. It differs from the other heat transmission coefficients shown as it does not exhibit values greater than one for small heat transfer coefficients. The limiting case of Equation (8) shows that the following:
lim α 0 E 20 = .
Since the only source of heat dissipation in the model is heat transfer between the medium and the mechanical seal, this seems logical. Moreover, all the mechanical seals show that E 10 E 30 . The mating ring length to width ratio ( L / W G R ) for seals PO001 and PO002 is approximately 1.6 times that of the primary ring ( L / W G L ). For PO003, L / W G R 1.7 L / W G L . Given that E 10 E 30 , comparable transmission efficiencies can be achieved in the mating ring with lower heat transfer coefficients than in the primary ring. As shown in Figure 1b, this is due to the larger area of A 1 compared with that of A 3 . The differences in transmission efficiency between PO001 and PO002 can be considered small. The mating ring material is different for these two seals.
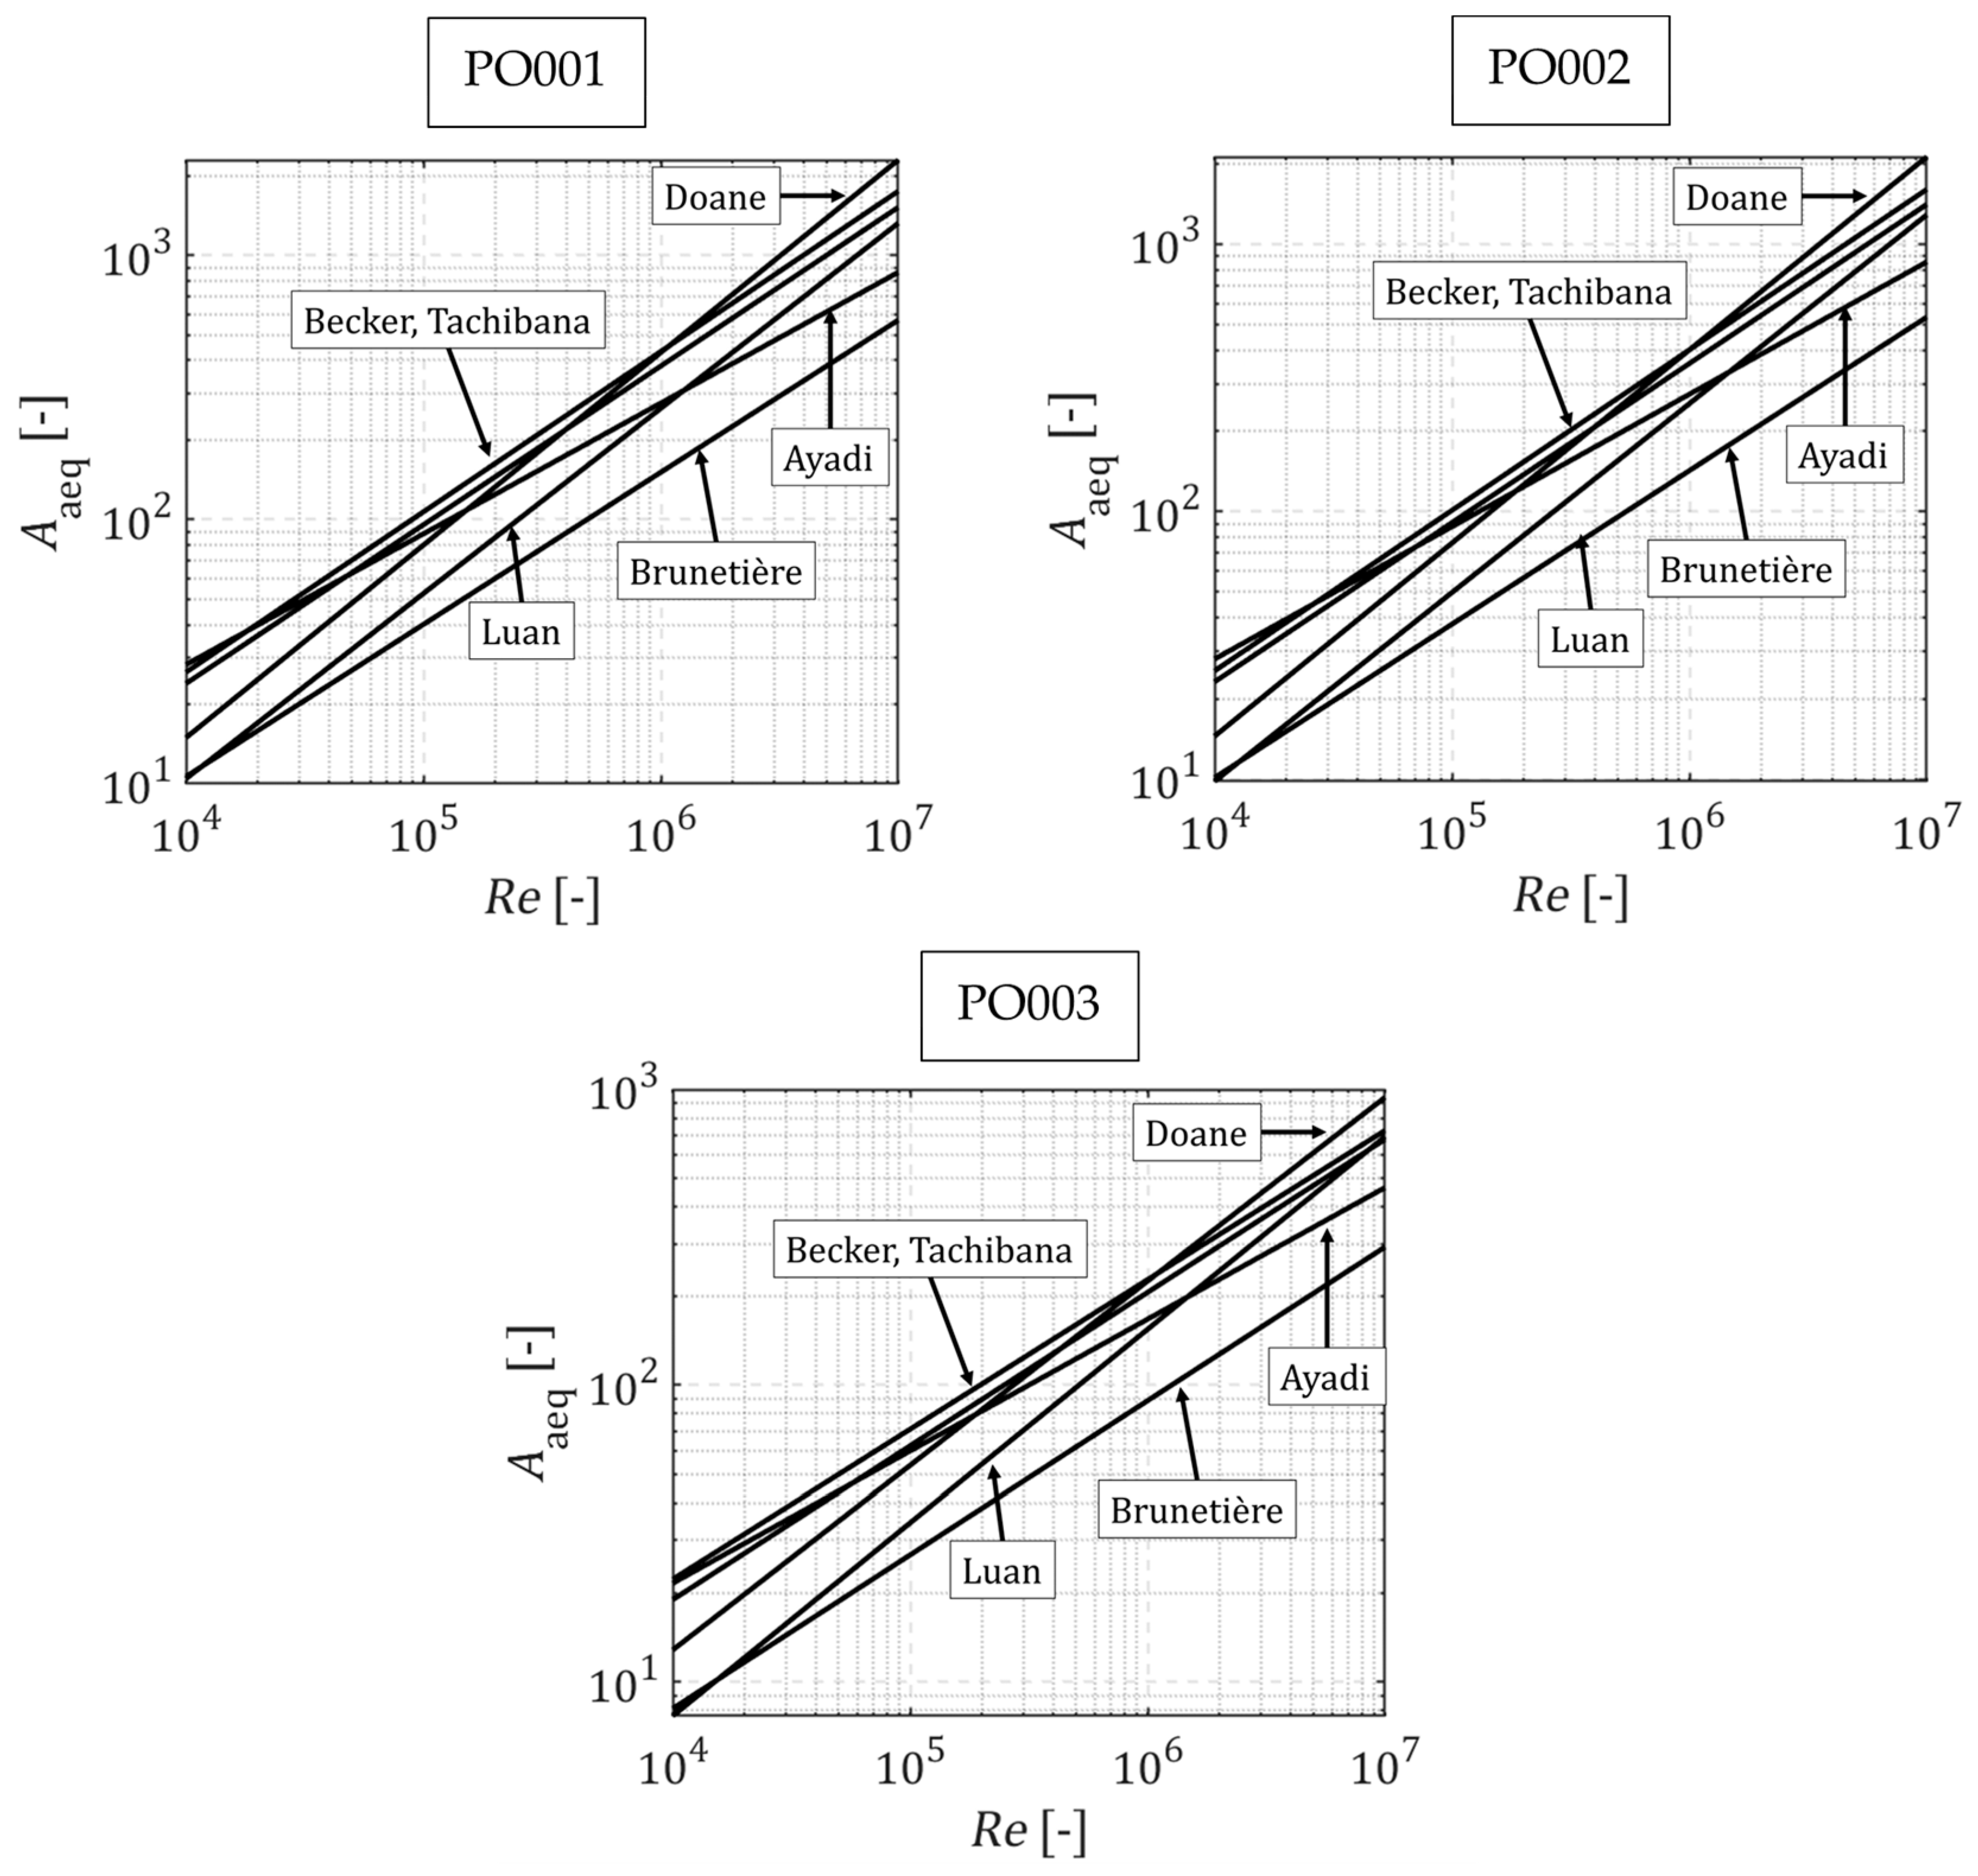
In addition to resolving the temperature field, the model for calculating the averaged Nusselt number ( N u ¯ ) must be known to calculate the equivalent dimensionless form coefficient. K. Ayadi et al. compared several models for the determination of N u ¯ with their own model [27]. These are divided into analogue model approaches [28,29] and mechanical seal approaches [30,31]. By varying the N u ¯ approach, the equivalent form coefficient was calculated for the three mechanical seals. Equation (15) was used to calculate the equivalent form coefficient. All equations used to calculate N u ¯ were taken from K. Ayadi et al. [27]. These include the approaches of K. Becker [28], F. Tachibana and S. Fukui [29], Z. Luan and M. Khonsari (2008) [31] and J. Doane et al. [30]. The approach presented by N. Brunetière and B. Modolo was also used [18]. For all three mechanical seals, the calculated equivalent dimensionless form coefficients ( A a e q ) are plotted against the Reynolds number in Figure 5. The individual graphs were labelled according to the first authors’ surnames of [18,27,28,29,30,31]. The equivalent dimensionless form coefficient is significantly influenced by the approach used for characterising the heat transfer. Since the equivalent dimensionless form coefficient depends on the heat transfer coefficient and thus on the average Nusselt number, the function from Equation (4) can be used. Factors h and b from Equation (4) were set to h = 1 / 3 and b = 0.25 . The fitted coefficients of the approach functions for the equivalent dimensionless form coefficients as a function of the approach functions of the averaged Nusselt numbers are shown in Table 2. In addition to the coefficients of the calculated approximate functions, the coefficients of equivalent functions determined from measurements of the three mechanical seals (Approach) are also given.
The coefficient m in the models of Doane [30] and Luan [31] is different from that in the other models. For the experimental determination of the equivalent dimensionless form coefficients, the differential pressures across the mechanical seal ( p ) and the primary ring preload ( s ) were kept constant. In the interval n e x p { 0   r p m ;   3000   r p m } , the speed of the primary ring ( n e x p ) was varied. The experimentally determined equivalent dimensionless form coefficients were determined using Equation (23), where P R , e x p is the measured frictional power, ϑ 2 , e x p is the corrected surface temperature at the measuring point, ϑ M , e x p is the measured medium temperature in the pressure chamber and n e x p is the measured primary ring speed.
A a e q = P R , e x p ϑ 2 , e x p ϑ M , e x p · 1 η ( ϑ M , e x p ) · c v ( ϑ M , e x p ) · D G R
The material data of dynamic viscosity ( η ) and specific heat capacity ( c v ) of the medium in the pressure chamber were determined as a function of the measured medium temperature ( ϑ M , e x p ). The corrected surface temperature at the measurement point ( ϑ 2 , e x p ) was obtained by rearranging Equation (20).
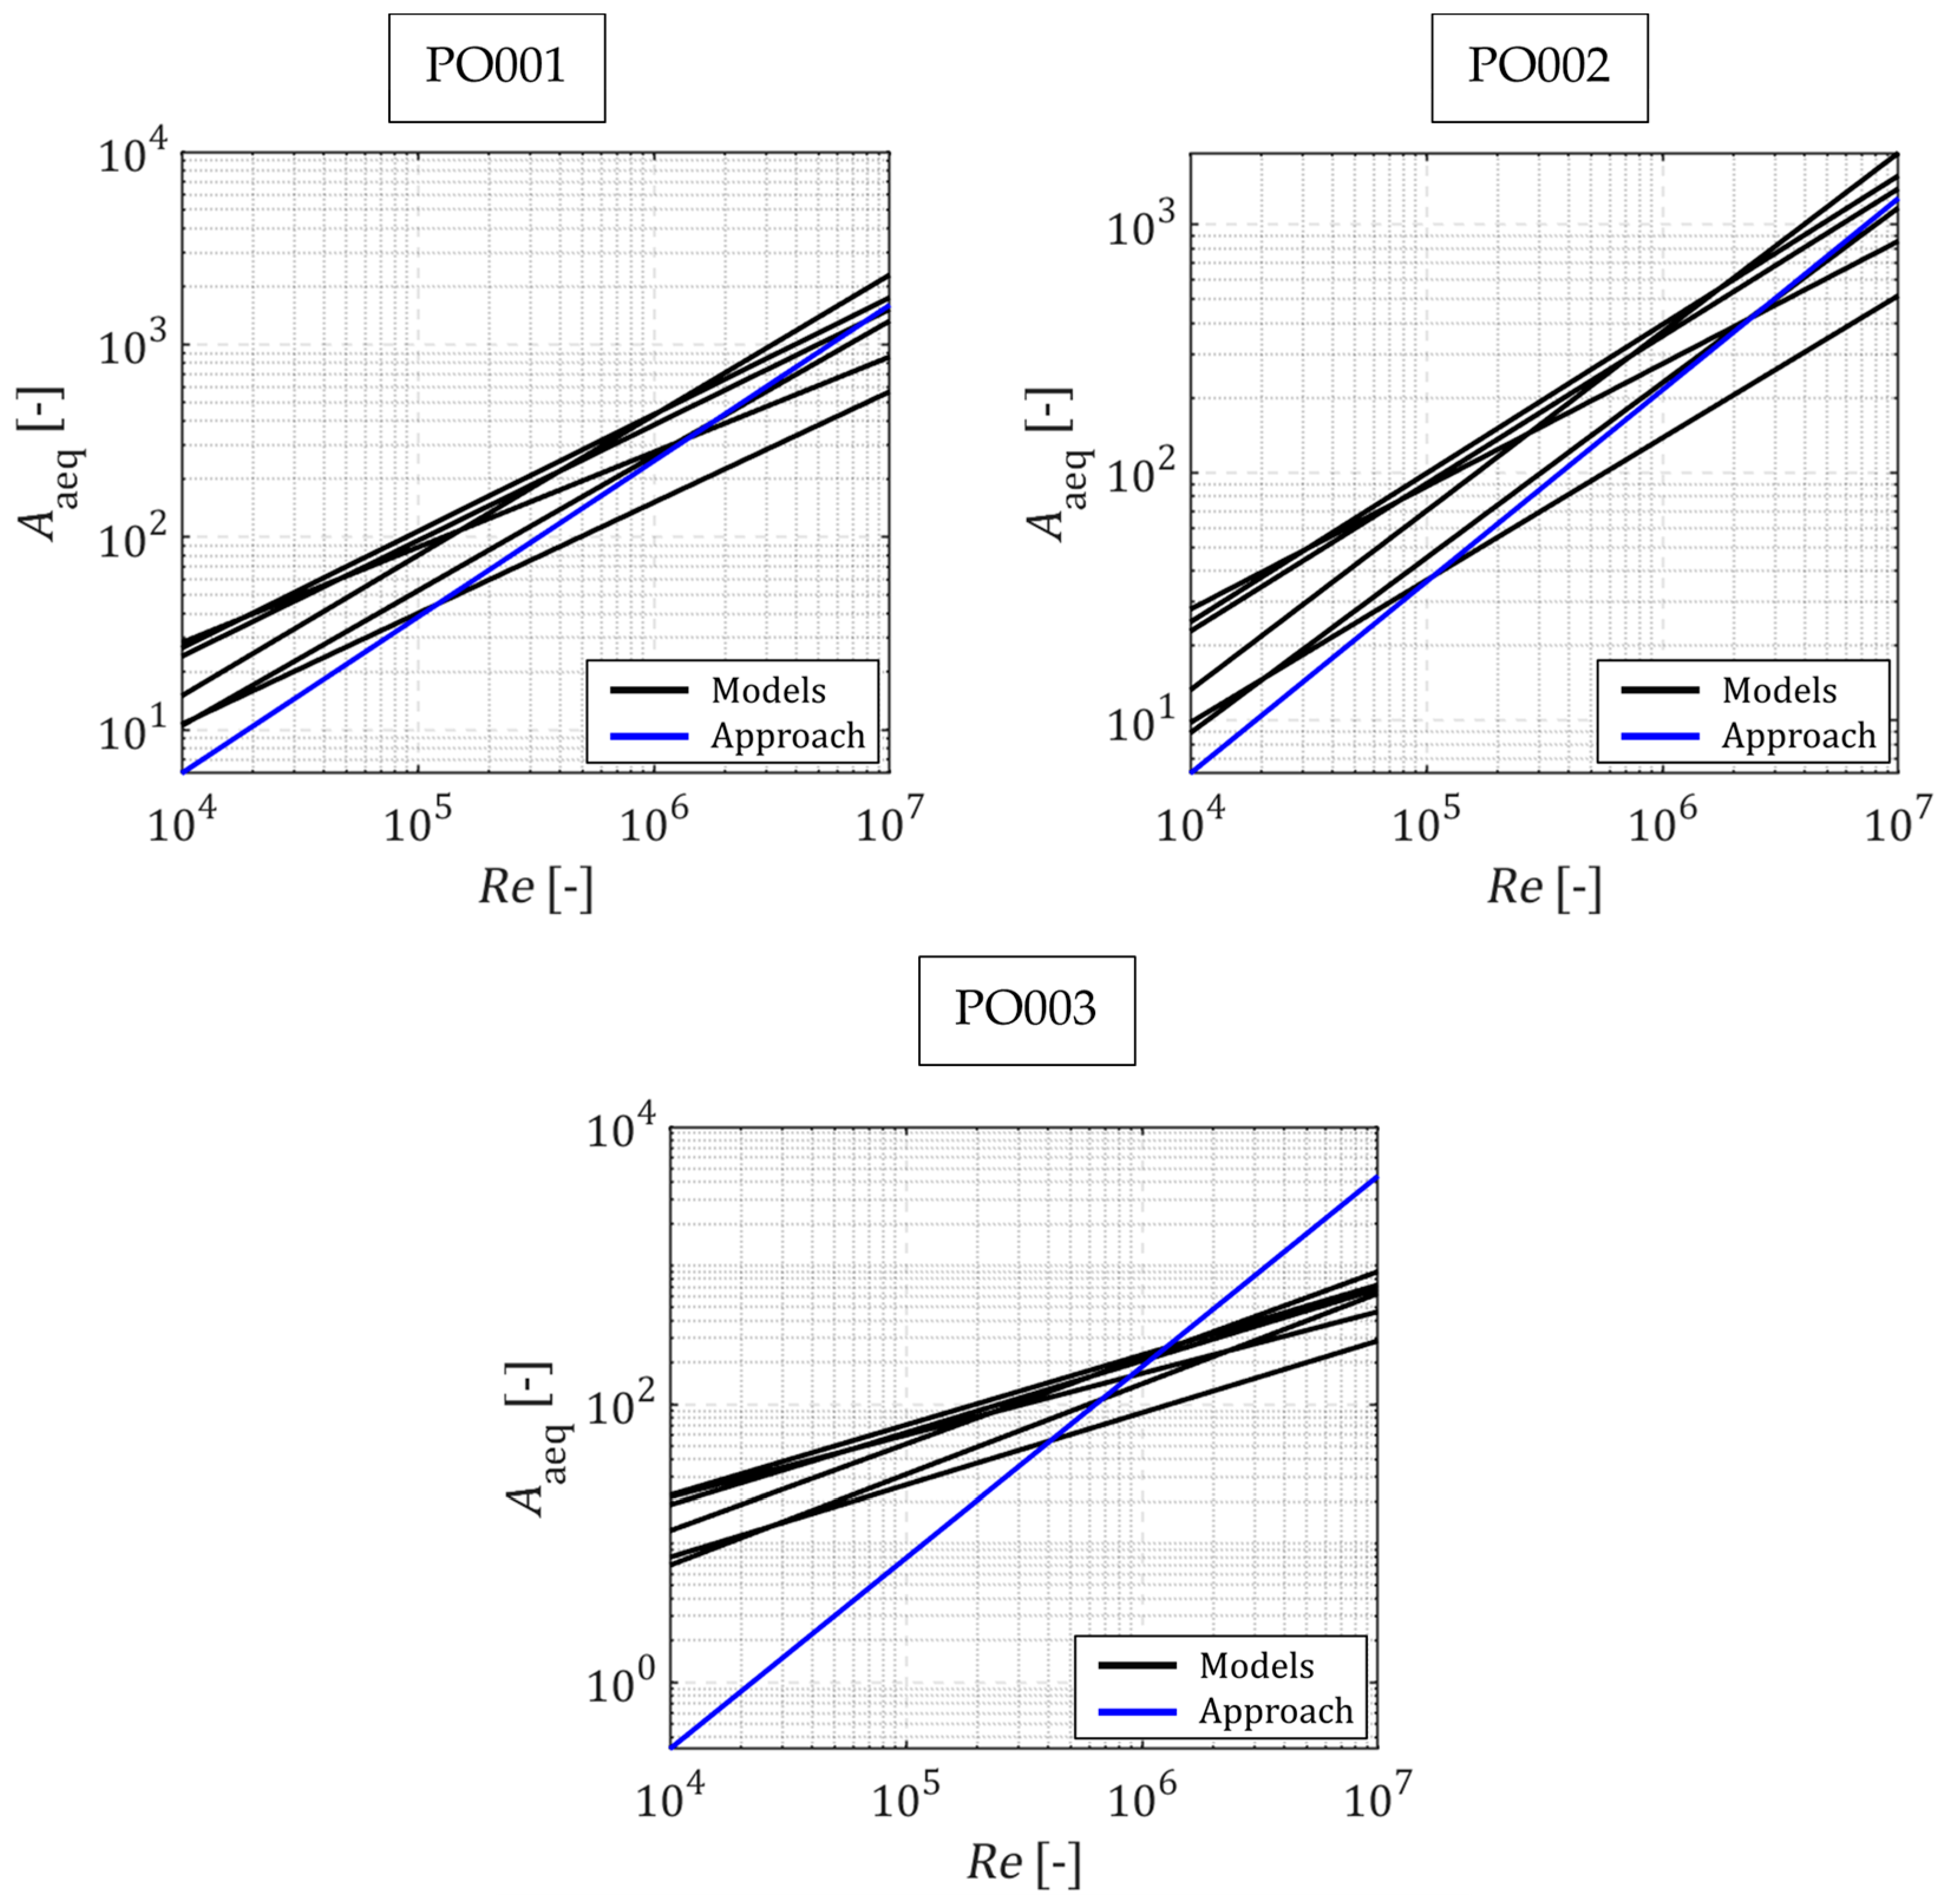
An approximation function with the structure of Equation (4) was fitted to the measurement data points. Table 2 also shows the coefficients of the approximation functions of the three mechanical seals. Figure 6 shows the approximation function (labelled “Approach”, blue curve) together with the calculated equivalent dimensionless form coefficients as a function of the approach models used to determine the averaged Nusselt number (black curves, labelled “Models”) for the three mechanical seals PO001, PO002 and PO003. For R e 8 × 10 4 , the approximation function (Approach) is different from the calculated A a e q value for PO001. J.C. Doane et al. state that for R e 1 × 10 5 , a laminar model should be used for the determination of the averaged Nusselt number [30]. The models used to determine the averaged Nusselt number are all for turbulent flow only. This means that no laminar models were considered in the calculation of the equivalent dimensionless form factor. In Figure 4 and Figure 5, the differences in E i j and A a e q between PO001 and PO002 were judged to be small. The mating ring material differs between these two POs. Table 1 shows the thermal conductivities used to calculate A a e q . The measurements also show a small deviation. As shown in Table 2, the exponent m of the approach in accordance with Equation (4) is well approximated by the models of J.C. Doane et al. [30] and of Z. Luan and M. Khonsari (2008) [31]. This can also be seen in Figure 6. In the logarithmic display of Figure 5 and Figure 6, the exponent m is used to determine the slope of the curves. PO003 behaves differently to PO001 and PO002. However, PO003 has a larger deviation of the exponent m compared with the calculations. To summarise, the differences between A a e q calculated using transmission efficiencies and the measured A a e q value are obvious. Deviations depend on the Reynolds number.

3.3. Quality of Soft Sensor Calculation for Stationary Operation of Mechanical Seals

The soft sensor algorithm described in Algorithm 1 can be analysed under different operating conditions using experimentally determined approximation functions for the three seals. The following tests have been carried out on PO001. To evaluate the quality of the soft sensor, the root mean squared error ( R M S E ) is used according to Equation (24) [32]. P R , e x p is the measured frictional power and P R is the frictional power determined by the soft sensor.
R M S E i = 1 N P R , i P R , e x p , i 2 N
Figure 7a shows the R M S E plotted in black against mechanical seal differential pressure ( p ). A preload of s = 5   m m was applied to the primary seal ring. During the measurements, the speed of the primary ring was n e x p = 1480   r p m . Besides the R M S E , the measured friction power ( P R , e x p ) is shown in blue. The differential pressure was varied in the interval p { 0   b a r ; 5   b a r } . When p was varied, P R , e x p changed only slightly. Given the numerous assumptions and the stationary model underlying the friction power calculation in Algorithm 1, an R M S E 20   W is considered a minor deviation. The R M S E for varying p was always R M S E < 6   W . Equalisation were been drawn through the measurement points for trend identification. The R M S E increases with the increase in p . The R M S E was also analysed using varying s values. The results are shown in Figure 7b. R M S E (black) and P R , e x p (blue) are plotted against the preload ( s ). The speed of the primary ring was also set to n e x p = 1480   r p m . The differential pressure across the mechanical seal during the measurements was p = 0   b a r . When s is varied, the R M S E also shows a weak dependence. It shows R M S E values that are similar to those obtained by varying p . In addition to the variation in p and s , the geometry around the mechanical seal was also varied. The heat transfer between the mechanical seal and the medium is influenced by the change in the geometry around the mechanical seal. For this purpose, fins were distributed around the mechanical seal, as shown in Figure 7c. The fins extend up to half the unloaded primary ring height. For the modified geometry around the mechanical seal shown in Figure 7c, an approximation function for the equivalent dimensionless form coefficient was again determined. The calculated curves of A a e q are shown as black curves in Figure 7d. These are called “Models”. The blue curve labelled “Approach” represents the experimentally determined approximation function without fin geometry around the mechanical seal, while the red curve “Approach Fin” includes fin geometry. The experimental curves (Approach Fin) agree better with the calculated curves (Models). A possible reason is that the fin geometries improve the turbulence around the mechanical seal and thus the heat transfer. The average Nusselt number calculation models assume turbulent flow. It can be concluded that the geometry around the mechanical seal has a major influence on the heat transferred and therefore on A a e q .

3.4. Soft Sensor Behaviour with Variation in the Mechanical Seal Stationary Operating Conditions

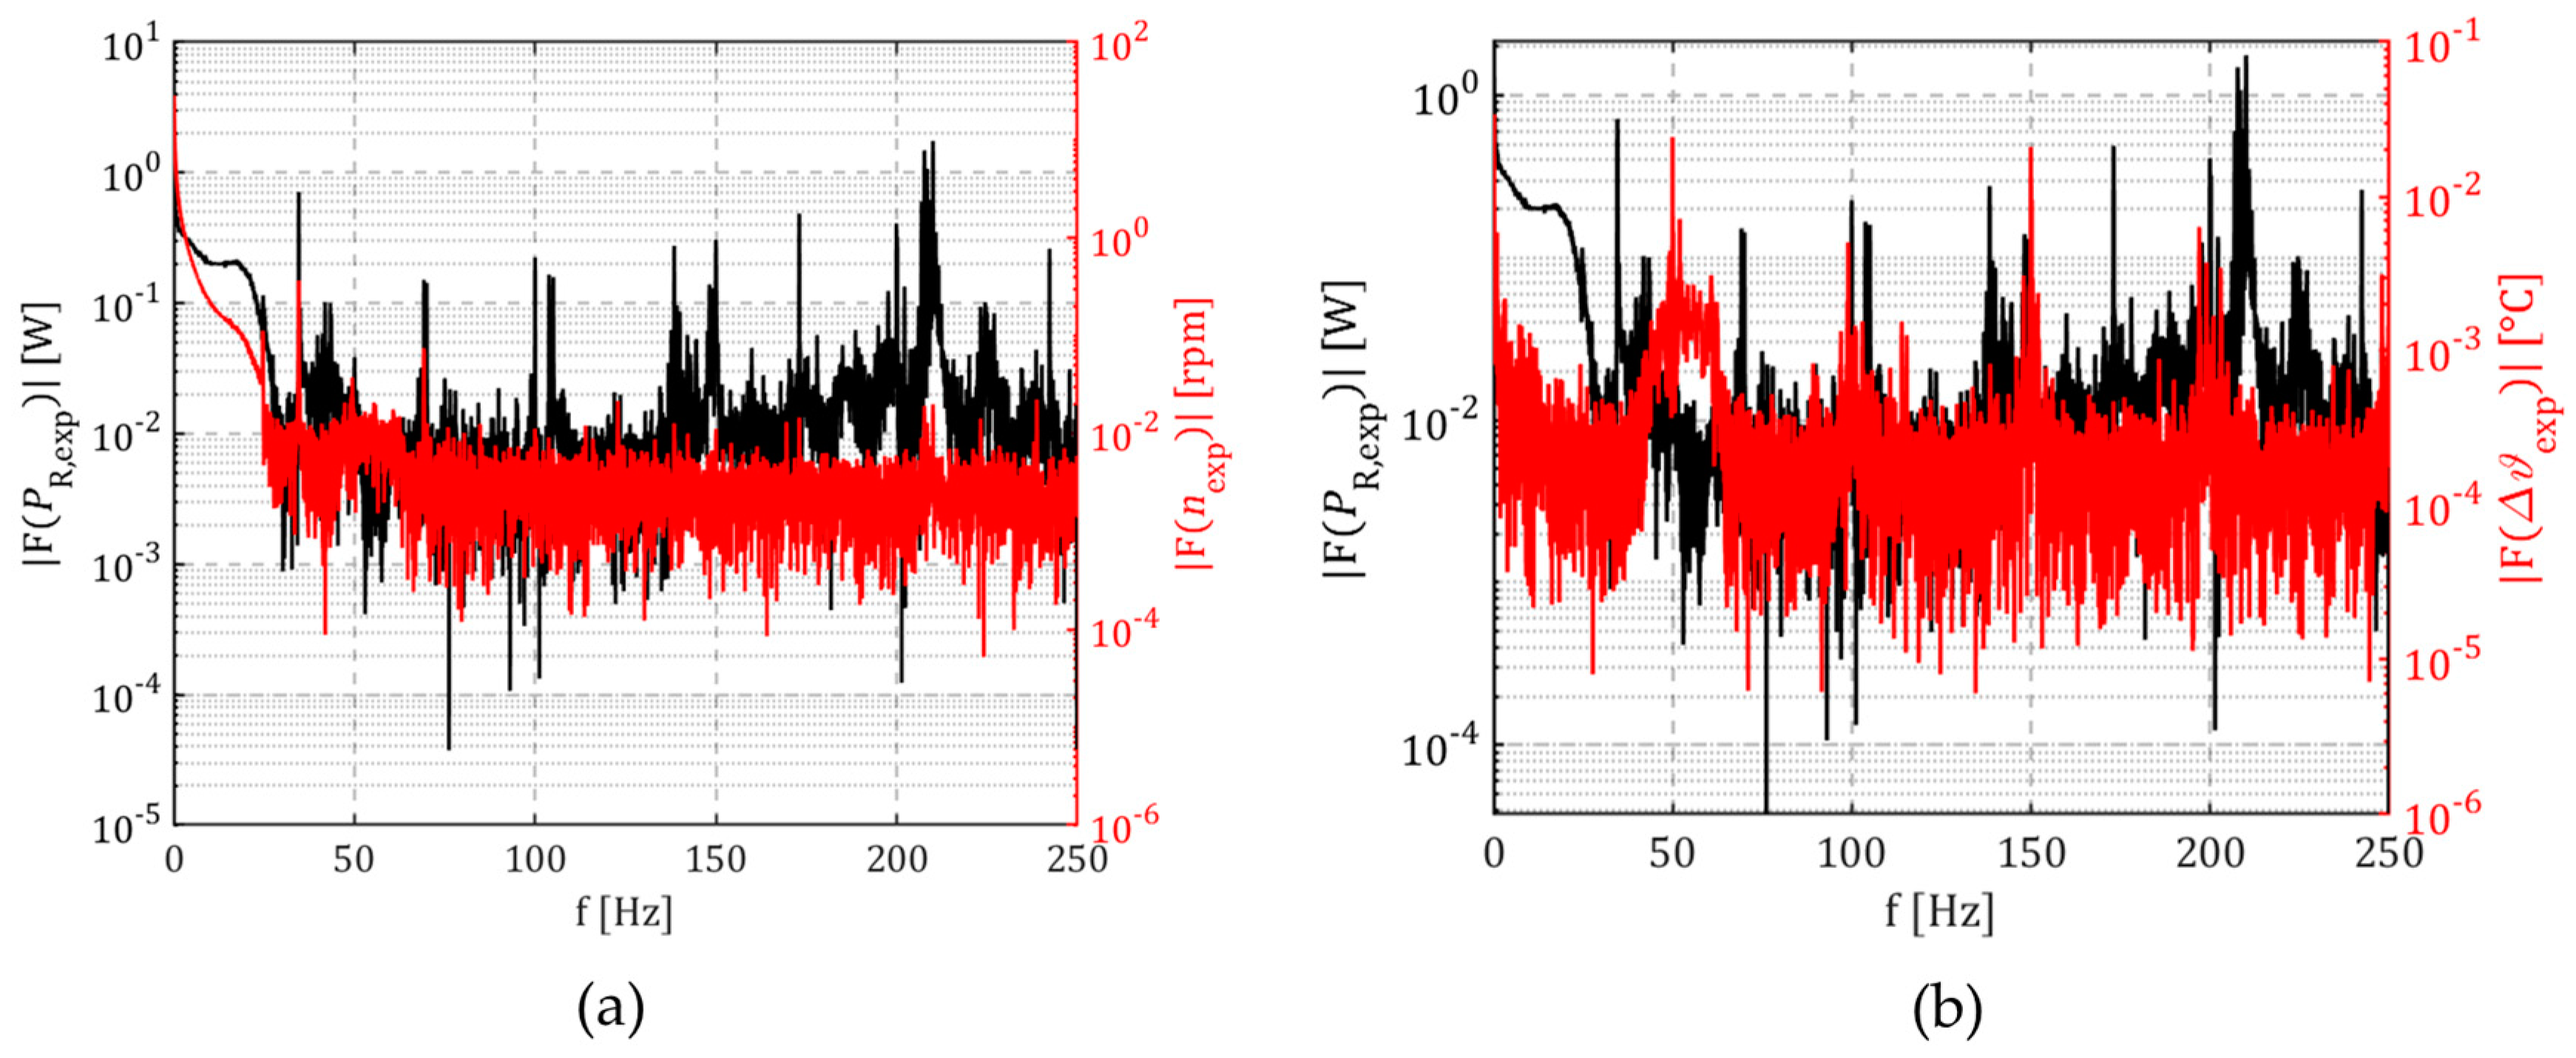
A notable feature of the heat flow model derived in Section 2.1 is the assumption of stationary temperature fields. However, the operating conditions of mechanical seals in centrifugal pumps can change. This is especially true when the pumps are speed-controlled. For example, the centrifugal pumps used in swimming pool technology are operated at two fixed points of operation. At night, the pumps are throttled back to a lower speed compared with the daytime operating point to save energy. The amplitude spectrum of the measured frictional power ( F P R , e x p ) and speed ( F n e x p ) of PO003 is shown in Figure 8a. The spectra were generated for a step response of PO003. For the step response from n e x p = 1500   r p m to n e x p = 2100   r p m , the primary ring speed ( n e x p ) was increased abruptly. The spectra were not filtered. A Hanning window was used to window the data. As Figure 8a shows, other frequencies are much more prominent in the spectrum of P R , e x p than in n e x p . Figure 8b also shows this behaviour. The amplitude spectrum of the measured frictional power ( F P R , e x p ) and speed ( F ϑ e x p ) of PO003 is shown. The variables are therefore not dependent on each other in a linear way. The dominant frequencies are the rotational frequency and its harmonics when analysing the spectra for constant speeds.
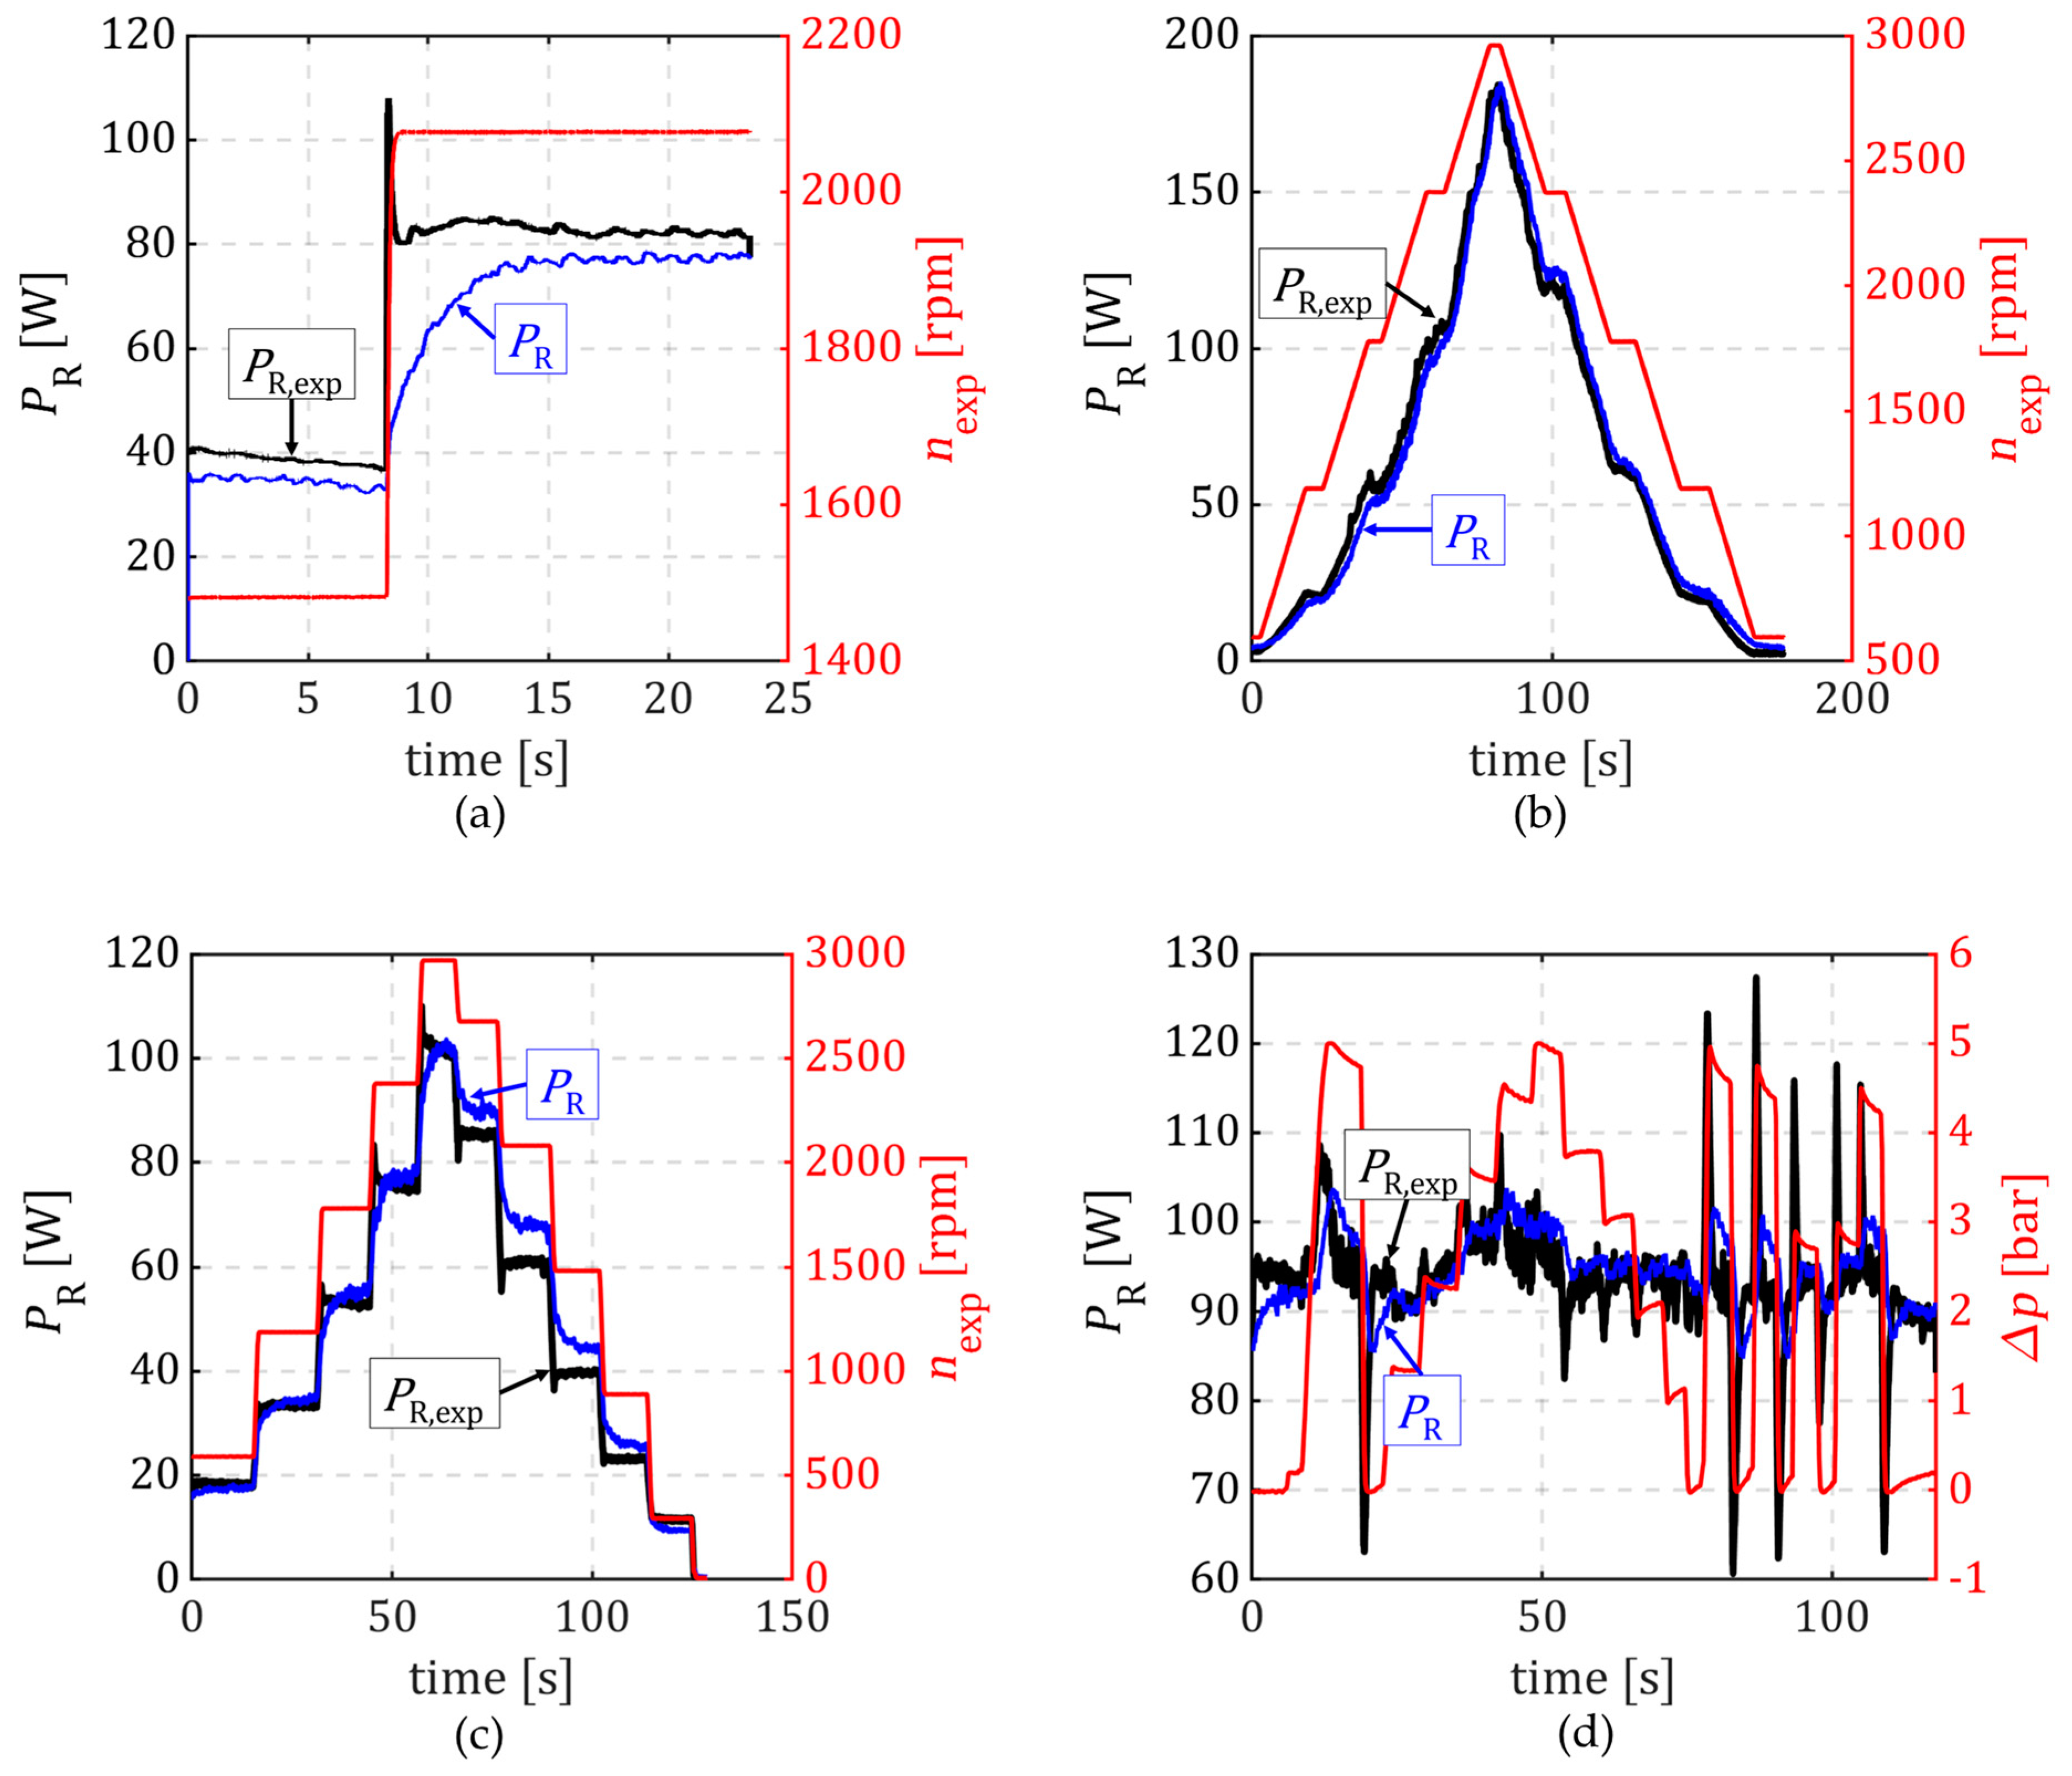
Figure 9a shows the step response of PO003 as a function of time. The red line shows the speed of the primary ring. The measured friction power ( P R , e x p ) is shown as a black line, and the friction power ( P R ) calculated using Algorithm 1 is shown as a blue line. The differential pressure across mechanical seal was p = 0   b a r during measurement. P R , e x p follows with an overshoot and a slight delay in changing speed. Algorithm 1 also reacts to the change in speed. Algorithm 1 will stabilise at its new stationary operating point after seven seconds. This is due to the slow change in ϑ . Algorithm 1 cannot model the frictional power between the two stationary operating points. Compared with that at the stationary operating points, the R M S E increases significantly. The R M S E for the step response was found to be R M S E = 11.28   W .
In Figure 9b, it is shown that n e x p varied in steps in an interval of n e x p { 500   r p m ; 3000   r p m } for PO003. The differential pressure across the seal was also p = 0   b a r . The coloured representation of P R , P R , e x p and n e x p is the same as that in Figure 9a. There was a fifteen-second interval between two speeds. If the speed changes, P R will be different from P R , e x p . If there is a change in speed, there will also be a change in α and the amount of heat dissipation into the medium will change. This behaviour is also shown in Figure 9c. There, n e x p for PO002 varied in a stepwise manner over an interval of n e x p { 0   r p m ; 3000   r p m } . The differential pressure across the seal was p = 0.4   b a r . The colouring of the curves of P R , P R , e x p and n e x p also corresponds to that in Figure 9a. The R M S E for varying the speed in Figure 9b was R M S E = 4.21   W and in that in Figure 9c was R M S E = 5.04   W . As mentioned above, in centrifugal pumps, not only the speed can vary. The differential pressure across the mechanical seal can also vary. For this purpose, p was varied over time in Figure 9d for PO001. The speed of the primary ring during the measurement was n e x p = 1480   r p m . The colour representation is again the same as that in Figure 9a. p is now shown as a red line instead of n e x p . Although abrupt changes in p cause abrupt changes in P R , e x p , Algorithm 1 does not detect them. The R M S E for varying the differential pressure in Figure 9d was R M S E = 6.81   W .

4. Conclusions

In this paper, a soft sensor algorithm based on temperature measurements is presented that can be used to determine the frictional power performance of a mechanical seal. The algorithm is based on a heat flow model. The model assumes stationary temperature fields in the rings of the mechanical seal. Transmission efficiencies are used to describe the temperature fields. This allows the stationary temperature fields in the mechanical seal rings to be described by a few temperature measurements to determine the heat flows. To apply the model, the heat flow model can be reduced to an equivalent dimensionless form coefficient and compared with experimentally determined values. The following conclusions can be drawn from these results:
-
The calculation of the equivalent dimensionless form coefficient is highly dependent on the model used to determine the averaged Nusselt number. A variety of modelling approaches exist. The heat transfer coefficients determined by the models exhibit considerable variability, which results in discrepancies in the calculation of the dimensionless equivalent mould coefficient.
-
By varying the differential pressure across the mechanical seal and the preload on the mechanical seal primary ring, a small deviation between the algorithm and the measurement could be demonstrated.
-
Varying the geometry around the mechanical seal affects the heat transfer between the mechanical seal and the fluid. The arrangement of fins around the mechanical seal improves heat transfer and therefore increases the equivalent dimensionless form coefficient.
-
The soft sensor heat flow model is based on stationary assumptions. The algorithm reacts slowly to changes in the stationary operating conditions. Rapid changes, e.g., sudden increases in pressure, will not be considered by the algorithm. This significantly increases the errors. The algorithm is not suitable for the representation of dynamic changes in the operating conditions.
-
The described algorithm is easy to implement compared with data-based or machine-learning concepts of soft sensors. For this, only the equivalent dimensionless form coefficient characteristics need to be known. It is not necessary to have large amounts of data in order to train a model. There is no need for mechanical machining of the mating ring, as is required when integrating a torque sensor.

5. Patents

German patent application pending (Az. 10 2023 120 204.9).

Author Contributions

Methodology, N.R.; Software N.R.; Validation, N.R.; Formal Analysis, N.R.; Investigation, N.R.; Writing—Original Draft, N.R.; Writing—Review and Editing, G.M. and P.J.K.; Visualisation, N.R., G.M. and P.J.K.; Supervision, G.M. and P.J.K.; Project Administration, G.M. and P.J.K. All authors have read and agreed to the published version of the manuscript.

Funding

This research received no external funding.

Data Availability Statement

The data presented in this study are available on request from the corresponding author. The data are not publicly available due to private ownership.

Conflicts of Interest

Author Nils Reeh was employed by the company Herborner Pumpentechnik GmbH & Co. KG. The remaining authors declare that the research was conducted in the absence of any commercial or financial relationships that could be construed as potential conflicts of interest.

Nomenclature

A _ column matrix of form coefficients
A heat transfer area
A i heat transfer area of the surface i
A a e q equivalent dimensionless form coefficient
a 0 form coefficient of the sliding surface
a i j form coefficient from surface j to surface i
a a e q equivalent form coefficient
b exponent Prandl number ratio Nusselt approach
B S coupling factor temperature sensor
c factor Reynolds number Nusselt approach
c v specific heat capacity of the medium
d f damping factor low pass filter
d i inner diameter mechanical seals
D G L outer diameter primary ring
D G R outer diameter mating ring
E transmission efficiency
E i j transmission efficiency from surface j to surface i
f frequency
f S sampling rate
h exponent Prandl number Nusselt approach
k i j conventional form factor
L G L characteristic length of the primary ring
L G R characteristic length of the mating ring
m exponent Reynolds number Nusselt approach
M _ column matrix of the medium parameter
n speed of the primary ring
n e x p experimental measured speed of the primary ring
N u local Nusselt number
N u ¯ averaged Nusselt number
p differential pressure above the mechanical seal
P R friction power
P R , e x p experimental measured friction power
P S power of the mechanical seal
P V ventilation power of the mechanical seal
P r Prandl number of the medium at characteristic temperature of the medium
P r W Prandl number of the medium at temperature of the solid surface
Q ˙ heat flow
Q ˙ C , i convective heat flow
Q ˙ i j heat flow from surface j to surface i
W G L characteristic width of the primary ring
W G R characteristic width of the mating ring
r radius
R e Reynolds number
R M S E Root Mean Squared Error
s preload of the primary ring
x axial coordinate of the mechanical seals
α heat transfer coefficient
λ thermal conductivity
λ G L thermal conductivity of the primary ring
λ G R thermal conductivity of the mating ring
ϑ temperature
ϑ i temperature of the surface i
ϑ 2 , e x p experimental measured temperature at the surface 2
ϑ a m b temperature of the ambient
ϑ M temperature of the medium
ϑ M , e x p experimental measured temperature of the medium
ϑ S temperature of the temperature sensor at the mechanical seal
ϑ r e f reference temperature
Θ _ column matrix of the temperatures
ρ Density of the medium
ν kinematic viscosity of the medium
η dynamic viscosity of the medium

Appendix A

The system of equations for determining the frictional power is derived from Equation (11):
P R Q ˙ 10 + Q ˙ 12 + Q ˙ 30
The heat flows are defined as follows, based on the definitions in Equations (5) and (6):
Q ˙ 10 α A 1 E 10 ϑ 0 ϑ M
Q ˙ 12 α A 1 E 12 ϑ 2 ϑ M
Q ˙ 30 α A 3 E 30 ϑ 0 ϑ M
P R is obtained by inserting the heat flows into the frictional power definition:
P R = α A 1 E 10 ϑ 0 ϑ M + α A 1 E 12 ϑ 2 ϑ M + α A 3 E 30 ϑ 0 ϑ M
By introduction of the form coefficients in accordance with Equation (6),
a 10   α A 1 E 10
a 12   α A 1 E 12
a 30   α A 3 E 30
the friction power can be written as follows:
P R = a 10 ϑ 0 ϑ M + a 12 ϑ 2 ϑ M + a 30 ϑ 0 ϑ M
When multiplied, the result is as follows:
P R = a 10 + a 30 ϑ 0 + a 12 ϑ 2 a 10 + a 12 + a 30 ϑ M
from which the vectors of Equation (12) can be deduced.

Appendix B

To derive the equivalent form coefficient ( a a e q ), the derived frictional power from Appendix A is used in the following form:
P R = a 10 ϑ 0 ϑ M + a 12 ϑ 2 ϑ M + a 30 ϑ 0 ϑ M
The definition of the sliding surface temperature is inserted into this from Equation (9):
P R = a 10 a 0 + 1 ϑ 2 a 0 ϑ M ϑ M + a 12 ϑ 2 ϑ M + a 30 a 0 + 1 ϑ 2 a 0 ϑ M ϑ M
Now, only the temperatures ϑ 2 and ϑ M are available. Further elimination gives the following:
P R = a 10 a 0 + 1 ϑ 2 ( a 0 + 1 ) ϑ M + a 12 ϑ 2 ϑ M + a 30 a 0 + 1 ϑ 2 ( a 0 + 1 ) ϑ M
P R = a 10 a 0 + 1 ϑ 2 ϑ M + a 12 ϑ 2 ϑ M + a 30 a 0 + 1 ϑ 2 ϑ M
P R = ( a 10 a 0 + 1 + a 12 + a 30 a 0 + 1 ) ϑ 2 ϑ M
P R = a 10 + a 30 a 0 + 1 + a 12 ϑ 2 ϑ M :   a a e q a 10 + a 30 a 0 + 1 + a 12

Appendix C

Measured
Quantity
Maximum
Relative Error
M0.054%
n0.224%
Δp0.524%
s1.024%
ϑamb0.084%
ϑM0.124%
ϑ20.084%
PR0.325%
Δϑ0.149%

References

  1. Luo, Y.; Zhang, W.; Fan, Y.; Han, Y.; Li, W.; Acheaw, E. Analysis of Vibration Characteristics of Centrifugal Pump Mechanical Seal under Wear and Damage Degree. Shock Vib. 2021, 2021, 1–9. [Google Scholar] [CrossRef]
  2. Zou, J.; Luo, Y.; Han, Y.; Fan, Y. Research on Stator Current Characteristics of Centrifugal Pumps under Different Mechanical Seal Failures. Proc. Inst. Mech. Eng. Part C J. Mech. Eng. Sci. 2022, 236, 5748–5762. [Google Scholar] [CrossRef]
  3. Susan-Resiga, R.F.; Bosioc, A.I.; Stuparu, A.C. Enhanced Affinity Law for Centrifugal Pumps at Variable Speed. IOP Conf. Ser. Earth Environ. Sci. 2023, 1136, 012056. [Google Scholar] [CrossRef]
  4. Reeh, N.; Manthei, G.; Klar, P.J. Physical Modelling of the Set of Performance Curves for Radial Centrifugal Pumps to Determine the Flow Rate. Appl. Syst. Innov. 2023, 6, 111. [Google Scholar] [CrossRef]
  5. Wang, X.; Khonsari, M.; Li, S.; Dai, Q.; Wang, X. Experimental Verification of Textured Mechanical Seal Designed Using Multi-Objective Optimization. Ind. Lubr. Tribol. 2019, 71, 766–771. [Google Scholar] [CrossRef]
  6. Bareis, M.; Berger, W.; Lederer, G.; Otschik, J.; Riedl, M. Gleitringdichtung mit Überwachungsfunktion. International Patent WO2008089800A1, 31 July 2008. [Google Scholar]
  7. Berger, W.; Bareis, M. Gleitringdichtung mit Reibungsüberwachungseinrichtung. European Patent EP2440816A1, 18 April 2012. [Google Scholar]
  8. Phillips, R.L.; Jacobs, L.E.; Merati, P. Experimental Determination of the Thermal Characteristics of a Mechanical Seal and Its Operating Environment. Tribol. Trans. 1997, 40, 559–568. [Google Scholar] [CrossRef]
  9. Jiang, Y.; Yin, S.; Dong, J.; Kaynak, O. A Review on Soft Sensors for Monitoring, Control, and Optimization of Industrial Processes. IEEE Sens. J. 2021, 21, 12868–12881. [Google Scholar] [CrossRef]
  10. Dai, Y.; Yang, C.; Liu, K.; Liu, A.; Liu, Y. TimeDDPM: Time Series Augmentation Strategy for Industrial Soft Sensing. IEEE Sens. J. 2024, 24, 2145–2153. [Google Scholar] [CrossRef]
  11. Zhu, W.; Jia, M.; Zhang, Z.; Liu, Y. Dynamic Data Reconciliation for Enhancing the Performance of Kernel Learning Soft Sensor Models Considering Measurement Noise. Chemom. Intell. Lab. Syst. 2024, 246, 105083. [Google Scholar] [CrossRef]
  12. Frafjord, A.J.; Radicke, J.-P.; Keprate, A.; Komulainen, T.M. Data-Driven Approaches for Deriving a Soft Sensor in a District Heating Network. Energy 2024, 292, 130426. [Google Scholar] [CrossRef]
  13. Nunes, P.; Santos, J.; Rocha, E. Challenges in Predictive Maintenance—A Review. CIRP J. Manuf. Sci. Technol. 2023, 40, 53–67. [Google Scholar] [CrossRef]
  14. Shihab, T.A.; Shlapak, L.S.; Namer, N.S.; Prysyazhnyuk, P.M.; Ivanov, O.O.; Burda, M.J. Increasing of Durability of Mechanical Seals of Oil and Gas Centrifugal Pumps Using Tungsten-Free Cermet with Cu-Ni-Mn Binder. J. Phys. Conf. Ser. 2021, 1741, 012031. [Google Scholar] [CrossRef]
  15. Buck, G.S. Heat Transfer in Mechanical Seals. In International Pump Users Symposium; Texas A&M University: College Station, TX, USA, 1989. [Google Scholar] [CrossRef]
  16. Holman, J.P. Heat Transfer, 6th ed.; International Student Edition; McGraw-Hill Book Company: New York, NY, USA, 1986; ISBN 0-07-029620-0. [Google Scholar]
  17. Luan, Z.; Khonsari, M.M. Heat Transfer Analysis in Mechanical Seals Using Fin Theory. Proc. Inst. Mech. Eng. Part J J. Eng. Tribol. 2007, 221, 717–725. [Google Scholar] [CrossRef]
  18. Brunetière, N.; Modolo, B. Heat Transfer in a Mechanical Face Seal. Int. J. Therm. Sci. 2009, 48, 781–794. [Google Scholar] [CrossRef]
  19. Mosavat, M.; Moradi, R.; Rahimi Takami, M.; Barzegar Gerdroodbary, M.; Ganji, D.D. Heat Transfer Study of Mechanical Face Seal and Fin by Analytical Method. Eng. Sci. Technol. Int. J. 2018, 21, 380–388. [Google Scholar] [CrossRef]
  20. Müller, H.K.; Nau, B.S. Fachwissen-Dichtungstechnik; Kapitel 12 Gleitringdichtungen: Grundlagen; Waiblingen. 2021, p. 52. Available online: http://ww3.cad.de/foren/ubb/uploads/Ultimate+AL8.0i/Kapitel12_2007.pdf (accessed on 2 February 2021).
  21. Glück, B. Berechnung der Stationären, Mehrdimensionalen Wärmeleitung Mittels Formkoeffizienten bei Einer Beliebigen Anzahl von Oberflächen und Unterschiedlichen Randbedingungen; Jößnitz. 2012, p. 15. Available online: https://berndglueck.de/dl/?dl=Waermeleitung+Formkoeffizienten.pdf (accessed on 3 December 2023).
  22. Baehr, H.D.; Stephan, K. Wärme- Und Stoffübertragung, 9th ed.; Springer Vieweg: Stuttgart, Germany, 2016; ISBN 978-3-662-49677-0. [Google Scholar]
  23. Schade, H.; Kunz, E.; Kameier, F.; Paschereit, C.O. Strömungslehre, 4th ed.; Walter de Gruyter: Berlin, Germany, 2013; ISBN 978-3-11-029221-3. [Google Scholar]
  24. Mayer, E. Axiale Gleitringdichtungen, 6th ed.; VDI-Verlag: Lenggries, Germany, 1977; ISBN 3-18-400384-1. [Google Scholar]
  25. Bernhard, F. Handbuch Der Technischen Temperaturmessung, 2nd ed.; Springer Vieweg: Ilmenau, Germany, 2014; ISBN 978-3-642-24505-3. [Google Scholar]
  26. Website EagleBurgmann Germany GmbH & Co. KG. Innovativer Gleitwerkstoff eSiC—DE. 2023. Available online: https://www.eagleburgmann.com/de/produkte/emg/innovativer-gleitwerkstoff-esic (accessed on 8 December 2023).
  27. Ayadi, K.; Brunetière, N.; Tournerie, B.; Maoui, A. Experimental Thermal Analysis of a Mechanical Face Seal. J. Therm. Sci. Eng. Appl. 2016, 8, 031011. [Google Scholar] [CrossRef]
  28. Becker, K.M. Measurements of Convective Heat Transfer from a Horizontal Cylinder Rotating in a Tank of Water. Int. J. Heat Mass Transf. 1963, 6, 1053–1062. [Google Scholar] [CrossRef]
  29. Tachibana, F.; Fukui, S. Convective Heat Transfer of the Rotational and Axial Flow between Two Concentric Cylinders. Bull. JSME 1964, 7, 385–391. [Google Scholar] [CrossRef]
  30. Doane, J.C.; Myrum, T.A.; Beard, J.E. An Experimental-Computational Investigation of the Heat Transfer in Mechanical Face Seals. Int. J. Heat Mass Transf. 1991, 34, 1027–1041. [Google Scholar] [CrossRef]
  31. Luan, Z.; Khonsari, M.M. Analysis of Conjugate Heat Transfer and Turbulent Flow in Mechanical Seals. Tribol. Int. 2008, 42, 762–769. [Google Scholar] [CrossRef]
  32. Website Statistics How to RMSE: Root Mean Square Error. 2024. Available online: https://www.statisticshowto.com/probability-and-statistics/regression-analysis/rmse-root-mean-square-error/ (accessed on 4 January 2024).
Figure 1. (a) Design of a mechanical seal with its components in the application in a centrifugal pump; (b) heat flow model of a mechanical seal with a specification of the surface temperatures ( ϑ i ), the heat flows in the rings of the mechanical seal ( Q ˙ i j ), the convective heat flows between the mechanical seal and the medium inside the pump ( Q ˙ C , i ), the frictional power of the mechanical seal ( P R ), and the characteristic width ( W i ) and length ( L i ) of the rings of the mechanical seal.
Asi 07 00039 g001
Figure 2. (a) Structure of the test bench for the validation of the soft sensor algorithm; (b) mating ring of the mechanical seal where coupler paste and superglue are used for attaching the PT1000 temperature sensor.
Asi 07 00039 g002
Figure 3. Surface images of the sliding surface of the PO002 seal made of the material SiC2 (left-hand side) and PO001 made of the material SiC1 (right-hand side).
Asi 07 00039 g003
Figure 4. Numerically calculated transmission efficiencies ( E 10 , E 12 , E 30 as black curves and E 20 as red curve) of the three mechanical seals analysed with different heat transfer coefficients and a constant friction power of P R = 100   W , plotted against the parameter L W α   W λ in accordance with Luan and Khonsari [17].
Asi 07 00039 g004
Figure 5. Calculated equivalent dimensionless form coefficients ( A a e q ) of the three mechanical seals analysed as a function of the approach functions for the calculation of the averaged Nusselt number ( N u ¯ ) for the determination of the heat transfer coefficient ( α ) of different approach functions, denoted by the surname of the first authors Ayadi [27], Becker [28], Tachibana [29], Doane [30], Luan [31], and Brunetière [18].
Asi 07 00039 g005
Figure 6. Comparison of the calculated equivalent dimensionless form coefficients of the approach functions (black curves, labelled ‘Models’ [18,27,28,29,30,31]) with the experimentally determined approach (blue curve, labelled ‘Approach’) plotted against the Reynolds number for the three mechanical seals, PO001, PO002 and PO003.
Asi 07 00039 g006
Figure 7. (a) Plots and equalisation lines of R M S E (black curve) and P R , e x p (blue curve) versus mechanical seal differential pressure ( p ) for PO001; (b) plots and equalisation lines of R M S E (black curve) and P R , e x p (blue curve) versus the preload of the primary ring ( s ) for PO001; (c) fin geometries distributed around the mechanical seal PO001 in order to influence the flow; (d) calculated course of A a e q over R e with the models for determining the averaged Nusselt number of [18,27,28,29,30,31] labelled “Models” (black curves), experimentally determined A a e q value without fin geometry labelled “Approach” (blue curve) and experimentally determined A a e q value with fin geometry labelled “Approach Fin” (red curve).
Asi 07 00039 g007
Figure 8. (a) The amplitude spectrum of the measured friction power (black line) and the amplitude spectrum of the measured velocity (red line) for the step response of PO003; (b) the amplitude spectrum of the measured frictional power (black line) and the amplitude spectrum of the temperature difference between the mating ring and the medium temperature (red line) for the step response of PO003.
Asi 07 00039 g008
Figure 9. (a) Step response of the friction power ( P R ) calculated using Algorithm 1 (blue line), the measured friction power ( P R , e x p ) (black line) and the measured speed of the sliding ring ( n e x p ) (red line) of PO003; (b) friction power ( P R ) calculated using Algorithm 1 (blue line), measured friction power ( P R , e x p ) (black line) and measured slip ring speed ( n e x p ) (red line) of PO003 with variations in n e x p over time; (c) friction power ( P R ) calculated using Algorithm 1 (blue line), measured friction power ( P R , e x p ) (black line) and measured primary ring speed ( n e x p ) (red line) of PO002 with variations in n e x p over time; (d) friction power ( P R ) calculated using Algorithm 1 (blue line), measured friction power ( P R , e x p ) (black line) and measured differential pressure across the seal (∆p) (red line) of PO001 with variations in p over time.
Asi 07 00039 g009
Table 1. Parameters of the three mechanical seals under analysis: PO001, PO002 and PO003.
ParameterPO001PO002PO003
inner diameter ( d i )38 mm38 mm50 mm
outer diameter mating ring ( D G R )54 mm54 mm69 mm
outer diameter primary ring ( D G L )46 mm46 mm58 mm
characteristic length mating ring ( L G R )11.3 mm11.3 mm10.5 mm
characteristic length primary ring ( L G L )5 mm5 mm5.4 mm
characteristic width mating ring ( W G R )5 mm5 mm4.5 mm
characteristic width primary ring ( W G L )3.5 mm3.5 mm3.9 mm
material mating ringSiC1SiC2SiC1
material primary ringSiC1SiC1SiC1
heat conductivity mating ring ( λ G R ) 120 W m K 100 W m K 120 W m K
heat conductivity primary ring ( λ G L ) 120 W m K 120 W m K 120 W m K
Table 2. Coefficients of the approximate functions of the calculated equivalent dimensionless form coefficients as a function of the approach function used to determine the averaged Nusselt numbers from the sources [18,27,28,29,30,31] and the approach function derived from the measurements (Approach).
Approach FunctionPO001PO002PO003
c m c m c m
Ayadi [27]0.1550.4980.1540.4950.1870.445
Becker [28]0.0510.6070.0520.6000.1110.505
Tachibana [29]0.0490.6010.0500.5950.0840.518
Doane [30]0.0090.7290.0090.7220.0210.622
Luan [31]0.0080.7010.0070.7060.0090.652
Brunetière [18]0.0270.5760.0260.5740.0350.519
Approach 1.718 E 3 0.810 2.512 E 3 0.773 5.240 E 7 1.376
Disclaimer/Publisher’s Note: The statements, opinions and data contained in all publications are solely those of the individual author(s) and contributor(s) and not of MDPI and/or the editor(s). MDPI and/or the editor(s) disclaim responsibility for any injury to people or property resulting from any ideas, methods, instructions or products referred to in the content.