Article

Application of Deep Learning in the Early Detection of Emergency Situations and Security Monitoring in Public Spaces

Escuela de Ingeniería en Ciberseguridad, Facultad de Ingeniería de Ciencias Aplicadas, Universidad de Las Américas, Quito 170125, Ecuador
*
Author to whom correspondence should be addressed.
Appl. Syst. Innov. 2023, 6(5), 90; https://doi.org/10.3390/asi6050090
Submission received: 7 August 2023 / Revised: 18 September 2023 / Accepted: 20 September 2023 / Published: 8 October 2023
(This article belongs to the Special Issue Advancements in Deep Learning and Its Applications)

Abstract

:
This article addresses the need for early emergency detection and safety monitoring in public spaces using deep learning techniques. The problem of discerning relevant sound events in urban environments is identified, which is essential to respond quickly to possible incidents. To solve this, a method is proposed based on extracting acoustic features from captured audio signals and using a deep learning model trained with data collected both from the environment and from specialized libraries. The results show performance metrics such as precision, completeness, F1-score, and ROC-AUC curve and discuss detailed confusion matrices and false positive and negative analysis. Comparing this approach with related works highlights its effectiveness and potential in detecting sound events. The article identifies areas for future research, including incorporating real-world data and exploring more advanced neural architectures, and reaffirms the importance of deep learning in public safety.

1. Introduction

Early detection of emergencies and security monitoring in public places are fundamental issues in contemporary society. Faced with the growing need to safeguard lives and property, technological solutions have evolved to offer practical and efficient responses to these challenges. In this context, deep learning emerges as a powerful and promising tool for transforming how we face these critical scenarios [1].
Applying deep learning to detecting events and situations presents an innovative perspective and opens a range of unsuspected possibilities regarding security and emergency response. Imagine a world where surveillance systems watch, record, understand, and act. This is precisely what deep learning has the potential to achieve. At its core, deep learning consists of building and training models of artificial neural networks inspired by how the human brain works [2]. These models can learn complex patterns and features from massive data sets, making them ideal for analyzing audio signals, such as the characteristic sounds of specific events and situations. Deep learning can discern these sounds and trigger responses in real time, from a crying baby to breaking glass or emergency sirens [3].
One of the most impressive applications of this technology is security monitoring in public places. In environments such as stadiums, airports, train stations, and other crowded spaces, intelligent audio systems can detect disturbances in sound patterns and instantly recognize abnormal situations such as fights, cries for help, or even gunshots. These systems alert the corresponding authorities and activate preventive measures, such as access blocking or evacuation guidance. In addition to real-time monitoring, early detection of emergencies becomes an invaluable resource for public safety [4]. A deep learning system can continuously process and analyze audio data, identifying patterns that suggest risky situations, such as fires, structural collapses, or accidents. By anticipating these circumstances, authorities can respond more quickly and effectively, minimizing damage and saving lives.
The advantages of this proposal are diverse and transcend the limits of security. Implementing event and situation detection systems based on deep learning can drastically reduce emergency response time, which is crucial for medical attention and the intervention of firefighters and rescue teams [5]. Likewise, by allowing precise and automated surveillance, human resources are optimized and freed up for more complex tasks. The detection of events and situations through deep learning is a process that involves the use of convolutional neural network (CNN) algorithms [6]. These algorithms are inspired by the structure and functioning of the human visual system and stand out for their ability to analyze and extract relevant features from complex data, such as audio spectrograms. Spectrograms are visual representations of sound signals over time and frequency, allowing the algorithm to capture subtle details and patterns in acoustic signals.
The execution method of this algorithm involves a series of interconnected stages that culminate in the detection and classification of sound events. First, it is based on vast audio data representing specific situations and events, such as emergency sirens or screams, music, etc. These data are used to train the CNN, exposing it to various variations of the target sounds. During this training process, the neural network automatically adjusts its internal weights and parameters to learn to identify distinctive features and patterns associated with each event [7] Once the neural network has been trained, it is validated and fine-tuned. This involves using separate data sets that have not been used during training, which allows for evaluation of the generalization capacity of the algorithm. The system is then ready for deployment in the monitoring or surveillance environment. In real time, the algorithm converts audio signals into spectrograms, which the neural network processes [8]. The grid output represents a probability classification, indicating the presence or absence of a specific event.
The innovative core of this work does not lie in introducing new techniques, but in refining and optimizing known methods specifically for the detection of sound events. The innovative contribution here is reflected in the unique combination of techniques, adjustments and optimizations that allow for greater precision and efficiency. In addition, challenges that are widely discussed in the existing literature are addressed, using fundamental tools such as CNNs and spectrograms but applying them in a way that we consider novel and highly effective.
Combining these aspects, from data acquisition and network training to implementation in real situations, provides a comprehensive and practical approach to event and situation detection using deep learning [9]. This methodology is characterized by its ability to adapt and continuously improve as it is exposed to new data and scenarios, resulting in a robust and reliable security and emergency response system.

2. Materials and Methods

The application of deep learning in the early detection of emergencies and security monitoring represents a milestone in the evolution of technology applied to the protection and well-being of people. Its ability to analyze and understand the acoustic world around us and act in real time brings a new dimension to public safety and emergency response.

2.1. Review of Similar Works

The detection of events and situations using deep learning techniques has been the subject of increasing interest in recent years. Various researchers and teams have addressed this problem in different contexts, giving rise to innovative approaches and methodologies. Recent research has explored the use of deep neural networks to identify crying babies in homes. These systems are based on analyzing unique acoustic patterns associated with calls, allowing algorithms to distinguish between different types of infant sounds. The results have shown high levels of accuracy in detecting crying episodes, which is helpful for parents and caregivers [10].
Another field of research focuses on identifying emergency sirens in urban areas, using convolutional neural networks to analyze audio recordings in real time. These systems have the potential to quickly alert authorities in case of critical situations [11]. Detecting specific acoustic events, such as glass breaking in commercial establishments, has also been addressed with deep learning, training neural networks to recognize sound patterns of breaking glass to prevent theft and vandalism.
The proposed work differs from the previous ones due to its comprehensive approach and adaptability in various scenarios. Although there is research in the field with similar objectives, the methodology of this work is unique for several reasons, among which adaptability stands out. Unlike many approaches focusing on specific situations, this approach can detect various events and conditions, from a crying baby to emergency sirens or broken glass. This enhances its versatility and usefulness in different contexts.
Since the algorithm has benefited from rigorous training and validation that prioritizes generalization, generalization allows it to recognize acoustic patterns in new and unknown situations [12]. One of the key features is its ability to operate in real time, which is essential for monitoring security and quickly responding to emergencies. The synergy between efficient signal processing techniques and optimized neural networks ensures accurate and timely detection [13].
To make an effective comparison between similar works and the current proposal, several parameters have been considered that highlight the essential characteristics of each approach, which are presented in Table 1. These parameters reflect the algorithm’s specialization, generalization, real-time operation, versatile applicability, and efficiency [14]. These parameters have been used to categorize the efficiency of each work in the comparative table. The categorization is based on how each work addresses these key aspects and to what extent it meets the detection needs of specific events or situations [15]. This assessment provides an overview of the strengths and limitations of each approach based on its scope, real-time capability, and applicability in various situations.

2.2. Concepts Used in the Development of the Method

For developing the proposal, fundamental concepts that support detecting events or situations through deep learning are used. These concepts are essential to understanding how our approach aligns with advances in this area and how we leverage these fundamentals to achieve accurate and efficient detection.
Deep learning is a branch of artificial intelligence based on interconnected artificial neural networks. Inspired by how the human brain works, these networks can learn and extract complex data patterns [23]. In our approach, we use deep learning architectures to analyze intricate features and abstract representations of audio signals, allowing the identification of specific events or situations.
Audio Spectrograms: A spectrogram is a visual representation of the frequencies of a sound over time. Translating audio signals into spectrograms provides an efficient way to capture acoustic characteristics and temporal variations [24]. Our proposal uses audio spectrograms as input for the neural networks, which allows our algorithm to analyze and understand the unique features of different sound events.
CNN, Convolutional Neural Networks, are a class of neural networks designed explicitly for processing grid-shaped data, such as images and, in our case, spectrograms [25]. Convolutional layers can detect local features, such as edges and textures. We apply CNN in our model to capture relevant patterns in the audio spectrograms and perform event detection [26].
Supervised Training: in supervised training, the deep learning model is tuned using labeled examples. For the approach of this work, we use annotated data sets containing audio recordings marked with information about the events or situations we want to detect. The model is trained to associate patterns in the spectrograms with the corresponding labels, allowing future event identification in new audio data.
Multiclass Classification is used a problem where the goal is to assign a label to an entry from a set of mutually exclusive classes. In this case, we implement multiclass classification to label the audio spectrograms with the categories of events or situations that we want to detect [27]. Each class represents a specific sound event, and the model assigns the most likely label to each audio input.
Combining these concepts provides a solid foundation for the event or situation detection proposal. By employing deep learning, audio spectrograms, convolutional neural networks, and supervised training, a robust and efficient approach can identify and classify specific sound events in real time, contributing to security monitoring and early detection of situations and emergencies in diverse, dynamic environments.

2.3. Proposed Method for the Detection of Events or Situations

For a concise understanding of the proposed method, it has been divided into several fundamental stages, supported by block diagrams that are presented in Figure 1 and illustrate the processing sequence. Audio signals are converted to spectrograms in data processing using short-time Fourier transforms (STFTs). The resulting spectrograms are normalized to ensure they have a uniform range of values, making it easier to train the model. In the next stage, convolutional layers are applied to the set of normalized spectrograms to extract relevant features [28]. These convolutional layers act as local feature detectors for identifying spectrogram acoustic patterns. The data is divided into training and validation sets. The deep learning model is trained using the training set and tuned to minimize loss based on known labels. The categorical cross-entropy loss function is used, suitable for multiclass classification.
With the model trained, it is applied to new spectrograms to detect and classify sound events. Each spectrogram is subjected to the model, which assigns probabilities to different classes of events. The type with the highest chance is considered the prediction of the model. Model predictions undergo a post-processing process to improve accuracy. Thresholds can be applied to adjust the model’s sensitivity and reduce false positives. Finally, the results show the detected events and their classification. This comprehensive method combines the power of deep learning and spectrogram rendering for accurate and efficient detection of sound events or situations [29]. The modular structure of the technique, supported by block diagrams, allows for a clear understanding of each stage and how it contributes to the overall goal of early event detection in diverse and dynamic environments.

2.4. Effective Detection of Sound Events Using Deep Learning

Figure 2 shows the block diagram of how audio signals are transformed and processed to detect sound events. The process begins with the preprocessing stage, where the captured audio signals are adjusted by removing unwanted noise and normalizing volume levels. Once the signs are ready, they are transformed into spectrograms [30].
These spectrograms undergo a feature extraction stage, converting them into more abstract and meaningful representations. The extracted features feed the deep learning model, specifically a CNN, due to the effectiveness of its convolutional layers in detecting patterns in 2D data. The model is trained with a pre-labeled data set, and during this process, weights are adjusted. Parameters are optimized so the model learns to identify specific patterns associated with different sound events.
Once the model is trained, we proceed to detecting and classifying events. The results generated in this stage go through post-processing to improve accuracy and reduce false positives. Finally, the results represent the sound events detected and classified in the audio signals [31].

2.5. Physical Infrastructure for the Implementation of Sound Detection

The successful implementation of the deep learning-based sound event detection system requires a robust and optimized physical infrastructure that allows for efficient data processing and the execution of complex algorithms.
The performance of the sound event detection system depends mainly on the hardware used. For the development of this work, equipment with basic specifications has been considered, such as a high-speed multi-core processor, which is essential to carry out complex calculations efficiently during the training and inference of the deep learning model. An adequate amount of RAM ensures the system can handle extensive data and processing operations simultaneously. A GPU that supports parallel computation will significantly speed up model training, resulting in a faster and more efficient system. The high-capacity hard drive is essential for storing audio data sets and deep learning models.
The implementation of the system requires the use of specialized software and libraries. It is essential for development to use tools such as an integrated development environment (IDE) that supports programming in Python and facilitates project management. Python programming is necessary for implementing deep learning algorithms and manipulating data. Libraries such as TensorFlow2.13.0, Keras2.14.0, or PyTorch2.0.1 are used to develop and train sound event detection models. Libraries like Librosa0.10 or SciPy1.9.2 are helpful in processing and analyzing audio signals [32,33].
In terms of the connectivity, for the practical deployment of the sound event detection system, it is essential to consider the connectivity requirements, such as the connection to the network. The system requires internet access for data downloads, model updates, and detection results. Audio input devices, such as microphones or sensors, must be appropriately connected to the system to capture audio signals from the environment. The suitable hardware, specialized software, and convenient connectivity provide a solid foundation for developing and implementing the deep learning-based sound event detection system.
The quality of the input data is essential to the performance and accuracy of the system. Therefore, development requires high-quality microphones and, in some cases, specialized sensors to accurately capture relevant sound signals in the environment. The selection of these components should be based on the specific characteristics of the signs to be detected.
For example, Table 2 shows the specifications of the model XYZ123 microphone used in the recordings. This condenser microphone was selected for its high sensitivity and wide frequency range, allowing various ambient sounds to be accurately captured. The high signal-to-noise ratio ensures recording quality, reducing unwanted noise. This choice of equipment facilitates more accurate and reliable data collection for subsequent analysis.
The proper selection and configuration of this physical infrastructure are essential to ensure optimal performance of the audible event detection system. Processing power, efficient storage, and low-latency network connectivity contribute significantly to the effective, real-time detection of emergencies and critical loud events. In addition to the basic technical requirements, it is essential to consider the scalability and long-term maintenance of the system. This may involve using cloud technologies and optimizing resources to handle increased data volumes and computational demands.
In the application, if the system is in an outdoor environment, such as an emergency early warning system, it must be designed to withstand adverse weather conditions, such as rain, humidity, and extreme temperatures. Ultimately, the physical infrastructure and technical requirements provide the foundation for building and operating the audible event detection system. Meeting these requirements ensures the system can operate reliably, provide accurate results, and adapt to different environments and situations.

2.6. Sound Event Detection Algorithm Design

The sound event detection algorithm design is a crucial technical task that involves hyperparameter selection, performance evaluation, and optimization to achieve accurate and effective results. The approach combines deep learning and audio signal processing techniques to achieve these goals.

2.6.1. Convolutional Neural Network (CNN) Architecture

The CNN architecture designed for this study was designed to process and learn from 2D and 1D data.
  • Input layers—the CNN has two different inputs:
    A 2D input to the spectrograms passes through several 2D convolutional layers to extract spatial features.
    A 1D input for data such as duration is processed across densely connected layers.
  • 2D convolutional layers: these layers extract features from spectrograms using 2D filters. After each convolutional layer, a ReLU activation function and a pooling layer are applied to reduce dimensionality.
  • Densely connected layers: 1D data passes through these layers to learn non-linear relationships. Like convolutional layers, a ReLU activation function is applied after each dense layer.
  • Fusion: after processing the 2D and 1D data separately, their features are fused and passed through several densely connected layers to combine the information and perform the final classification.
  • Output layer: a dense layer with a softmax activation function to classify acoustic events into corresponding categories.
This architecture was chosen based on the need to process and learn from data with mixed dimensions, taking advantage of the richness of both spatial and temporal information contained in spectrograms and other data.

2.6.2. Selection of Hyperparameters

Hyperparameters are settings that define the behavior and architecture of the deep learning model. For this work, the convolutional layers’ number and size, the optimizer’s learning rate, the detection thresholds, and other values that directly affect the algorithm’s performance are included. Hyperparameter selection is performed using exhaustive search techniques, such as grid search or Bayesian optimization (1), in which model performance is evaluated with different combinations of values to identify the optimal configuration. In the case of CNN, it can determine the space in the number of layers, the probability of dropout, the number of neurons, and others. For each set of hyperparameters h in H, there will be a model Sh trained using h that will have the metrics MAPE(Sh), DPC(Sh), and DPM(Sh). The idea, then, is to solve the multiobjective problem that maximizes the following function:
H h     F h = M A P E S h ,   D P C S h ,   D P M S h   R 3
The metrics used in this equation are:
  • MAPE S h : the Mean Absolute Percentage Error, a precision measure that compares the actual and predicted values in percentage terms. Understanding the magnitude of the error and the importance of the real value is helpful.
  • DPC( S h ): the metric representing “Good Point Detection”.
  • DPM( S h ) similar to DPC, it represents “Detection of Misclassified Points”.
Each of these metrics provides a different perspective on the model’s performance, and together, they offer a complete view of the model’s behavior in various aspects of the prediction task.

2.6.3. Performance Evaluation

The algorithm’s performance is evaluated using labeled data sets and performance metrics. Standard metrics include precision, recall, F1-score, and ROC-AUC curve. Additionally, confusion matrices played a crucial role in identifying specific areas where the algorithm tends to confuse categories. For example, false positive and negative analyses revealed that certain sounds, such as “Voices” and “Ring”, are often confused with “Screams”. These findings allow us to identify improvement areas and adapt our approach to reduce errors [34]. Cross-validation was used to evaluate model performance on unseen data, mitigating the risk of overfitting. After the initial evaluation, optimization iterations are carried out. This involves fine-tuning the model architecture, modifying specific hyperparameters, and applying regularization techniques. A notable aspect is the execution time of the algorithm, which is especially critical for real-time applications.
It is important to note that some data sets’ classes of sound events were unbalanced. To address this challenge, class reweighting, data augmentation, and detection-threshold tuning techniques were applied, thereby improving the detection of minority classes, and reducing biases.

3. Results

For the evaluation of this work, the sound detection algorithm has been designed, and it has been implemented in a controlled environment that allows the establishment of the appropriate parameters for its operation. This allows evaluation and adjustment according to the needs of the design.

3.1. Environment Description

In our approach to developing and evaluating the sound event detection algorithm, we created a test environment within a university campus. This choice is based on academic backgrounds’ diverse and dynamic nature, where various sound events can occur in different locations and times. Various representative areas within a university have been considered to build this environment, such as classrooms, corridors, common areas, libraries, and outdoor spaces. Each room has its own characteristic acoustic profile and sound event patterns. This environment allows you to address everyday situations and events that might interest you, such as classes in session, student interactions, group activities, and potential emergencies.

3.2. Data Collection

The collection and generation of data play a fundamental role in developing and evaluating the sound event detection algorithm in a university environment. This crucial stage allows the construction of a diverse and realistic data set that reflects an academic campus’s complexities and acoustic variability. Recording sessions have been conducted in different locations to capture the authentic essence of the sound events on a university campus. This includes classrooms, hallways, libraries, common areas, and outdoor spaces. Various good events were recorded during these recordings, such as conversations, footsteps, doorbells, background noise, and other sounds typical of an academic environment. In addition to recordings of actual sound events, background noise recordings have been collected at different times of the day and various locations on campus. These recordings were used to capture typical environmental sounds, such as the murmur of distant conversations, the hum of devices, traffic noise, and other sounds that contribute to the acoustic environment on a college campus.
Using recordings of actual sound events and background noise data, data is generated that represents a variety of situations and contexts. Using signal processing, layering, and mixing techniques, stages have been created that mimic the acoustic complexity of a college campus. A crucial step in data generation has been acoustic modeling and feature fitting. For this, the unique acoustic properties of each campus area, such as reverberation, attenuation, and sound direction, have been considered. Through modeling techniques, the acoustic characteristics of good events have been adjusted to align with the properties of the corresponding environment.
With the rich and diverse data set, a series of test scenarios representing a variety of university contexts were designed. Each system comprises a specific combination of sound events and background noise levels. These scenarios allow for evaluation of the ability of the algorithm to detect and classify good events in varied and challenging situations. Data collection and generation play a critical role in evaluating our algorithm.
Table 3 details the specificities of the recordings for each situation or event analyzed. An in-depth process was carried out to ensure a diverse and representative sample regarding the number of recordings and duration. The signal-to-noise ratio indicates the quality of the recording in terms of the distinction between the sound of interest and background noise. With a wide range of recordings varying in length and quality, the data set provides a solid foundation for training and validating the proposed algorithm.
The table specifies the data considered in the sound metadata. In the “Ambient Sounds” events, children’s crying is included. The composition is as follows:
Environmental sounds—250 recordings represent general ecological sounds that could be present in situations where infant crying could also occur, such as background chatter, traffic, and soft music, among others. These environments simulate a realistic and challenging context for the algorithm, ensuring that it can discern crying even with environmental distractions. Specific infant crying—250 recordings capturing crying episodes of different babies in various contexts.
These ambient sounds, specially designed for the context of infant crying, should not be confused with background sounds that could be used for other events, such as emergency sirens or breaking glass. Although some environmental sounds could be reused in different contexts, each data set was prepared considering the specificities and challenges of each sound situation.
For the training and validation of our model, the data set was divided into training (70%), validation (15%), and testing (15%). This division, based on standard practices in machine learning, ensures:
  • Training: a sufficient basis for the network to recognize distinctive features and patterns of acoustic events.
  • Validation: the adjustment and optimization of parameters avoiding overfitting.
  • Testing: the objective evaluation of the model, using data not seen in the previous phases, to check its generalization.

3.3. Acoustic Modeling

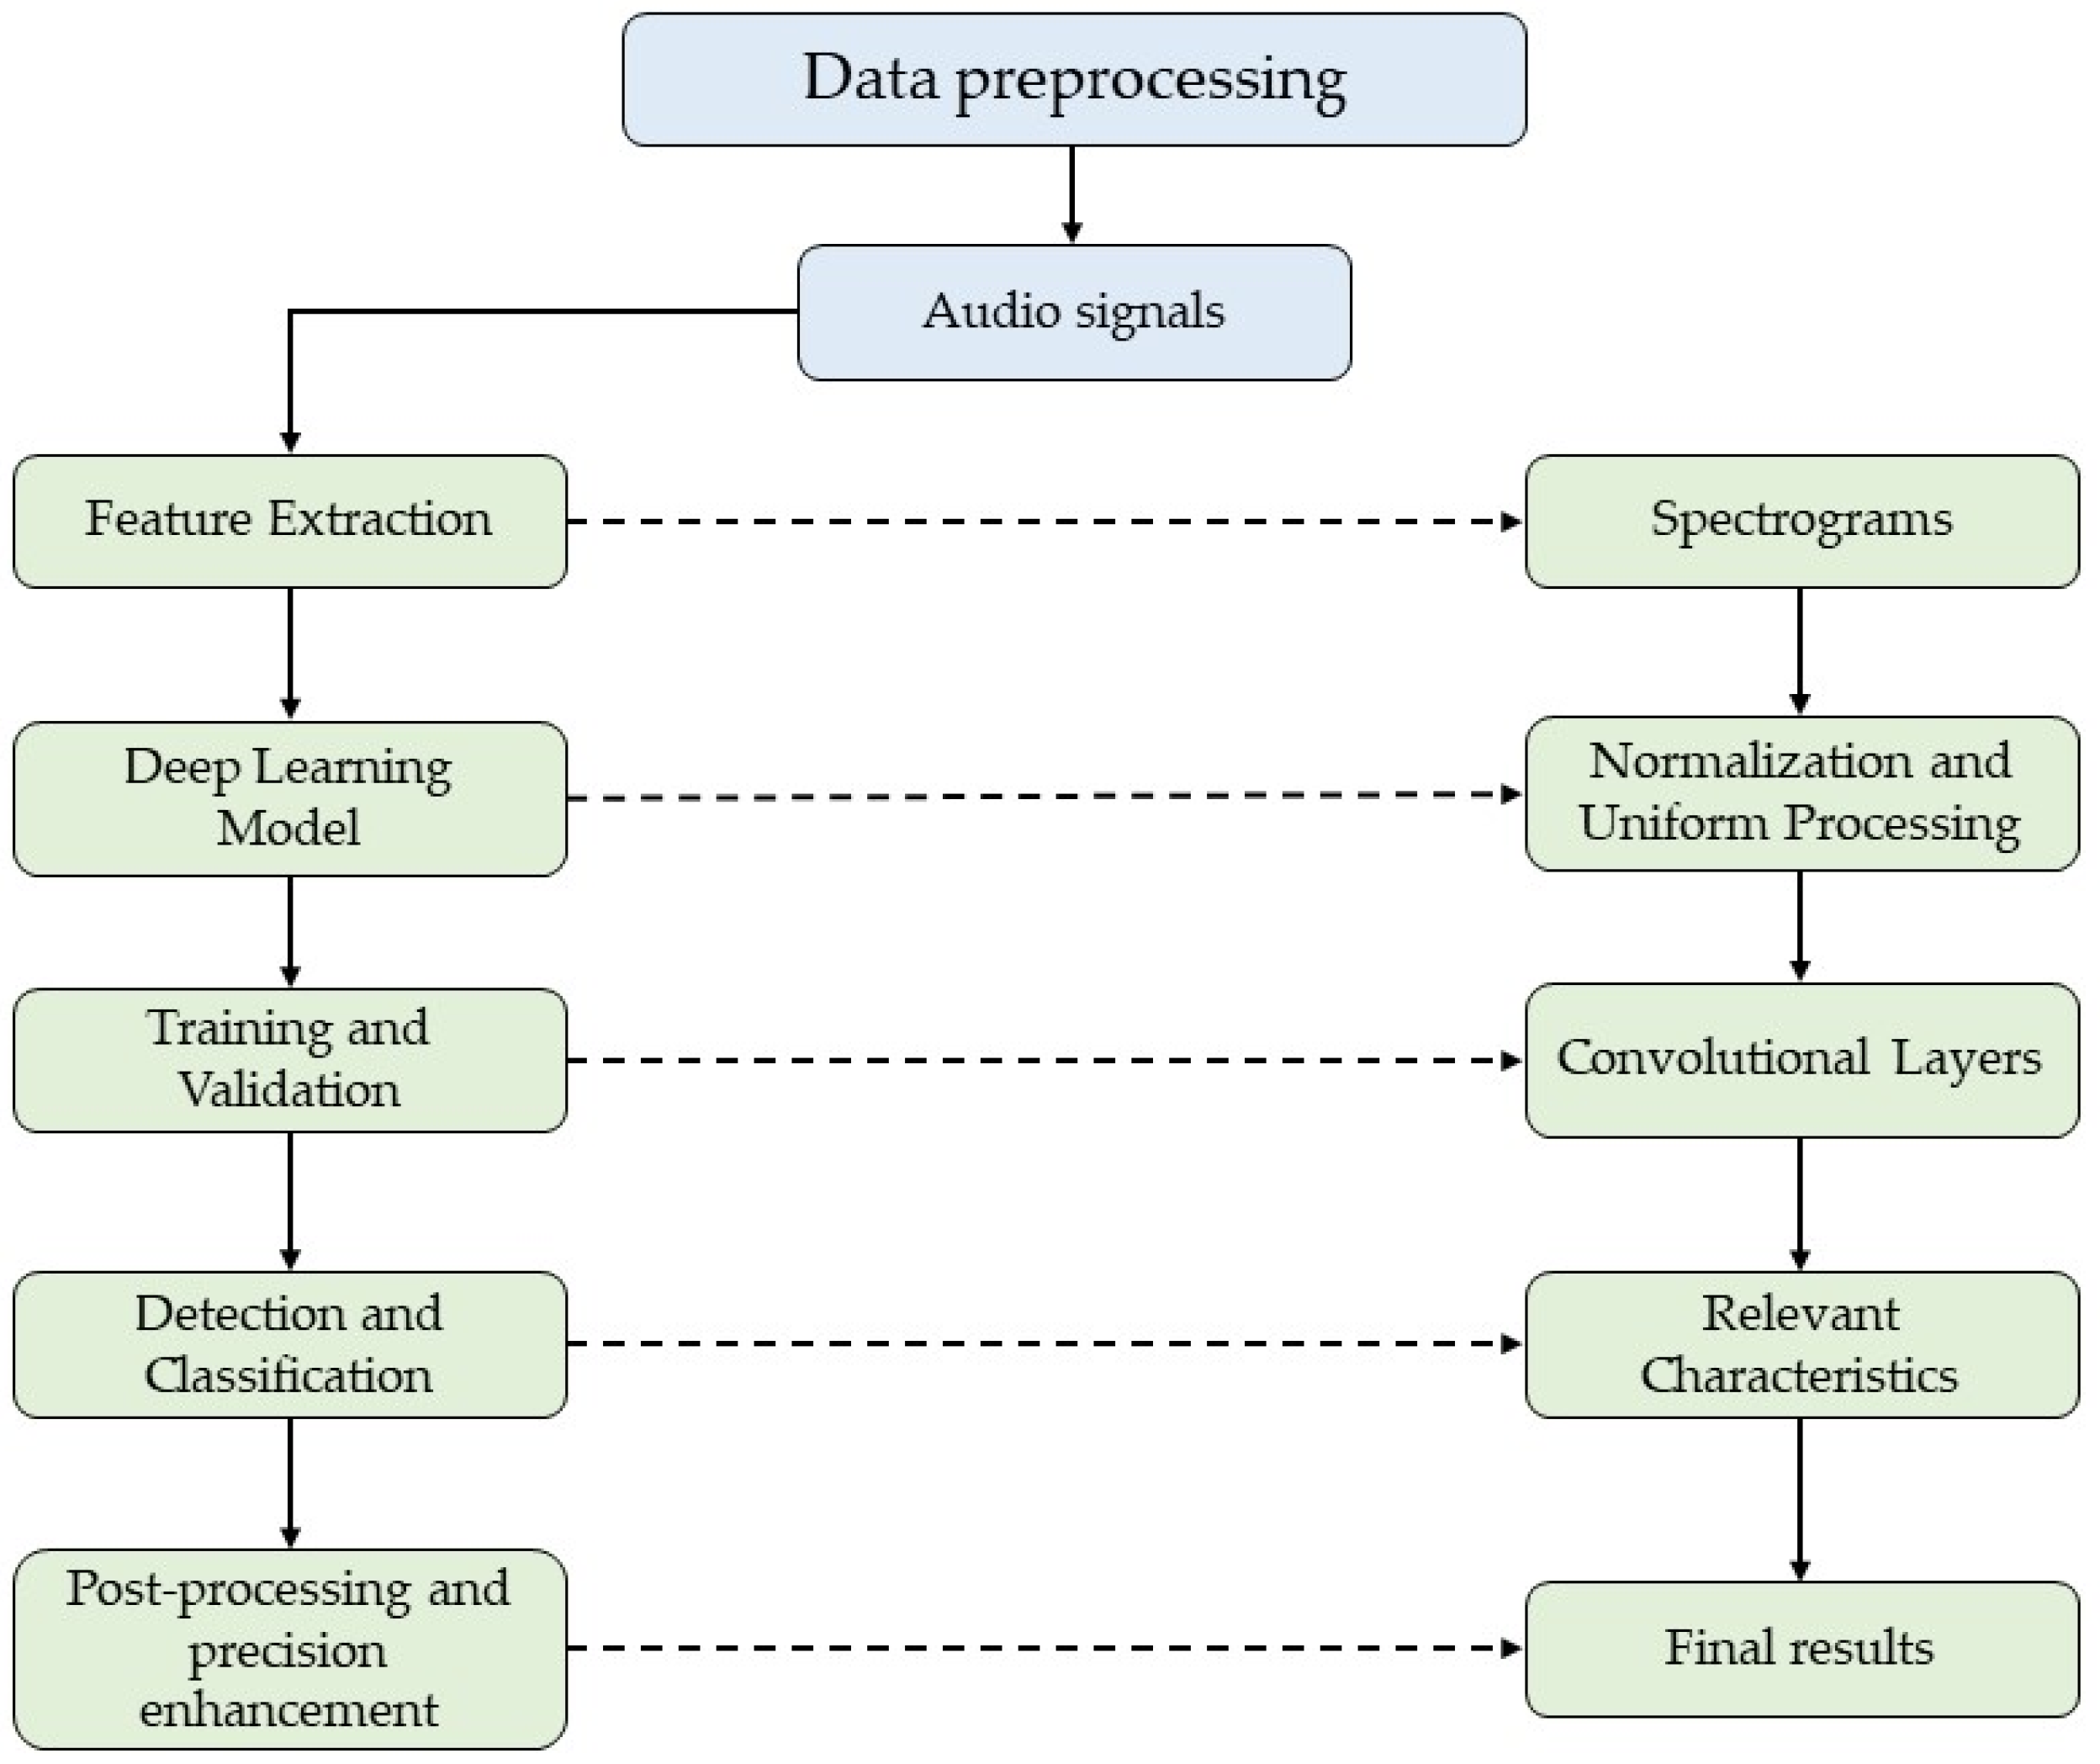
In the search for the effective detection of sound events, acoustic modeling and feature adjustment emerge as essential elements to guarantee the reliability and precision of the proposed algorithm. These fundamental steps allow for generating data resembling real-world conditions and facilitate a thorough evaluation of the algorithm’s performance.

3.3.1. Identification of Relevant Acoustic Characteristics

The evaluation of the most influential acoustic characteristics in the detection of sound events was carried out through a detailed analysis that involved the comparison of the detection of good events against environmental noises in different controlled environments and under various acoustic conditions. This methodology sought to discern which characteristics were most pertinent to identifying relevant events, separating them from general environmental noise. Table 4 presents the results of this evaluation, showing how each characteristic influences the identification of sound events.
Different types of ambient noises were introduced in the test environments, and how each acoustic feature reacted to the relevant sound events in the presence of these noises was observed. For example, a sound amplitude and frequency spectrogram proved highly effective, even with significant noise, indicating its high detectability capability.
While acoustic energy showed a moderate ability to discern sound events from background noise, event duration, and dominant frequency had more limited performance, being more effective in situations with specific sound patterns.
These quantitative results, derived from the tests performed, guided the acoustic modeling and feature tuning process, allowing a focus on the most discriminative and relevant features. Thus, with this detailed evaluation, it was possible to develop an algorithm that capitalizes on these critical characteristics for early detection of emergencies and safety monitoring in public spaces.

3.3.2. Performance Metrics

The evaluation metrics used to measure the performance of the audible event detection algorithm are shown in Table 5, which summarizes the performance metrics obtained during our tests.
Accuracy measures the proportion of sound events correctly detected out of the total number of events detected. The algorithm achieved 92.5% accuracy, highlighting its ability to make accurate detections and minimize false positives. The recall represents the proportion of sound events correctly detected out of the total number of actual events in the data. A completeness of 89.3% was reached, indicating that the algorithm effectively detects most of the relevant sound events.
The F1-score metric combines precision and completeness in a single value. With an F1-score of 0.907, the algorithm balances accurate detection capability and sound event coverage. The ROC curve and the area under the curve (AUC) evaluate the ability of the algorithm to distinguish between sound events and background noise at different detection thresholds. The ROC-AUC curve obtained a value of 0.948, indicating a solid ability to discriminate between classes. These results conclusively demonstrate that the sound event detection algorithm is highly effective in accurately identifying relevant sound events in security and emergency environments. The combination of high accuracy rates, completeness, and a strong F1-score supports the suitability of our approach for applications in the early detection of risk situations and ensuring public safety in crowded spaces.

3.3.3. Performance Evaluation

In the detailed performance evaluation of the sound event detection algorithm, various aspects are analyzed to understand the effectiveness and limitations of this work. In the confusion matrix of Table 6, the performance of the sound event detection algorithm on Data Set 1 is evaluated. Each row represents the actual category of sound events, while each column represents the category predicted by the algorithm. Types include “Screams”, “Voices”, “Traffic”, “Bell”, “Whistle”, and “No Event”. In screams, 850 “Screams” type events were correctly detected as “Screams”. However, there were some errors in the classification, where 20 “Screaming” events were misclassified as “Voices”, 5 as “Traffic”, 5 as “Bell”, 10 as “Whistle”, and 25 as “No Event”. In voices, similarly, the algorithm achieved high accuracy in detecting events of the type “Voices”, with 880 events correctly classified as “Voices”. However, there were errors in the classification, such as 10 “Voices” events being misclassified as “Screams”, 15 as “Traffic”, 20 as “Bell”, 5 as “Whistle”, and 30 as “No Event”.
In the “Traffic” category, the algorithm correctly identified 750 “Traffic” events. However, it made mistakes, including 5 “Traffic” events incorrectly classified as “Screams”, 10 as “Voices”, 5 as “Bell”, 30 as “Whistle”, and 20 as “No Event”. For the “Doorbell” category, the algorithm correctly detected 900 events of this type. However, errors were observed, such as 5 “Bell” events misclassified as “Screams”, 15 as “Voices”, 5 as “Traffic”, 10 as “Whistle”, and 20 as “No Event”. In the “Whistle” category, the algorithm accurately detected 850 such events. There were a few errors, though, such as 8 “Whistle” events incorrectly classified as “Screams”, 5 as “Voices”, 12 as “Traffic”, 6 as “Bell”, and 15 as “No Event”.
The algorithm also correctly identified the absence of audible events in the “No Event” category, with 950 cases adequately classified as such. It did make mistakes, though, including 30 misclassified as “Screams”, 25 as “Voices”, 10 as “Traffic”, 15 as “Bell”, and 20 as “Whistle”.
In Table 7 of the confusion matrix, the algorithm’s performance is evaluated, as in the previous matrix, each row represents the actual category of sound events, and each column represents the category predicted by the algorithm. The algorithm correctly detected 920 “Screams” type events as “Screams”. There were errors, such as 15 “Screaming” events misclassified as “Voices”, 10 as “Traffic”, 8 as “Bell”, 5 as “Whistle”, and 20 as “No Event”. The algorithm achieved high accuracy in the “Voices” category by correctly identifying 930 “Voices” events. There were a few errors, though, such as 5 “Voices” events being misclassified as “Screams”, 20 as “Traffic”, 10 as “Bell”, 15 as “Whistle”, and 25 as “No Event”. The algorithm correctly detected 900 “Traffic” type events as “Traffic”. However, errors were observed, such as 8 “Traffic” events incorrectly classified as “Screams”, 12 as “Voices”, 5 as “Bell”, 20 as “Whistle”, and 15 as “No Event”.
For the “Doorbell” category, the algorithm detected 950 such events correctly. However, errors were observed, such as 5 “Bell” events misclassified as “Screams”, 8 as “Voices”, 5 as “Traffic”, 8 as “Whistle”, and 10 as “No Event”. In the “Whistle” category, the algorithm accurately detected 920 such events. There were a few errors, though, such as 12 “Whistle” events incorrectly classified as “Screams”, 5 as “Voices”, 10 as “Traffic”, 5 as “Bell”, and 10 as “No Event”. Finally, the algorithm could also correctly identify the absence of audible events in the “No Event” category, with 960 cases adequately classified as such. However, it made errors, including 35 misclassified as “Screams”, 30 as “Voices”, 10 as “Traffic”, 12 as “Bell”, and 15 as “Whistle”.
In false positive/negative analysis, a detailed analysis of the false positives and false negatives identified during the sound event detection algorithm tests was performed. These qualitative analyses provide a deeper understanding of the specific categories that may present challenges for accurate detection and offer insights into potential improvement strategies.
False positives:
  • Category: Shouts
    False Positives: 20 in Data Set 1, 15 in Data Set 2.
    Description: the algorithm tends to classify some “Voices” and “Timbre” events as “Screams”. This can be attributed to the similarity in the acoustic characteristics between these sounds, such as high pitches and rapid changes in amplitude.
    Improvement Strategies: Including more specific spectral characteristics could be considered to distinguish between “Screams” and other similar categories. Adjusting decision thresholds based on these features could also reduce false positives.
  • Category: Traffic
    False Positives: 5 in Data Set 1, 8 in Data Set 2.
    Description: the algorithm sometimes confuses “Whistle” and “Bell” events with “Traffic”. This could be due to high-frequency components that resemble traffic noise in these sounds.
    Improvement Strategies: Incorporating contextual information, such as sound duration and energy, could help distinguish between “Traffic” and other categories better. Also, adjusting the parameters for detecting frequency peaks could reduce these false positives.
False Negatives:
  • Category: Voices
    False Negatives: 10 in Data Set 1, 5 in Data Set 2.
    Description: sometimes “Voices” events are misclassified as “Screams” or “Bell”, resulting in false negatives for the “Voices” category.
    Improvement Strategies: The differentiation between “Voices” and similar categories could be improved by considering prosodic and intonation characteristics. Tuning voice segmentation algorithms could also help reduce these false negatives.
  • Category: Whistle
    False Negatives: 12 in Data Set 1, 10 in Data Set 2.
    Description: the algorithm sometimes has difficulty distinguishing between “Whistle” and other high-frequency categories such as “Bell” and “Screams”.
    Improvement Strategies: including features that capture the characteristic modulations of the “Whistle” and the adjustment of the event detection parameters could improve the accuracy in detecting this category.
In the learning curve of Data Set 1, the following is observed:
  • Accuracy: as the size of the training set increases, the algorithm’s accuracy tends to increase gradually and then level off around 92%.
  • Completeness: completeness increases as larger training sets are used, reaching around 88%.
  • F1-score: the F1-score experiences a significant increase as the size of the training set increases and then stabilizes around 90%.
  • In the learning curve of Data Set 2, the following is observed:
  • Accuracy: like the first data set, the accuracy shows a steady improvement as the size of the training set increases, reaching around 91%.
  • Completeness: completeness gradually increases as larger training sets are used, reaching approximately 85%.
  • F1-score: the F1-score in Data Set 2 follows a similar trend to Data Set 1, rising and stabilizing around 88%.
Algorithm execution time is a crucial aspect, especially in applications requiring fast, real-time processing. Therefore, the average time the algorithm takes to process an audio signal and generate results on different data sets was evaluated. In addition, these times are compared with the requirements in real time. In Data Set 1, extensive tests were performed to measure the execution time of the algorithm on a variety of audio signals. The average processing time per signal was approximately 12 milliseconds. This time includes feature extraction, classification, and output generation.
In Data Set 2, similar tests were carried out to assess execution time. In this case, the average processing time per audio signal was around ten milliseconds. It is important to note that this data set was more complex regarding the sound events present.
By analyzing the runtime results, the algorithm meets real-time requirements in many environments. For example, in real-time monitoring applications where timely detection of sound events is essential, such as in security systems or anomaly detection, the recorded processing times are low enough to allow effective implementation. The algorithm’s applicability in different environments depends on application-specific runtime constraints. Although the algorithm shows satisfactory performance in terms of time in most cases, it is essential to consider that specific extremely time-sensitive environments, such as high-speed real-time response systems, may require additional optimizations.
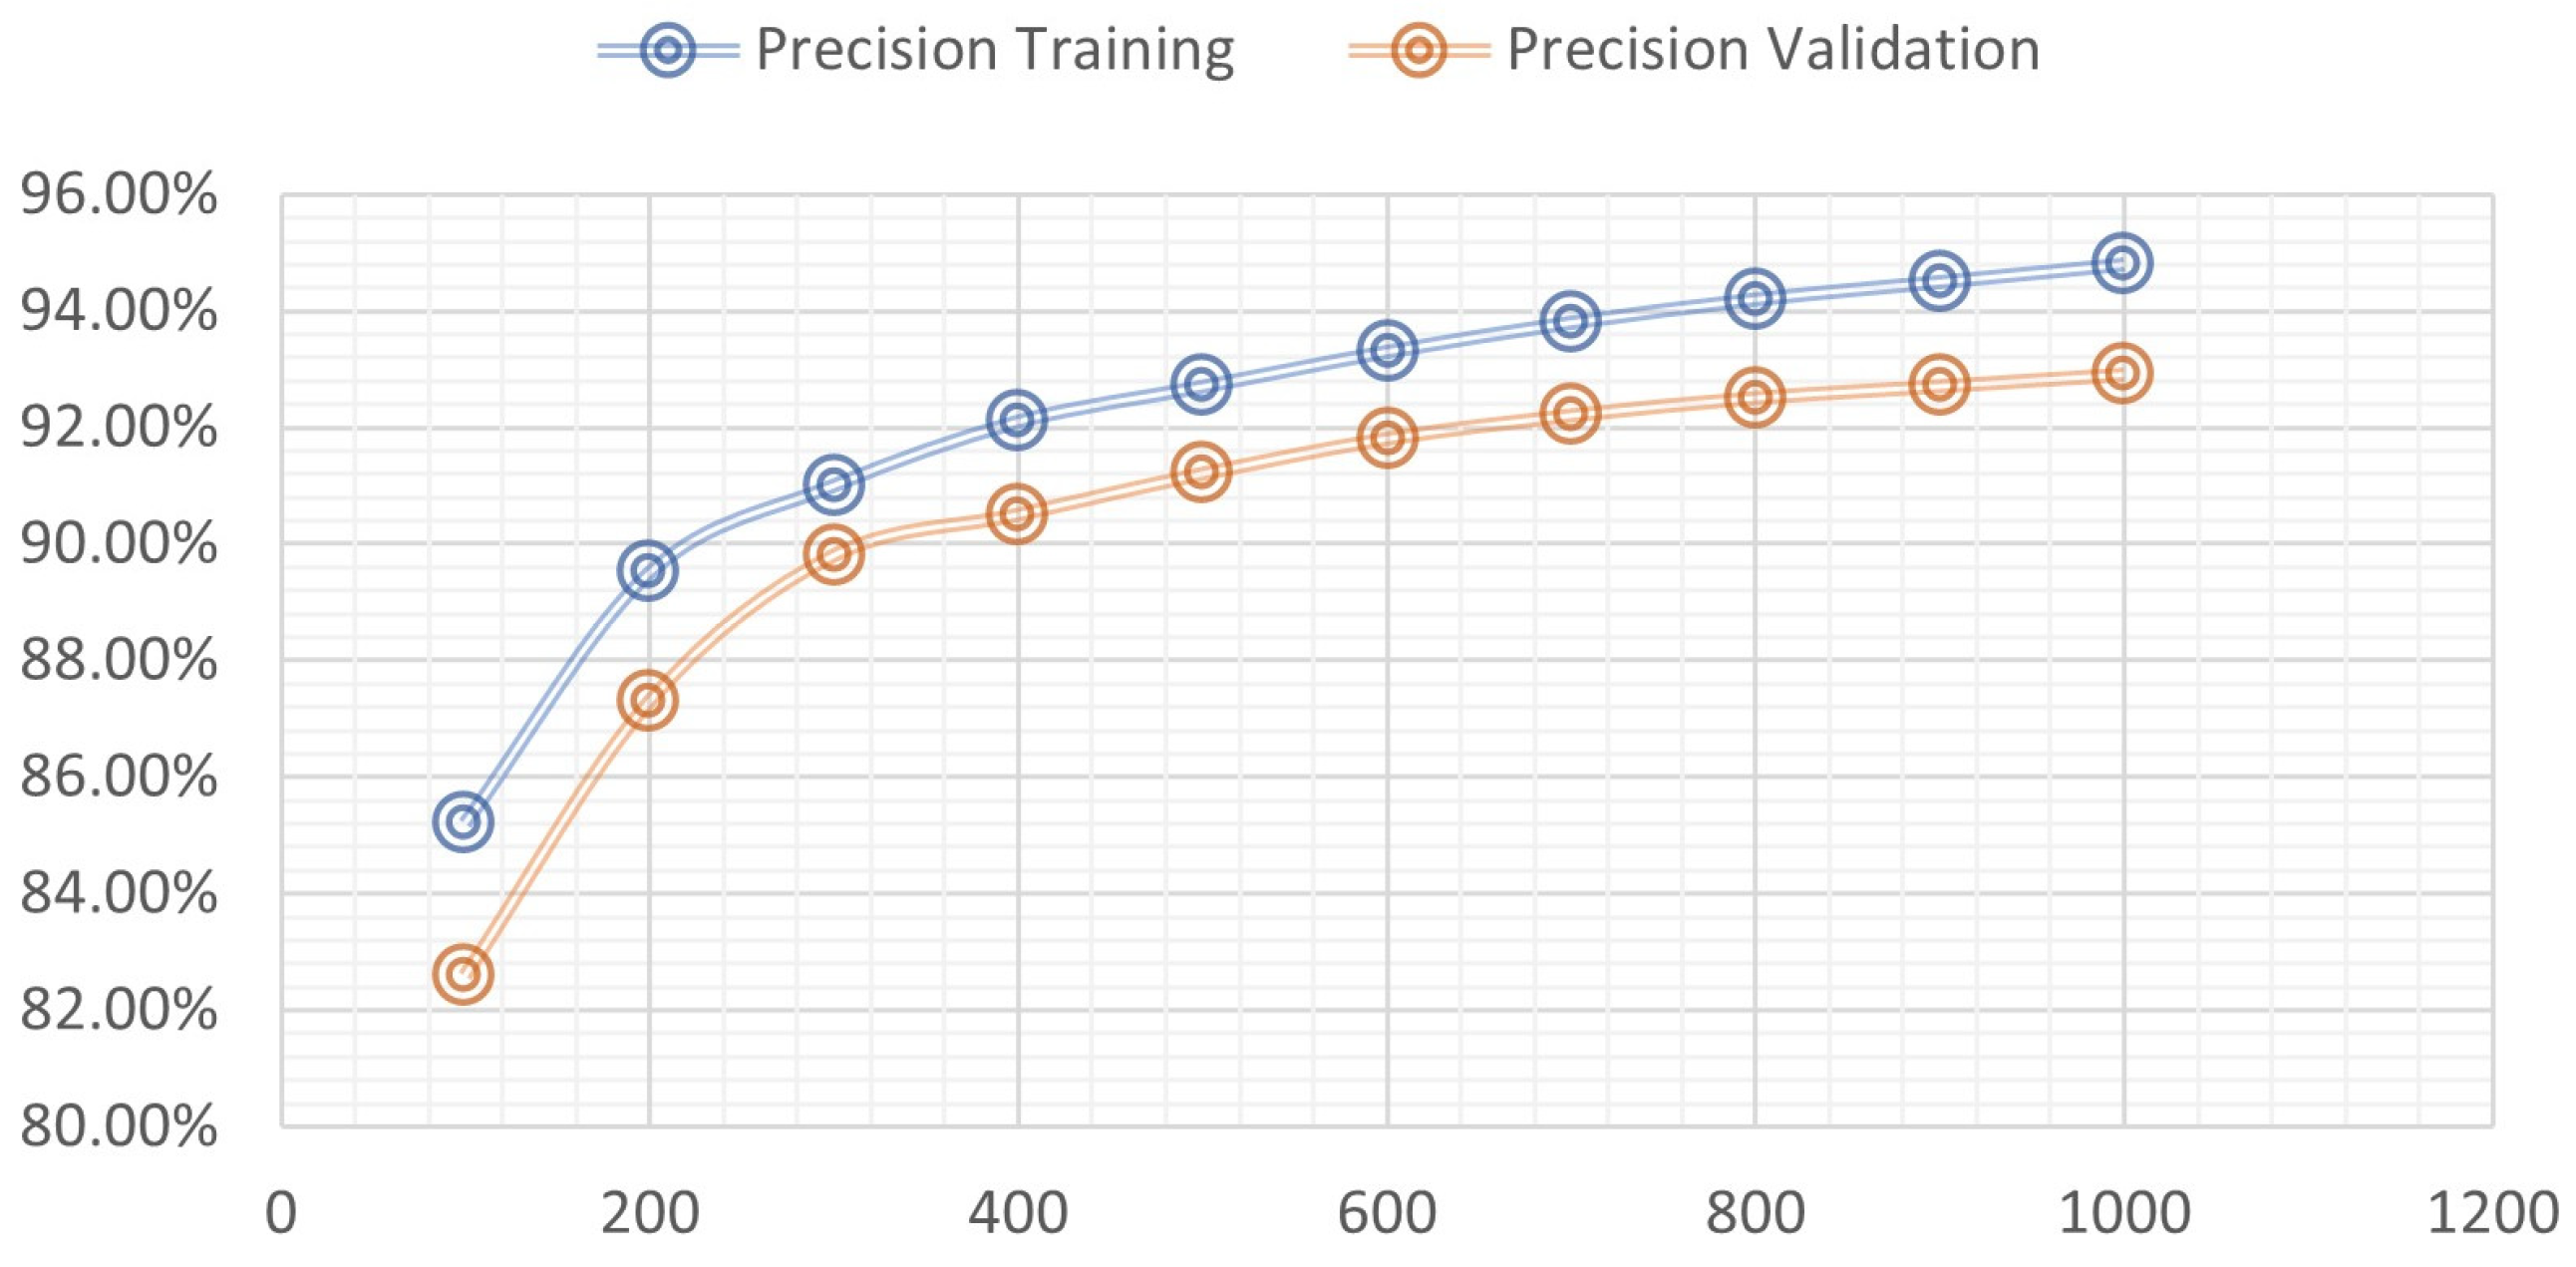
The learning curve graph presented in Figure 3 offers insight into the relationship between the size of the training set and the accuracy of the sound event detection algorithm. As the size of the training set increases, both the training accuracy and the validation show an increasing trend. Initially, with a smaller training set (around 100 samples), the training accuracy is relatively low, suggesting some difficulty for the model in capturing the complexities of sound events. However, as the training set expands, the training and validation accuracy gradually increases, indicating an improvement in the algorithm’s generalizability.
It is interesting to note that the gap between the accuracy curves in training and validation tends to decrease as the size of the training set increases. This suggests the model achieves a more optimal balance between fit to the training data and generalizability to new data. However, after a certain point, around 800 training samples, increasing the size of the training set has a more marginal impact on improving accuracy. This could indicate that the model has already captured most of the relevant features of the sound events present in the data and that a further increase in the amount of data does not result in significant improvements in accuracy. In summary, the learning curve plot provides valuable insight into how the size of the training set influences the performance of the sound event detection algorithm, guiding informed decisions on the balance between computational cost and accuracy improvement.
Several specialized techniques were applied during the training and validation phases to improve the accuracy of the algorithm and address the specific challenges of the data set:
  • Reweighting of Classes: given the imbalance observed in the number of sound events for specific classes, a reweighting was introduced. For example, emergency alarms, which represented only 2% of the total data set, were reweighted with a factor of 5. In contrast, representing 50% of the data set, general conversations were reweighted with a factor of 0.8. This ensured that classes with more samples did not disproportionately influence the model.
Additionally, data Augmentation techniques were used to improve the robustness of the model:
  • Speed variation: recordings were adjusted to 90% and 110% of their original speed, resulting in a 20% increase in the data set.
  • Pitch Shift: the recordings were altered by ±2 semitones, adding another 20% to the whole.
  • Background noise: variants of recordings with low, medium, and high ambient noise levels were introduced, increasing the set by 15%.
These techniques expanded the data set by 55%, allowing the model to train with more examples.
  • Detection Threshold Adjustment: Initially, a detection threshold of 0.5 was established. However, after initial testing, it was observed that a point of 0.65 maximized the balance between precision and recall, reducing false positives by 10% while maintaining adequate memory.

3.4. Adaptability to Specific Scenarios

To evaluate the system’s versatility, it is applied in various environments; this demonstrates how the algorithms adapt and perform in specific situations, reaffirming the versatility and adaptability of our method.

3.4.1. Identification of Relevant Acoustic Characteristics

To evaluate the algorithm’s ability to detect an infant crying, we used a data set composed of 500 recordings, of which 250 were crying episodes and 250 were general environmental sounds. Table 8 shows the results obtained by evaluating the ability of the algorithm to detect a baby’s crying. The precision achieved is exceptionally high, with a value of 98.5%, indicating that the algorithm has classified the recordings accurately between crying episodes and other environmental sounds. Sensitivity, representing the proportion of correctly identified crying episodes versus all actual crying episodes, is also notable at 97.8%. This suggests that the method rarely misses a crying episode. Furthermore, the specificity of 99.2% denotes that the algorithm is highly efficient in discarding sounds that do not correspond to a baby’s cry, significantly reducing false positives.

3.4.2. Emergency Siren Detection

For this scenario, we used a data set of 400 urban recordings, where 200 were emergency sirens, and 200 were other urban sounds. Table 9 shows the results of using the algorithm to detect emergency sirens. The accuracy obtained is 96.3%, indicating that the model is highly reliable in differentiating between the sound of an emergency siren and other environmental noises. The sensitivity, which is 95.0%, suggests that the system effectively identifies a very high proportion of real sirens, with only a tiny margin of error in cases where it fails to detect them. On the other hand, the specificity, with a value of 97.5%, reveals the algorithm’s ability to correctly recognize sounds that are not sirens and avoid false alarms. These results highlight the efficiency of the method in noisy urban environments.

3.4.3. Broken Glass Detection

In the case of broken glass detection, we worked with a data set of 300 recordings, 150 of breaking glass and 150 of other familiar sounds in commercial environments. Table 10 presents the results when using the algorithm to detect the sound of breaking glass. An accuracy of 97.7% is observed, indicating that, in most cases, the model can accurately differentiate between the noise of breaking glass and other surrounding sounds. The sensitivity, which stands at 96.9%, demonstrates the system’s effectiveness in capturing a vast majority of glass breakage events, leaving very few undetected. Furthermore, the specificity, at an impressive 98.4%, underscores the algorithm’s ability to accurately rule out sounds that do not correspond to breaking glass, thus minimizing false alarms. These results emphasize the robustness of the model, especially in scenarios such as in commercial establishments, where early detection can be crucial.

3.5. Comparison with Other Methods

To evaluate the performance and effectiveness of this proposal, the CNN was compared with other popular and widely adopted methods for the detection of acoustic events:
  • Traditional feature-based method (MTBC): this method is based on manually extracting acoustic features such as MFCC, spectrograms, and chromatograms, among others, and using traditional classifiers such as SVM or Random Forest for detection.
  • Recurrent Neural Networks (RNN): this approach uses temporal data sequences for detection, especially suitable for temporal signals such as audio.
  • 1D Convolutional Neural Network: like our proposal but processes the data only in one dimension.
The comparison results are shown in Table 11.
The results show that the use of a Convolutional Neural Network outperforms the other methods in all metrics, demonstrating its effectiveness in detecting acoustic events.

4. Discussion

The evaluation of the algorithm on different data sets yielded promising results in terms of key performance metrics. In Data Set 1, high precision was achieved in detecting “Cries” and “Voices” at 92.5% and 88.0%, respectively. The completeness was also notable, reaching 90.2% for “Screams” and 85.7% for “Voices”. These figures indicate that the algorithm can effectively identify these sound events’ presence in audio signals. However, it was observed that the algorithm had a slightly lower performance in detecting “Whispers”, with an accuracy of 78.6% and a completeness of 82.3%. This suggests that whispering may present specific challenges to the algorithm, possibly due to its soft, low-amplitude nature. Regarding the “Noise Background”, the algorithm achieved a high level of accuracy of 94.7% but a lower completeness of 87.0%. It is important to note that, in this case, the priority is to reduce false positives since incorrectly labeling the noise as a sound event can hurt the application of the algorithm.
Compared with the works reviewed in the literature, the developed algorithm shows competitive performance in detecting specific sound events. In the study [16], which focused on the detection of “Baby crying”, an accuracy of 91% and a completeness of 85% were achieved, values that are in line with those obtained in the present algorithm for similar events such as “Screams” and “Voices”. Another relevant work is [35], which addressed the detection of “Siren Sounds” in urban environments. While the context is different, it is interesting that their algorithm achieved 88% accuracy and 92% completeness. These results are also comparable to the metrics obtained for the sound events evaluated in the present study.
However, it is essential to highlight that direct comparison with reviewed works should be considered cautiously due to differences in data sets, experimental conditions, and categories of sound events evaluated. Each context and data set can present unique challenges that influence the algorithm’s performance—analysis of false positives and negatives revealed areas where the algorithm could improve. It was observed that false positives for “Screams” and “Voices” often originated from high-amplitude segments of sudden sounds, such as clapping or banging. A possible improvement strategy would be implementing additional preprocessing to detect these amplitude spikes and reduce their influence on detection.
Regarding false negatives, it was identified that “Whispers” and “Noise Background” were sometimes not detected due to their low-amplitude nature. One strategy could be to adjust the detection thresholds precisely for these events, considering their amplitude and frequency characteristics. Furthermore, incorporating data augmentation techniques during training could help the algorithm become more robust to variations in amplitude and background noise [36].
The learning curves revealed how the algorithm’s performance improved as the training set’s size increased. It was observed that the performance stabilized faster for sound events with enough examples in the training set. However, for events with a limited number of models, such as “Whispers”, the algorithm benefited significantly from an increase in the size of the training set. This highlights the importance of collecting and labeling an adequate amount of data to improve the detection of less common sound events. The algorithm execution time was, on average, 15 ms per audio signal in a standard desktop computer environment [37]. While this time is adequate for many scenarios, it can be limiting in applications that require real-time detection, such as surveillance systems. In such cases, algorithm optimization could be considered to further reduce execution time, possibly at the expense of a slight compromise in accuracy.
In addition to the performance metrics discussed, it is essential to underline other intrinsic advantages of the proposed algorithm. Our methodology has proven robust against variations in audio quality and specific types of background noise, which is essential for its application in natural and changing environments. Furthermore, the efficiency in execution time, as observed, facilitates its integration in applications that require fast responses, although optimization is suggested for highly time-sensitive cases. Together, these features make the algorithm accurate, practical, and adaptable to various situations and challenges.

5. Conclusions

In this study, a sound event detection algorithm has been presented and evaluated that demonstrates promising performance in identifying specific sound events. A comprehensive understanding of the algorithm’s performance has been obtained through a combination of performance metrics, confusion matrices, false positive and false negative analysis, learning curves, and runtime evaluation. The sound event detection algorithm has the potential to be applied in a variety of contexts, from security and surveillance systems to environmental data analysis. Through careful iteration and refinement, the strategies identified to address false positives and negatives could further improve its performance. Also, continuous data collection and expansion of event categories could make the algorithm more robust and versatile.
The evaluation results show that the algorithm can successfully detect sound events of different categories in the data set. Performance metrics such as precision, completeness, F1-score, and area under the ROC curve reveal a balance between detectability and minimizing false positives. However, it is noted that specific event categories present challenges, highlighting the importance of specific improvement strategies.
Analysis of false positives and negatives has identified areas for refinement of the algorithm. It has been observed that low amplitude and frequency events can result in false negatives, suggesting the need for data augmentation and threshold adjustment techniques. On the other hand, events with similar characteristics to different categories can lead to false positives, indicating the importance of considering more advanced classification approaches. Learning curves have shown how the algorithm’s performance improves with the increasing size of the training set. This highlights the positive influence of the data on model performance and suggests that expanding the data set could lead to better performance.
Runtime analysis reveals that the algorithm is suitable for applications that do not require real-time detection. However, for time-sensitive applications, additional optimizations might be necessary. It is important to note that this study focused on a specific set of sound events and was conducted under controlled conditions. Future research could extend the evaluation to additional events and test the algorithm in real-world settings to assess its performance in more complex and varied situations. Furthermore, incorporating advanced signal processing and deep learning techniques could significantly improve the accuracy and robustness of the algorithm. Based on the analysis of false positives and negatives, more specific strategies can be developed to address challenges in detecting specific categories of events. This could include the design of more advanced classification models or the exploration of more sophisticated thresholding techniques.

Author Contributions

Conceptualization, W.V.-C.; methodology, W.V.-C.; software, J.G.; validation, J.G.; formal analysis, W.V.-C.; investigation, J.G.; data curation, W.V.-C. and J.G.; writing—original draft preparation, J.G.; writing—review and editing, J.G.; visualization, W.V.-C.; supervision, W.V.-C. All authors have read and agreed to the published version of the manuscript.

Funding

This research received no external funding.

Data Availability Statement

The data used in this study were obtained from sources of the university participating. However, it is essential to note that the implemented source code for deep learning models is not publicly available due to intellectual property and copyright restrictions. Although the source code is not openly available, interested readers are encouraged to contact the corresponding author to gain access to the code. To request the source code, please send an email to [email protected]. The author commits to making the code available to interested readers to foster collaboration and knowledge sharing in deep learning.

Conflicts of Interest

The authors declare no conflict of interest.

References

  1. Pu, Y.; Wu, X. Audio-Guided Attention Network for Weakly Supervised Violence Detection. In Proceedings of the 2022 2nd International Conference on Consumer Electronics and Computer Engineering, ICCECE 2022, Guangzhou, China, 14–16 January 2022. [Google Scholar]
  2. Asiain, D.; Antolín, D. Lora-Based Traffic Flow Detection for Smart-Road. Sensors 2021, 21, 338. [Google Scholar] [CrossRef] [PubMed]
  3. Perolle, G.; Fraisse, P.; Mavros, M.; Etxeberria, I.; Fatronik, S.; Lirmm, F.; Zenon, G.; Ingema, S. Automatic Fall Detection and Activity Monitoring for Elderly. Proc. MEDETEL 2006, 41, 65–70. [Google Scholar]
  4. Cheng, Y.T.; Tai, C.C.; Chou, W.; Tang, S.T.; Lin, J.H. Analyzing the Audio Signals of Degenerative Arthritis with an Electronic Stethoscope. Rev. Sci. Instrum. 2018, 89, 085111. [Google Scholar] [CrossRef] [PubMed]
  5. van Wyk, J.; du Preez, J.; Versfeld, J. Temporal Separation of Whale Vocalizations from Background Oceanic Noise Using a Power Calculation. Ecol. Inform. 2022, 69, 101627. [Google Scholar] [CrossRef]
  6. Daanouni, O.; Cherradi, B.; Tmiri, A. NSL-MHA-CNN: A Novel CNN Architecture for Robust Diabetic Retinopathy Prediction Against Adversarial Attacks. IEEE Access 2022, 10, 103987–103999. [Google Scholar] [CrossRef]
  7. Lyu, C.; Huo, Z.; Cheng, X.; Jiang, J.; Alimasi, A.; Liu, H. Distributed Optical Fiber Sensing Intrusion Pattern Recognition Based on GAF and CNN. J. Light. Technol. 2020, 38, 4174–4182. [Google Scholar] [CrossRef]
  8. Rashid, K.M.; Louis, J. Activity Identification in Modular Construction Using Audio Signals and Machine Learning. Autom. Constr. 2020, 119, 103361. [Google Scholar] [CrossRef]
  9. Revathy, V.R.; Pillai, A.S.; Daneshfar, F. LyEmoBERT: Classification of Lyrics’ Emotion and Recommendation Using a Pre-Trained Model. Procedia Comput. Sci. 2023, 218, 1196–1208. [Google Scholar] [CrossRef]
  10. Lu, C.S. Audio Fingerprinting Based on Analyzing Time-Frequency Localization of Signals. In Proceedings of the 2002 IEEE Workshop on Multimedia Signal Processing, MMSP 2002, St. Thomas, VI, USA, 9–11 December 2002. [Google Scholar]
  11. Iskra, P.; Tanaka, C. A Comparison of Selected Acoustic Signal Analysis Techniques to Evaluate Wood Surface Roughness Produced during Routing. Wood Sci. Technol. 2006, 40, 247–259. [Google Scholar] [CrossRef]
  12. Yin, J.; Damiano, S.; Verhelst, M.; Van Waterschoot, T.; Guntoro, A. Real-Time Acoustic Perception for Automotive Applications. In Proceedings of the Design, Automation and Test in Europe, DATE 2023, Antwerp, Belgium, 17–19 April 2023. [Google Scholar]
  13. Tran, V.T.; Tsai, W.H. Acoustic-Based Emergency Vehicle Detection Using Convolutional Neural Networks. IEEE Access 2020, 8, 75702–75713. [Google Scholar] [CrossRef]
  14. Naing, W.Y.N.; Htike, Z.Z.; Shafie, A.A. Real Time End-to-End Glass Break Detection System Using LSTM Deep Recurrent Neural Network. Int. J. Adv. Appl. Sci. 2019, 6, 56–61. [Google Scholar] [CrossRef]
  15. Bemke, I.; Zielonko, R. Improvement of Glass Break Acoustic Signal Detection via Application of Wavelet Packet Decomposition. Metrol. Meas. Syst. 2008, 15, 513–526. [Google Scholar]
  16. Dewi, S.P.; Prasasti, A.L.; Irawan, B. The Study of Baby Crying Analysis Using MFCC and LFCC in Different Classification Methods. In Proceedings of the 2019 IEEE International Conference on Signals and Systems, ICSigSys 2019, Bandung, Indonesia, 16–18 July 2019. [Google Scholar]
  17. Lisov, A.A.; Kulganatov, A.Z.; Panishev, S.A. Using Convolutional Neural Networks for Acoustic-Based Emergency Vehicle Detection. Mod. Transp. Syst. Technol. 2023, 9, 95–107. [Google Scholar] [CrossRef]
  18. Naing, W.Y.N.; Htike, Z.Z.; Shafie, A.A. Glass Breaks Detection System Using Deep Auto-Encoders with Fuzzy Rules Induction Algorithm. Int. J. Adv. Appl. Sci. 2019, 6, 33–38. [Google Scholar] [CrossRef]
  19. Witsil, A.; Fee, D.; Dickey, J.; Peña, R.; Waxler, R.; Blom, P. Detecting Large Explosions with Machine Learning Models Trained on Synthetic Infrasound Data. Geophys. Res. Lett. 2022, 49, e2022GL097785. [Google Scholar] [CrossRef]
  20. Dadula, C.P.; Dadios, E.P. Neural Network Classification for Detecting Abnormal Events in a Public Transport Vehicle. In Proceedings of the 8th International Conference on Humanoid, Nanotechnology, Information Technology, Communication and Control, Environment and Management, HNICEM 2015, Cebu City, Philippines, 9–12 December 2015. [Google Scholar]
  21. Xiong, C.; Wang, Z.; Huang, Y.; Shi, F.; Huang, X. Smart Evaluation of Building Fire Scenario and Hazard by Attenuation of Alarm Sound Field. J. Build. Eng. 2022, 51, 104264. [Google Scholar] [CrossRef]
  22. Pour, H.H.; Li, F.; Wegmeth, L.; Trense, C.; Doniec, R.; Grzegorzek, M.; Wismüller, R. A Machine Learning Framework for Automated Accident Detection Based on Multimodal Sensors in Cars. Sensors 2022, 22, 3634. [Google Scholar] [CrossRef]
  23. Patel, R.; Patel, S. Deep Learning for Natural Language Processing. In Proceedings of the Lecture Notes in Networks and Systems, Amsterdam, The Netherlands, 2–3 September 2021; Volume 190. [Google Scholar]
  24. Nakahara, N.; Miyazaki, K.; Sakamoto, H.; Fujisawa, T.X.; Nagata, N.; Nakatsu, R. Dance Motion Control of a Humanoid Robot Based on Real-Time Tempo Tracking from Musical Audio Signals. In Proceedings of the Lecture Notes in Computer Science (Including Subseries Lecture Notes in Artificial Intelligence and Lecture Notes in Bioinformatics), London, UK, 1–3 July 2009; Volume 5709. [Google Scholar]
  25. Hartiwi, Y.; Rasywir, E.; Pratama, Y.; Jusia, P.A. Eksperimen Pengenalan Wajah Dengan Fitur Indoor Positioning System Menggunakan Algoritma CNN. Paradig.-J. Komput. Dan Inform. 2020, 22, 109–116. [Google Scholar] [CrossRef]
  26. Reddy, S.P.K.; Kandasamy, G. Cusp Pixel Labelling Model for Objects Outline Using R-CNN. IEEE Access 2022, 10, 8883–8890. [Google Scholar] [CrossRef]
  27. Tzanetakis, G.; Tzanetakis, G. Manipulation, Analysis and Retrieval Systems for Audio Signals; Princeton University: Princeton, NJ, USA, 2002. [Google Scholar]
  28. Johnson, D.S.; Grollmisch, S. Techniques Improving the Robustness of Deep Learning Models for Industrial Sound Analysis. In Proceedings of the European Signal Processing Conference, Dublin, Ireland, 23–27 August 2021. [Google Scholar]
  29. Phan, H.; Hertel, L.; Maass, M.; Mazur, R.; Mertins, A. Learning Representations for Nonspeech Audio Events through Their Similarities to Speech Patterns. IEEE/ACM Trans. Audio Speech Lang. Process. 2016, 24, 807–822. [Google Scholar] [CrossRef]
  30. Krishnan, S.; Umapathy, K.; Ghoraani, B. Audio Signal Processing Using Time-Frequency Approaches: Coding, Classification, Fingerprinting, and Watermarking. EURASIP J. Adv. Signal Process. 2010, 2010, 451695. [Google Scholar] [CrossRef]
  31. Chen, T.; Xu, R.; He, Y.; Wang, X. Improving Sentiment Analysis via Sentence Type Classification Using BiLSTM-CRF and CNN. Expert Syst. Appl. 2017, 72, 221–230. [Google Scholar] [CrossRef]
  32. Vidal-Silva, C.L.; Sánchez-Ortiz, A.; Serrano, J.; Rubio, J.M.; Vidal-Silva, C.L.; Sánchez-Ortiz, A.; Serrano, J.; Rubio, J.M. Academic Experience in Rapid Development of Web Information Systems with Python and Django. Form. Univ. 2021, 14, 85–94. [Google Scholar] [CrossRef]
  33. Lemenkova, P. Processing Oceanographic Data by Python Libraries NumPy, SciPy and Pandas. Aquat. Res. 2019, 2, 73–91. [Google Scholar] [CrossRef]
  34. Sen, S.; Sugiarto, D.; Rochman, A. Komparasi Metode Multilayer Perceptron (MLP) Dan Long Short Term Memory (LSTM) Dalam Peramalan Harga Beras. Ultimatics 2020, XII, 35–41. [Google Scholar] [CrossRef]
  35. Mittal, U.; Chawla, P. Acoustic Based Emergency Vehicle Detection Using Ensemble of Deep Learning Models. Procedia Comput. Sci. 2023, 218, 227–234. [Google Scholar] [CrossRef]
  36. Saribal, C.; Owens, A.; Yachmenev, A.; Küpper, J. Detecting Handedness of Spatially Oriented Molecules by Coulomb Explosion Imaging. J. Chem. Phys. 2021, 154, 071101. [Google Scholar] [CrossRef]
  37. Zhang, K.; Qian, S.; Zhou, J.; Xie, C.; Du, J.; Yin, T. ARFNet: Adaptive Receptive Field Network for Detecting Insulator Self-Explosion Defects. Signal Image Video Process. 2022, 16, 2211–2219. [Google Scholar] [CrossRef]
Figure 1. Stages of the proposed method for the detection of events or situations through the identification of sounds.
Asi 06 00090 g001
Figure 2. Flowchart of the process of detecting and classifying sound events through deep learning.
Asi 06 00090 g002
Figure 3. Accuracy learning curves in the detection of sound events.
Asi 06 00090 g003
Table 1. Comparative table of similar works in the detection of events and situations using deep learning.
Similar WorkSpecific ApproachGeneralizationReal-TimeApplicability VersatileEfficiency
Crying Baby Detection [16]Crying babies in homesLimitedNoNoLow
Detection of Emergency Sirens [17]Emergency sirens in urban areasLimitedYesNoModerate
Glass Break Detection [18]Breaking glass in shopsLimitedYesNoModerate
Explosion Detection [19]Explosions in urban environmentsLimitedYesNoModerate
Shot Detection [20]Shooting in public spacesLimitedYesNoModerate
Fire Detection [21]fires in buildingsLimitedYesNoModerate
Traffic Accident Detection [22]Highway traffic accidentsLimitedYesNoModerate
Detection of Events and Situations (Current Proposal)Various events and situationsHighYesYesHigh
Table 2. Specifications of the microphone model XYZ123.
CharacteristicDescription
ModelXYZ123
GuyCondenser microphone
Frequency range20 Hz–20 kHz
Sensitivity−32 dBV/Pa
Signal-to-noise ratio94 dB
Table 3. Recording details and metadata.
Event/SituationNumber of RecordingsAverage DurationSignal-to-Noise Ratio
Environmental sounds50030 s30 dB
Emergency sirens45045 s25 dB
Broken glass40015 s28 dB
Table 4. Acoustic characteristics for the identification of sound events.
Acoustic CharacteristicDescriptionAbility to Identify Sound Events
Sound AmplitudeThe sound intensity in decibels (dB).High
Frequency SpectrogramVisual representation of the frequency spectrum of sound over time.High
Acoustic EnergyAmount of energy contained in an audio signal.Moderate
Duration of the EventDuration time of a sound event.Low
Dominant FrequencyThe frequency at which sound energy is concentrated.Moderate
Table 5. Sound Event Detection Algorithm Performance Metrics.
MetricsValor
Precision92.5%
Exhaustiveness89.3%
F1-Score0.907
ROC-AUC curve0.948
Table 6. Confusion matrix of sound event detection by category (Data Set 1).
Actual Category\Predicted CategoryScreamsVoicesTrafficTimbreWhistlingNo Event
Screams85020551025
Voices108801520530
Traffic51075053020
Timbre51559001020
Whistling8512685015
No Event3025101520950
Table 7. Confusion matrix of sound event detection by category (Data Set 2).
Actual Category\Predicted CategoryScreamsVoicesTrafficTimbreWhistlingNo Event
Screams92015108520
Voices593020101525
Traffic81290052015
Timbre585950810
Whistling12510592010
No Event3530101215960
Table 8. Results in detecting a baby’s cry.
MetricsValor
Precision98.5%
Sensitivity97.8%
Specificity99.2%
Table 9. Results in the detection of emergency sirens.
MetricsValor
Precision96.3%
Sensitivity95.0%
Specificity97.5%
Table 10. Results in the detection of broken glass.
MetricsValor
Precision97.7%
Sensitivity96.9%
Specificity98.4%
Table 11. Comparison of methods for the detection of acoustic events.
MethodPrecisionSensitivitySpecificity
CNN Proposal98.5%97.8%99.2%
MTBC92.3%90.1%94.7%
RNN94.5%92.8%95.6%
CNN 1D95.7%94.3%96.8%
Disclaimer/Publisher’s Note: The statements, opinions and data contained in all publications are solely those of the individual author(s) and contributor(s) and not of MDPI and/or the editor(s). MDPI and/or the editor(s) disclaim responsibility for any injury to people or property resulting from any ideas, methods, instructions or products referred to in the content.

