Abstract
The most suitable method for assessing bone age is to check the degree of maturation of the ossification centers in the radiograph images of the left wrist. So, a lot of effort has been made to help radiologists and provide reliable automated methods using these images. This study designs and tests Alexnet and GoogLeNet methods and a new architecture to assess bone age. All these methods are implemented fully automatically on the DHA dataset including 1400 wrist images of healthy children aged 0 to 18 years from Asian, Hispanic, Black, and Caucasian races. For this purpose, the images are first segmented, and 4 different regions of the images are then separated. Bone age in each region is assessed by a separate network whose architecture is new and obtained by trial and error. The final assessment of bone age is performed by an ensemble based on the Average algorithm between 4 CNN models. In the section on results and model evaluation, various tests are performed, including pre-trained network tests. The better performance of the designed system compared to other methods is confirmed by the results of all tests. The proposed method achieves an accuracy of 83.4% and an average error rate of 0.1%.
1. Introduction
Doctors can estimate the growth and maturation of the child’s bone and skeletal system, diagnose hormonal [1] and genetic diseases, and treat some problems and disorders in children’s development, such as precocious puberty, by conducting tests and research on the child’s bone age [2]. This is usually done by taking an X-ray of the left hand. Due to spending the least amount of time, the least complications to obtain information inside the human body, providing an accurate image of a large number of ossification centers in the body, and using little rays, this is a safe and painless method [3]. In the traditional GP (Greulich & Pyle) [4] method, the child’s bone age also referred to as skeletal age is determined by determining which of the standard X-ray atlas images (obtained from other healthy children of the same sex and age) best matches the appearance of the bones in the child’s X-ray. However, another proposed method to determine bone age is TW (Tanner-Whitehouse) [5,6,7] and performs based on a scoring system. Bone age indicates the growth rate of a child’s bones. It can be more than the real age for some children and less for some. Disturbances in the growth process can cause the difference between these two numbers, which requires follow-up and treatment before the bone plates close. For example, bone age lower than chronological age indicates that the child probably has problems with growth hormone secretion. The child may even have problems with height growth. So, these types of disorders can be treated with bone age radiology at a young age. However, such disorders are more difficult to fix in older age. Both traditional methods are time-consuming and depend on the knowledge and experience of radiologists [8]. Therefore, automated BAA (Bone age assessment) methods are very necessary to reduce errors and help radiologists [9].
The DHA digital hand atlas database system [10] is a general and comprehensive database for the evaluation of automatic methods of bone age determination. Although many methods have been proposed for bone age assessment, most of them have been trained on private or breed-specific databases, and only a limited number of them have been trained and tested on this database. In the methods proposed in [11,12,13], automatic assessment of bone age has been performed using image processing and computer vision and techniques such as SVM, histogram [14], and fuzzy classification, and among the methods based on deep neural networks (DNNs), the methods proposed in [15,16,17] have been trained and tested on this database. According to the results, more effective and accurate methods should be implemented on this general and comprehensive dataset. Despite the existence of deep learning methods for estimating bone age, there are the following challenges associated with them: 1. Neither of the existing systems is truly based on the TW method. 2. None of the existing methods extracted all fingers of the hand and did not employ the combination of scores of different parts of the hand. 3. In each of these methods, a CNN constructing architecture is used, but one should note that the construction of a proper architecture for CNN depends on the knowledge level of the designer. Accordingly, in this study, a fully automatic system based on DNNs has been provided, which has improved the results obtained on this database. The proposed system includes preprocessing, feature extraction, and classification steps.
In the TW3 method, the radius, ulna, and joints of the three fingers are analyzed as ROIs (Figure 1—numbered 1 to 13). It is relatively more accurate than the GP method because it evaluates and scores the maturation of each bone independently. So, in this study, the regions R1, R2, R3, and R4 specified in Figure 1 are first extracted using image processing techniques in the preprocessing section after removing the redundant regions and specifying the hand region. The maturation level of each region is then calculated using a CNN in the feature extraction and classification steps. The rest of the study is organized as follows: In the Section 2, the literature review is given. The Section 3 describes the proposed system. In the Section 4, the experimental results are presented, and In the Section 5, a general comparison between the presented methods and the proposed method in this article is made. The proposed method is fully automatic.
Figure 1.
Numbers 1 to 13 indicate the ROI regions in the TW method (R1 to R4 regions extracted from DHA images).
2. Literature Review
Deep learning algorithms have recently caused great developments in digital and medical image processing and have performed well in diagnosing various diseases. Moreover, various papers have been published on the application of DNNs in bone age diagnosis [18]. proposed a deep learning-based approach where GoogLeNet and OxfordNet architectures and a 15-layer architecture called BoNet were tested on DHA database images, with the highest accuracy of 0.79% for BoNet. Ref. [8] tested GoogleNet, ResNet, and CaffeNet architectures to determine bone age on private databases. Despite its good performance, this system required manual marking on the image to find the hand region. In [19], an automatic method based on GoogleNet, AlexNet, and VGGNet networks was introduced. The system was not verified with the small number of images tested and the developmental health of the people to whom the image belonged. Ref. [8] proposed a model that considered the region with the largest area as the hand region and used MobileNetV3 and MLP for feature extraction and classification. The MAE model error rate was 6.2. The above methods have not done any special classification on the images and perform based on the GP method. So, some studies provide more accurate methods based on the TW method. In these studies, the ROI regions are first extracted from the images, based on review and scoring of which the final diagnosis is made. In the [16] method, ROI regions were extracted by R-CNN and the classification process was performed using the ST-Resnet network. Both methods included private databases. As a result, the results could not be compared and repeated. In [15], 4 ROI regions were first extracted in the preprocessing step. 13 ROI regions including joints were then extracted by 4 Faster-RCNN networks. Feature extraction and determination of the maturation level of each area were performed by a VGG-net network, and the final decision was determined based on voting between the networks. In [20], 14 ROI regions were first extracted from the original image, and the performance of VGG-19, GoogleNet, and AlexNet models was then evaluated for age estimation in these regions. The accuracy obtained was about 67%, which was lower than other methods. In [21], six ROI regions were detected using R-CNN, and the 3-layer growth state of the regions was investigated and determined by Inception-SVR. This method was limited to the investigation of 6 small regions. Both these methods used the DHA database. The results suggested that one could hope to provide more effective methods with higher accuracy for this dataset. The weakness that can be seen in most of the previous works is:
- 1-
- Not extracting hand areas automatically or extracting limited areas
- 2-
- The use of single class models which actually reduces the comprehensiveness of the model
- 3-
- Failure to use approaches such as collective intelligence such as ensemble algorithms to detect bone age from different areas of the hand
3. The Proposed Method
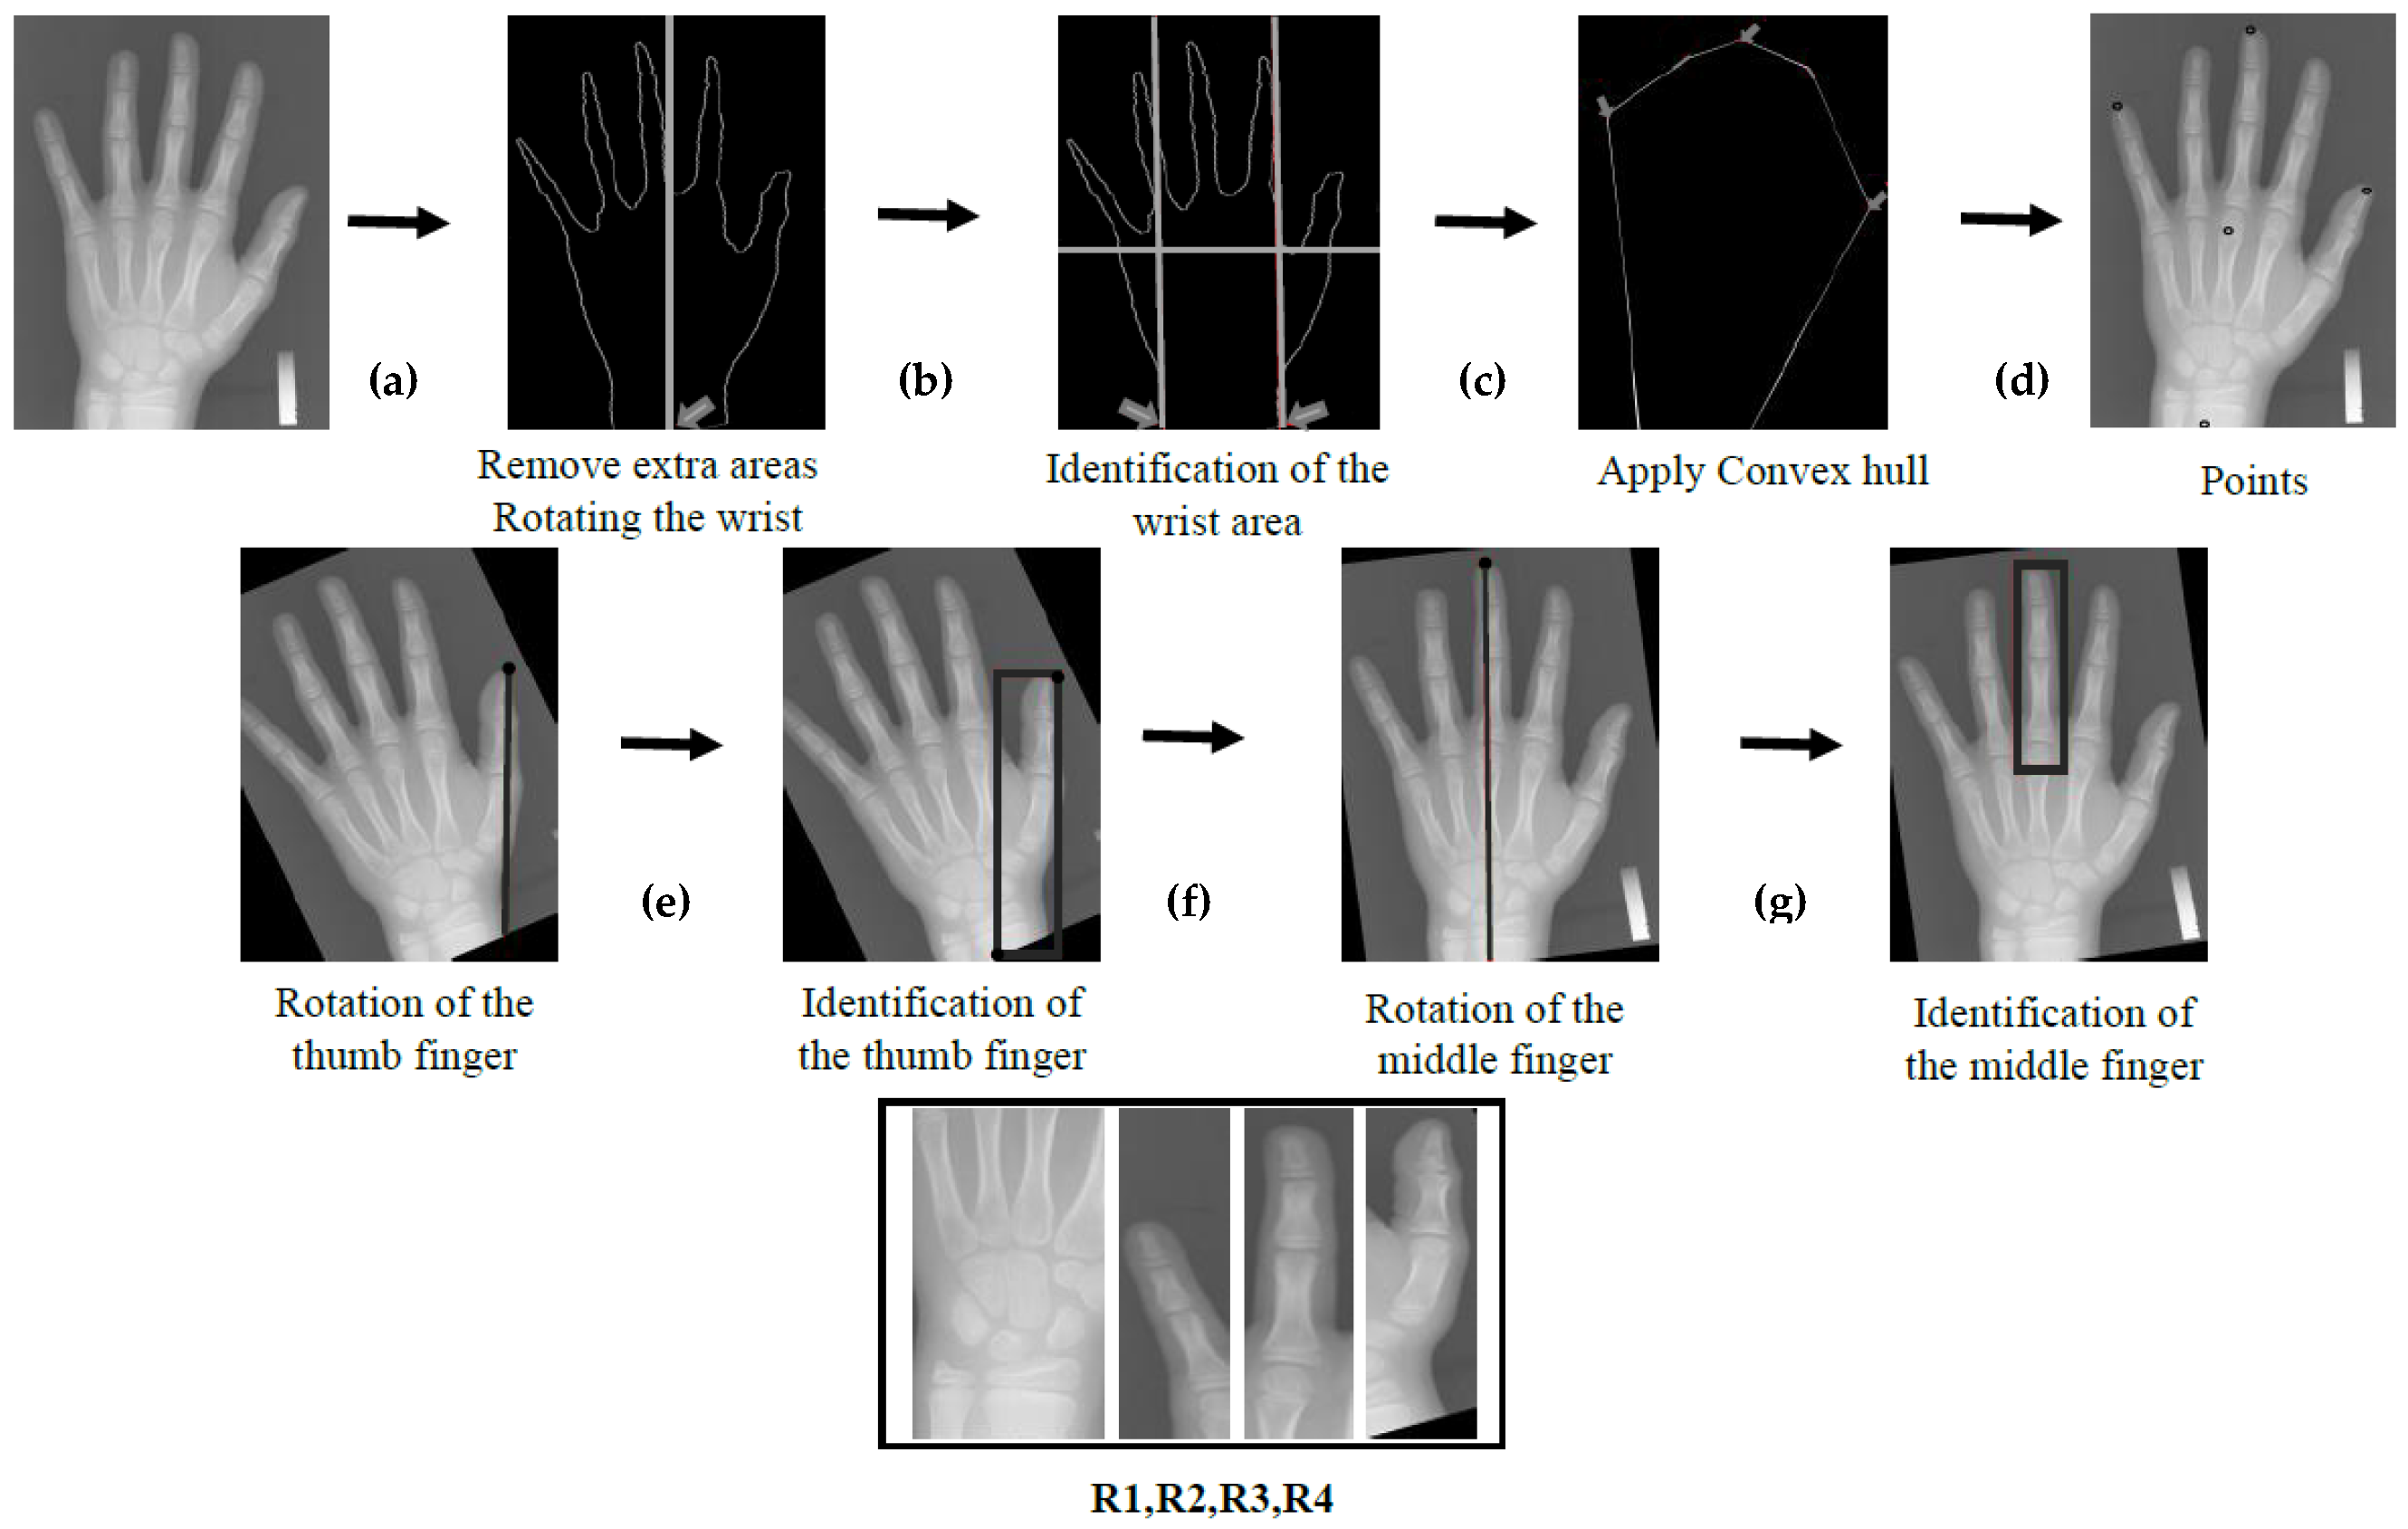
The first step in the BAA system proposed in this study is the extraction of the hand region and the removal of redundant regions from the image because they interfere with the processes. The second step is the extraction of sufficiently large regions from the wrist, thumb, middle finger, and little finger, which are marked with R1, R2, R3, and R4 in Figure 1. These regions including all the real ROIs used in the TW3 method (regions 1 to 13 in Figure 1) are called R1 to R4. All pre-processing is done by MATLAB functions which are shown in bold in the text. The input images to the pre-processing section have dimensions of 256 × 256. But finally, the calculated area sizes are the same and the dimensions are 64 × 64.
3.1. Preprocessing
In the first process, the input X-ray image is converted into a binary image using a thresholding algorithm shown in Algorithm 1, where T is the thresholding function, f is the input image, I is the binary image, and m and n are the length and width of the input image. The redundant regions in the image are then removed using the region props command, which measures the characteristics of different regions of the image.
| Algorithm 1. (Binary Image)—Pseudo code– |
| A Image From DHA. Binary Image
|
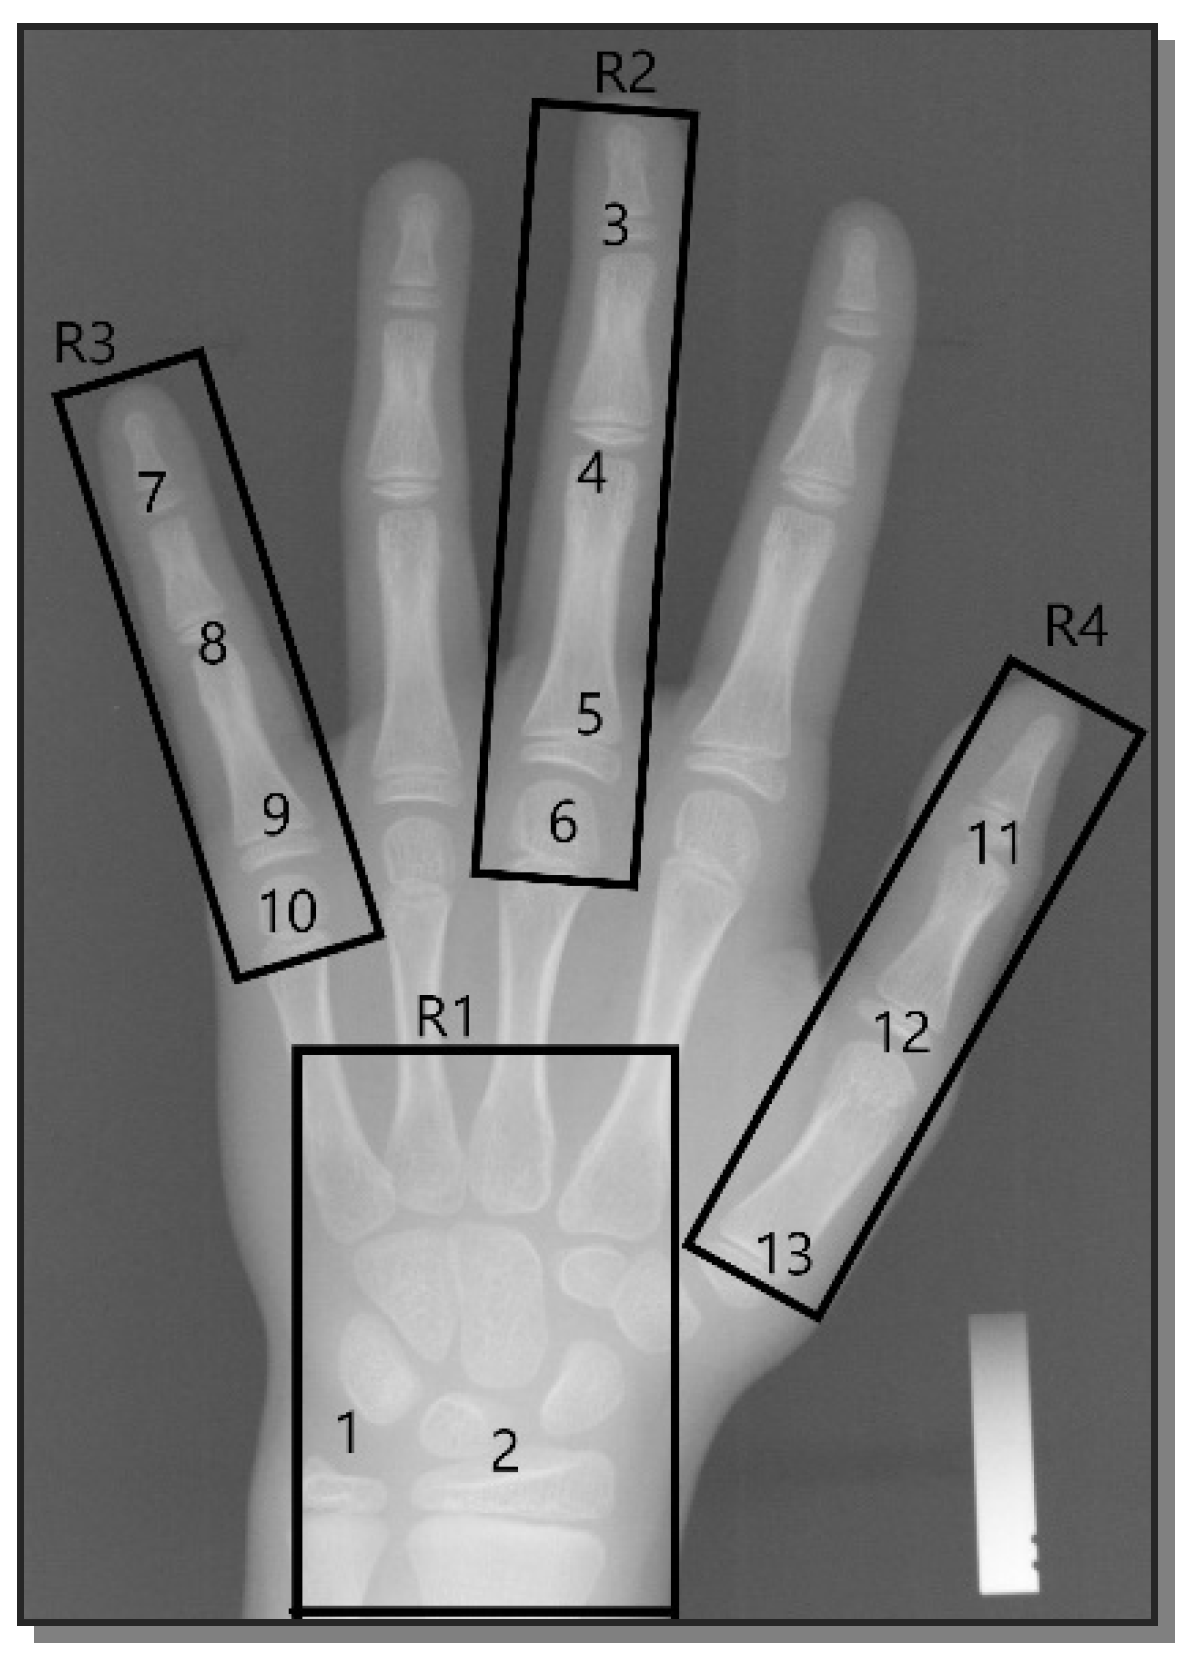
3.2. Extraction of ROI Regions
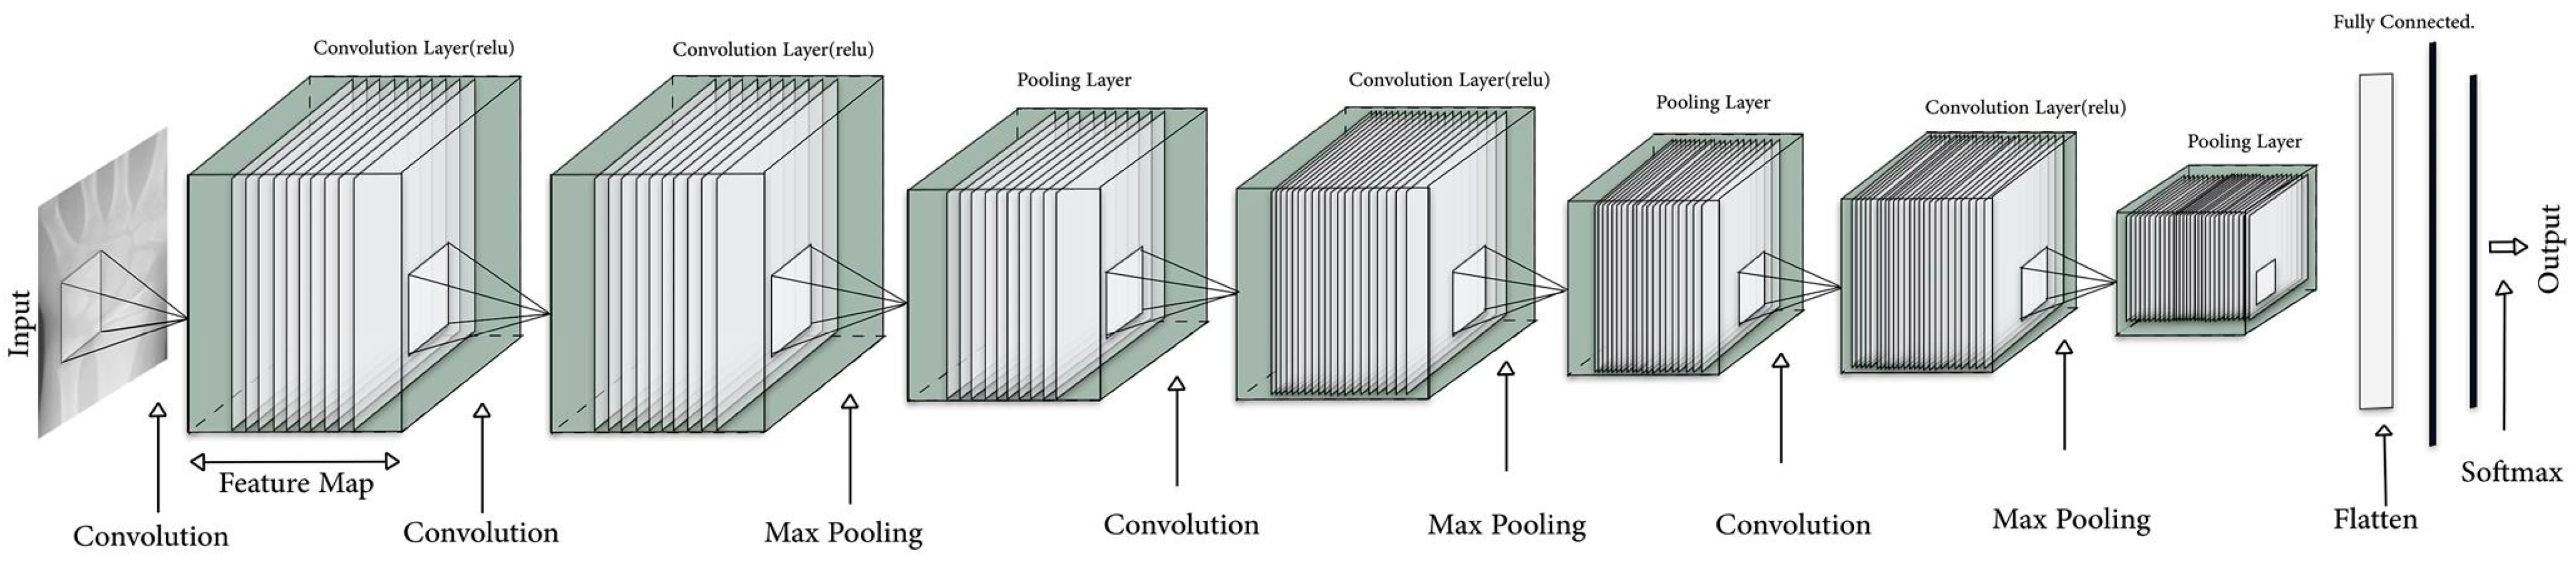
In the second part, the edges of the hand image are first determined by estimating the derivative using the edge function to separate the desired regions so that only the hand border pixels are white, and the edges of the pixels are set to zero. Besides, the coordinates of the white pixels of each row are stored. The center of the hand is then determined by the coordinates of these pixels, and a horizontal line is drawn parallel to it, which divides the image into two parts. As shown in the Figure 2, the lower part corresponds to R1. In this way, the R1 region is extracted completely automatically. In the third part, the coordinates of the finger regions should be found to extract the R2, R3, and R4 regions. The convex hull algorithm is used to find the coordinates of the fingers. The output of the convex hull algorithm is given in the figure. The coordinates of the border points of this convex region are stored in an array, and the intersection of the lines is obtained by calculating the slope of the line between the consecutive points of the figure. The intersections of the lines are the fingertips, which are obtained completely automatically. R2, R3, and R4 can be correctly extracted according to the obtained coordinates which can be seen in the figure. A straight line is drawn between the two points of the fingertip and the center of the hand or the fingertip and the middle of the wrist, and the image is rotated based on this line (Figure 2) so that the desired region is in a straight position to perform the crup operation. The width of the fingers is estimated and the corresponding region of each finger is determined (Figure 2) according to the border pixels, and the crup function is called based on the top, bottom, left, and right boundaries (Figure 2).
Figure 2.
Preprocessing-Extraction of ROI Regions.
3.3. Age Assessment
The pre-trained Alexnet and GoogLeNet methods and the architecture designed in this study are tried and tested to assess bone age. Feature extraction and age estimation in each ROI are performed by an independent CNN because each extracted region contains specific ROIs of the TW3 method and has its unique characteristics. The result is obtained based on the Average Voting Ensemble. As can be seen in the figure, the proposed CNN model has a 7-layer (Figure 3) architecture with 4 convolution layers and 3 Max pooling layers. The details of the CNN architecture are shown in Table 1. A set of independent CNNs predicts skeletal maturation in each region. There are 4 different projections for each image. Finally, age is predicted by averaging between the predictions of the developed models. An ensemble between 4 CNN models is used for final bone age detection. The ensemble uses the average algorithm in such a way that the overall classification includes 19 classes (0 to 18 years) and the output of each CNN in the previous part is the probability of belonging to each class (1, …, 19). The output of each CNN is normalized by a softmax function. The average bone age in all 4 regions is obtained for each image and is considered the final diagnosis.
Figure 3.
The architecture of the proposed CNN.
Table 1.
Convolutional and Pooling parameters in the proposed CNN architecture.
4. Results
In this section, the dataset, CNN parameters, evaluation measures, and the experimental results of the proposed BAA system are described.
4.1. Dataset
The proposed model is trained and evaluated using a publicly available database called the Digital Hand Atlas System (DHA) (http://www.ipilab, accessed on 14 January 2023), which has 1400 radiograph images of the left wrist of people aged 0 to 18 years by Asian, Black, Hispanic, and Caucasian races. Table 2 shows the distribution of the images. The maturation level of each image is determined by two radiologists. In the training step of deep neural networks, 20% of the X-ray images are randomly selected as the validation dataset, and the remaining 80% is considered as the training set. During the model training, the images are artificially augmented to increase the number of images and achieve higher accuracy. Each image is resized, rotated, and reshaped. 4 images are created for each crop of the image, that is, the input of each CNN is upgraded to 5600 images instead of 1400 images. This increases the accuracy by 2 or 3%.
Table 2.
Distribution of the images of the DHA dataset.
4.2. The Initial Values of the CNN Training Parameters
The parameters used to train CNN are as follows: 1. Learning Rate. Determining the learning rate is very important because the algorithm may get stuck in local minima, or the network may become unstable and not converge if the learning rate is not chosen correctly. It is set to 0.010 for the proposed network, 2. Batch size. This parameter is set to the value of 300 to prevent overfitting of the model, and 3. The number of training epochs. This [22] value is set to 900. This parameter is very important because the network may overfit if the number of epochs is too high. In the proposed model, these parameters are obtained by various experimental tests. Furthermore, the value of the learning rate decay is set to 0.86.
4.3. Evaluation Measures
The efficiency of the proposed method is evaluated using different measures as follows: Accuracy, Precision, Recall, F-Measure, and MAE (difference between the predicted value and the actual value) [23,24]. The formula for each measure is given below: (xi is the label, and yi is the estimated bone age)
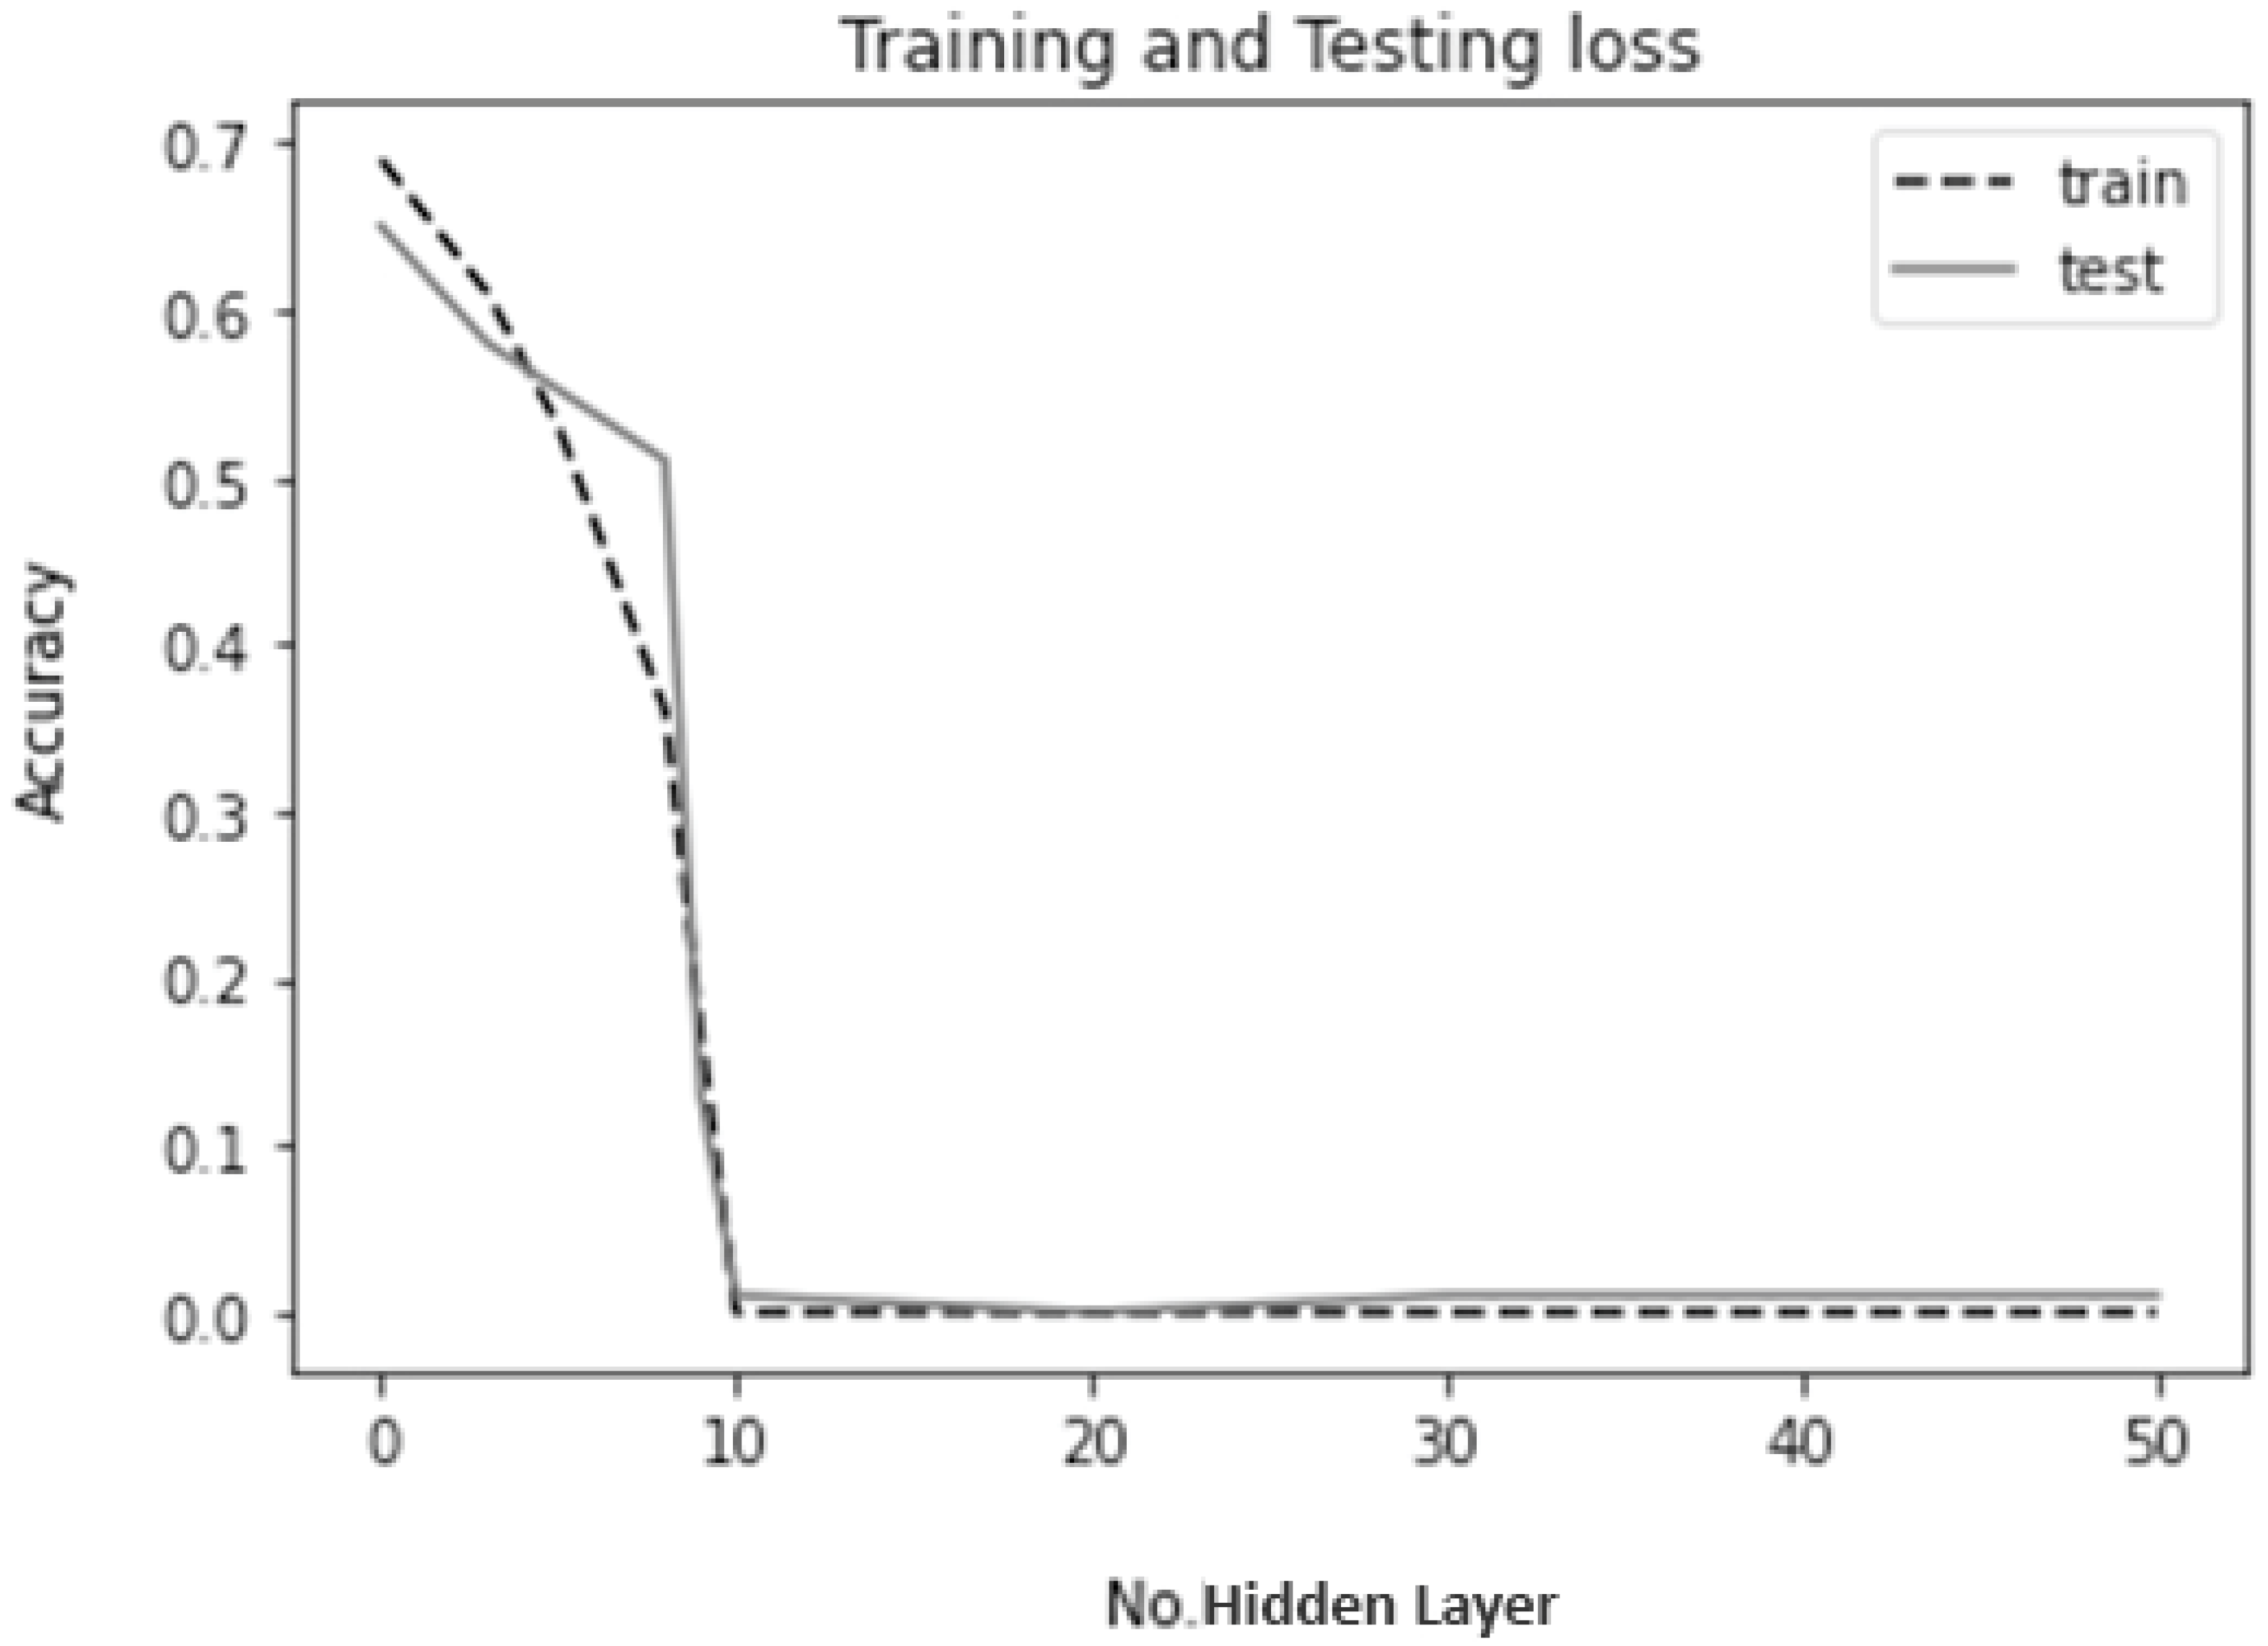
4.4. Evaluation of the Proposed Method
The proposed model extracts the wrist, thumb, middle finger, and little finger regions from the original images and uses four separate CNNs for classification in the training process. So, a test is first performed to evaluate the efficiency of the proposed method in the preprocessing section based on image segmentation and extraction of 4 image regions. To this end, bone age detection is first performed using the GP method without performing specific segmentation, and bone age is then detected by segmentation and using the TW method. According to the results, the proposed segmentation method performs well. The segmentation success rate by the proposed method can be seen in Table 3.
Table 3.
Evaluating the effect of ROI regions segmentation on accuracy.
The accuracy of the network with different architectures is checked during various tests to further evaluate the proposed model and achieve a specific CNN architecture and combination with maximum efficiency. The detection accuracy first increases and the performance of the network improves as the number of layers increases. Finally, the 7-layer network achieves the maximum ACC according to the obtained results, which can be seen in the Figure 4. Various tests are performed to achieve the right number of training epochs to increase the maximum efficiency. The results of the tests indicate the convergence of the model at 900 epochs (Figure 5). The effectiveness of the proposed method for different classifications of images by Asian, Hispanic, Black, and Caucasian races is then tested and checked, the results of which are given in the Table 4. The performance of the model on all the images based on age is checked using Accuracy, Precision, Recall, and F1 in another test, the results of which are reported in the Table 5 as well.
Figure 4.
The loss function of the proposed model.
Figure 5.
Evaluation of the number of layers of the proposed model.
Table 4.
Evaluation of the proposed system’s performance for images by Asian, Hispanic, Black, and Caucasian races.
Table 5.
Evaluation of the proposed system’s performance for different age groups by accuracy, precision, recall, and F1.
4.5. Comparison of the Proposed Method with Other Advanced Methods
Various automatic bone age assessment methods have been provided to date, all of which are based on the traditional GP and TW methods. These methods are mainly tested on private images and are limited to a specific age group and race (see Section 2). The results cannot be compared and repeated due to the lack of access to information on the methods. Few methods have been tested on the DHA dataset. In this section, the methods implemented on DHA and the proposed method are compared. According to the index Table 6, this comparison is based on Accuracy and MAE. The mentioned methods from machine learning to CNNs have been implemented using different algorithms. The results obtained by all the mentioned models show that the proposed method performs better than the other methods.
Table 6.
Comparison of the methods implemented on the DHA dataset.
5. Conclusions and Future Scope
This study designs and tests Alexnet and GoogLeNet methods and a new architecture to assess bone age. All these methods are implemented fully automatically on the DHA dataset including 1400 wrist images of healthy children aged 0 to 18 years from Asian, Hispanic, Black, and Caucasian races. In the pre-processing section, a segmentation is performed on the images, and 4 different regions of the images including all the ROIs of the TW method are separated from the images. During the model training, the images are artificially augmented by resizing and rotating to increase the number of images and achieve higher accuracy. Bone age in each region is assessed by a separate network whose architecture is new and obtained by trial and error. The final assessment of bone age is performed by an ensemble based on the Average algorithm between 4 CNN models. In the section on results and model evaluation, various tests are performed, including pre-trained network tests. The better performance of the designed system compared to other methods is confirmed by the results of all tests. The proposed method achieves an accuracy of 83.1% and an average error rate of 0.1%. To strengthen the proposed method, we plan to use new methods such as transfer learning to add the knowledge in a large model to a smaller model with fine-tuning to make it usable in edge devices.
Author Contributions
Conceptualization, M.N.M. and H.T.R.; methodology, H.T.R.; software, M.N.M.; validation, M.N.M., H.T.R. and S.K.; formal analysis, H.T.R.; investigation, M.N.M.; resources, M.N.M.; data curation, M.N.M.; writing—original draft preparation, M.N.M.; writing—review and editing, H.T.R. and S.K.; visualization, M.N.M.; supervision, H.T.R. and S.K.; project administration, H.T.R. All authors have read and agreed to the published version of the manuscript.
Funding
This research received no external funding.
Data Availability Statement
Not applicable.
Conflicts of Interest
The authors declare no conflict of interest.
References
- Martin, D.D.; Wit, J.M.; Hochberg, Z.; Sävendahl, L.; Van Rijn, R.R.; Fricke, O.; Cameron, N.; Caliebe, J.; Hertel, T.; Kiepe, D. The use of bone age in clinical practice–part 1. Horm. Res. Paediatr. 2011, 76, 1–9. [Google Scholar] [CrossRef]
- Gilsanz, V.; Ratib, O. Hand Bone Age: A Digital Atlas of Skeletal Maturity; Springer: Berlin/Heidelberg, Germany, 2005. [Google Scholar]
- Olivares, L.A.L.; De León, L.G.; Fragoso, M.I. Skeletal age prediction model from percentage of adult height in children and adolescents. Sci. Rep. 2020, 10, 15768. [Google Scholar] [CrossRef] [PubMed]
- Crocker, M.K.; Stern, E.A.; Sedaka, N.M.; Shomaker, L.B.; Brady, S.M.; Ali, A.H.; Shawker, T.H.; Hubbard, V.S.; Yanovski, J.A. Sexual dimorphisms in the associations of BMI and body fat with indices of pubertal development in girls and boys. J. Clin. Endocrinol. Metab. 2014, 99, E1519–E1529. [Google Scholar] [CrossRef] [PubMed]
- Tanner, J.; Whitehouse, R.; Marshall, W.; Carter, B. Prediction of adult height from height, bone age, and occurrence of menarche, at ages 4 to 16 with allowance for midparent height. Arch. Dis. Child. 1975, 50, 14–26. [Google Scholar] [CrossRef] [PubMed]
- Tanner, J.M. Assessement of Skeletal Maturity and Predicting of Adult Height (TW2 Method). Predict. Adult Height 1983, 131, 22–37. [Google Scholar]
- Carty, H. Assessment of Skeletal Maturity and Prediction of Adult Height (TW3 Method); Tanner, J., Healy, M., Goldstein, H., Cameron, N., Eds.; WB Saunders: London, UK, 2001; p. 110. ISBN 0-7020-2511-9. [Google Scholar]
- Lee, J.H.; Kim, Y.J.; Kim, K.G. Bone age estimation using deep learning and hand X-ray images. Biomed. Eng. Lett. 2020, 10, 323–331. [Google Scholar] [CrossRef]
- Lindsey, R.; Daluiski, A.; Chopra, S.; Lachapelle, A.; Mozer, M.; Sicular, S.; Hanel, D.; Gardner, M.; Gupta, A.; Hotchkiss, R. Deep neural network improves fracture detection by clinicians. Proc. Natl. Acad. Sci. USA 2018, 115, 11591–11596. [Google Scholar] [CrossRef]
- Cao, F.; Huang, H.; Pietka, E.; Gilsanz, V.; Dey, P.; Gertych, A.; Pospiech-Kurkowska, S. Image Database for Digital Hand Atlas. In Proceedings of the Medical Imaging 2003: PACS and Integrated Medical Information Systems: Design and Evaluation, San Diego, CA, USA, 18–20 February 2003. [Google Scholar] [CrossRef]
- van Rijn, R.R.; Lequin, M.H.; Thodberg, H.H. Automatic determination of Greulich and Pyle bone age in healthy Dutch children. Pediatr. Radiol. 2009, 39, 591–597. [Google Scholar] [CrossRef]
- Thodberg, H.H.; Kreiborg, S.; Juul, A.; Pedersen, K.D. The BoneXpert Method for Automated Determination of Skeletal Maturity. IEEE Trans. Med. Imaging 2009, 28, 52–66. [Google Scholar] [CrossRef]
- Mansourvar, M.; Raj, R.G.; Ismail, M.A.; Kareem, S.A.; Shanmugam, S.; Wahid, S.; Mahmud, R.; Abdullah, R.H.; Nasaruddin, F.H.F.; Idris, N. Automated web based system for bone age assessment using histogram technique. Malays. J. Comput. Sci. 2012, 25, 107–121. [Google Scholar]
- Mandal, M.K.; Aboulnasr, T.; Panchanathan, S. Fast wavelet histogram techniques for image indexing. Comput. Vis. Image Underst. 1999, 75, 99–110. [Google Scholar] [CrossRef]
- Son, S.J.; Song, Y.; Kim, N.; Do, Y.; Kwak, N.; Lee, M.S.; Lee, B.-D. TW3-based fully automated bone age assessment system using deep neural networks. IEEE Access 2019, 7, 33346–33358. [Google Scholar] [CrossRef]
- Chen, X.; Li, J.; Zhang, Y.; Lu, Y.; Liu, S. Automatic feature extraction in X-ray image based on deep learning approach for determination of bone age. Future Gener. Comput. Syst. 2020, 110, 795–801. [Google Scholar] [CrossRef]
- Lee, H.; Tajmir, S.; Lee, J.; Zissen, M.; Yeshiwas, B.A.; Alkasab, T.K.; Choy, G.; Do, S. Fully Automated Deep Learning System for Bone Age Assessment. J. Digit. Imaging 2017, 30, 427–441. [Google Scholar] [CrossRef]
- Spampinato, C.; Palazzo, S.; Giordano, D.; Aldinucci, M.; Leonardi, R. Deep learning for automated skeletal bone age assessment in X-ray images. Med. Image Anal. 2017, 36, 41–51. [Google Scholar] [CrossRef]
- Gao, Y.; Zhu, T.; Xu, X. Bone age assessment based on deep convolution neural network incorporated with segmentation. Int. J. Comput. Assist. Radiol. Surg. 2020, 15, 1951–1962. [Google Scholar] [CrossRef]
- Ding, Y.A.; Mutz, F.; Côco, K.F.; Pinto, L.A.; Komati, K.S. Bone age estimation from carpal radiography images using deep learning. Expert Syst. 2020, 37, e12584. [Google Scholar] [CrossRef]
- Bui, T.D.; Lee, J.-J.; Shin, J. Incorporated region detection and classification using deep convolutional networks for bone age assessment. Artif. Intell. Med. 2019, 97, 1–8. [Google Scholar] [CrossRef]
- Li, S.; Liu, B.; Li, S.; Zhu, X.; Yan, Y.; Zhang, D. A deep learning-based computer-aided diagnosis method of X-ray images for bone age assessment. Complex Intell. Syst. 2022, 8, 1929–1939. [Google Scholar] [CrossRef]
- Lu, Y.; Zhang, X.; Jing, L.; Fu, X. Data Enhancement and Deep Learning for Bone Age Assessment using The Standards of Skeletal Maturity of Hand and Wrist for Chinese. In Proceedings of the 2021 43rd Annual International Conference of the IEEE Engineering in Medicine & Biology Society (EMBC), Online, 1–5 November 2021; pp. 2605–2609. [Google Scholar]
- Sepahvand, M.; Abdali-Mohammadi, F.; Mardukhi, F. Evolutionary metric-learning-based recognition algorithm for online isolated Persian/Arabic characters, reconstructed using inertial pen signals. IEEE Trans. Cybern. 2016, 47, 2872–2884. [Google Scholar] [CrossRef]
- Kashif, M.; Deserno, T.M.; Haak, D.; Jonas, S. Feature description with SIFT, SURF, BRIEF, BRISK, or FREAK? A general question answered for bone age assessment. Comput. Biol. Med. 2016, 68, 67–75. [Google Scholar] [CrossRef] [PubMed]
- Gertych, A.; Zhang, A.; Sayre, J.; Pospiech-Kurkowska, S.; Huang, H.K. Bone age assessment of children using a digital hand atlas. Comput. Med. Imaging Graph. 2007, 31, 322–331. [Google Scholar] [CrossRef] [PubMed]
- Iandola, F.N.; Han, S.; Moskewicz, M.W.; Ashraf, K.; Dally, W.J.; Keutzer, K. SqueezeNet: AlexNet-level accuracy with 50x fewer parameters and <0.5 MB model size. arXiv 2016, arXiv:1602.07360. [Google Scholar]
- Szegedy, C.; Liu, W.; Jia, Y.; Sermanet, P.; Reed, S.; Anguelov, D.; Erhan, D.; Vanhoucke, V.; Rabinovich, A. Going deeper with convolutions. In Proceedings of the IEEE Conference on Computer Vision and Pattern Recognition, Boston, MA, USA, 12 June 2015; pp. 1–9. [Google Scholar]
Disclaimer/Publisher’s Note: The statements, opinions and data contained in all publications are solely those of the individual author(s) and contributor(s) and not of MDPI and/or the editor(s). MDPI and/or the editor(s) disclaim responsibility for any injury to people or property resulting from any ideas, methods, instructions or products referred to in the content. |
© 2023 by the authors. Licensee MDPI, Basel, Switzerland. This article is an open access article distributed under the terms and conditions of the Creative Commons Attribution (CC BY) license (https://creativecommons.org/licenses/by/4.0/).


