1. Introduction
Water scarcity is a complex and difficult problem. Desalination uses a large amount of energy, and it is difficult to advocate for a technology that increases fossil fuel-based energy consumption. Remote coastal areas in the Middle East, Africa, and the Mediterranean and Caribbean islands are suffering from acute shortages of drinking water [
1,
2,
3]. It is anticipated that by 2025, more than about 60% of the world’s population will suffer from serious drinking water shortages [
4]. Conventional desalination techniques, such as multi-stage flash (MSF) desalination, vapor compression (VC), reverse osmosis (RO), membrane distillation (MD), and electrodialysis (ED), require significant thermal energy to function. As more places face water scarcity, desalination is considered as a possible answer. However, energy and financial requirements limit how widely that process can be used. We believe that solar energy is the logical response to these limitations and can power thermal and electrical desalination systems. Studies [
5,
6] have shown that solar desalination can be achieved, in particular, in areas where solar intensity is high and there is a lack of fresh drinking water. Therefore, this research was undertaken to study the impact of solar energy and nanofluids on the desalination process.
Nannaronea et al. [
7] presented a general model to simulate the multiple stage flash distillation (MSF) process. The model was implemented within the Camel-ProTM Process Simulator. Several validation tests were conducted to confirm that the model is an efficient tool for MSF plant design and prediction of the most important variables in the MSF process. Lumped parameter dynamic models were developed in Al-Fulaij’s Ph.D. thesis [
8] or using the MSF once through (MSF-OT) and the MSF brine circulation (MSF-BC) processes. The models were coded using the gPROMS modeling program. The model predictions for both MSF-OT and MSF-BC in steady state and dynamic conditions showed good agreement with data from existing MSF plants with an error less than 1.5%. The methodology proposed in [
9] provides a set of modular simulations of components that allow the creation of complex models used to optimize the full water desalination supply chain. The optimization scheme included mathematical programming (MP) models that were solved by an external MP solver for Saudi Arabia, which is considered the worldwide leader in desalinated water capacity.
Amer [
10] reported on a steady-state mathematical model of the multi-effect thermal vapor compression (ME-TVC) desalination system. The ME-TVC desalination system in this paper was developed using the Engineering Equations Solver (EES) to evaluate the model system performance. The model validity was examined against three commercial ME-TVC units and the end results were good. In addition, a MATLAB algorithm solution was developed and used to solve model equations, where a different number of effects were tested to maximize the gain ratio of the process. A computational field model for the flashing process in the evaporation zone inside a flashing chamber with nanofluid-based solar collectors was developed by the author of [
11] using two-phase volume of fluid (VOF) formulation. The model was then applied to investigate the effects of variations in the inlet brine flow rate and inlet brine temperature for both finite and infinite flashing process classifications. The predictions were analyzed to estimate MSF design factors, such as the non-equilibrium temperature difference and flashing efficiency.
An integrated system using a flashing desalination technique coupled with a nanofluid-based solar collector as a heat source was presented in [
12] to study both the effect of different operating modes and that of the variation of functioning parameters and weather conditions on freshwater production using nanofluids. The flashing unit was produced using a similar construction design technique of a commercial multi-stage flashing (MSF) plant. Another objective of the reported developed mathematical model was to calculate the productivity of the system under different operating conditions.
A mathematical model for a multi-stage flash (MSF) desalination system with brine recirculation (BR) configuration was developed and presented by the authors of [
13]. They described the heat source chosen for the BR-MSF as a nanofluid-based direct absorption solar collector (DASC), for which the numerical model was developed. Both systems, BR-MSF and DASC were coupled via a countercurrent flow heat exchanger. The overall performance of the combined system was determined in terms of gained output ratio, referred to as GOR. The conceptual design for a photovoltaic thermal (PV/T) solar panel has been developed and analyzed to control the inherent temperature increase of PV cells in order to increase electrical efficiency [
14,
15,
16,
17]. A hybrid solar panel was developed and presented by Yang et al. [
1] and Sami [
16,
17] to integrate photovoltaic (PV) cells onto a substrate through a functionally graded material (FGM) with water tubes cast inside, through which water serves as both heat sink and solar heat collector.
In addition to the above literature review, it is evident that very limited research work has been published on the use of nanofluids in the desalination process, as well as the use of multi-stage flashing (MSF) chamber process modeling and simulation of sea water brine. Thermal and membrane desalination studies have been focused on evaporation processes using steam. The novel concept for the MSF presented in this paper implements PV-thermal solar panels using a hot heat transfer fluid with nanofluids in the MSF process. The main objective of this paper was to present a mathematical and numerical modeling on the use of nanofluids and a PV-thermal solar system to power the multi-stage flashing chamber thermal process. The model proposed was established after the mass and energy conservation equations of the flashing process were integrated with the thermal and thermophysical properties of the vapor and nanofluids at different volume fractions as well as solar radiation levels. The nanofluids studied were Ai2O3, CuO, Fe3O4, and SiO2 at different volume fractions. The process of multi-stage flashing using PV-thermal solar panels and nanofluids was analyzed under different conditions of sea water (brine) salt concentration, brine flows, and temperatures, as well as nanofluid concentrations and solar radiation levels.
3. Nanofluid Heat Transfer Fluid
The different equations reported in [
16,
17,
18] were used to calculate the thermophysical properties of the nanofluids, such as the specific heat, thermal conductivity, viscosity and density using the law of mixtures. The thermophysical, thermodynamic and heat transfer properties of nanofluids are determined in terms of the volumetric concentration of the nano particles as per the following equation:
where α represents the thermophysical property of a particular nanofluid.
The nanofluid thermal and thermophysical properties, α
total, can be calculated as follows:
where Φ represents the nano particles volumetric concentration.
The thermal conductivity and thermal diffusivity and density of the nanofluids are related as follows [
16,
17,
18]:
where
Cp is the specific heat, α is the thermal diffusivity,
λ and
δ represent the thermal conductivity and density, respectively.
Readers interested in further details on the calculations of the nanofluids thermophysical and thermodynamic properties are advised to consult references [
16,
17,
18,
19,
20,
21,
22,
23,
24]. In particular, these references discussed the impact of the nanofluid concentrations on the thermophysical properties of the nanofluids used in this study. Moreover, the scope of this study is rather focused on the discussion of the MSF process using the PV-Thermal with nanofluids as heat transfer fluids than the thermophysical properties of the nanofluids, since they are discussed elsewhere: [
16,
17,
18,
19,
20,
21,
22,
23,
24].
Finally, the availability and irreversibility of the flashing process are calculated as:
where
Aq is the flow availability change under steady state condition per stage, and
Aq is the availability transfer due to
QJ, the heat transfer between the control volume and its surroundings.
Tamb and
TJ are the ambient temperature and the Flashing chamber temperature, respectively.
The availability destruction i.e., the irreversibility of the flashing process per stage can be determined as follows:
where
SJ represents the entropy of the flashing process at each stage.
5. Discussion and Analysis
The aforementioned system of Equations (1)–(16) was numerically solved using the finite-difference formulation for the desalination flashing process using the different nanofluids at different concentrations and water as the base heat transfer fluid. In the following sections, we present the predicted results under different inlet conditions, such as solar insolation, brine and heat transfer fluid flow rates from the PV-Thermal, heat transfer fluid temperatures for the various nanofluids, Ai2O3, CuO, SiO2 and Fe3O4 at different volumetric concentrations.
In particular, Equations (1)–(4) were solved to predict the dynamic total power generated, efficiencies of the PV solar panels. Moreover, the key important parameters of a hybrid system composed of a novel combined concept of a photovoltaic-thermal solar panel hybrid system were determined using Equations (5) through (16). As reported and discussed by Sami [
16,
17,
18], it is evident from the results presented on the dynamic PV-Thermal studies that the higher the solar radiations, the higher the thermal and hybrid efficiencies. It is also observed that the hybrid efficiency exhibits lower values than the thermal efficiency since the PV solar panel efficiency is significantly lower than the thermal efficiency.
Furthermore, the PV simulation study results presented in references [
16] through [
18] show that the higher the solar radiation, the faster the increase in the PV cell temperature. Consequently, they also show that the higher the solar radiation, the higher the PV power and PV amperage. It is imperative that the designer of the PV panel considers that the cell temperature is impacted by the solar radiation as well as the ambient conditions. Finally, it was found that the model prediction compared fairly with the PV data at different conditions.
Sami [
16,
17,
18,
22,
23] reported that nanofluids, such as CuO, Fe
3O
4 and SiO
2, have received significant attention in the literature when the PV-Thermal hybrid system is used. It is evident from the results presented in these references that the nanofluid CuO has the highest characteristic performance among the other nanofluids and water as the base heat transfer fluid circulating in the PV-Thermal solar collector system. This can obviously be attributed to the higher thermodynamic and thermophysical and heat transfer properties of the nanofluid CuO that contribute to outperformance over the other nanofluids. In addition, Sami [
16,
17,
18,
22,
23] reported that the PV-Thermal efficiency is enhanced with higher concentrations of this nanofluid at constant solar radiation.
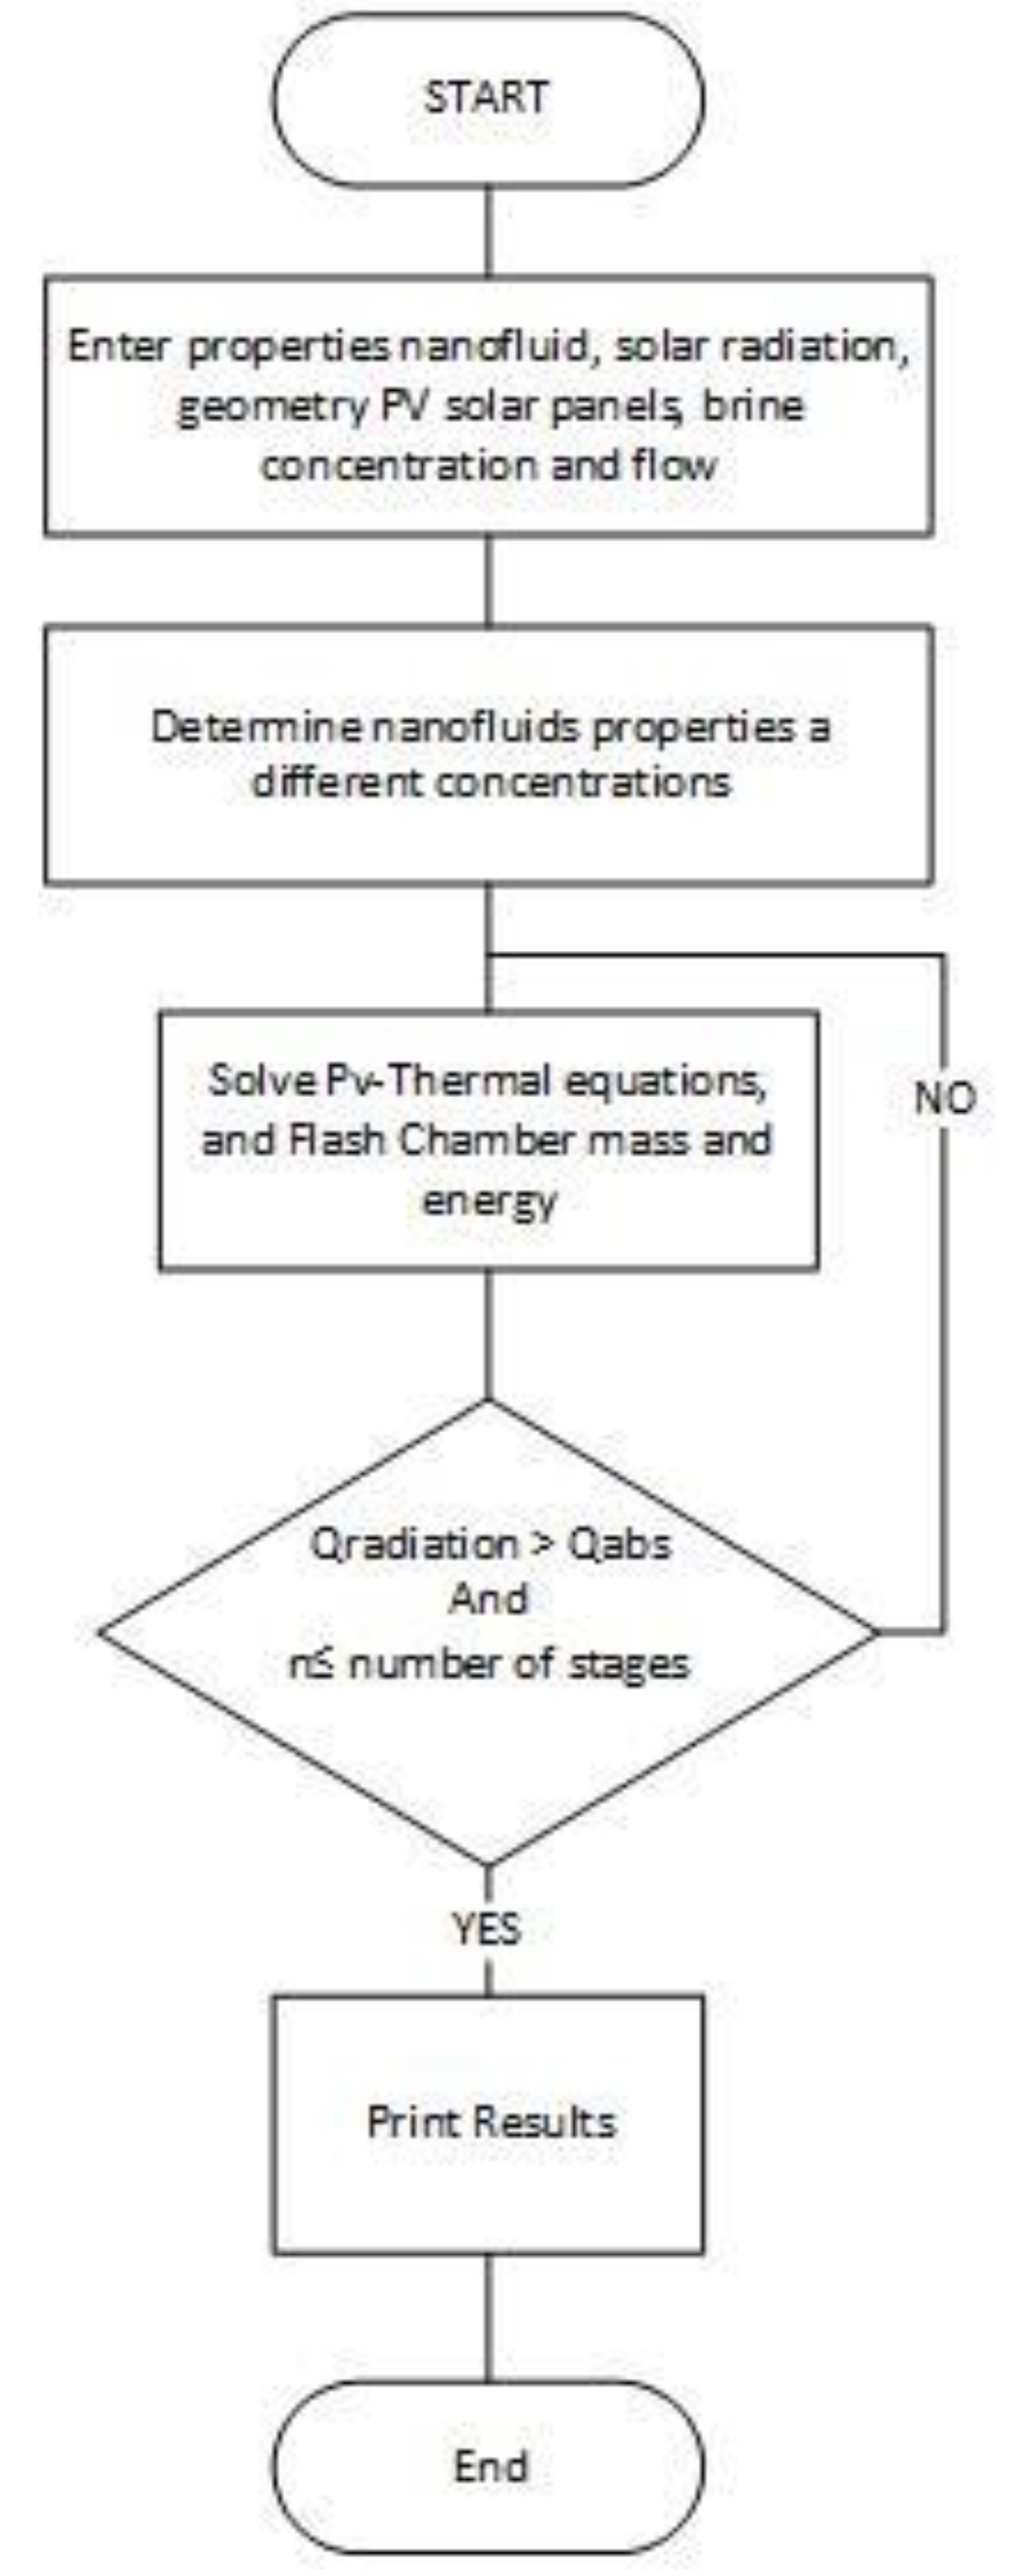
Moreover, it was assumed, in the numerical simulation using Equations (5)–(16), that 10 flashing chambers were used and the brine flow is heated up by the heat transfer fluid preheater, as shown in
Figure 1. A salt concentration of 5% was used in the brine flow and 60 F ambient temperature. In addition, 100 PV solar panels were also assumed with 300 watts per each PV solar panel. Solar radiations were taken as 500 w/m
2, 750 w/m
2, 1000 w/m
2 and finally, 1200 w/m
2.
Since nanofluid Ai
2O
3 is one of the most common nanofluids studied and reported in the literature,
Figure 3,
Figure 4,
Figure 5,
Figure 6,
Figure 7,
Figure 8,
Figure 9 and
Figure 10 were constructed to demonstrate the impact of using this nanofluid at concentrations of 10% and 20% on the behavior of the most important key parameters of the flashing process. In addition, the behavior of nanofluid Ai2O3 was compared to water as base fluid, at different solar radiations ranging between 500 to 1200 w/m
2, respectively. In addition, the important thermodynamic parameters, such as the irreversibility and availability, were calculated and shown in
Figure 9 and
Figure 10. Examining the results presented in
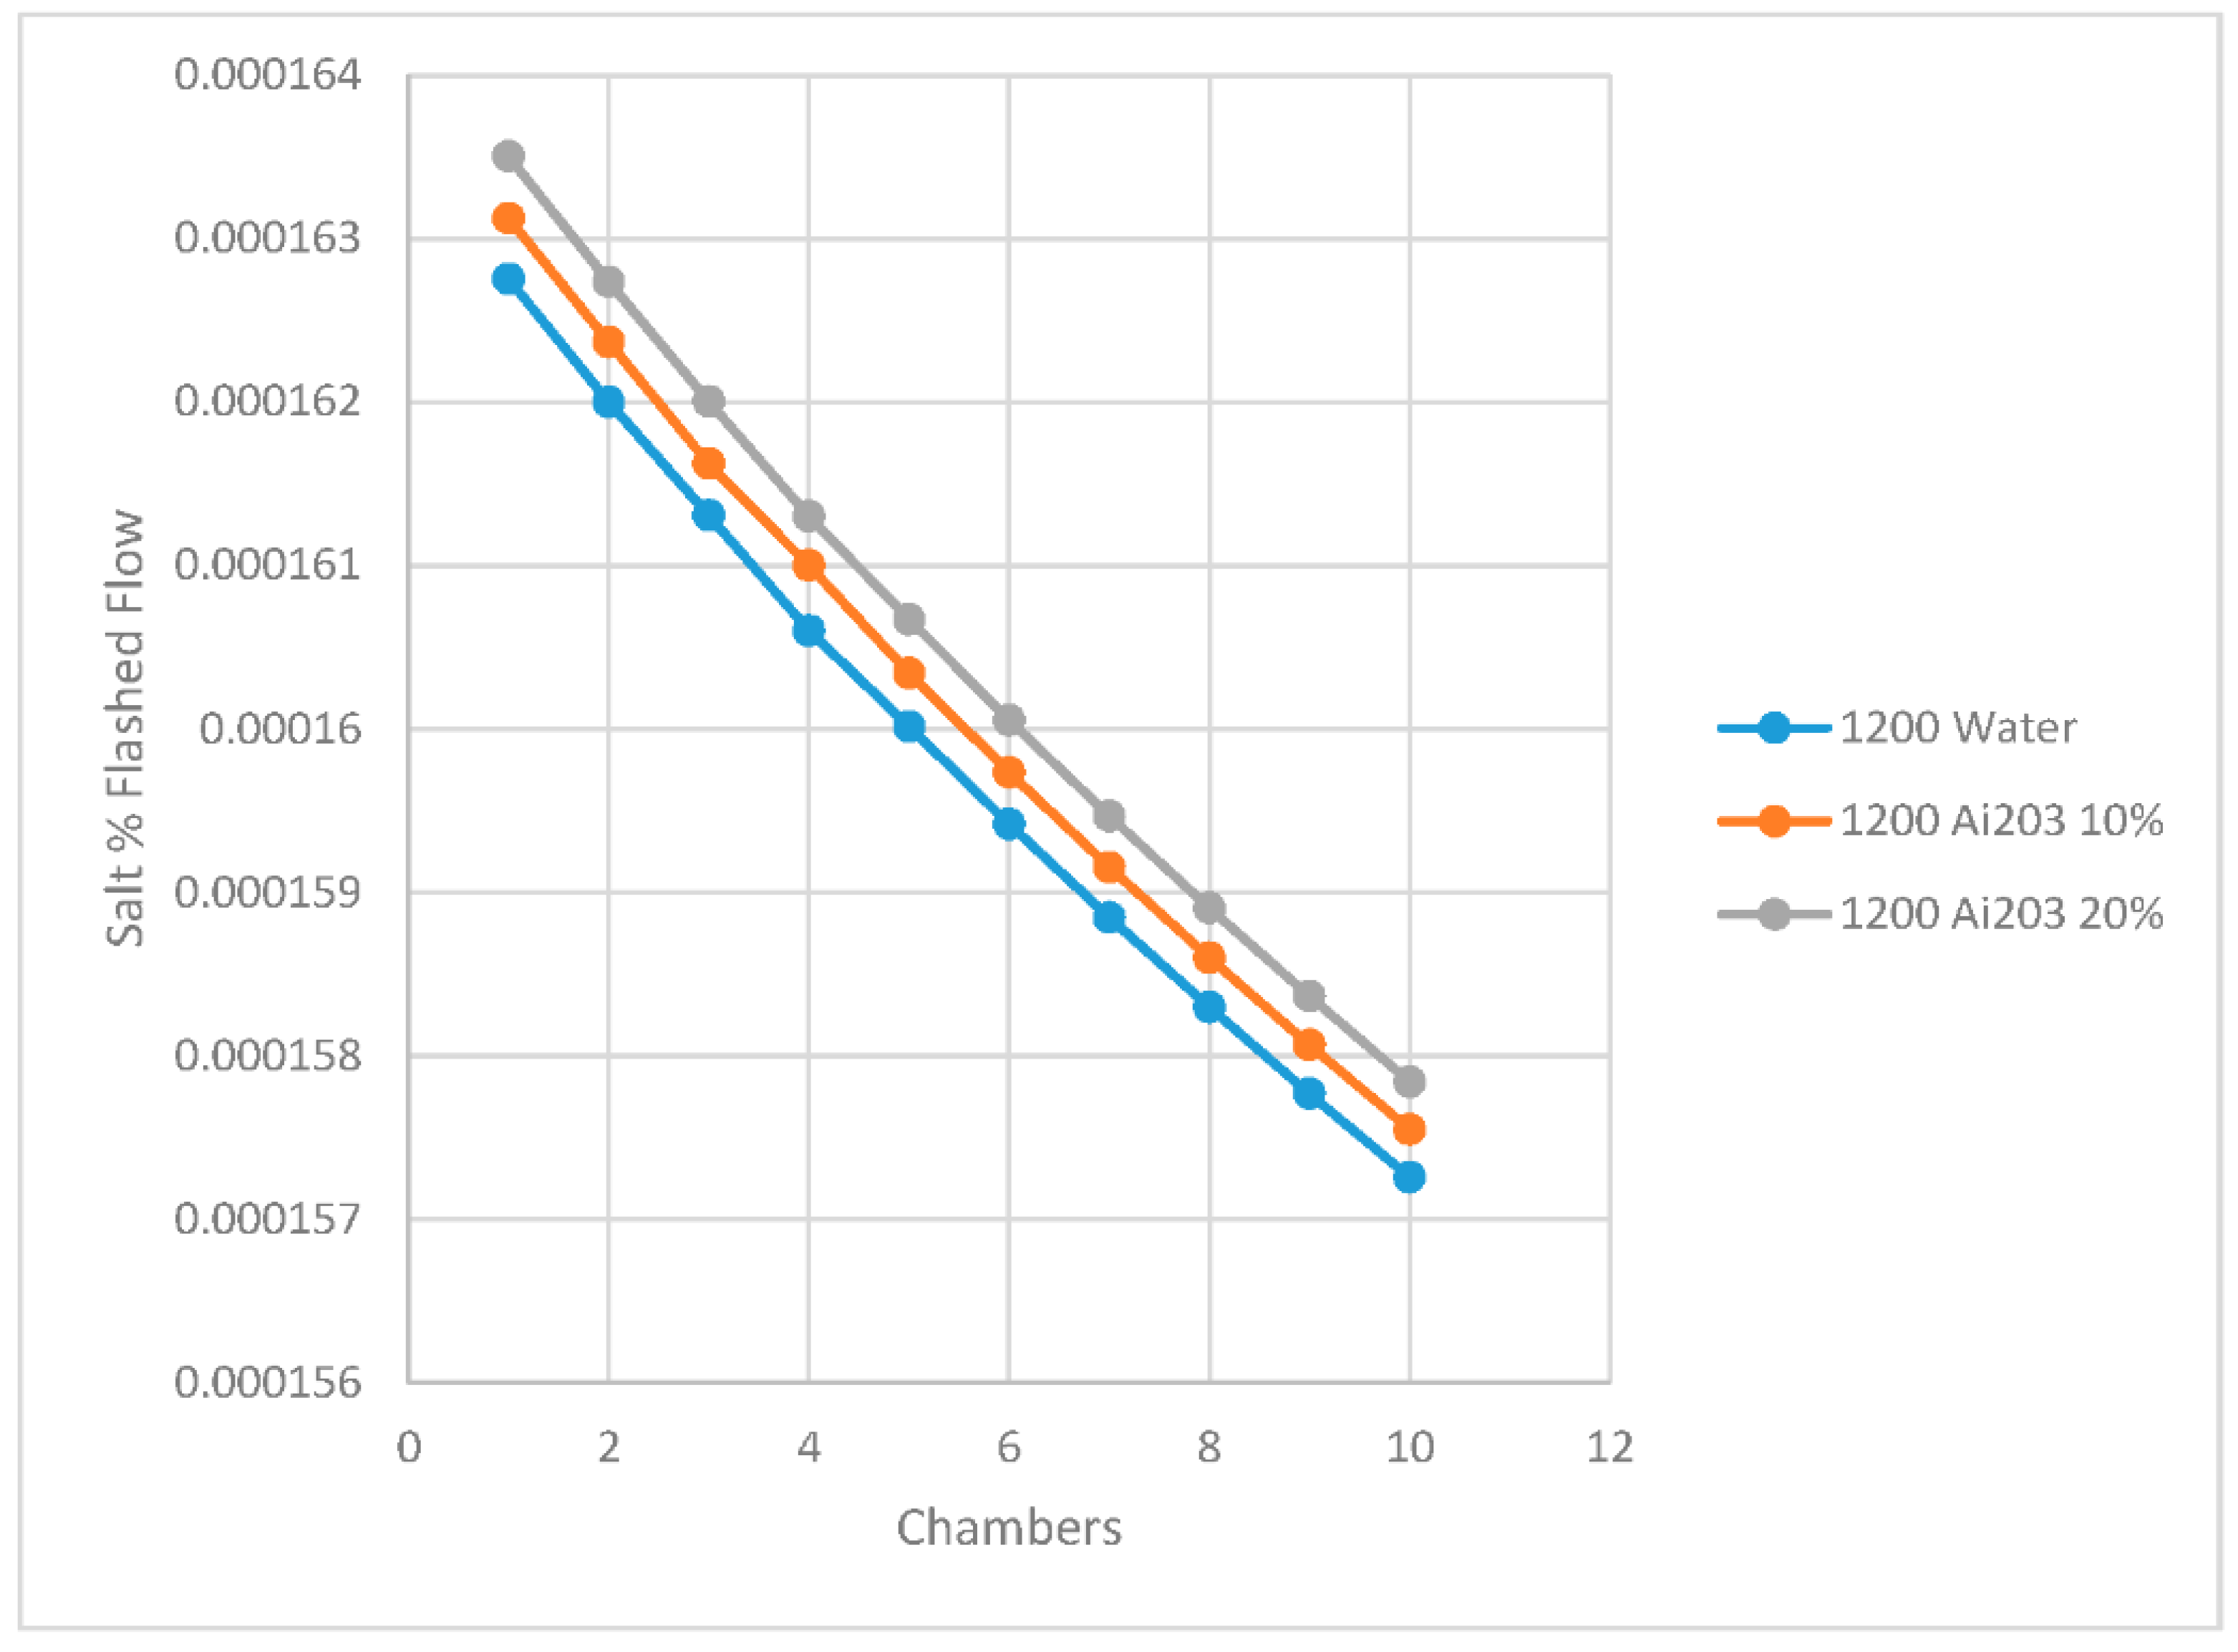
Figure 3 and
Figure 4 suggests that the higher the nanofluid concentration as a heat transfer fluid, the lower the salt % in the flashed flow leaving the set of the flashing chambers compared to water as the base heat transfer fluid used in the brine preheater. On the other hand, it can also be seen from the figures that the higher the solar radiation, the lower the salt % in the flashed flow. This can be attributed to the fact that higher solar radiation results in higher temperature of the heat transfer fluid and consequently, the brine flow in the preheater entering the flashing chambers. In addition, it was found that the higher the heat transfer fluid temperatures, the higher the brine flow temperatures and the higher the amount of the distilled water evaporated or flashed. It can also be noticed from the results that the salt % in brine was increased progressively in the flashing chambers until reaching its maximum value at the final chamber.
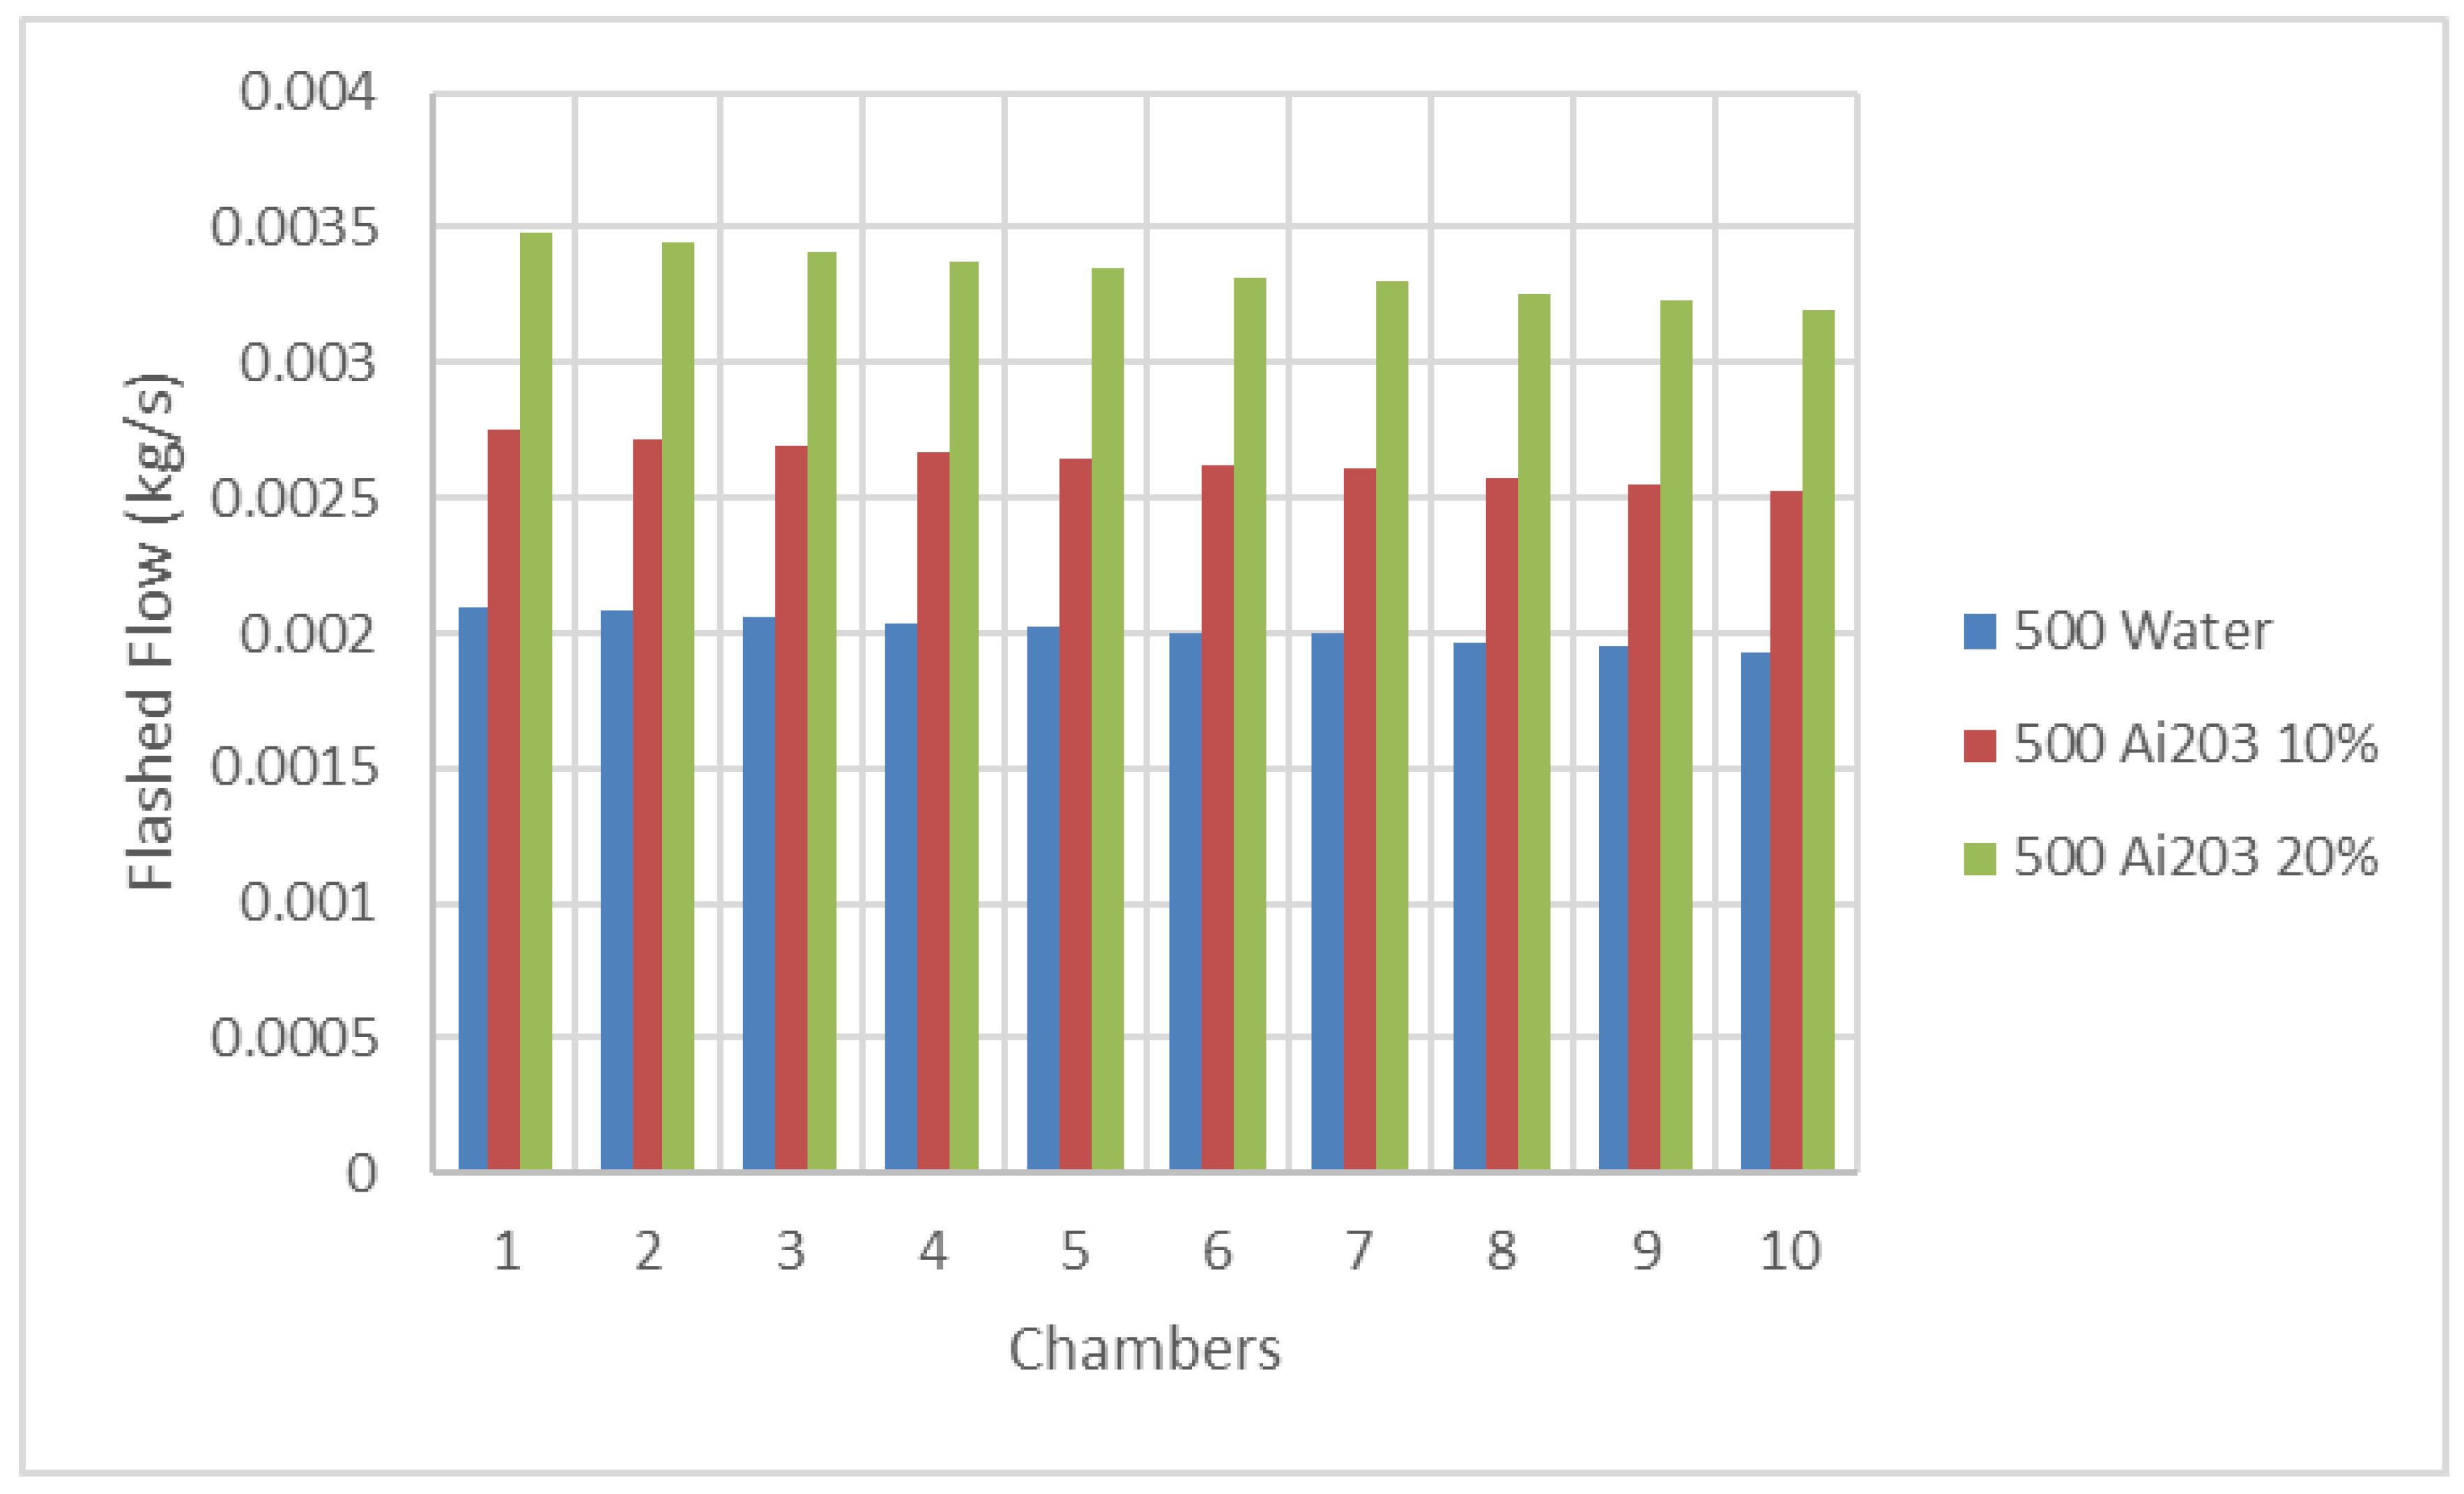
Figure 7 and
Figure 8 display the changes in the flashed flow in each flashing chamber, at different solar radiations, where it can be seen that the flashed flow was reduced progressively and reached its lowest value at the last flashing chamber. The amount of the produced distillate decreased along the different stages and consequently, the flash temperature and pressure profiles decreased; this is due to the increase of the heat of vaporization at lower saturation temperatures and therefore, a lower amount of vapor was extracted from brine. In fact, the data in these figures show that the higher the solar radiation, the higher the temperature; this caused the distillation rate to rise, since a larger amount of vapor can be extracted from saltwater. The results also show that the higher the solar radiation, the higher the flashed flow per chamber. In addition, these results also demonstrated that the higher the nanofluid Ai
2O
3 concentration, the higher the flashed flow produced during the flashing process compared to water as base heat transfer fluid.
In thermodynamics, changes in the state or process of a system cannot be restored to its initial state by changes in the properties of the system without expenditure of energy [
21]. An irreversible process increases the entropy of the system in question. The second law of thermodynamics can be used to determine the irreversibility of a process as per Equation (16). In the thermodynamic process, the energy is lost to the surroundings in the form of irreversible energy. However, the remaining amount of energy is defined as the available energy in the process [
21]. This thermodynamic principal was applied in the current study of the flashing chamber process, as expressed in Equations (15) and (16) to assess the lost and available energy in the process under question. In particular,
Figure 9 and
Figure 10 were constructed to demonstrate the variation of irreversibility and the availability at a solar radiation of 1200 w/m
2 during the flashing process at each stage. The results displayed in these figures clearly show that the irreversibility was reduced by using nanofluid Ai
2O
3 at a higher concentration compared to water as base heat transfer fluid. Furthermore, the higher the concentration of Ai
2O
3, the higher the availability observed at the last flashing chamber. However, the availability was progressively reduced toward the last flashing chamber.
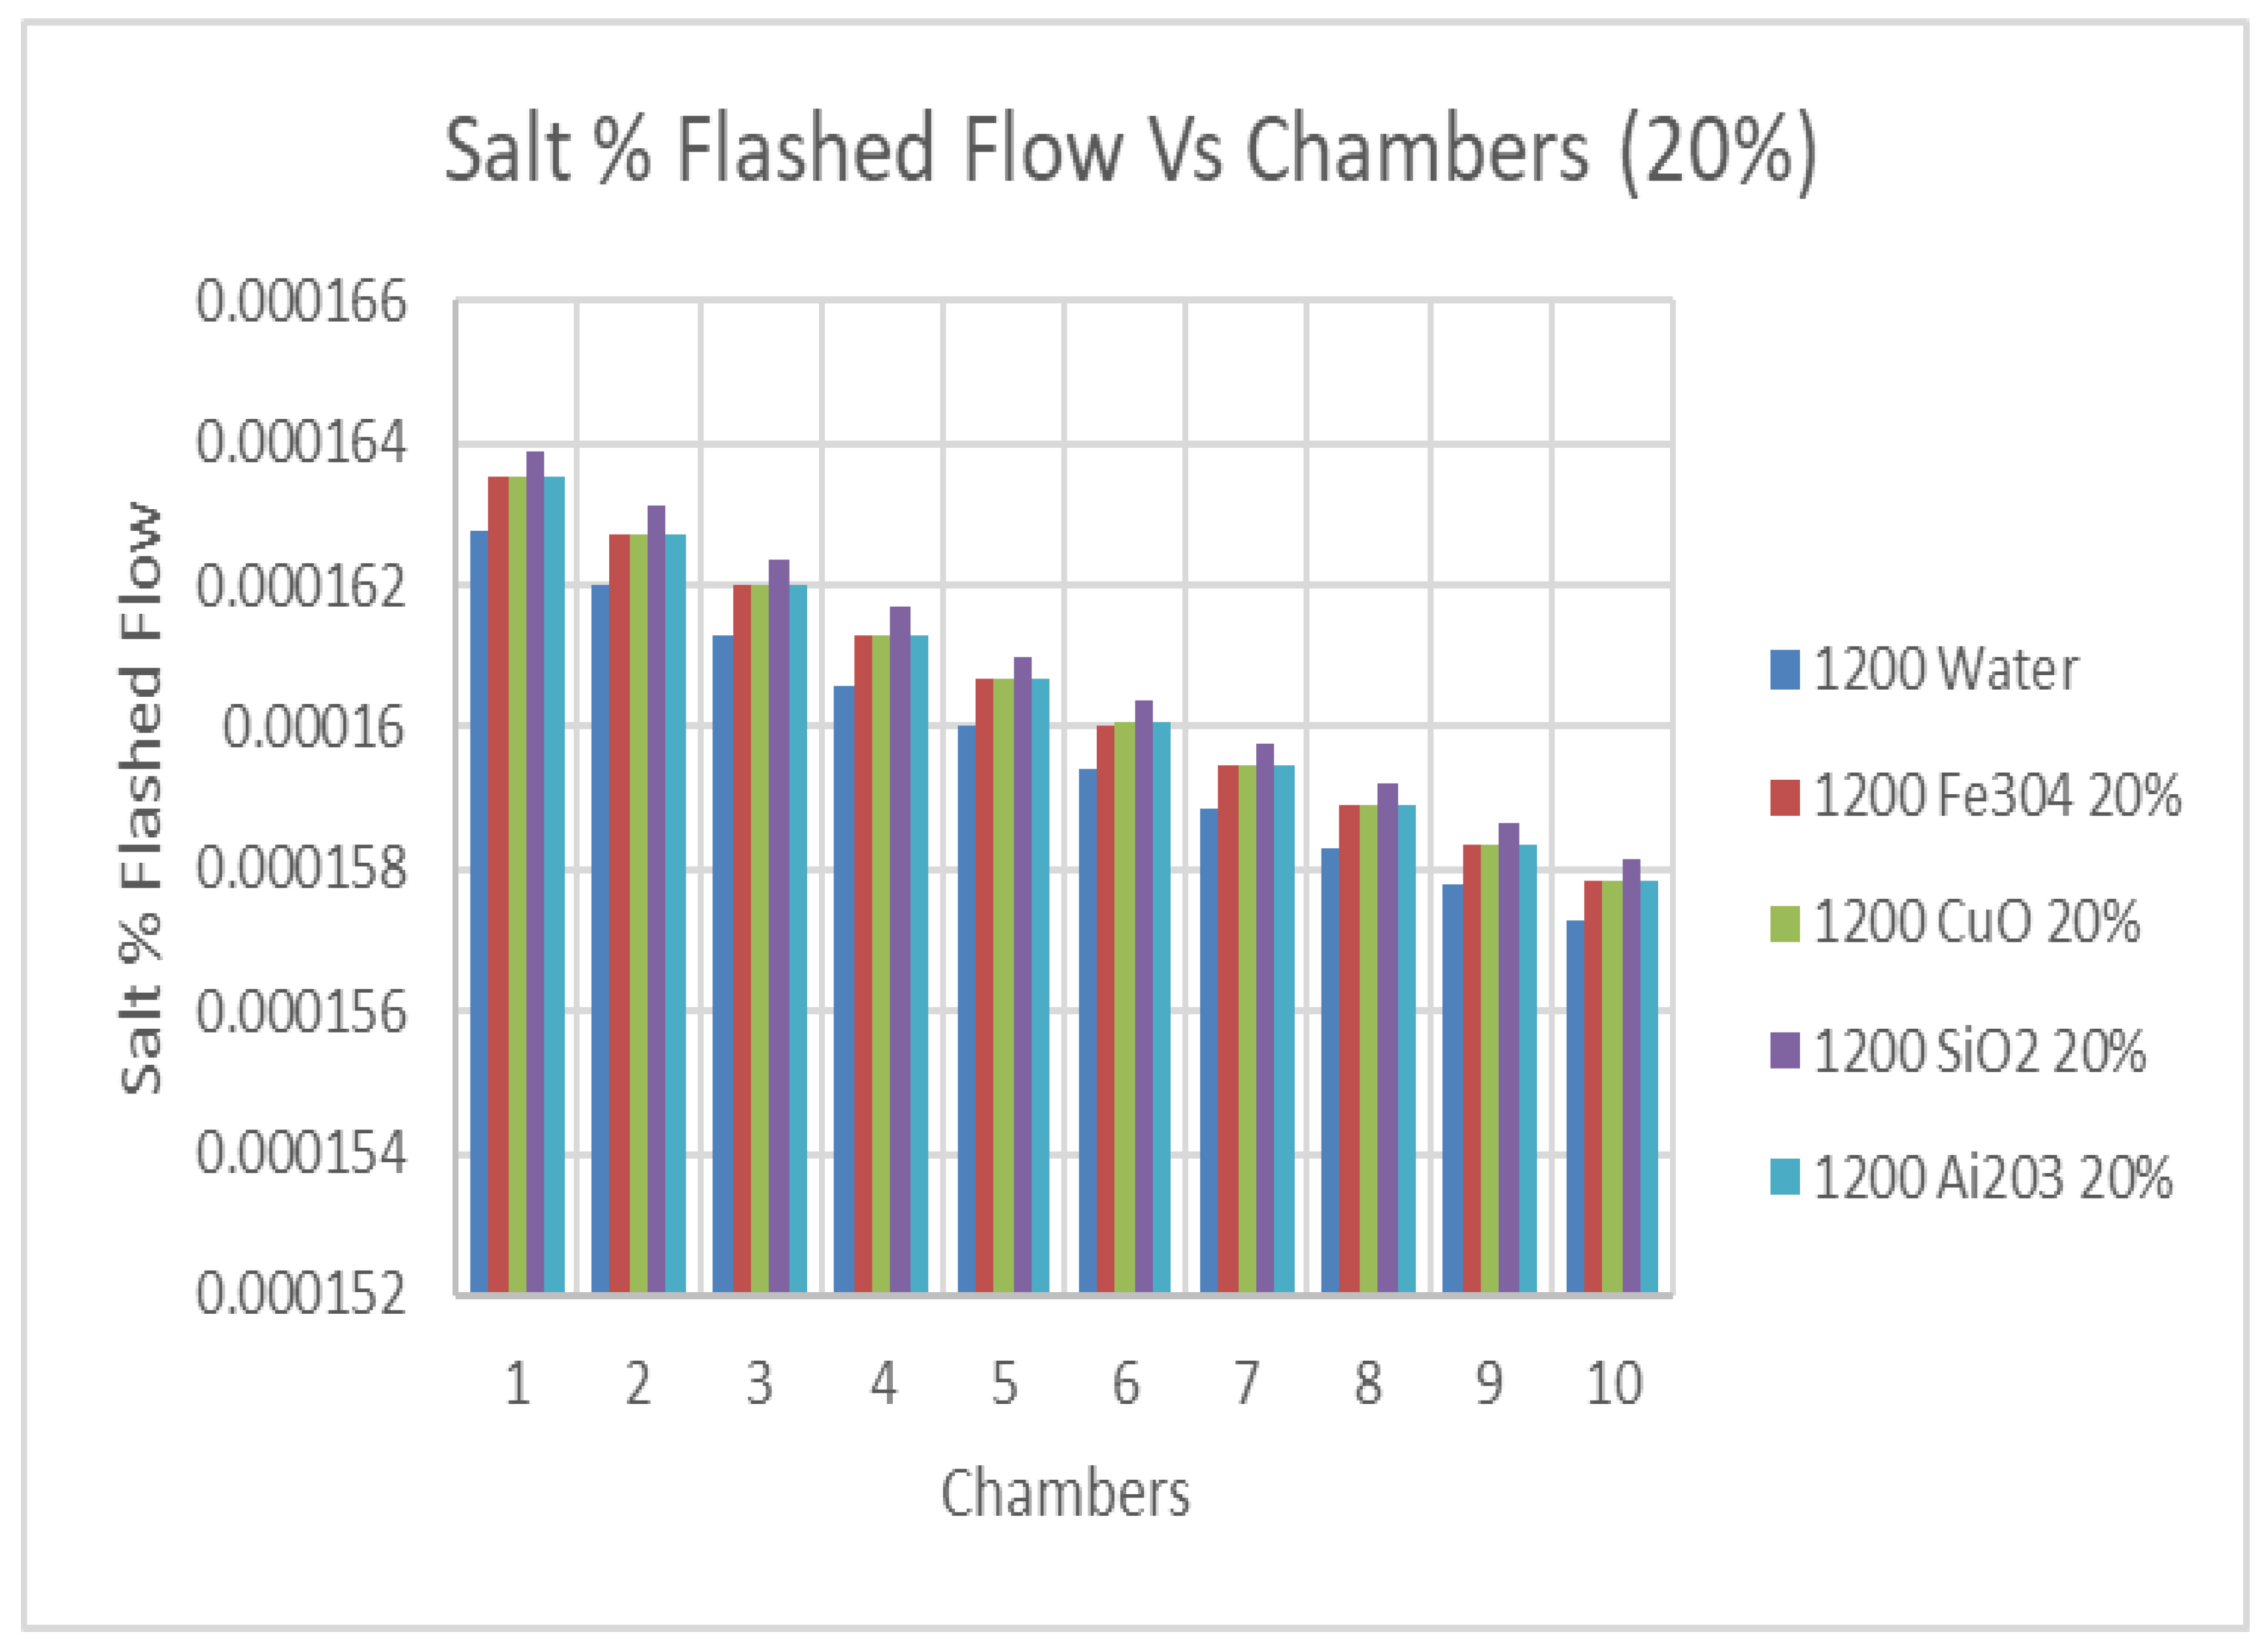
Furthermore,
Figure 11 and
Figure 12 were constructed to demonstrate the benefits of using a high concentration of nanofluids Ai
2O
3, CuO, SiO
2 and Fe
3O
4 on the values of the salt % in the flashed flow exiting at each flashing chamber. It is quite evident from the data presented in these figures that the salt % was reduced at the last flashing chamber with the increase of the concentration of nanofluids. In particular, nanofluid SiO
2 showed the highest reduction of the salt % in the flashed flow exiting the last chamber.
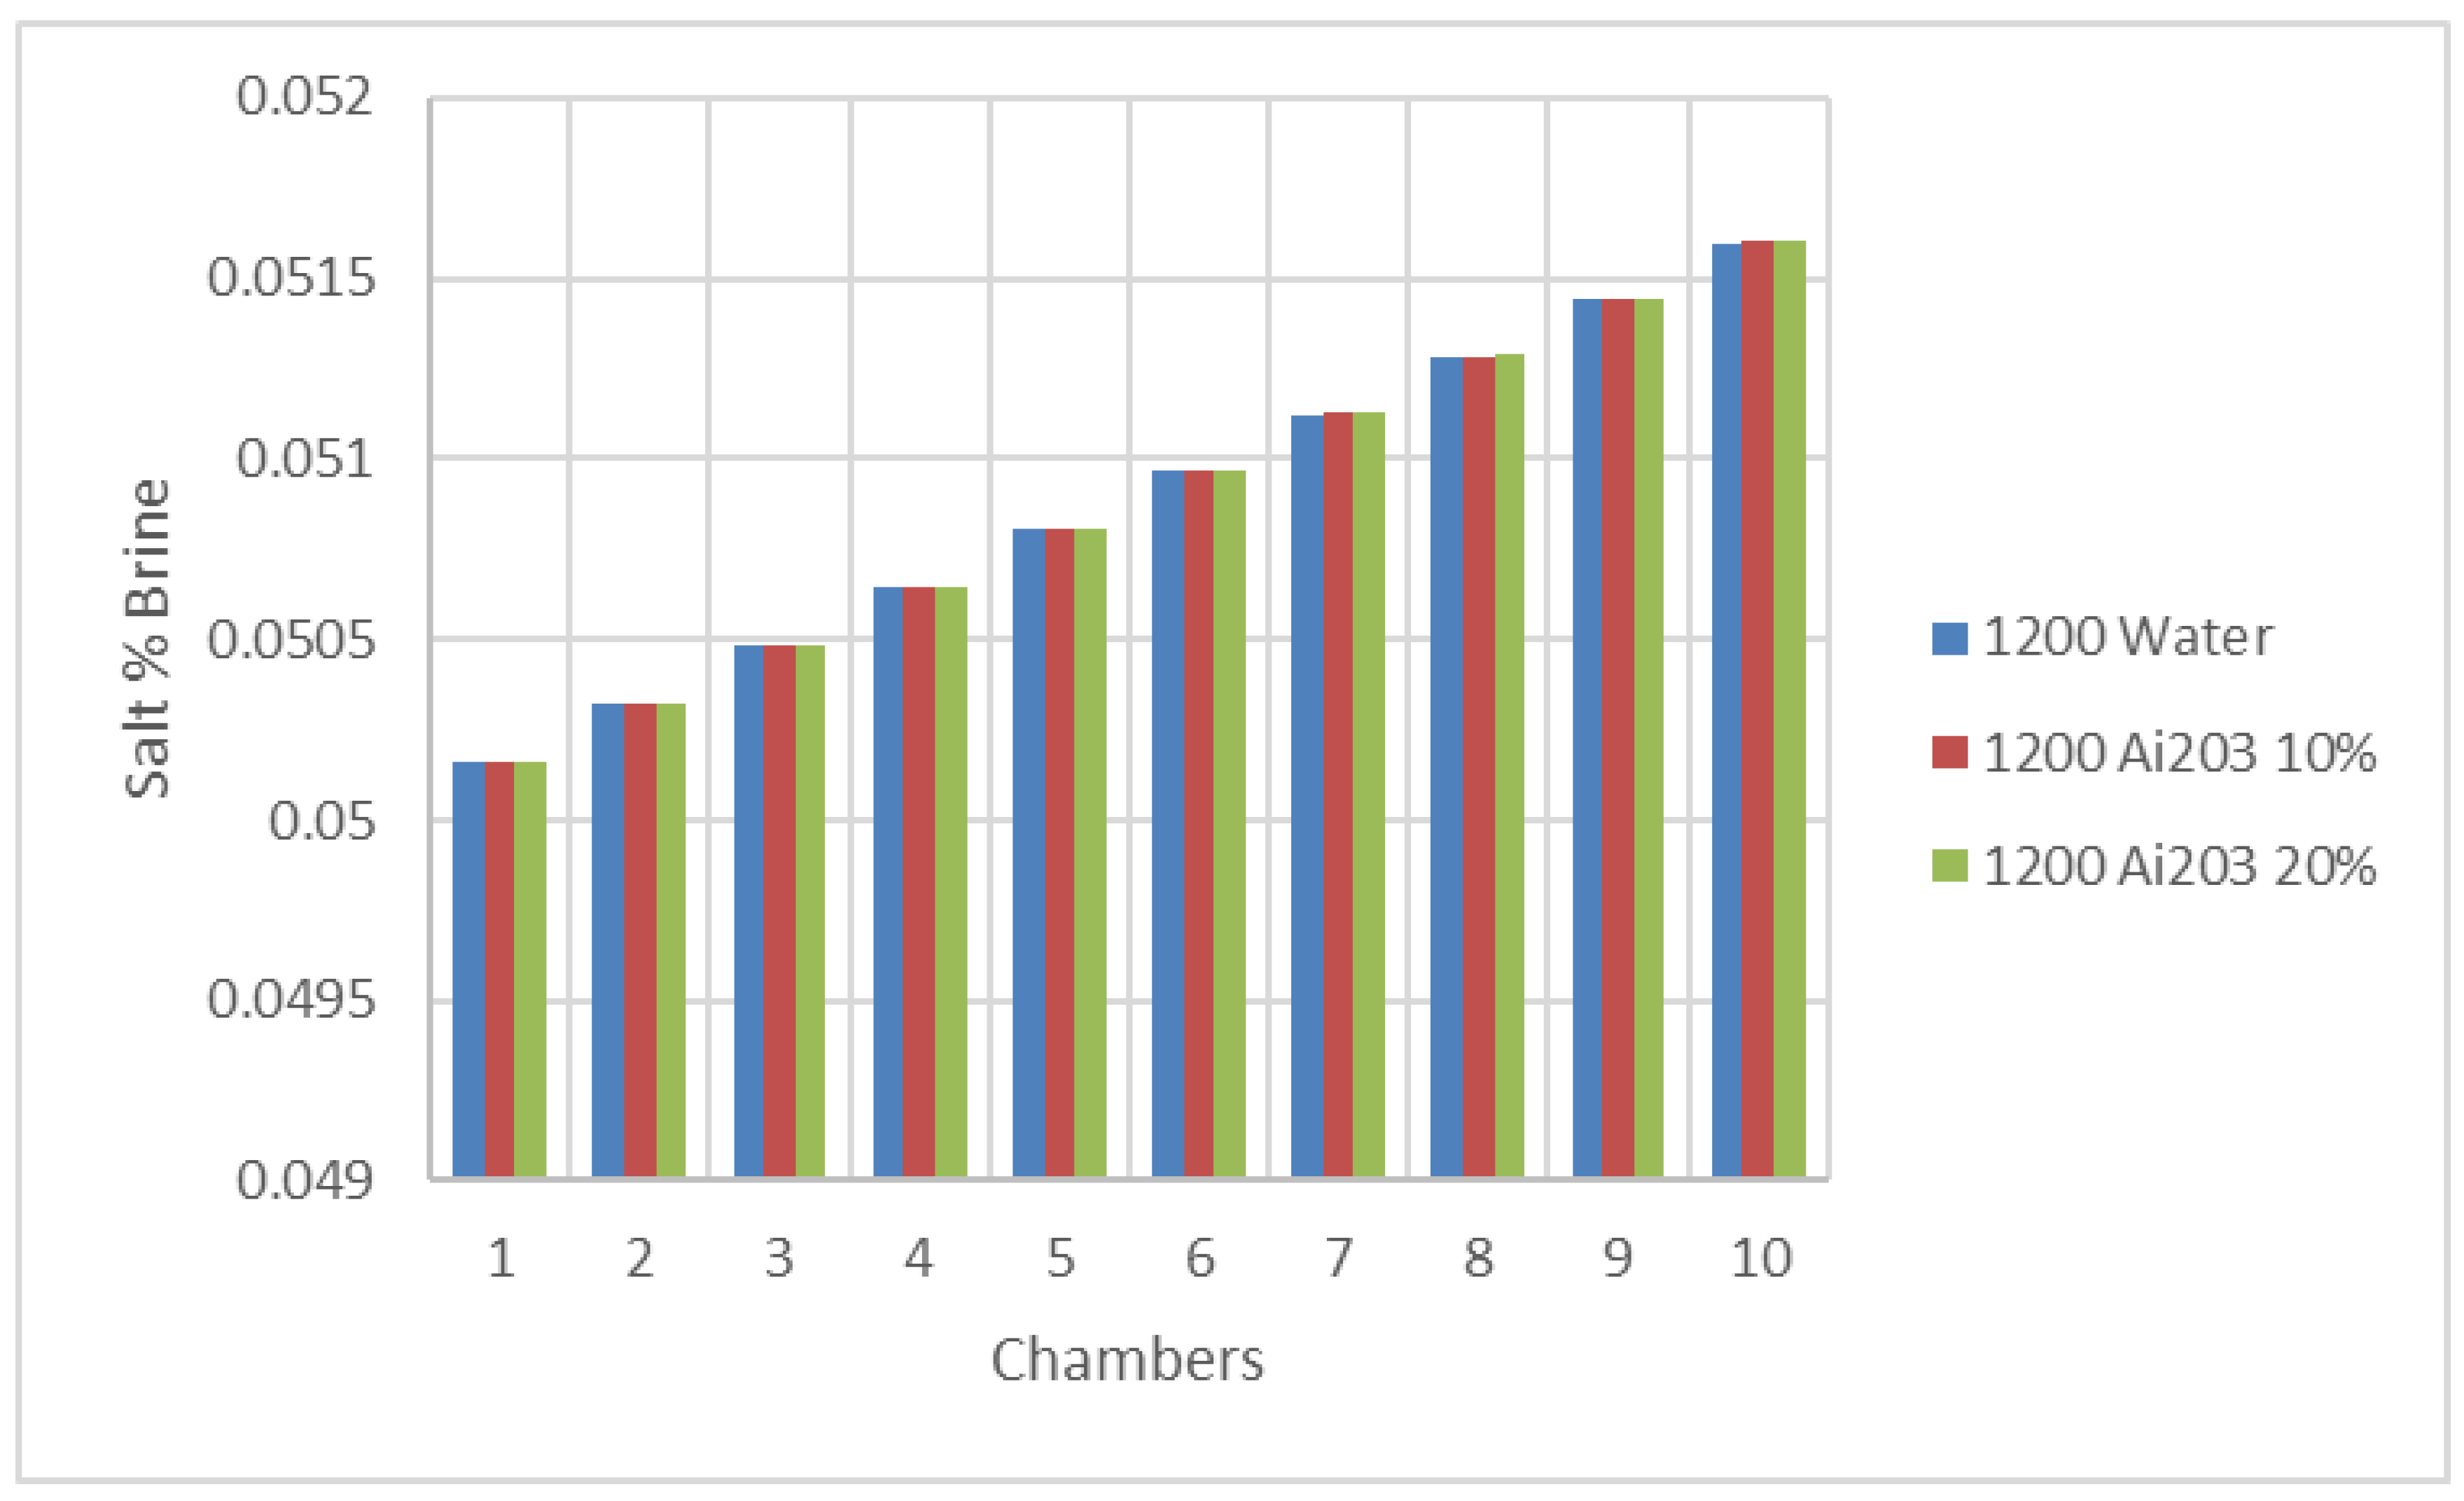
Figure 13 and
Figure 14 show that the salt percentage in the brine flow at 1200 w/m
2 was increased progressively across the chambers with the use of the nanofluids; however, the increase of the percentage of salt in the brine flow was slightly impacted by the concentration of the nanofluids. In addition, it appears from the results plotted in these figures that the salt percentage in the brine flow was independent of the type of nanofluids within the water as the base fluid.
On the other hand,
Figure 15 and
Figure 16 display the development of the flashed flow profile at the different flashing chambers. In general, the data in these figures show that the flashed flow was progressively reduced until reaching the lowest value at the last chamber. This is due to the increase of the heat of vaporization at lower saturation temperatures and therefore, less amount of vapor is extracted from brine. As expected, the data show that the higher the concentration of the nanofluid, the higher the amount of flashed flow produced. Further analysis of the data observed clearly demonstrates that the use of the nanofluid Ai
2O
3 produced the highest amount of flashed flow during this process.
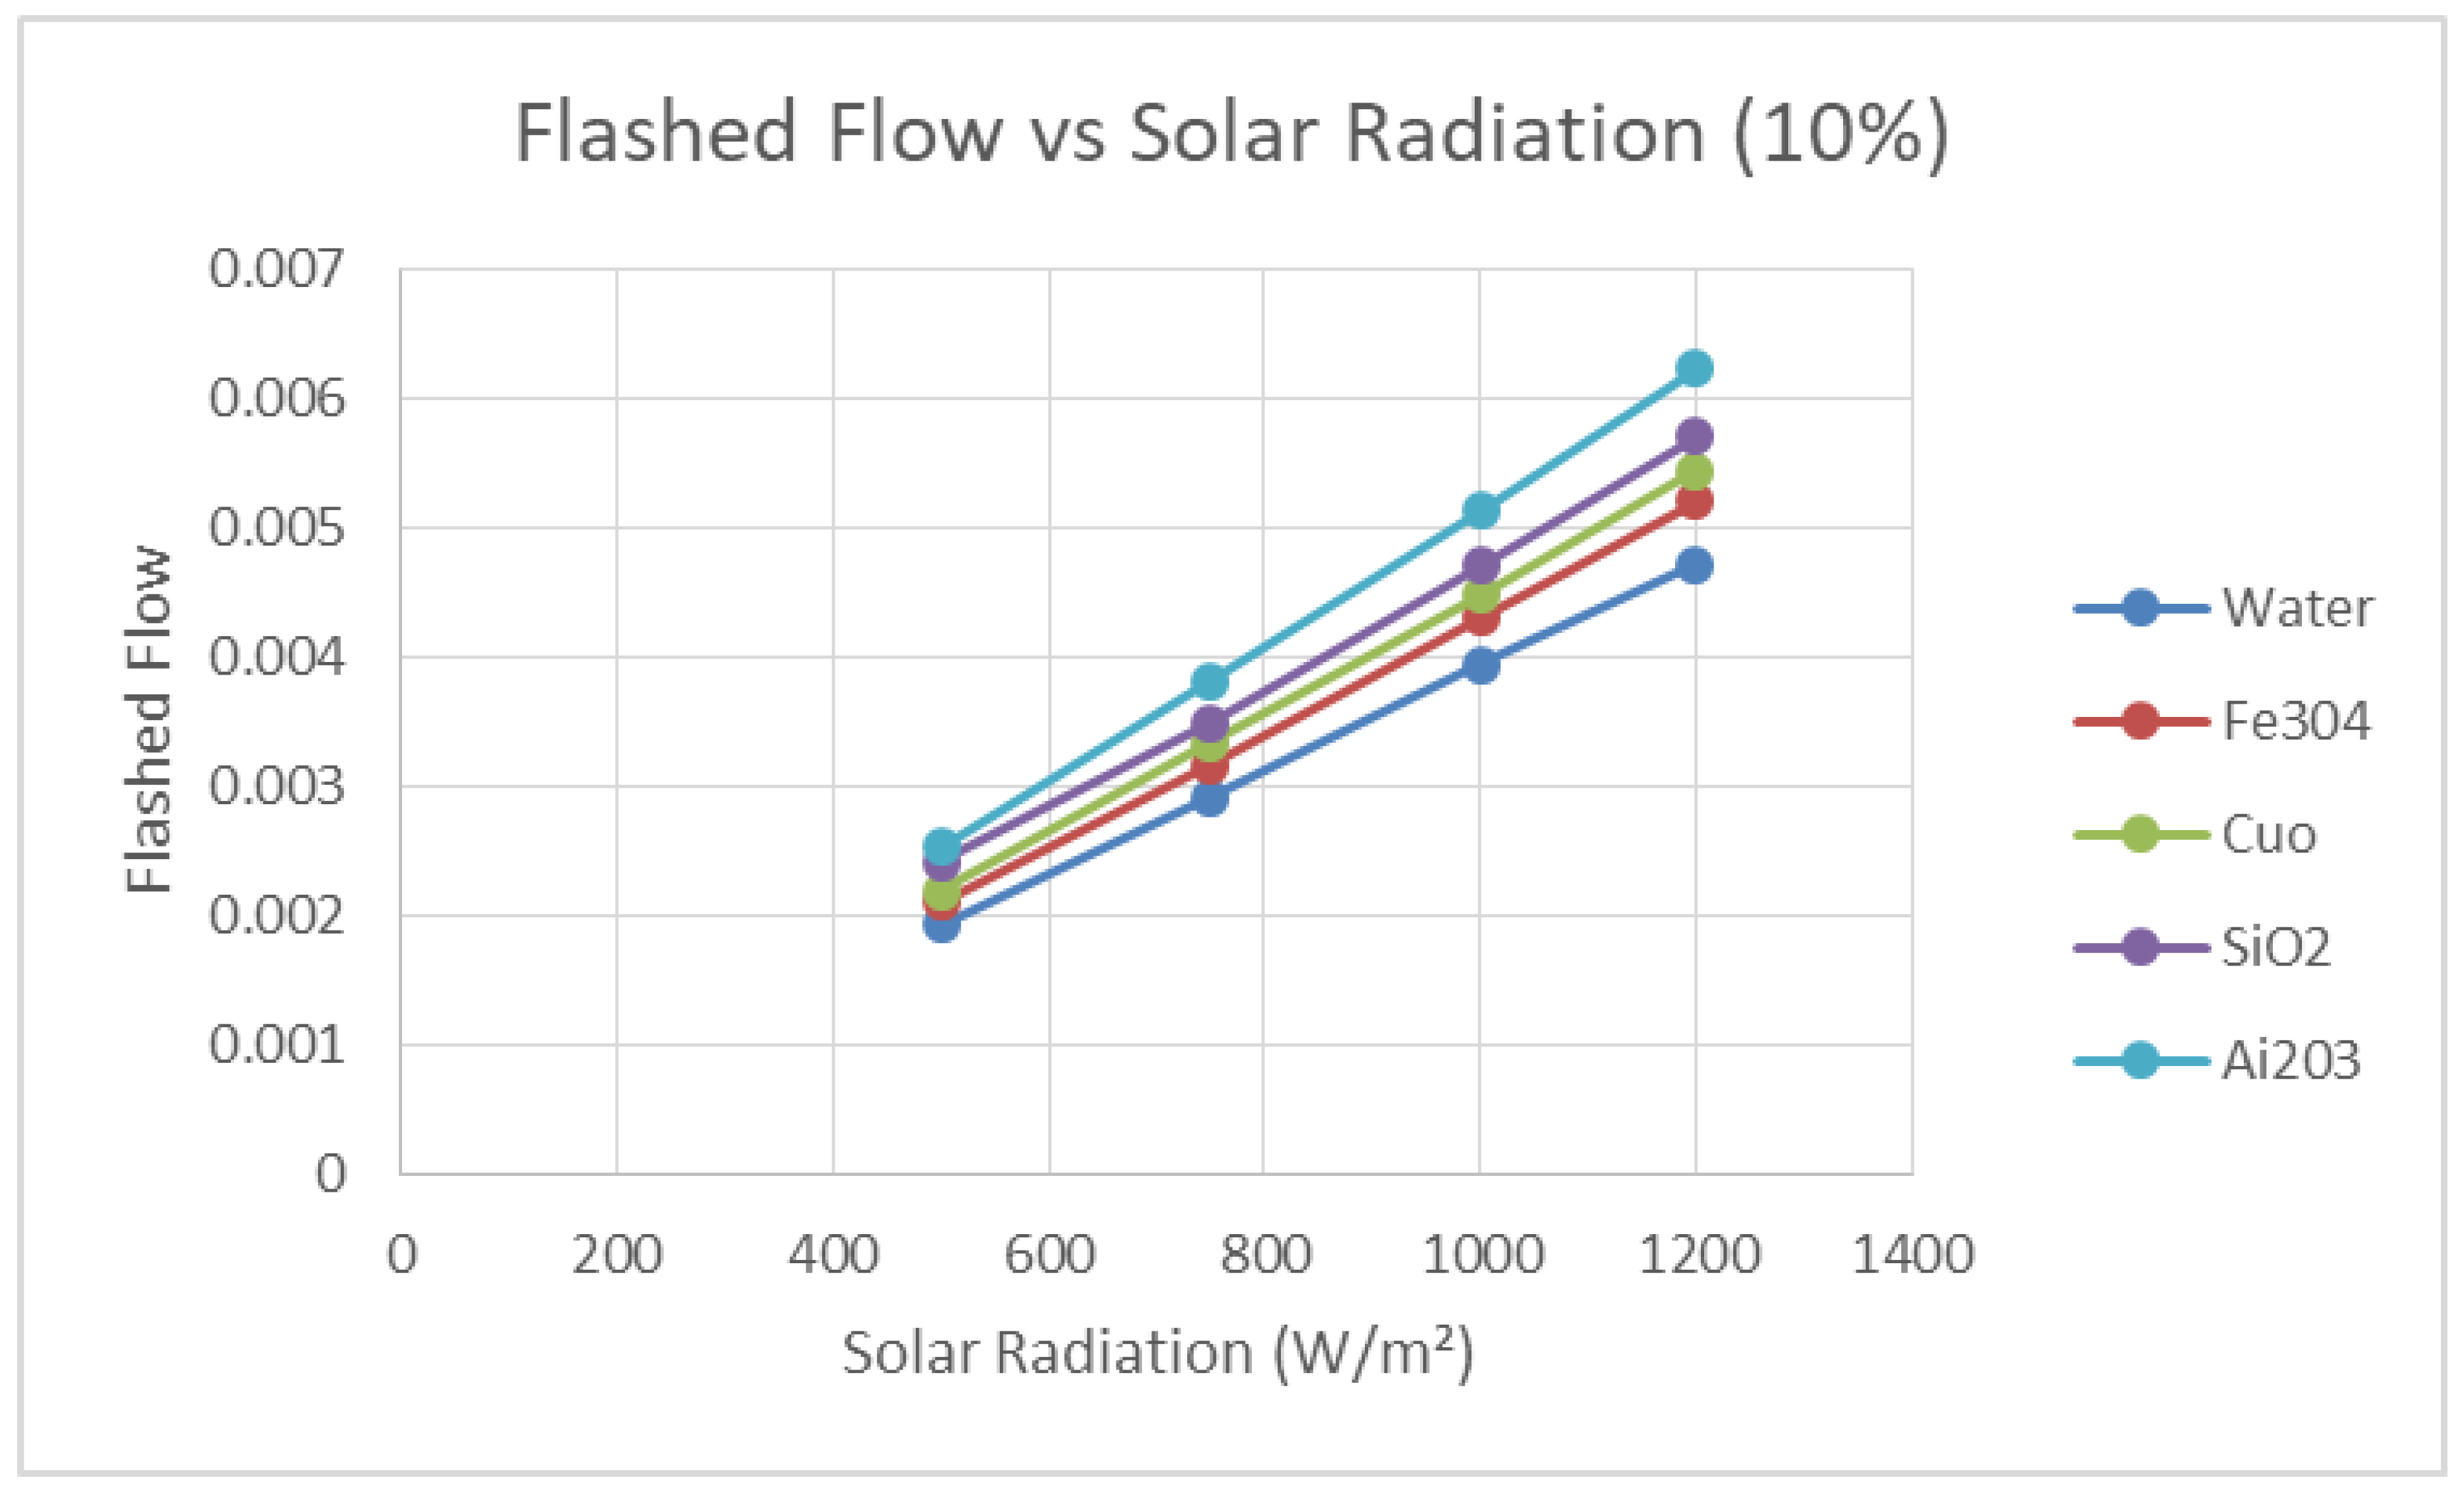
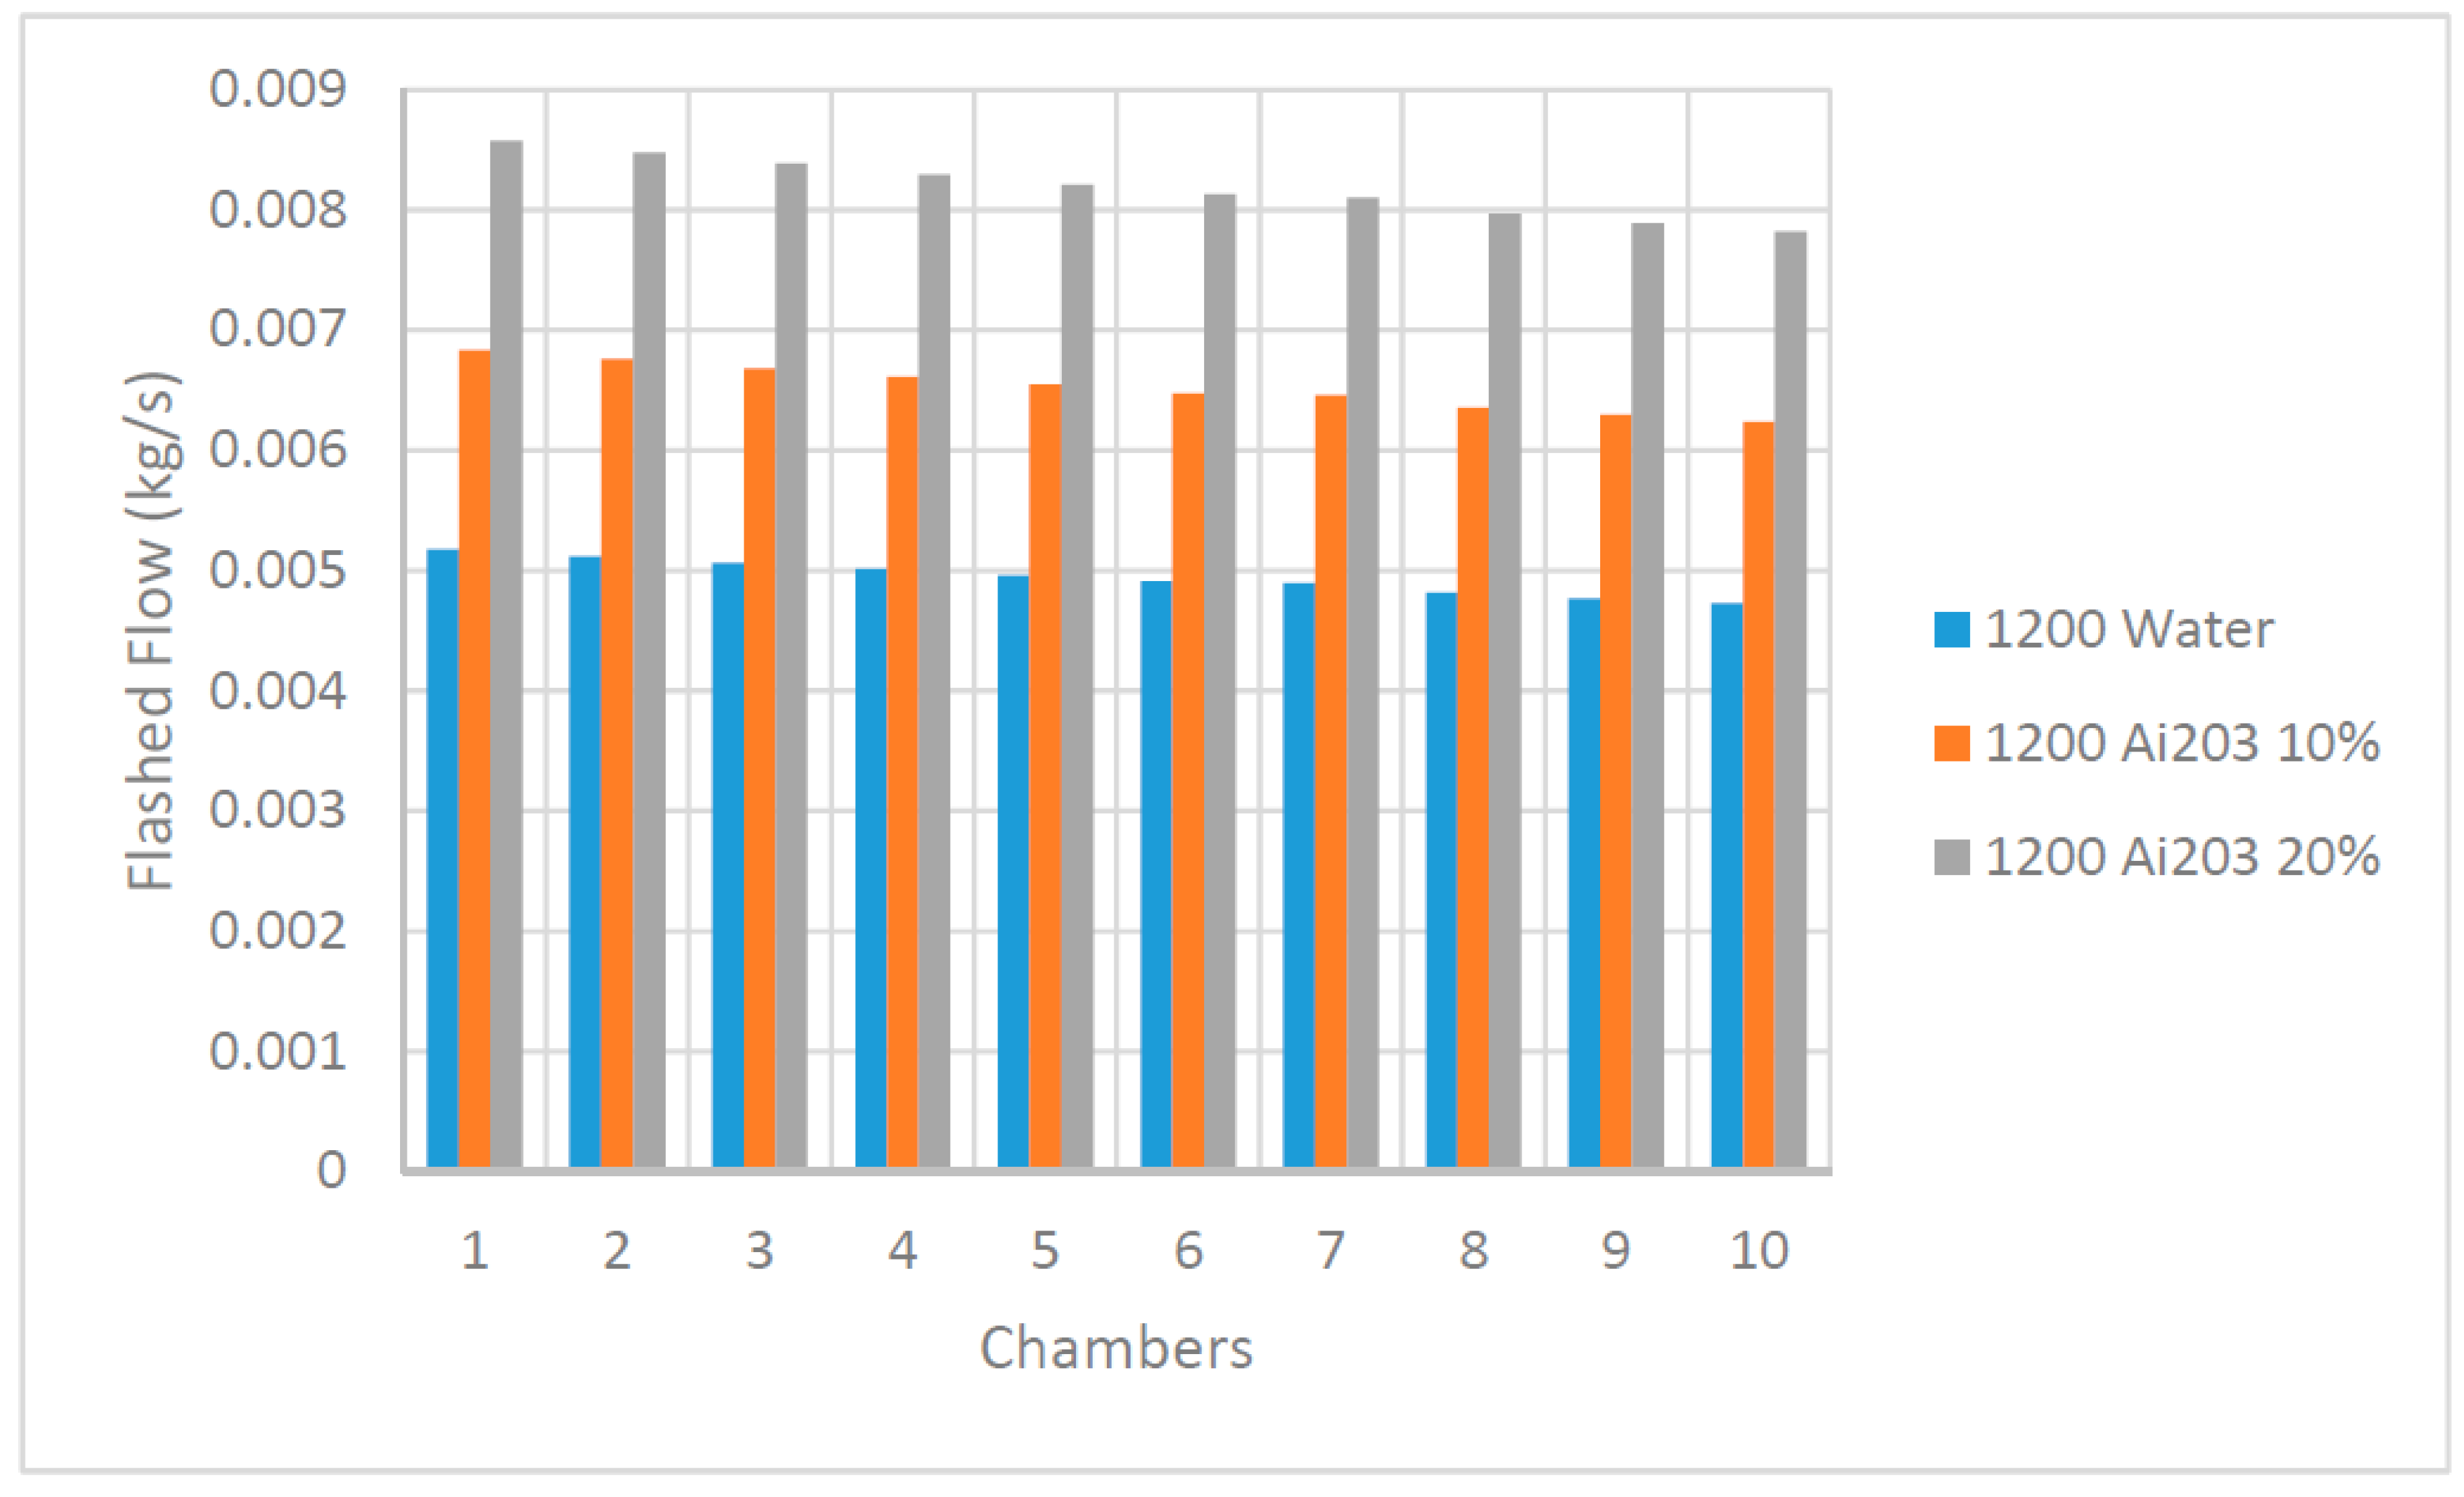
In order to study the influence of the solar radiation on the flashed flow,
Figure 17 and
Figure 18 are presented. There is clear evidence that the higher the solar radiation, the higher the flashed flow produced. This is clearly demonstrated at both concentrations of the nanofluids in the figures. Moreover, these figures show that nanofluid Ai
2O
3 produced the highest flashed flow among the nanofluids under investigation and water as the base heat transfer fluid. This observation is significant since using the nanofluid Ai
2O
3 can enhance the production of flashed flow three to four times over the water as the base fluid.
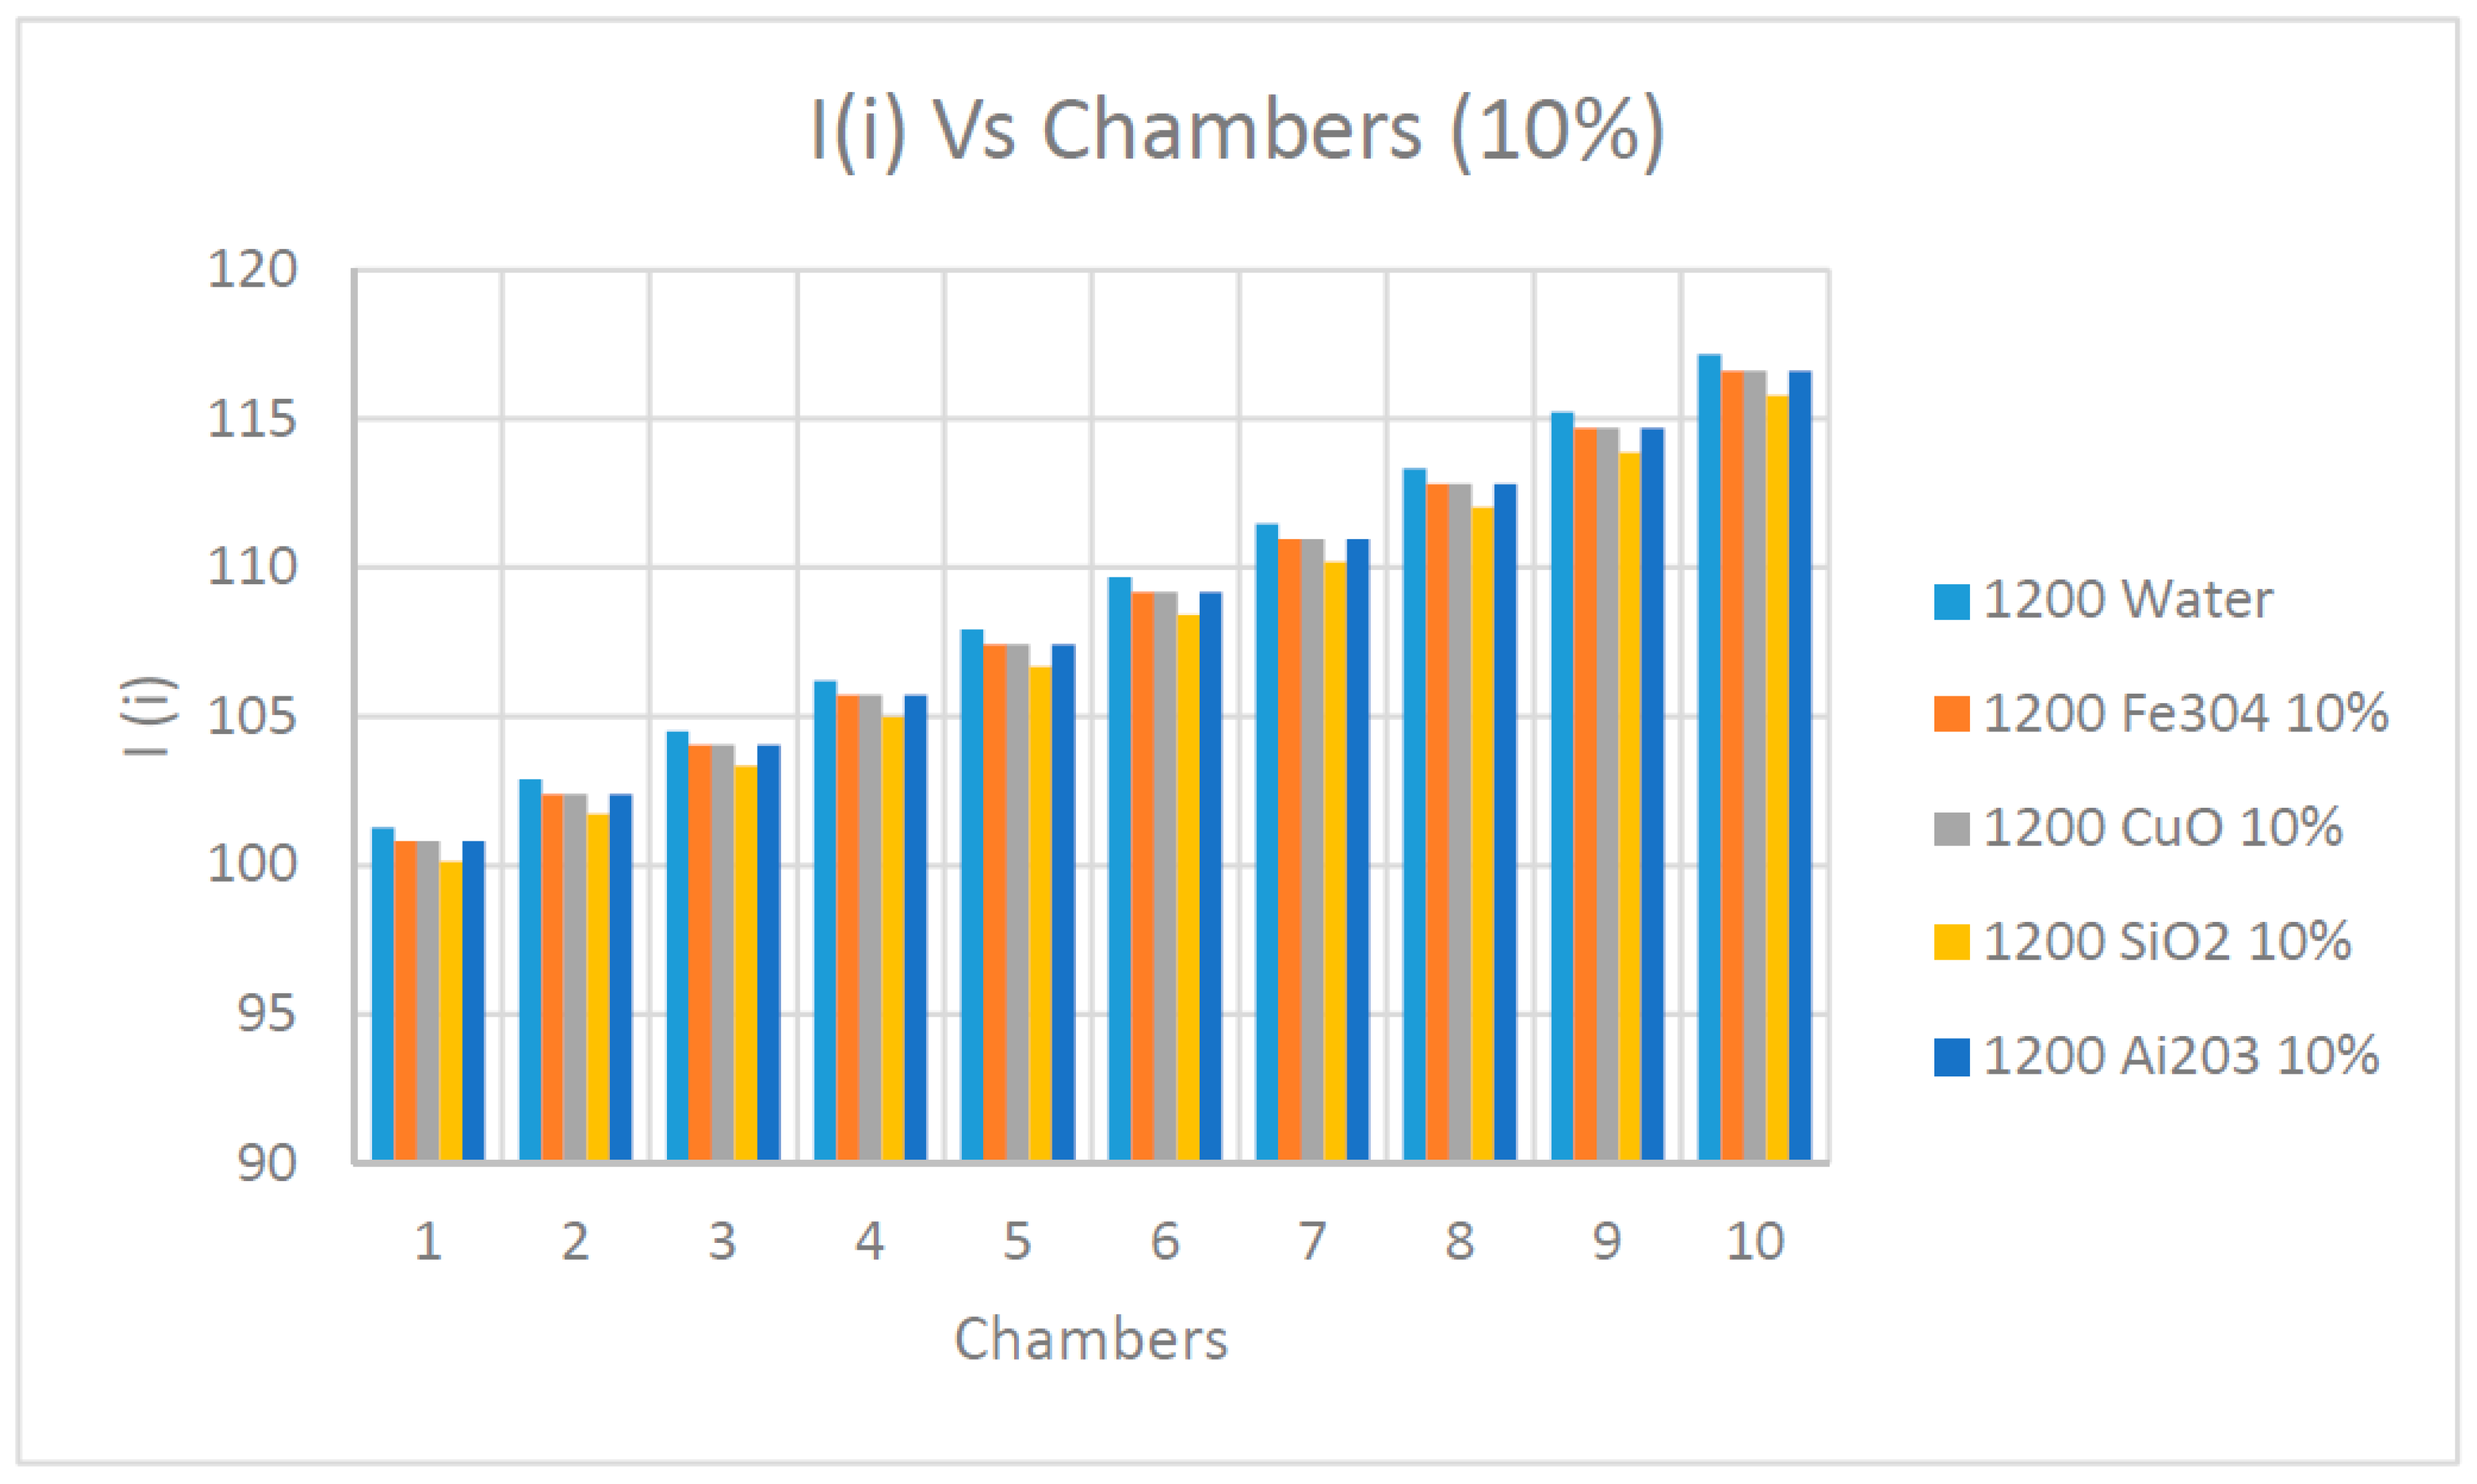
Figure 19,
Figure 20,
Figure 21 and
Figure 22 explain the impact of the increase of the concentrations of nanofluids on the irreversibility and availability of the desalination flashing process, chamber by chamber at 1200 w/m
2 solar radiation. Analyzing the results presented in these figures clearly shows that the irreversibility calculated by Equation (16) was significantly influenced by the type of nanofluids used compared to the base water as the heat transfer fluid. In addition, as expected the irreversibility increased progressively across the different chambers until reaching the maximum at the last chamber. The highest irreversibility was experienced when water was used as base fluid and the lowest irreversibility was associated with nanofluid SiO
2. The irreversibility’s increase depends upon the type of nanofluid and their thermodynamic properties. Moreover, it appears that the concentration of the nanofluid did not have a significant impact on the changes of irreversibility across the various chambers during the flashing process.
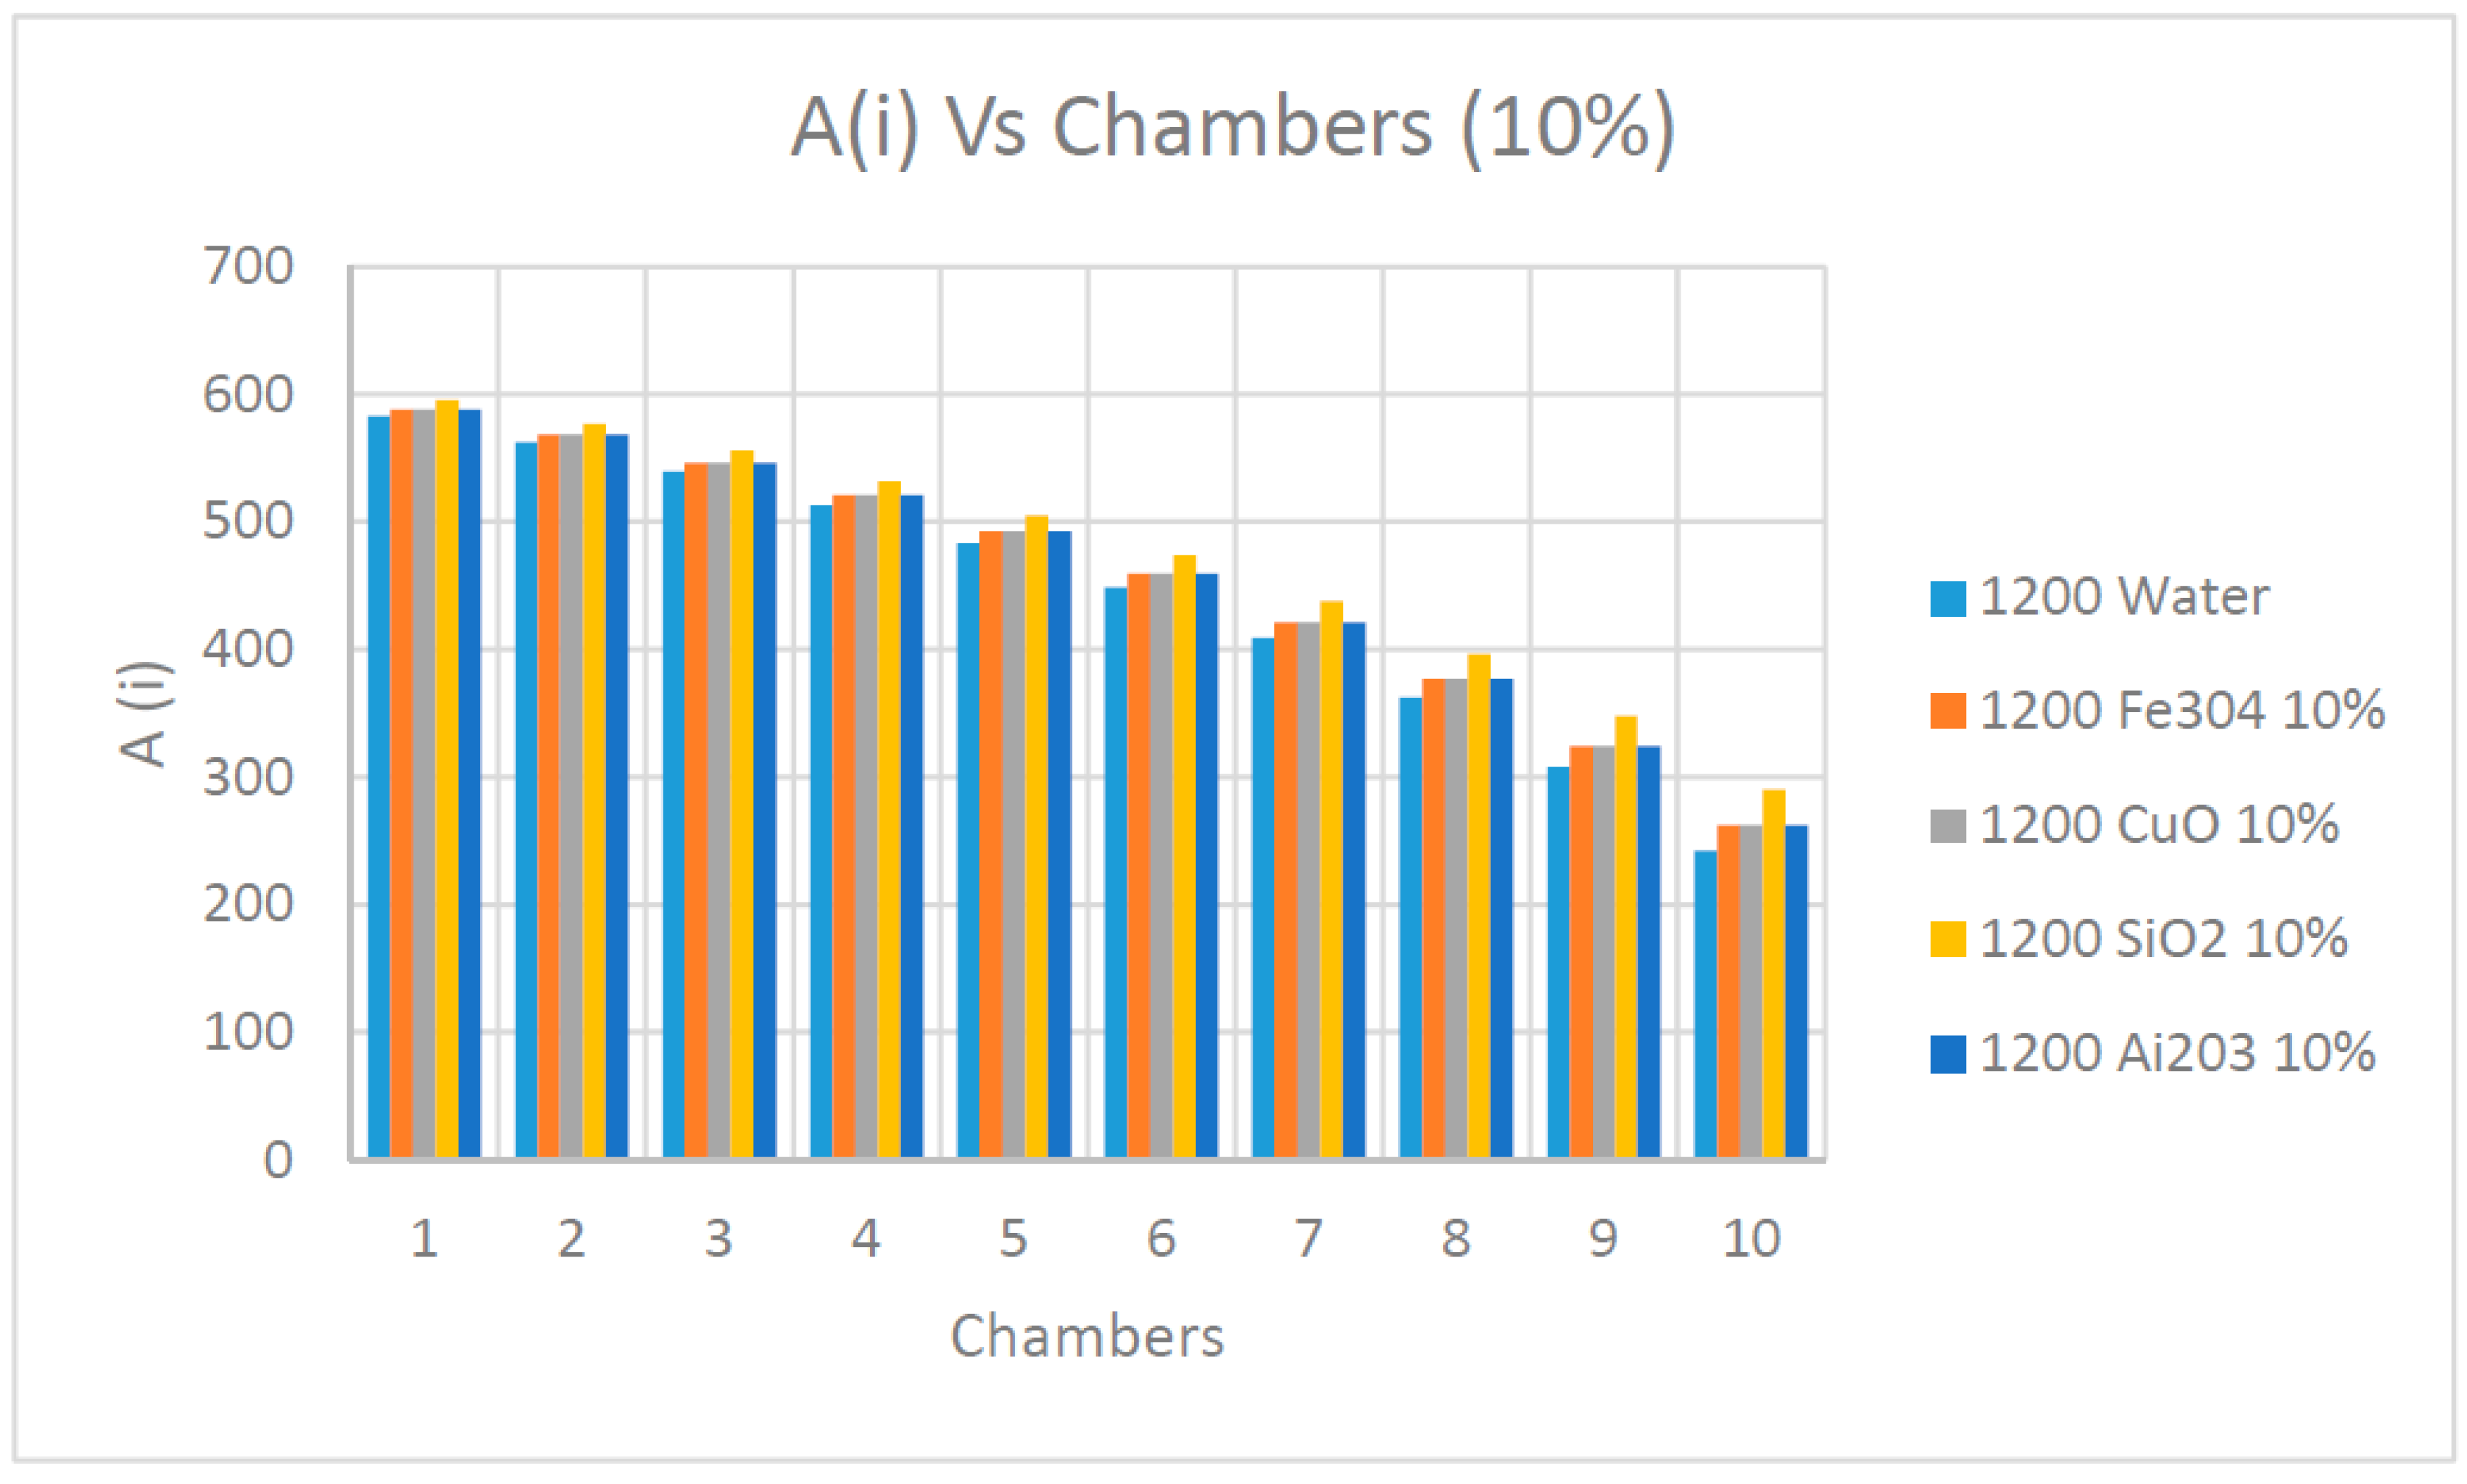
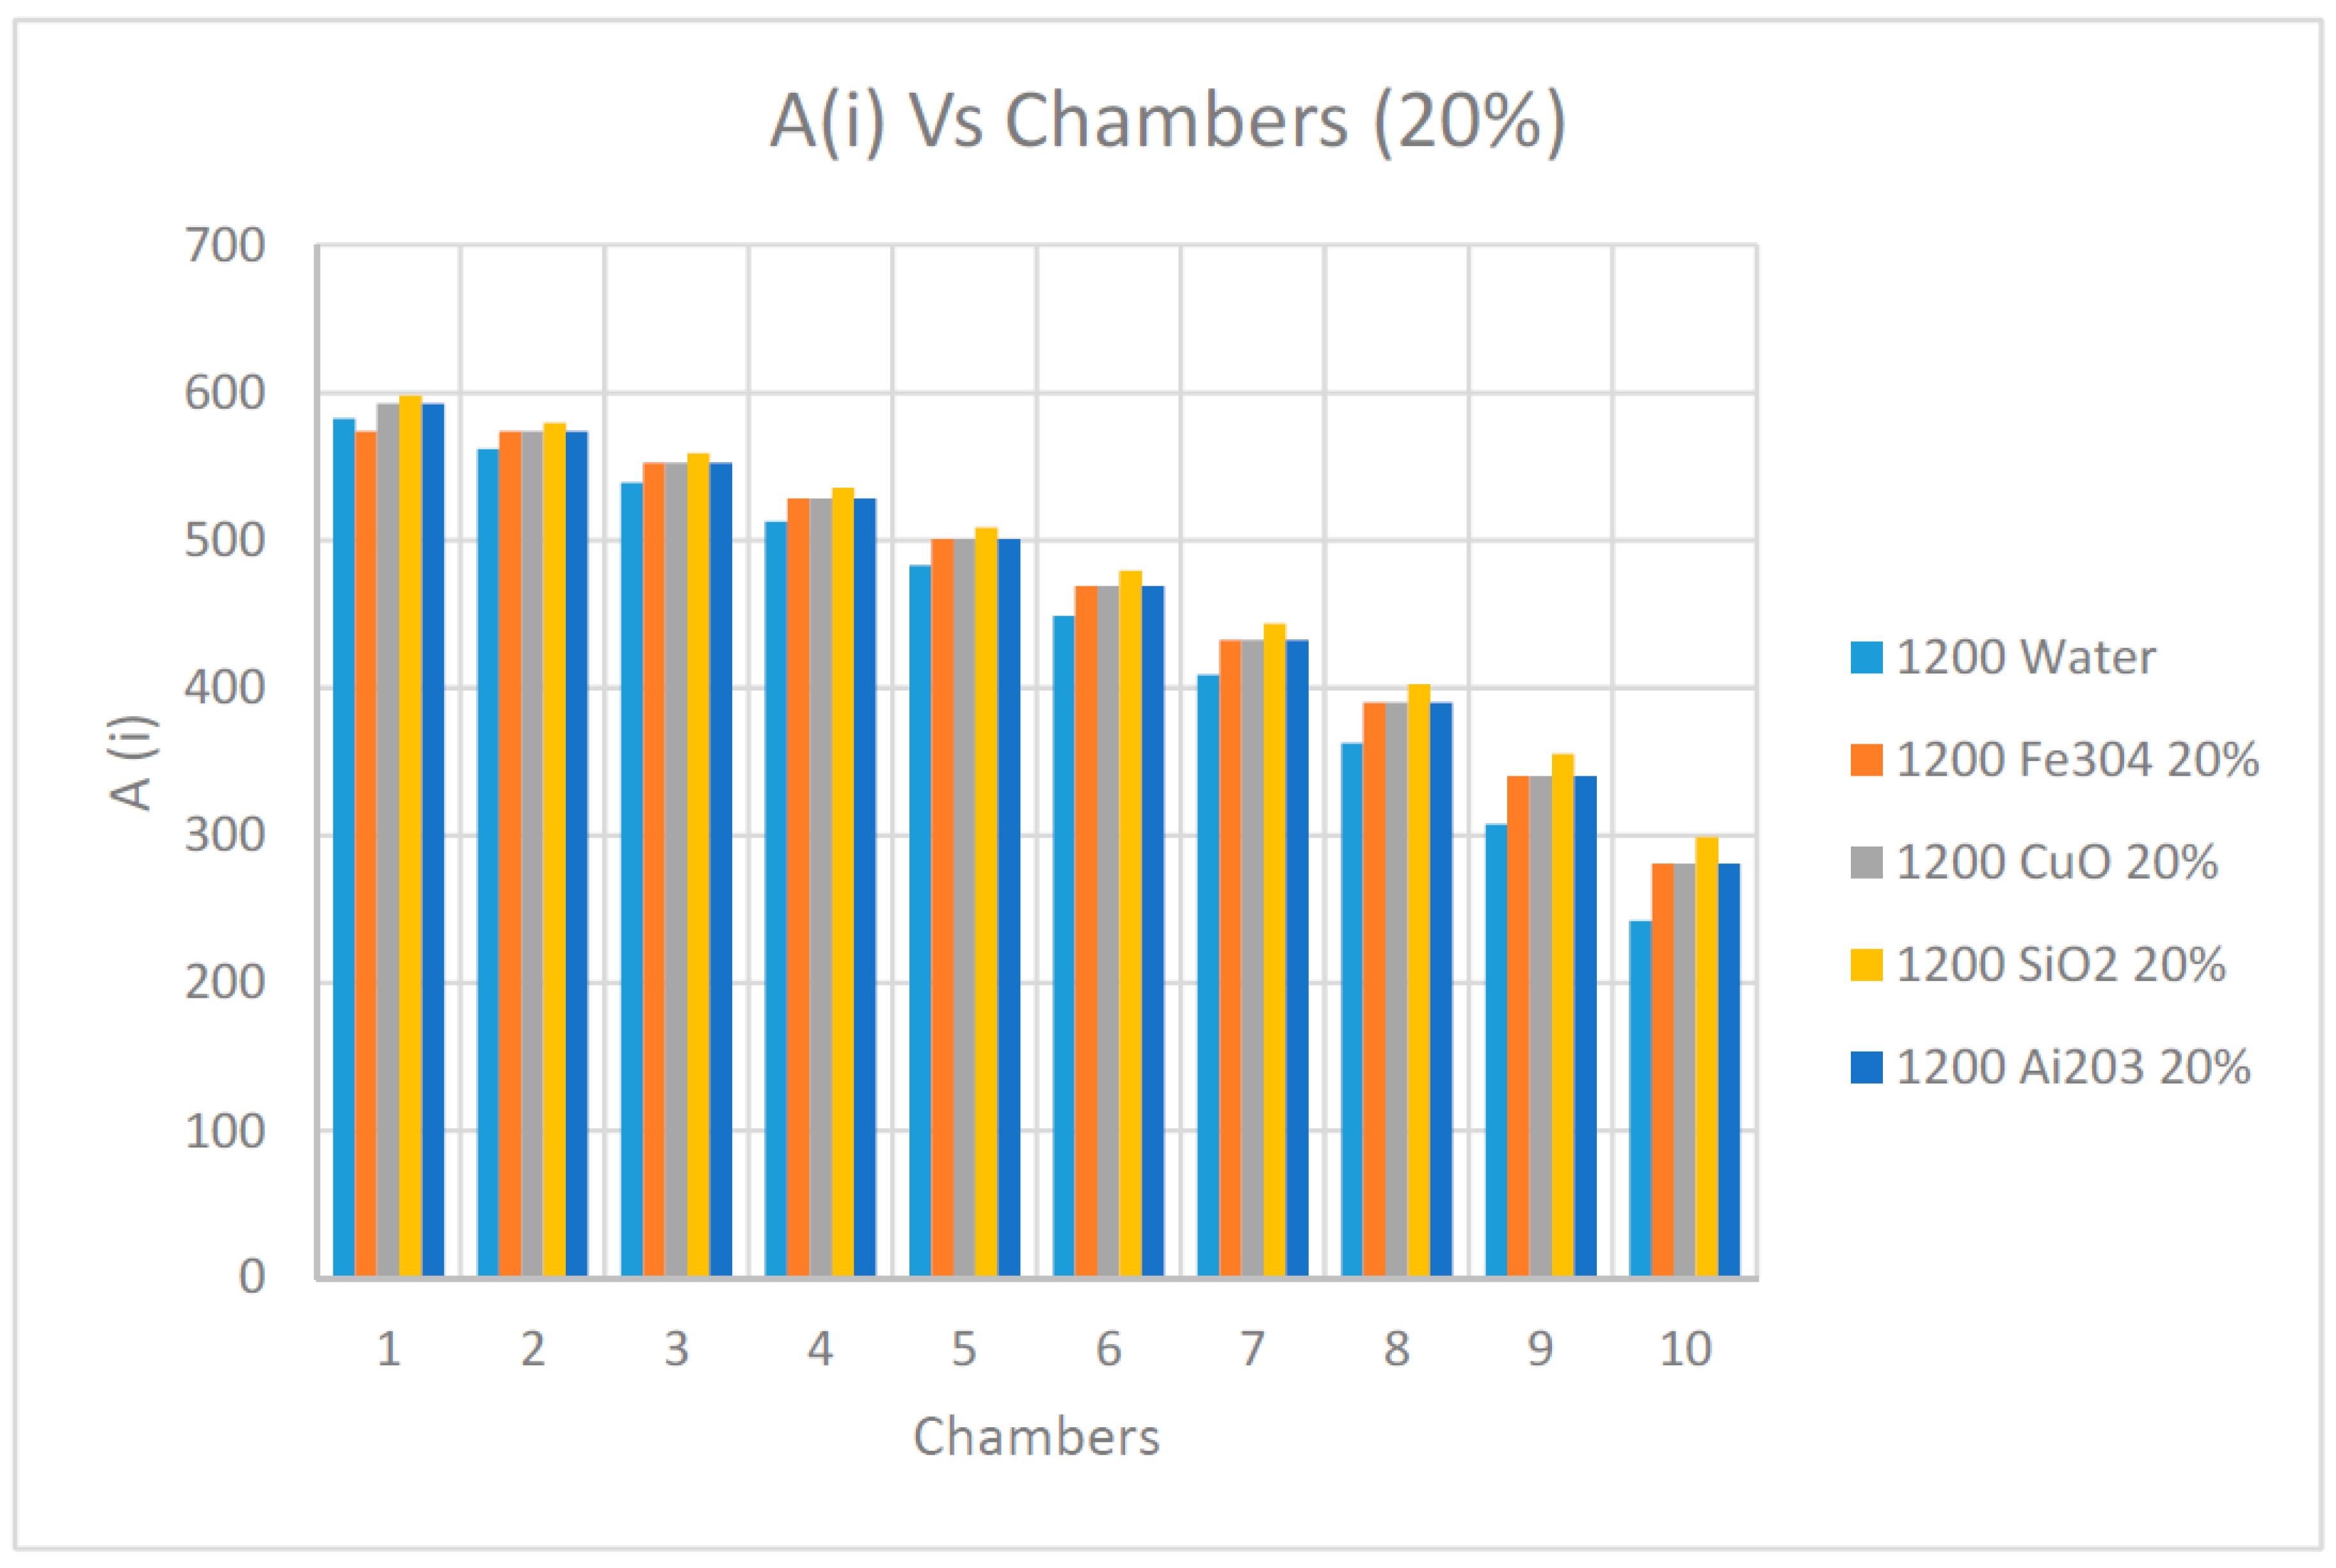
As observed in
Figure 21 and
Figure 22 and as previously discussed elsewhere in this paper, the availability determined by Equation (15) diminished progressively along the flashing chambers and reached the lowest value at the last chamber. It also appears that the nanofluids concentrations had little impact on the availability during the process of the flashing. On the other hand, it can be observed from the results presented in these figures that the nanofluid SiO
2 had the highest availability among the other nanofluids, including water as the base fluid in the flashing chambers.
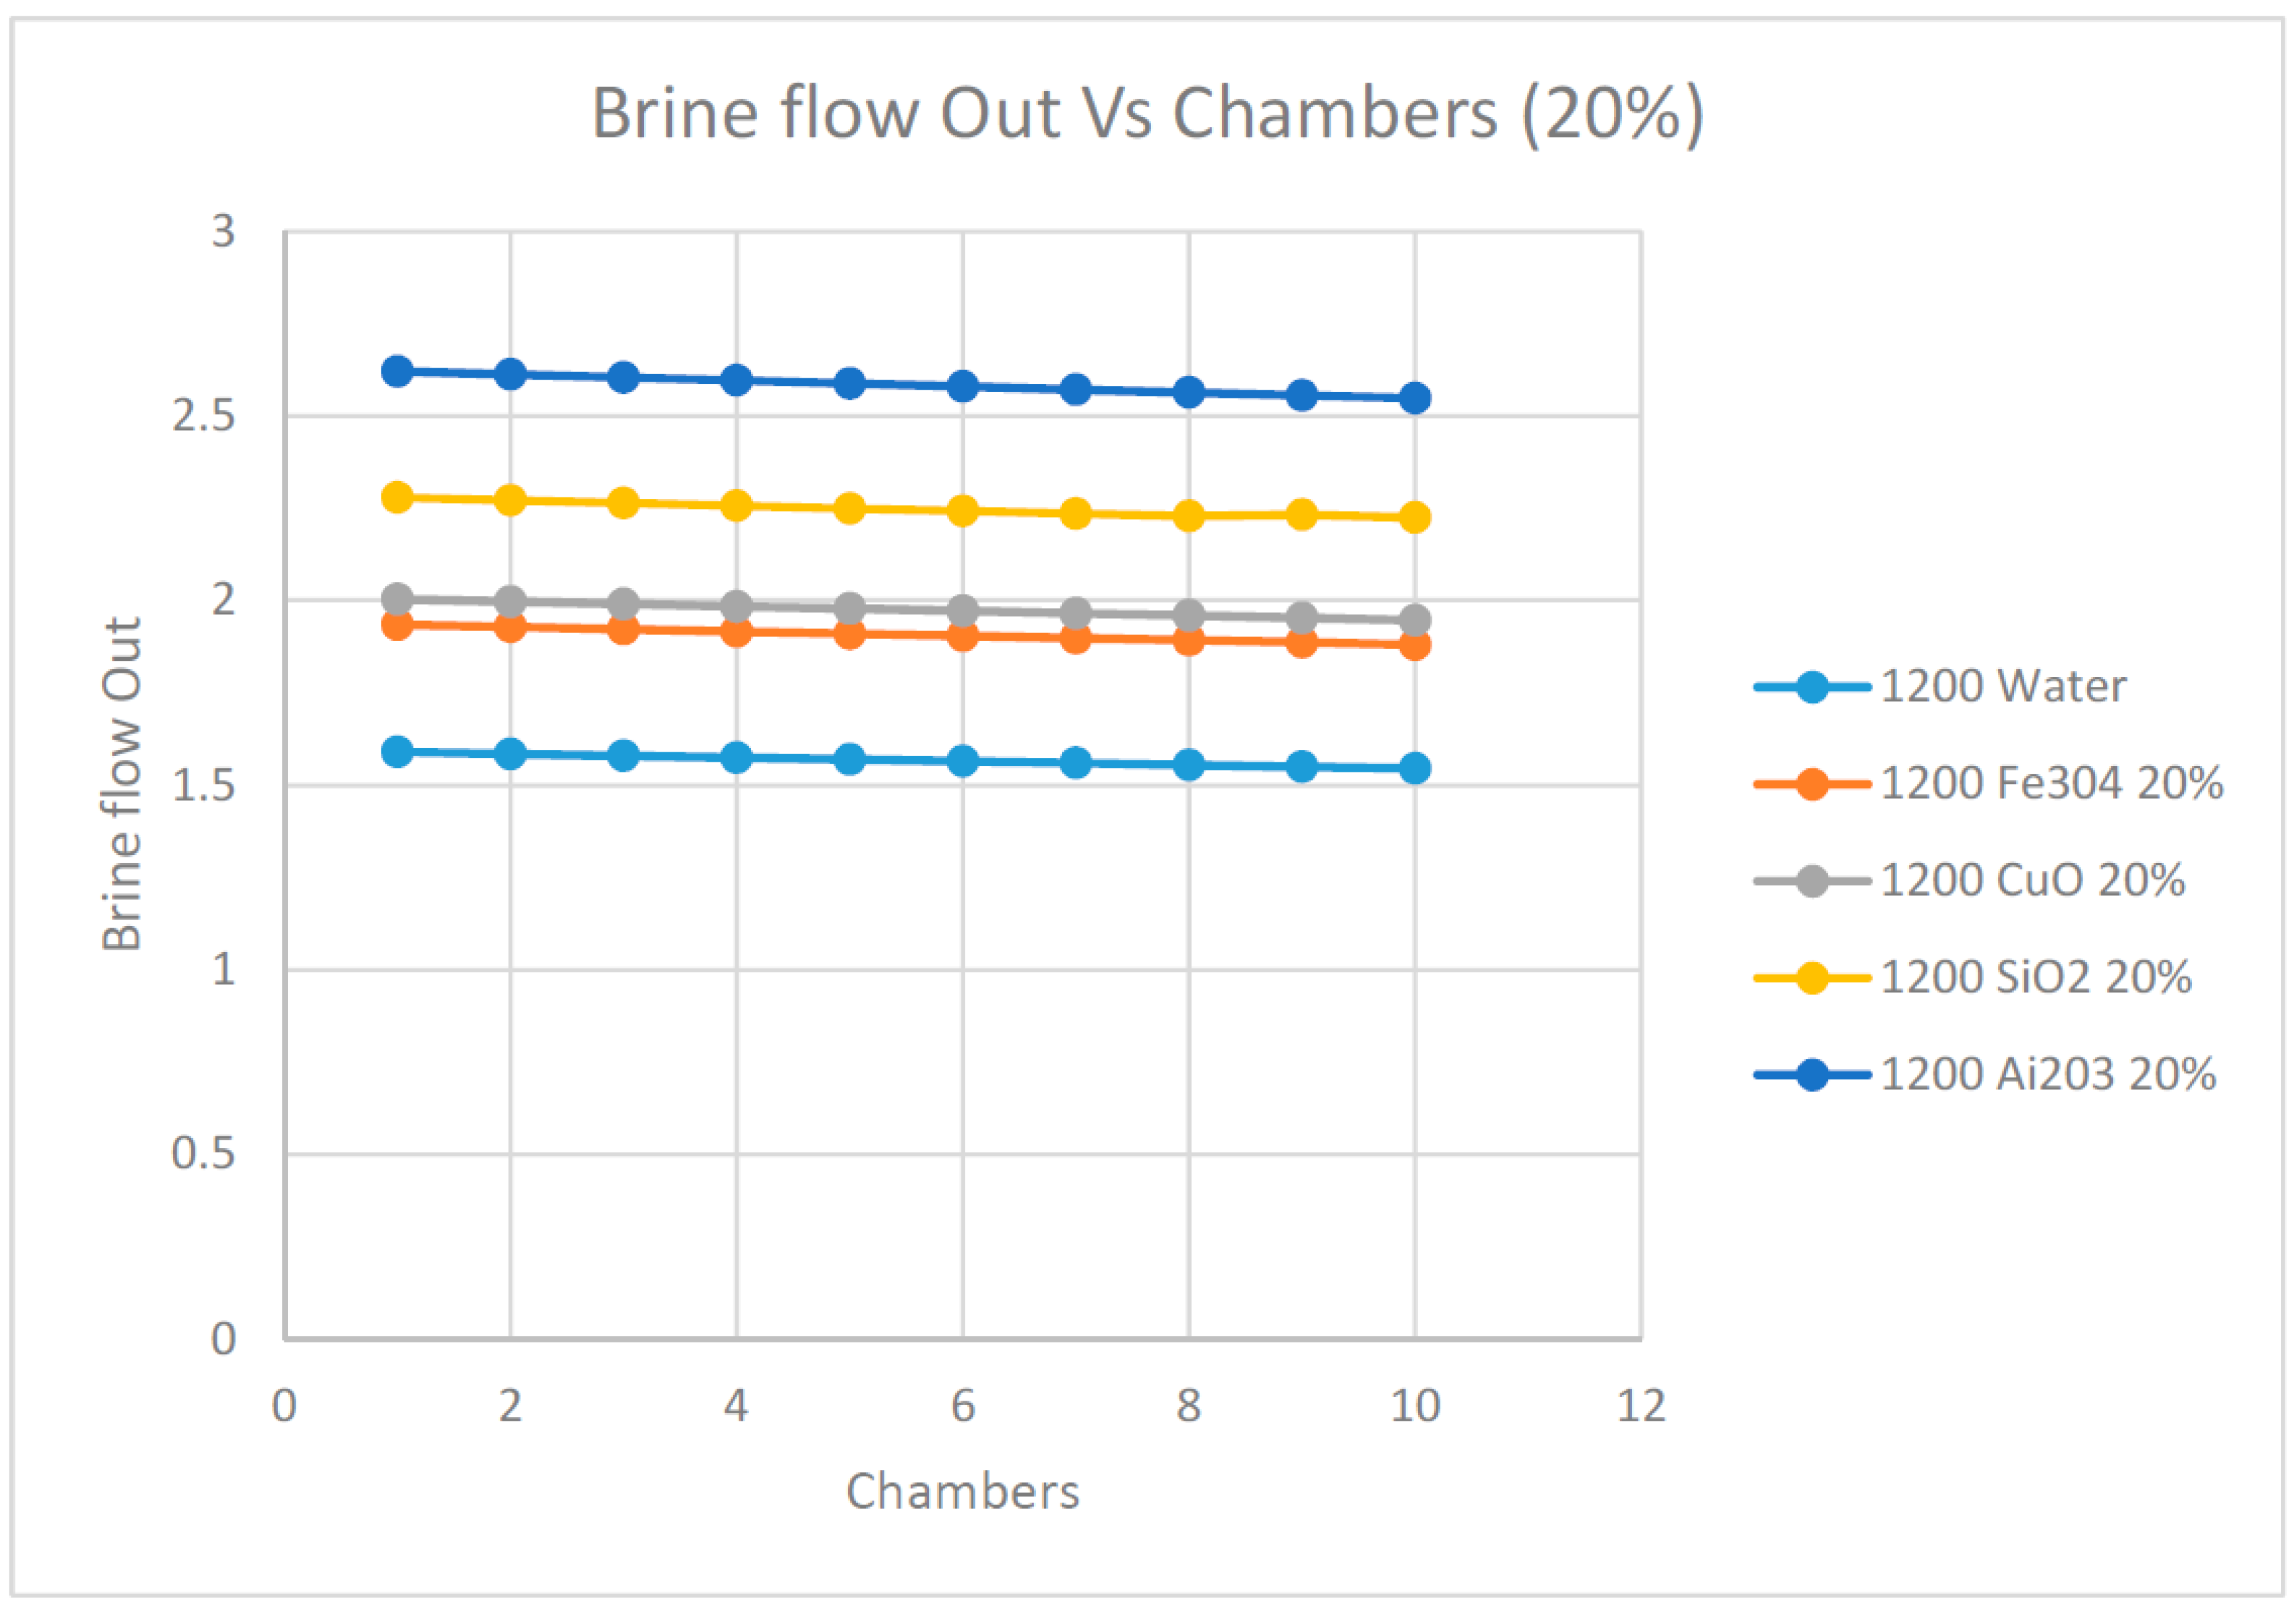
Finally, in order to investigate the impact of the nanofluids on the brine out flow from each chamber,
Figure 23 and
Figure 24 were plotted at different nanofluids under investigation where the solar radiation was at 1200 w/m
2. In general, the brine outflow decreased progressively across the flashing chambers and was the lowest at the last chamber. This was expected since at each chamber, an amount of vapor was flashed, which reduced the brine flow progressively along the flashing chambers. It also appears from these data that the higher the concentration of the nanofluids, the higher the brine flow across the flashing chamber, which was also expected. It was also observed that the nanofluid Ai
2O
3 produced the highest brine flow across the flashing chamber among the nanofluids under investigation, including water as the base fluid.
Finally, it is worth mentioning that lower nanofluids concentrations did not yield the minimum thermal capacities needed for the flashing process of the brine; therefore, 10% and 20% nanofluid concentrations were used. Their impact on the pump power was taken into consideration while calculating the availability and irreversibility during the flashing process.
7. Conclusions
A novel concept was presented in this paper for the MSF process, that implements PV-Thermal solar panels using hot heat transfer fluid with nanofluids. A mathematical and numerical model to describe the PV-thermal solar to drive the multistage flashing chamber process was presented. The model proposed was established after the mass and energy conservation equations written using the finite control volume approach with integrated thermal and thermophysical properties of the water and nanofluids as heat transfer fluids. The nanofluids under investigation are Ai2O3, CuO, Fe3O4 and SiO2. The flashing process was studied under various conditions, including different solar radiations, brine concentrations and nanofluids volumetric concentrations, as well as different flashing chamber temperatures and pressures. Solar radiations were taken as 500 w/m2, 750 w/m2, 1000 w/m2 and finally, 1200 w/m2. The nanofluids volumetric concentrations considered varied from 1% through 20%.
There was clear evidence that the higher the solar radiation, the higher the flashed flow produced. The results also clearly show that the irreversibility was reduced by using nanofluid Ai2O3 at higher concentration of 10% to 20% compared to water as base heat transfer fluid. It was found that the highest irreversibility was experienced when water was used as the base fluid and the lowest irreversibility was associated with nanofluid SiO2. The irreversibility increase depended on the type of nanofluid and their thermodynamic properties. Furthermore, the higher the concentration of Ai2O3; 10% to 20%, the higher the availability at the last flashing chamber. However, the availability was progressively reduced along the flashing chambers and was evident at the last flashing chamber. It was observed that the nanofluid SiO2 has the highest availability among the other nanofluids and water as the base fluid across the flashing chambers.
The results presented in this paper demonstrate that it is possible to increase the preheating process quality through the increase of the flashing chamber temperatures which, in turn, improves the plant thermal efficiency. The present study demonstrates an added value to the research in the thermal desalination by the use of solar energy, solar PV-Thermal panels as the driving force to the evaporation flashing process instead of a steam boiler. This approach represents a step forward towards the sustainability and reduction of global warming effects.
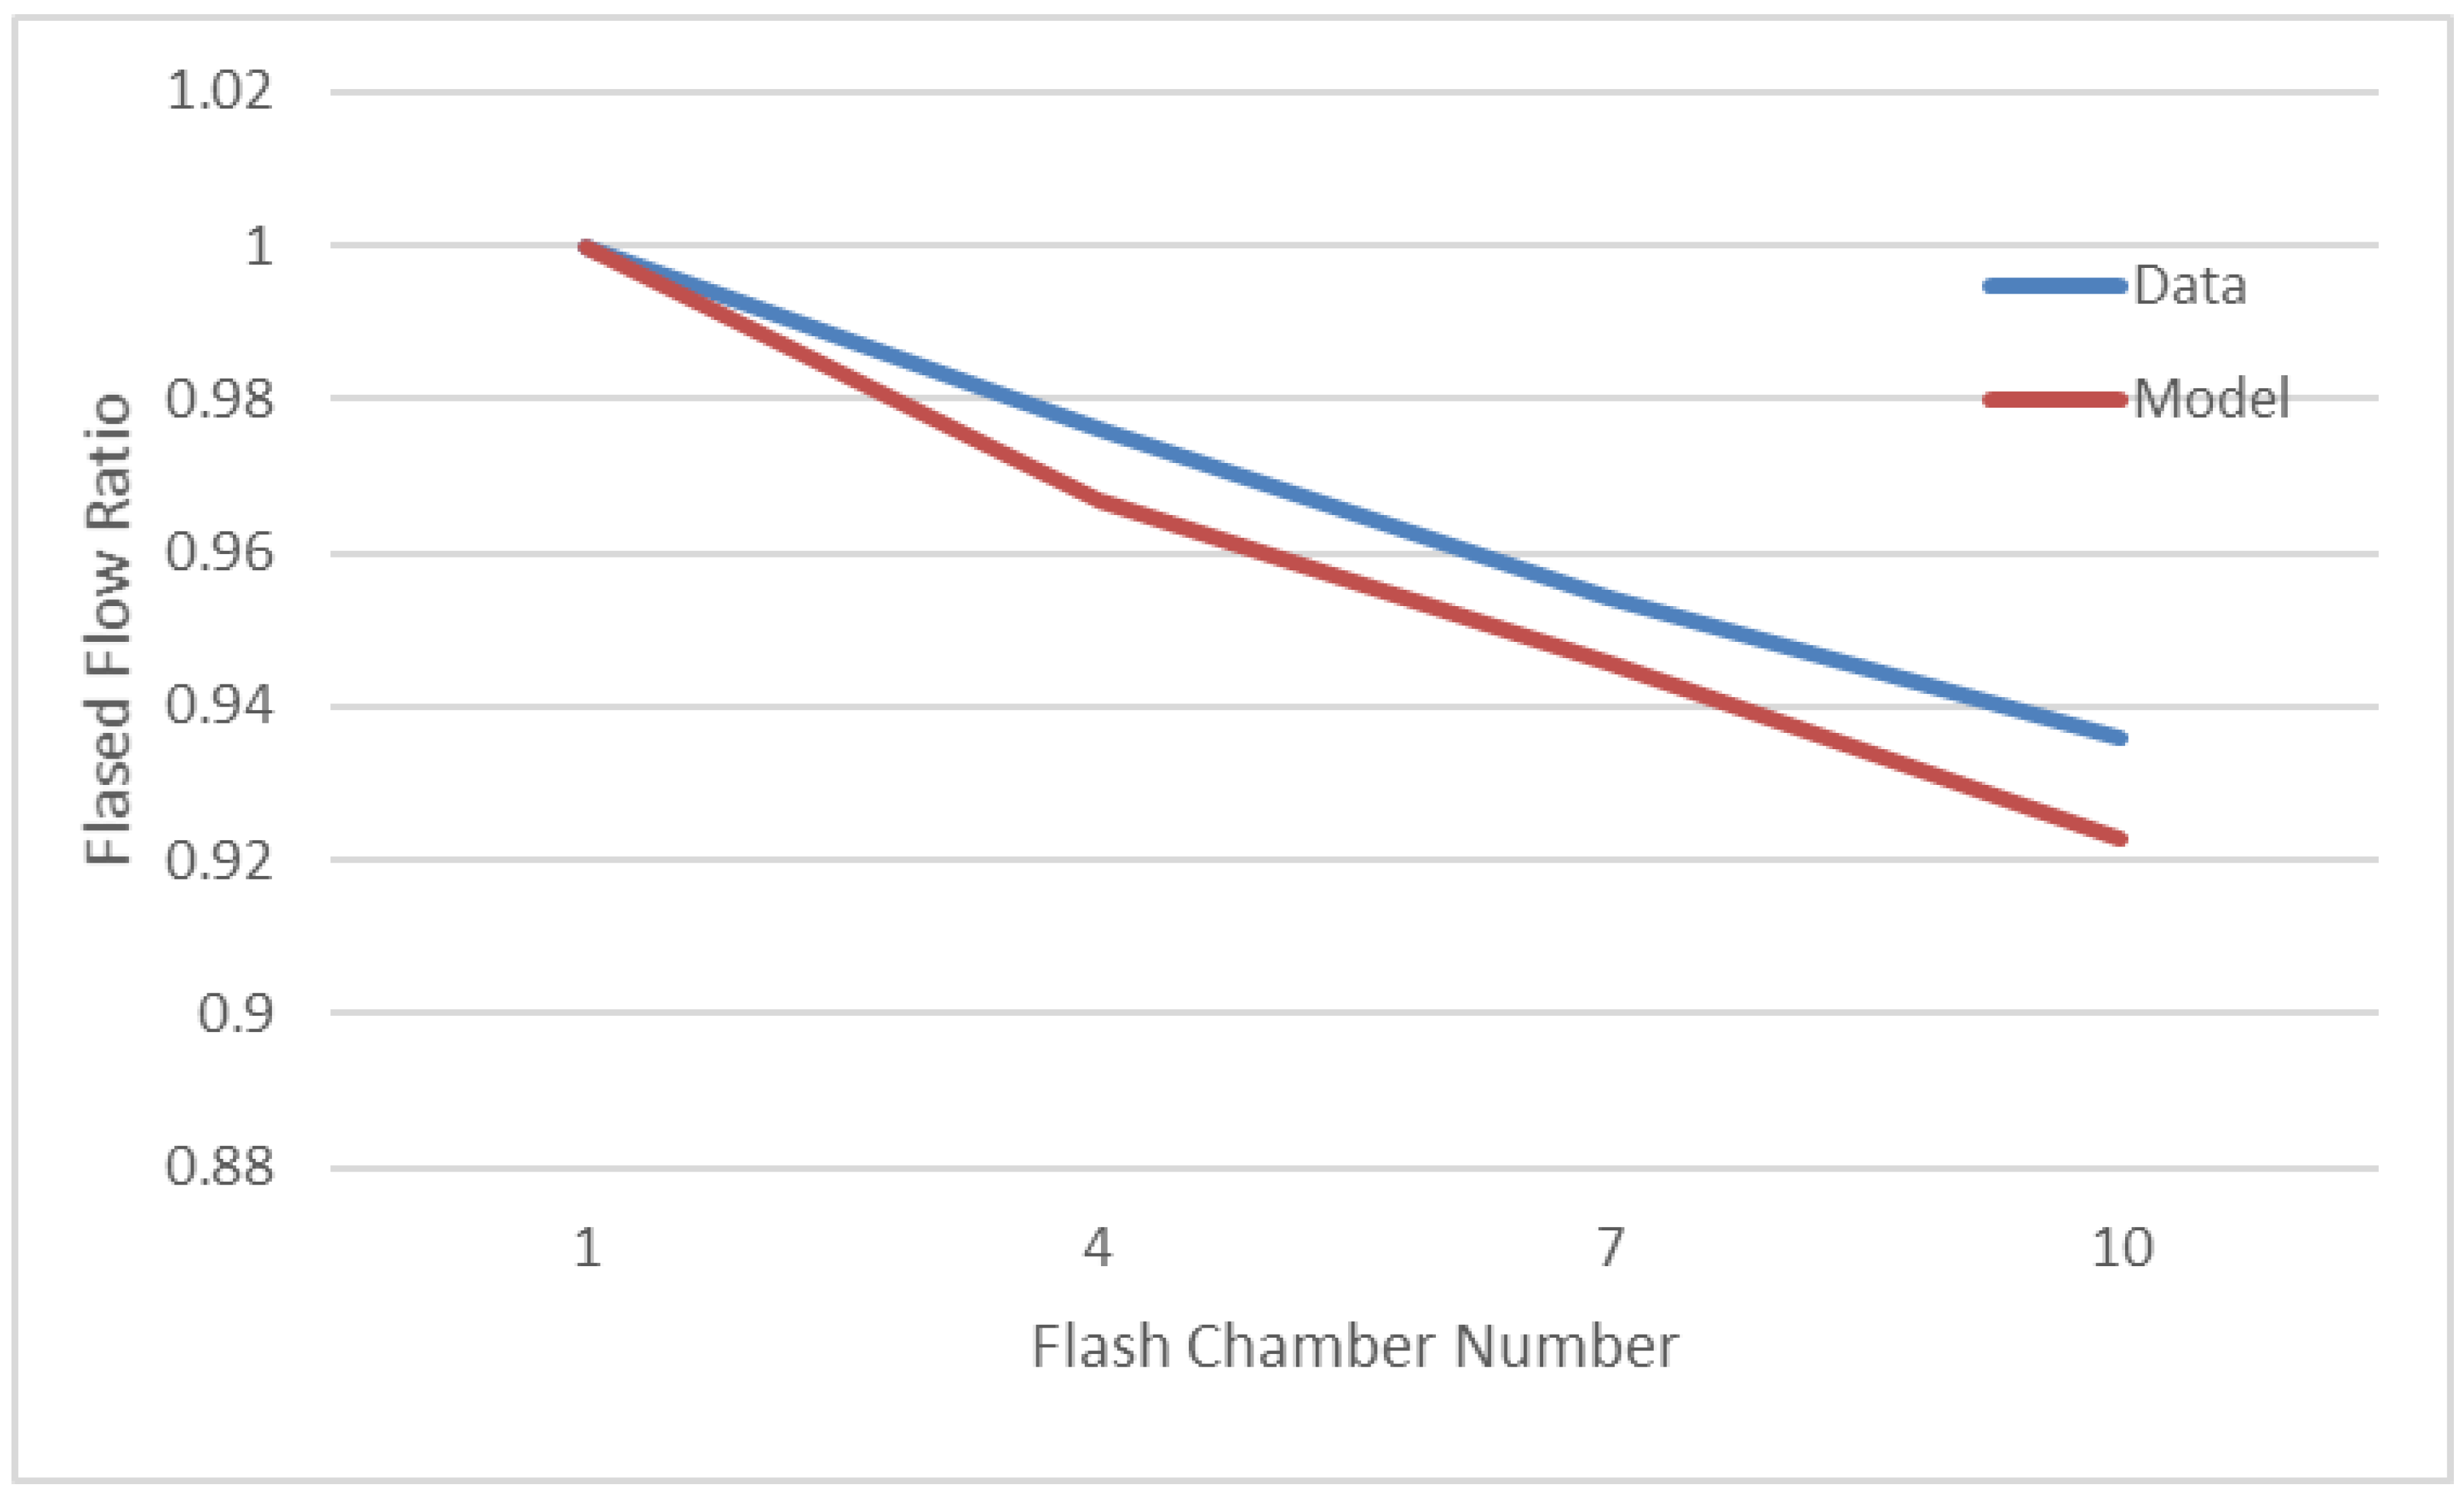
The predicted results were compared to the experimental data published in the literature. The comparison showed that the model fairly predicted the data under consideration. Finally, we believe that future studies should look into other nanofluids as heat transfer fluids at different volumetric concentrations and brine with different salt concentrations.
