1. Introduction
In the present decade, one of the most discussed issues is that of tackling and mitigating society’s negative impact both on human health and the environment [
1]. Although there is still great debate on the actual size of the human contribution to the problem, cutting down emissions is surely a positive step [
2,
3,
4,
5,
6]. Society pollutes and harms the environment through various ways, such as unhealthy emissions such as sulfur, mainly through SO
2, NO
x and greenhouse gases (GHGs) [
7,
8,
9,
10,
11].
The maritime industry is part of the transportation sector, which is responsible for 14% of the global GHGs, making it the fourth biggest sector in emissions globally [
12]. Although ships are thought to be some of the biggest polluters, the maritime transport of goods is a relatively clean form of transportation, per kilogram of material, and is therefore given an increasing weight over air and road trade and transport [
13,
14,
15].
In European coastal areas, shipping emissions contribute 1–7% of ambient air PM
10 levels, 1–14% of PM
2.5, and at least 11% of PM
1. Contributions from shipping to ambient NO
2 levels range between 7–24%, with the highest values being recorded in the Netherlands and Denmark [
16]. Maritime produced SOx and NOx create significant problems that will be further explained below. Taking into account the huge and constantly growing sector of worldwide trade and transportation, it becomes clear that even the cleanest means of transport per kg of material/good has devastating effects on our health and the environment [
17]. The many sources of air pollution caused from the maritime industry can be seen in
Figure 1.
Reducing transportation and trade cannot be considered a realistic solution, as it is critical for international growth. Therefore, making the maritime industry more efficient and environmentally friendly is unavoidable.
The idea of reducing the negative environmental impact is present in every economic sector, making it the ideal time to implement that in maritime as well [
18,
19,
20,
21]. Previously taken steps toward this direction were mostly indirect, through technologies primarily targeting the improvement of the vessel’s engine efficiency. However, green technologies and renewable energy sources (RES) have strongly infiltrated sectors such as energy production and storage and cars [
22,
23,
24].
Following the same logic, the shipping industry is already starting to change and implement technologies that reduce the environmental impact. There are numerous research studies, experiments, and prototypes trying to implement almost every alternative technology and fuel in vessels. Although it is not yet known which of these technologies will become dominant in the future, some of them have a strong statement of qualifications, and seem to be commonly accepted at present. As far as the alternative fuels are concerned, biofuels, hydrogen, liquefied natural gas (LNG), liquefied petroleum gas (LPG), and methanol are among the most representative. Ship engine manufacturers have started producing dual-fuel gas engines to allow the use of both natural gas and conventional fuels. In terms of new technologies, batteries, fuel cells, and wind-assisted propulsion are being strongly considered [
25].
The above-mentioned alternatives have different advantages and disadvantages, regardless of their short or long-run implementation, or just being part of the transitional stage of the evolving maritime industry. A solution that suits all different types of vessels is probably impossible, as there are different capabilities and needs depending on teach type. Nowadays, digitalization is rapidly growing and affects almost every industry. In the naval sector, this impact is mostly through big data gathering and analysis, as well as real-time monitoring (temperatures, emissions, etc.), and it brings along with automation, another growing field, fundamental changes such as autonomous shipping [
26].
Taking a step back from the maritime industry, the energy sector in general is changing. A big part of that change is attributed to electricity. Research and development in fields such as battery capacity, durability, and customization push batteries’ efficiency and price to be economically sustainable [
27]. The automobile sector, mostly the car industry, is turning to electric vehicles and is responsible for the rapid development of these technologies. Apart from the car industry, battery storage systems are also used for energy storage, ranging from simple photovoltaic installations (PVs) to high power output and capacity grid power storage [
28].
The latter is the main reason for the present paper to focus on the capabilities of on-board photovoltaic installation and electric propulsion in the maritime industry.
2. Legislation about GHGs, Sulfur, and Other Laws Affecting Maritime Industry
Approximately 90% of world trade (by volume) is transported by the global shipping fleet. It is no surprise that thousands of ships performing this vital task burn vast quantities of marine fuels for propulsion and on-board electrical power. For example, a Pure Car and Truck Carrier (PCTC) may consume between 30–60 tons of fuel per day, depending on its operating speed and weather conditions. On a global basis, it is estimated that between 2007–2012, ships consumed on average approximately 250 million to 325 million tons of fuel per year, resulting in approximately 740–795 million tons of CO
2 emissions. Another estimation is that in 2007, CO
2 emissions from 45,620 vessels amounted to 943 million tons, with the total fuel oil consumption (FOC) being 297 million tons [
29,
30].
In addition to CO
2 emissions, a range of other substances, including NO
X, SO
X, and particulate matter (PM) are released into the atmosphere as a result of global shipping activity. These substances have an adverse impact on human health, contributing approximately 60,000 deaths per year. In the top 50 ports alone, approximately 230 million people are directly exposed to emissions from shipping [
31,
32,
33]. The main reason behind the relatively high level of emissions is the composition of the marine fuels. However, emissions should be taken under consideration, even when liquefied natural gas (LNG) is used as a fuel source.
In recent years, organizations including the International Maritime Organization (IMO) and European Commission (EC) have taken actions to reduce airborne emissions from the shipping sector via policy initiatives. These include the implementation of Emission Control Areas (ECAs), the setting of sulfur content limits in marine fuels, and the International Convention for the Prevention of Pollution from Ships [
34]. These policy initiatives have encouraged the development and adoption of various eco-friendly technologies and measures.
Bringing these matters to the present, the global maritime industry is embarking on a major overhaul of its fuel supply. Starting from January 1, 2020, under the IMO’s International Convention for the Prevention of Pollution from Ships, MARPOL treaty, it will be required that all fuels used in ships contain no more than 0.5% sulfur [
35]. The cap is a significant reduction from the existing sulfur limit of 3.5%, and is well below the industry average of 2.7% sulfur content. Carriage of non-compliant fuel oil for combustion purposes, propulsion or operation on-board, is prohibited, unless the ship has an exhaust gas cleaning system (scrubber) fitted. Installing a scrubber is accepted as an alternative means to meet the sulfur limit requirement, which benefits the environment and human health. A submitted study to the IMO’s Marine Environment Protection Committee (MEPC) in 2016 estimates that by not reducing the SOx limit for ships from 2020, the air pollution from ships would contribute to more than 570,000 additional premature deaths worldwide between 2020–2025.
As far as GHGs are concerned, the IMO is also taking early steps to reduce them. In April 2018, the United Nations (UN) agency reached a deal of great importance, on curbing carbon emissions from ships by at least 50% below 2008 levels by 2050. The non-binding agreement is expected to attract investment in clean ship technologies, including fuel cells, biofuels, and advanced sail designs.
However, for the time being, shipping companies are focused on the impending sulfur cap, but switching fuels won’t be as simple as selecting a higher grade of gasoline at the pump. Low-sulfur alternatives are generally more expensive and less widely available than bargain-rate bunker fuels. In some corners of the industry, this has led to negative forecasts of fuel shortages and spikes in cargo rates. Nevertheless, many companies are working to comply with the cap by installing exhaust scrubber systems and acquiring hybrid solutions and even switching to LNG propulsion.
The IMO does not have the authority to enforce the sulfur cap; that task falls to flag states, the countries to which vessels are registered. Uncertainties remain about the methods and the credibility of them, by which authorities will inspect and monitor ships’ fuel usage. However, in general, ships caught breaking the rules would be charged with fines, face potential losses of insurance coverage, and see their reputation tarnished [
36].
A more practical example of measures and technologies concerning the decarbonization of transport can be found at the Port of Rotterdam. It is clear that experimental technologies that are often mentioned in the news have a great distance to cover until becoming commercially available. Thus, it is of great importance to see which exactly are the technologies, that are commercially available starting from today and reaching the future 30 years.
According to [
37], under the prism of decarbonization of transport, the means to increase the efficiency of ships and stimulate the use of low carbon fuels in shipping are the following. In the short term, technical and operational measures can reduce CO
2 emissions for the maritime industry. Efficiency measures in fuel consumption can result in a 20% to 50% reduction. In the medium term, ships need to switch to electric propulsion, hydrogen, and synthetic fuels such as methanol. LNG and biofuels can be used as transition fuel between 2020–2050 [
38]. In light of the current lack of feasible and directly available alternatives for use, the Port of Rotterdam and other ports stimulate LNG as being a more sustainable alternative to heavy fuel oil. Furthermore, the infrastructure used for LNG purposes can also be used in the transition to bio-LNG in the longer perspective [
39]. The effect of bio-LNG on the CO
2 reduction is larger (approximately 90%) than LNG. In order to scale up bio-LNG projects in the future, a comprehensive LNG infrastructure network is necessary with a clear transition path toward bio-LNG. On the European level, the EC should stimulate the use of sustainable biofuels in inland shipping by proposing blending or drop-in obligations. The Rhine–Alpine corridor could function as a pilot corridor to test the effects of a blending obligation on a regional cross-border scale and become the first EU low-carbon corridor for inland shipping.
3. Technologies that Did or Will Shape the Future of Naval Travel and Trade
Although solar, wind, and green energy, in general, are among the first that come up when talking about emissions reduction, there are numerous other technologies reducing emissions and improving efficiency [
40]. Cutting down on emissions might be something relatively new; however, in such a competitive sector as that of shipping, the need for improved efficiency, less fuel consumption, and more self-sufficiency have always been there. Technologies that help achieve these targets also contribute to making ships more eco-friendly.
3.1. Shaft Generators and Other Mechanical Developments Improving Efficiency
A very good example of such a technology is shaft generators (SG), which reduce the fuel consumption, and thus the emissions generated, for electricity production. In order for that technology to be understood by an audience not familiar with maritime technologies, a better understanding of a ship’s power system is required [
41].
A vessel generates power for both the ship’s operational equipment, as well as crew accommodation, such as the galley and cabin lighting. To achieve this, a standard generator burns a large volume of marine diesel fuel, which increases the operational cost, requires more frequent maintenance of the generator, and contributes to air pollution. Merchant vessels typically spend most of their operational life sailing long distances, and fuel economy is the most important factor after safety and reliability. As an alternative, an SG is driven by the ship’s main engines—which, when compared to auxiliary diesel generators, do generally have lower fuel consumption and can run on less expensive heavy fuel oil (HFO) or LNG. However, saving money on fuel is only part of the equation. Tightening regulations on ship emissions means that reduced fuel consumption not only increases efficiency and reduces cost, but also lowers overall emissions and complies with the regulations.
Similar to any other technology, SGs come with problems and barriers that have to be overcome before the implementation. According to [
41], the downside of this arrangement was that the propulsion machinery could only operate at a constant speed in order to maintain the network frequency within limits when operating with a shaft generator arrangement. This occurs because the ship’s network frequency and propeller rotational speed are interconnected. As a result, any change in speed directly affects the network frequency, which was traditionally overcome by controlling propulsion thrust and ship speed, by changing the propeller pitch. However, that operation can lead to decreased efficiency and increased CO
2 emissions, contradicting the reason a shaft generator was installed in the first place.
In consequence, the ideal operational scenario would be to enable efficient and reliable power generation when the ship’s propulsion system operates at varying speeds, such as during maneuvering or heavy weather conditions. Adding a frequency converter to the shaft generator makes this possible. Apart from the aforementioned benefits, once the frequency converter is fitted as part of the shaft generator system, it can also be used to adapt various shore supply voltages and frequencies, with no need for additional panels in the main switchboard. Connection to an onshore power supply is possible by utilizing the existing synchronizing equipment, having the advantage of not using the auxiliary diesel engines in the harbor, which is an additional environmental benefit. The arrangement is often used to supply the thruster motors via the SG system with split busbars during maneuvering, further improving the efficiency and system flexibility.
As mentioned above, SGs are only one among many other technologies already operating in vessels to improve their efficiency and reduce emissions. Examples of these include exhaust scrubber, waste heat recovery systems), exhaust gas recirculation (EGR), air lubrication systems, fuel cells, Propeller Boss Cap Fin (PBCF), de-rating engines, slow steaming, operational data analysis, and optimized [
42,
43].
3.2. Solar Ships of the Past
The idea of using solar energy to power ships is not new. There are numerous examples of research studies, experiments, and prototypes that managed to do this. Between these prototypes, there are ships that use solar energy as an auxiliary means of power in order to cover the electricity needs of the ship, along with other renewable sources, and even as the only power source, as shown in
Figure 2 and
Figure 3. However, solar energy is not considered to be able to fully power ships, because of the relatively small energy density that PVs provide. The latter is further analyzed in
Section 5.
The aforementioned need to turn to greener technologies in the naval sector led to the first steps of implementing solar energy as a power source in modern ships.
An interesting example is the Auriga Leader, a car carrier ship for Toyota, back in 2009. The vessel is about 200 m long, weights around 60,000 tons, and carries up to 6200 cars, transporting them from Toyota Motor Corporation factories in Japan to the Port of Long Beach.
On the Auriga Leader, 328 solar panels were installed on its top, providing a maximum power output of 40 KW [
46]. This was the first time that a carrier ship used solar energy to cover part of its electricity needs, substituting the auxiliary diesel engines. In that occasion, the panel’s installation did not only make the Auriga Leader greener by reducing the pollutants freed to the atmosphere, it also made it more economical and efficient by reducing the vessel’s diesel consumption.
3.3. Wind Power Re-Emerges in the Maritime Industry
Even if onboard PVs are unable to sufficiently power a vessel, other alternative technologies and fuels are still not commercialized. Such a transition is difficult, even on shore. Time, money, political will, and legislation are only a few of the factors delaying this transition. Change and strengthening of the above factors is required in order to secure the stability and efficiency of such a transition.
However, there is a greater reason that kept solar energy and other RES such as wind away from naval use. It is historically proven that since ancient times, ships used wind as their main source of propulsion, and this philosophy is applied until today through sailing. Wind was also used as a power source in other sectors, such as windmills. The problem is that the same logic hasn’t been applied to modern cargo, ferry, carrier, etc. ships for decades. Until the 18th century, sails were dominating the naval sector, but with the invention of steam engines and the commercial use in the end of the 18th century, sails started losing their monopoly. By the early 20th century, steam engines had totally dethroned sails. Although wind, a renewable energy source, did work for large ships, they got replaced by steam engines and by internal combustion engines later on. This happened because the latter required less crew, were relatively inexpensive and more reliable. For the above reason, there was insufficient demand for the further application and development of wind power.
However, the immense need of reducing harmful emissions in the maritime industry requires also technologies that have a more drastic impact on the vessels operating system. A representative example of such a technology is based on the idea of exploiting the wind power. The return of sails started with the idea of rigid sails, which have a great difference compared to conventional ones. Rigid sails as a concept, instead of being flexible as those used in yachting, are solid. They are simply an airfoil and share the same aerodynamic philosophy with wings of airplanes, cars, etc.
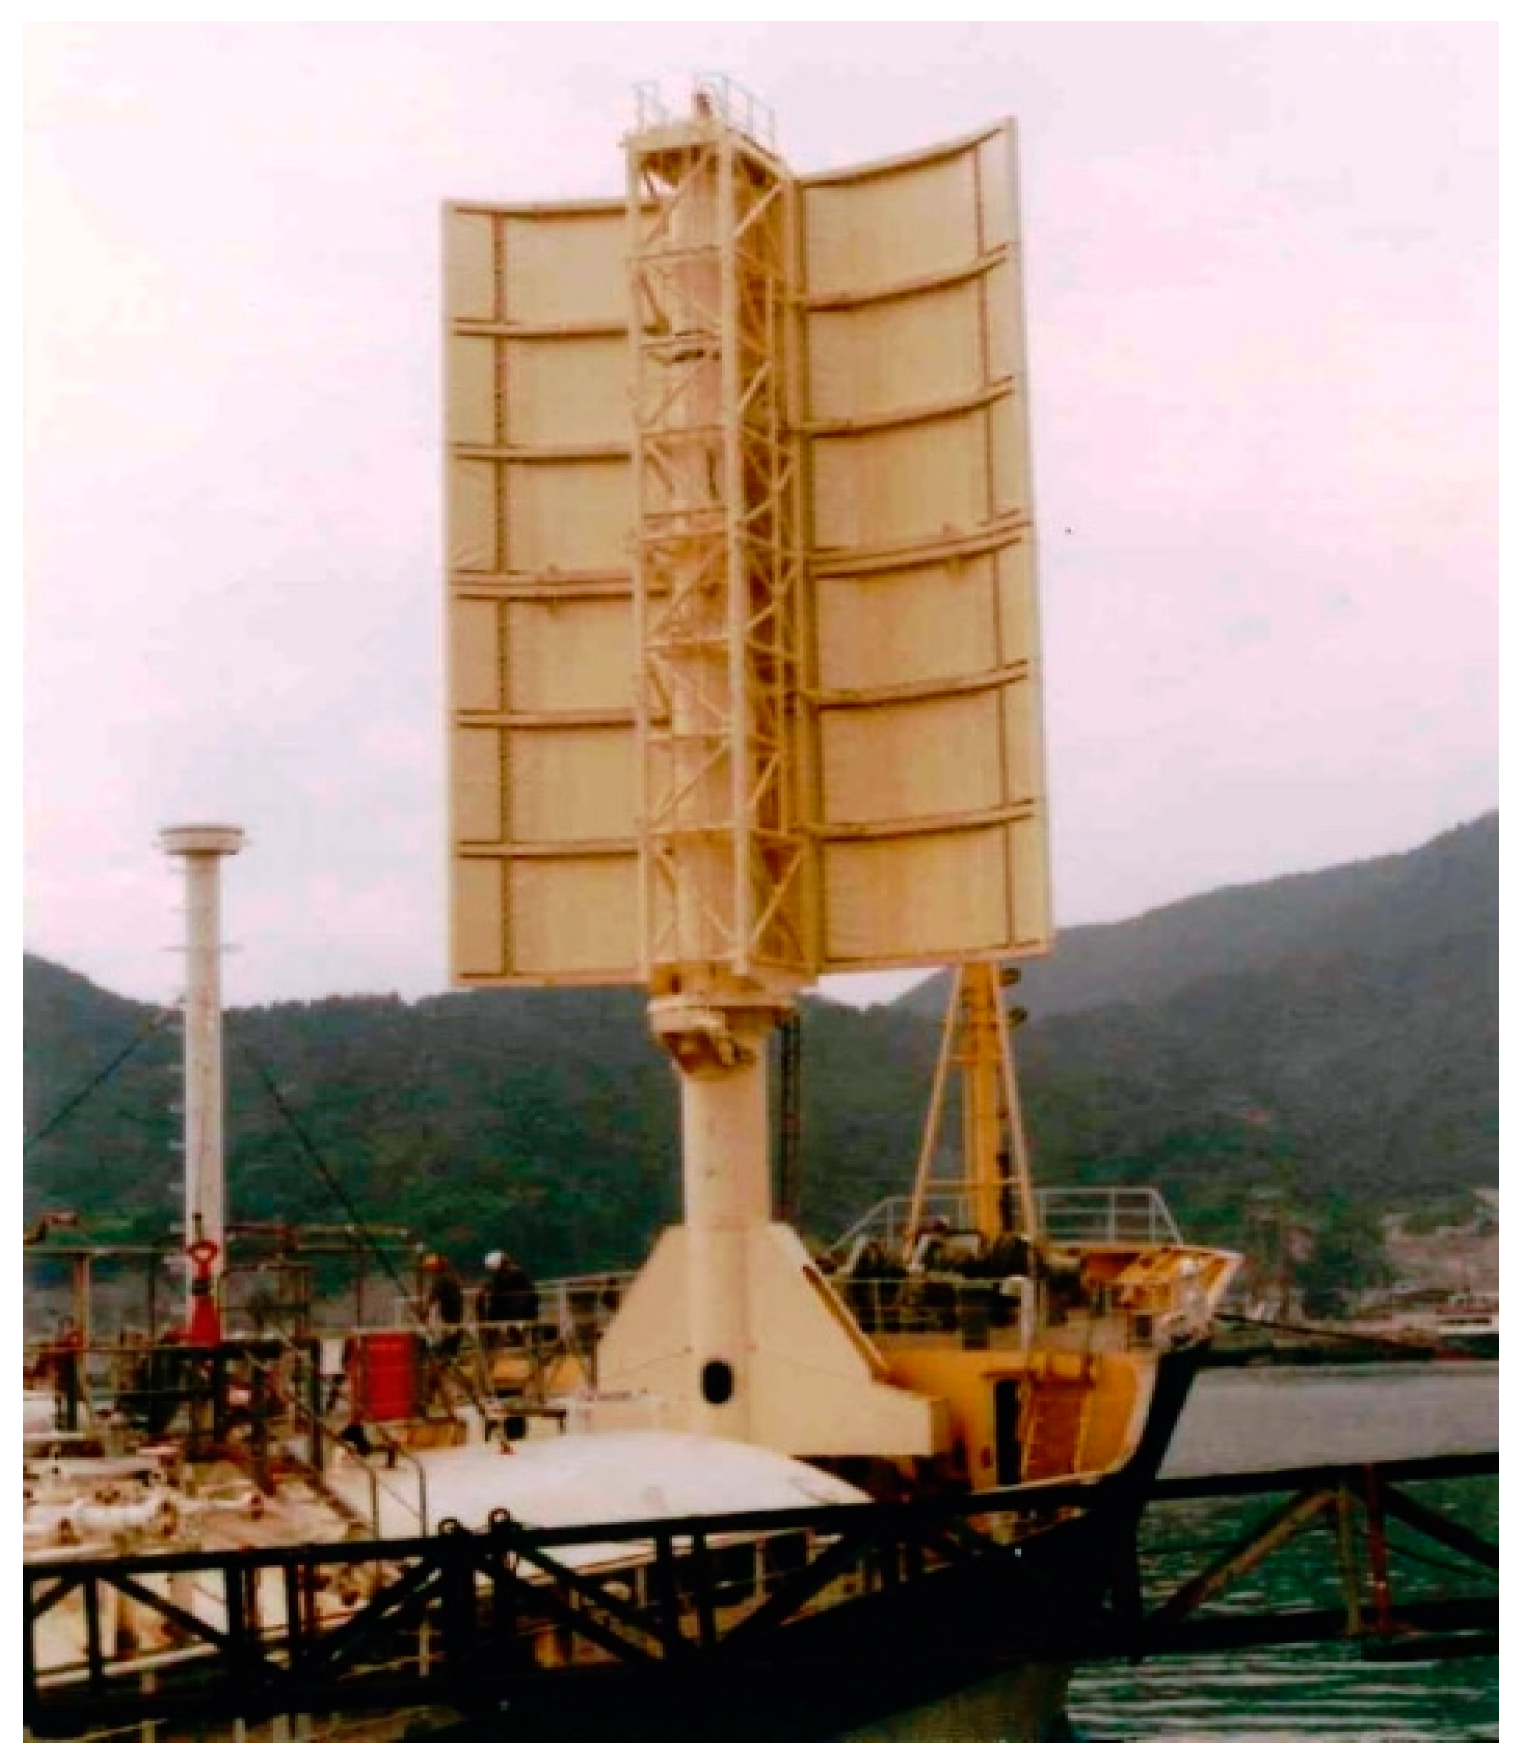
According to [
47], in the 1970s and 1980s, the Japan Machinery Development Association (JAMDA) was involved in the development of rigid sails, and this led to more than a dozen ships being fitted with JAMDA sails, as shown in
Figure 4. These sails proved that the use of rigid sails on modern powered ships could lead to significant fuel savings, with reductions of around 30% being reported under certain conditions.
However, rigid sails were not the only technology exploiting the wind power for a vessel’s propulsion. Another equally important technology was that of rotor sails, also known as Flettner sails. These sails were invented back in 1920s, and were a result of Flettner’s research in cooperation with Albert Betz, Jacob Ackeret, Ludwig Prandtl, and Albert Einstein. These rotor sails, based on the Magnus effect, did provide significant improvements to the overall efficiency, being at the same time operationally stable and secure under different weather conditions [
48].
Although both of the above-mentioned technologies were an effective source of supplementary propulsion, their development was delayed due to a decline in oil prices both in the 1930s and 1980s, when Flettner Sails and Rigid Sails where thoroughly researched and tested, respectively. That near-zero demand for such technologies, as mentioned above, was the main reason they lacked the required effort in overcoming emerging difficulties toward further implementation and resulted in their commercial extinction.
Today, the situation is completely different. As mentioned before, the maritime industry receives significant pressure in order to reduce its emissions. Furthermore, technological breakthroughs and improvements have secured a solid know-how on numerous green technologies. In the naval sector, there has been attempts to implement green technologies on board. As far as wind energy is concerned, two representative technologies share the same philosophy with rigid and rotor sails respectively, but this time, discoveries in the material sector (e.g., alloys, carbon fiber) along with digitalization and monitoring (e.g., automations and sensors) can make the difference toward successful implementation.
Starting with the rigid sail concept, the idea is the same as the one in 1980. The main difference is that this time, the sail is equipped with numerous sensors, which combined with an automated system give the sail the capability of turning to the specific angle, in order to provide the optimum propulsion force. Moreover, such rigid sails seem to be capable of simultaneously utilizing solar energy by having photovoltaic panels attached onto them. An example of this technology can be seen in
Figure 5. The specific rigid sail is part of an integrated energy system that incorporates photovoltaics, the battery system, fuel consumption monitoring, and a central control panel that is added to the preinstalled control panel of any vessel. It is reported that it has been evaluated for more than four years in test labs, outdoor evaluation areas, and during a joint trial project in Greece with one of the leading companies in RoRo and passenger vessels in the region. This project resulted in the first installation of combined marine solar power and fuel consumption monitoring system on board of a high-speed RoRo ferry [
49].
As far as Flettner rotors are concerned, they have been successfully implemented since 2008. Although they did not reveal any operating malfunctions and have operated since then, they did not expand commercially. Ten years later, the interest for these rotors is revived, due to new research and development of a new generation of Flettner rotors. The philosophy of the rotor is again the same, entirely based on the Magnus effect for providing moving force. However, there have been significant technological improvements mostly in the design features, such as lightweight materials, high-performance bearings, and the ability to rotate at high speeds that could possibly commercialize Flettner rotors in the modern maritime industry [
48].
Both of the above systems do provide increased efficiency compared to their older version. This increased efficiency is mainly due to the technological improvements that the new versions incorporate. In greater detail, both systems exploit the capabilities of multiple installed sensors, acquiring big data that are read by a computer system. Then, the computer system is capable of optimizing the whole operation of the sail (i.e., rigid or Flettner rotor), increasing the total efficiency of the system. Both sails have finished sea trials.
3.4. More Conventional Ideas Already Implemented or Close to Implementation in the Last Five Years
Above was mentioned a complete example of a green ship, combining solar and wind power, having an optimizing control system that monitors and optimizes the rigid sails, calculating the wind direction and the solar radiation, simultaneously reducing the emissions, and finally having a battery system of 95% recyclable batteries. Although the example of the EcoMarinePower (EMP) ship is still in research and trying to implement more technologies, there are more current examples of ships that have managed to implement, or are currently implementing some of the latest technologies contributing to the global demand of cutting down emissions.
First, E-Ship 1 has successfully implemented the Flettner rotors since 2010. The vessel is owned by one of the largest wind manufacturers and has been built to transport wind turbine components, and was built at two different shipyards in Germany. The technical characteristics of the ship are a length of 130 m, beam of 22.5 m, maximum speed of 17.5 knots, and engines of total output 3.5 MW. It uses four 27-m high and 4-m diameter Flettner rotors that save around 35% of the fuel consumption [
51].
The first electric cargo ship was launched in 2017 in Guangzhou, China [
52]. The vessel is 70.5 meters in length and travels in the inland section of the Pearl River, covering a distance of around 80 km with a single charge. In battery capacity, this translates to 2.4 MWh and 2-h charging time. The batteries are made of lithium and able to provide power for transporting 2000 metric tons of goods. The electric power required for the ship’s movement is not only more environmentally friendly, but also cheaper compared to the fossil fuel power. In addition to that, further battery installments are proposed that will raise the maximum cargo that the ship could carry to above 2000 tons.
Electric shipping is not only implemented in Asia, but in the European Union (EU), too. One of the first the first all-electric ferry was launched in Sweden. There is quite an interest in the city where these ferries were introduced. The Swedish city of Gothenburg is a great example of a low-emission city, trying to implement any new technology contributing to that goal, through the ElectriCity project. The ferry is expected to enter commercial service by the end of 2020 [
53]. Another all-electric vessel is expected to be commercially ready, but this time it is a small cargo ship. The all-electric inland vessels are being built by a Dutch company. The initial plan was to start operation of the electric inland vessel in August 2018, but until now, no solid proof could be found. However, the plan includes five small and six large electric container badgers that are being built and will be used to travel between the Netherlands and Belgium. These vessels are not only all-electric, cutting emissions down to zero rates, but also autonomous. This characteristic offers an additional 10% cargo capacity and will be implemented after the first years of operation, during which it will operate with an on-board crew. The first electric inland vessel is 52 m long and contains a large lithium battery that is 6 m long, which makes it possible to sail for 15 h, carrying around 400 tons of goods. According to Port-Liner, these vessels will be able to successfully substitute over 20,000 diesel vans annually, which are currently trading the products between the Netherlands and Belgium.
However, the above vessels are not the only autonomous electric vessels. The Yara Birkeland according to [
54,
55], will be the world’s first autonomous electric vessel. This vessel is going to travel between ports in Norway, substituting for the use of diesel-powered trucks and vans. The vessel is 70 m long and 14 m wide, with a carrying capacity of 120 containers. Its battery system has a capacity of 7.5–9 MWh, making it capable of only short-route traveling, and it will be fully operational by 2022.
3.5. Importance and Development of Battery Storage Systems
It should be clear by now that whether the conversation is on integrated systems that exploit wind or solar energy, and whether these technologies are currently on trial stage or already commercially operating, the computer system that manages all the data plays a vital role. Digitalization has given birth to numerous new capabilities, but at the same time, the reliability of the computer system has become of great importance [
56,
57,
58]. Furthermore, digital equipment requires electric power from a reliable on-board source. These facts could possibly give further motivation for electric propulsion in the naval sector. For example, a modern vessel with many installed sensors and an integrated system of operational optimization would require a battery storage system. Such a system is also mandatory if a vessel has photovoltaics installed or an electric propulsion system, as it will require power that could, among other ways, be provided from batteries.
Additionally, as mentioned above in
Section 3.4, there are companies and projects that consider electric propulsion. In these vessels, the battery storage system is of paramount importance, as it works as the main source of power for all the electrical and electronic systems. Even as the main power source for propulsion, in the case of electric propulsion vessels, the battery system also generates propulsion power. Therefore, a more detailed presentation of the different types of batteries is being included in the present paper, as shown in
Figure 6. Starting by the battery types that are already used in the maritime industry according to [
59,
60,
61,
62,
63,
64,
65], a draft of the different marine battery types is presented.
From
Table 1, it becomes clear that for a battery system based on batteries that are already used in the maritime industry, in order to provide 10 MWh under the most ideal circumstances, the weight will theoretically surpass 100 tons. This hypothesis will play a significant role in the present paper, specifically in the calculations in
Section 4, where the appropriate battery storage system, in order to meet the biggest possible percentage of the vessel’s energy needs, is chosen.
Although battery storage in the naval sector is very promising, there are discussions concerning the environmental impact of large-scale batteries entering the energy storage sector. According to [
66], the environmental impacts of large-scale battery use remain a major challenge that requires further study. In this paper, batteries from various aspects including design features, advantages, disadvantages, and environmental impacts were assessed. This review reaffirms that batteries are efficient, convenient, reliable, and easy-to-use energy storage systems (ESSs). However, it also confirms that battery shelf life and use life are limited. This fact translates to a large amount and wide range of raw materials, including metals, non-metals, and rare earth elements, which will be used to produce batteries. This results in the generation of considerable amounts of environmental pollutants (e.g., hazardous waste, greenhouse gas emissions, and toxic gases). These pollutants will be generated throughout the entire life cycle of the batteries, during different processes such as mining, manufacturing, use, transportation, collection, storage, treatment, and disposal [
67]. Apart from the environmental impact, large-scale batteries are forecasted to create significant social impacts.
This negative impact of large-scale battery usage and development could significantly alter their implementation in the naval sector. Thus, a draft presentation of a possible partial solution in the present paper is justified. One of the six different battery types already used in marine and offshore operations has the advantage of being recyclable. More specifically, these hybrid batteries are safe, reliable, easy to install, and have comparable performance to lithium-ion batteries. Additionally, they require no dedicated cooling system nor complicated protection equipment, with the additional benefit that they are up to 95% recyclable
Figure 7 [
61]. So, based on the above, it becomes clear that batteries are being thoroughly researched (although they are considered a mature technology) not only for increasing their efficiency and technical capabilities, but also for their environmental impact. Batteries are in the epicenter of technological experiments, prototypes, and during implementation and commercialization.
4. Calculating onboard PVs and Battery Capacity
The table below includes all the symbols that will be used in the present section and their definitions,
Table 2.
As it has already been mentioned, the total power needed for a ship’s operation depends mostly on the category to which this ship belongs (cargo, ferry, cruise, etc.). Hence, the number of solar panels in order to produce the required power differs. Due to that, the present research investigates ships that belong in different categories.
Apart from the difference in power requirements among ships from different categories, there is also an important difference concerning the produced power by the solar panels. To be specific, it is commonly known that solar radiation is not constant, neither throughout the day, nor throughout the year. Furthermore, the duration of sunlight varies significantly depending on the season of the year and the area of the world. Therefore, two different methodologies exist when calculating solar radiation. The first is to calculate the radiation for an average day of the year, with average weather and at an average geographical sea location. The second is to decide a specific case scenario, on a specific location and time of year, and use the regional available weather data.
Each methodology has advantages and disadvantages. In the present research, the second way is chosen. Specifically, the location chosen is in the Aegean Sea (Greece), in the area near Attica, and the time of the year is an average day of July. A summer month was chosen, because during that period, tourist activity—and thus ship travels—reaches its peak. Additionally, this is also when solar radiation in the area is the strongest.
For an average day of July in the Aegean Sea near Attica, solar radiation equals [
68]:
In our days, solar panels have had the biggest technological advancements. The peak efficiency of a solar panel can reach 22.2%. In the present research, a panel of 22% efficiency, 1.6 m
2, and 18.6 kg is assumed. The efficiency could be considered utopic, but is selected as such on purpose. If this proves insufficient, then PVs can be considered incapable of powering a ship’s power requirements wholly or at least significantly. Knowing the efficiency of the panel, the area of it, and the solar radiation available gives the total power output of the panel
Pp:
Having calculated the power that a solar panel can produce leads to finding how many panels are required in order to power a ship. Of course, installing an on-board PV system fully covering the operational power requirements of a ship would be extremely difficult, if not impossible, with the current commercial and industrial technology. Such an installation would require a large number of panels that would not be able to fit on-board. The panels must face the sunlight, and that means being placed on the top of the ship.
As mentioned before, there are many ship categories with different specs, different power requirements, and thus different required PV installations to cover a fixed percentage of their power needs. Additionally, the architecture of the vessel plays a decisive role in the feasibility of such an installation. For example, a LoLo (Lift on Lift off) vessel or a cargo etc., is unable to install PV on the deck, and the only available space is on top of the bridge.
Starting from the category of cruise ships, a specific one is chosen for comprehensive reasons. The results and conclusions for that ship will also refer to other ships of the cruise category.
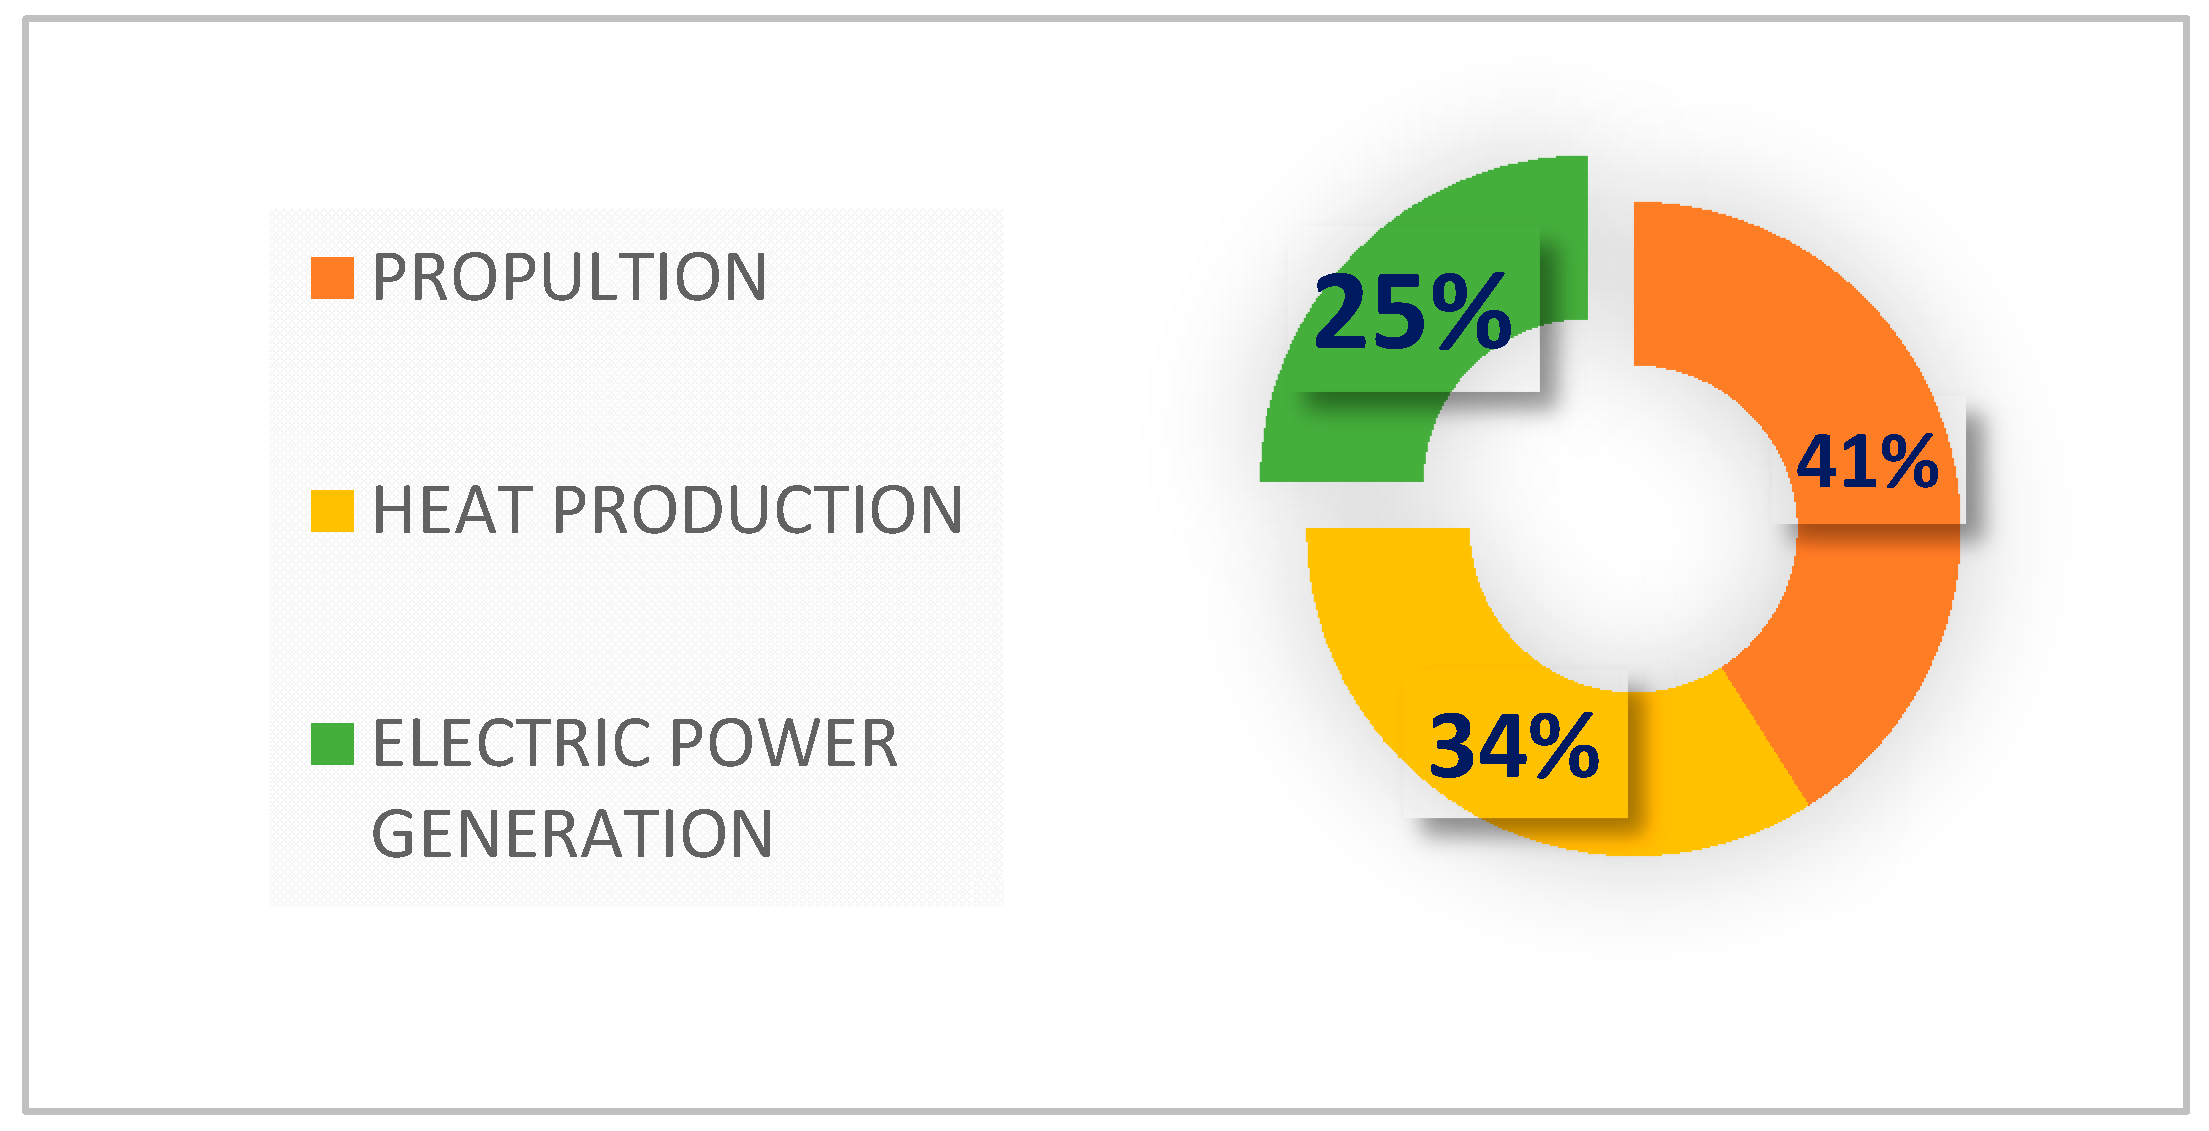
The cruise ship chosen is the
Voyager of the Seas with a length reaching 311 m and 47 m width [
69]. The Voyager’s capacity is 3184 passengers plus the required crew. The total power output of the ship’s engines is around 75.6 MW. The distribution of that power is around 41% for propulsion, 34% for heat production, and the rest is 25% for electric power generation, as shown in
Figure 8. So, the actual power needed to cover the electric needs of the Voyager,
Pe, is around 18.75 MW.
The Voyager, being a luxurious cruise ship, has a great variety of outdoor activities, leaving no room for even the smallest solar panel installation. As a result, it cannot incorporate power production with solar panels. Nevertheless, other ships with similar size and power demand to Voyager’s could theoretically install solar panels at their top. For such ships, taking the Voyager as an example, in means of size and power needs, an average available area on the top deck
Adeck is around 10,500 m
2. Where:
where
Lshipu, Wshipu are ship’s useful length, width.
The particular available area could accommodate around 6562 cramped solar panels of 1.6 m2 each. The calculation of the power output of each panel results in a total power output of 1.234 MW from all the installed panels. That amount of power equals 1.6% of Voyager’s total required power, or 6.6% of the power required for electricity production.
It is clear that even if there was space available, and thus a capability of installing solar panels in Voyager, the amount of the power produced would be insufficient to cover even 7% of the electrical needs, or 2% of the ship’s total power demand. That is a contributing factor that leads the present research to different type of ships.
The next category of ships that will be researched is passenger/RoRo cargo ships. Such ships are commonly used for commercial purposes, carrying a big number of passengers and cars for journeys ranging from 2 to 9 h. The main difference between cruise ships and ferries is that the latter are smaller, not only in terms of length, but also in number of docks. Furthermore, ferries do not make any particular use of the top of the ship, especially the kind of use that could make the installment of solar panels impossible. For the above reasons, the possibility of an efficient installment in a ferry ship is greater than that in a cruiser.
As with the cruise category, where a specific ship was chosen, the same logic applies to the ferry category. The chosen ship is the Nissos Mykonos, Hellenic Seaways, which is is 141 m long and 41 m wide. Assuming that the useful length and width, in terms of installing solar panels, are:
The useful area for panels to be installed is ATP = 5130 m2, which translates to a total of 3206 solar panels. That amount of panels will have a total output of almost 0.6 MW. Noticeably, the ferry’s power consumption is significantly smaller than Voyager’s. The exact amount of the total power required by the Nissos Mykonos is 32 MW. Taking into account that the ferry is providing the same kind of services with a cruise ship, but on a smaller scale, a similar power distribution can be assumed. Hence, knowing that 32 MW is the total power required, leads to an approximate 8 MW required for electrical generation.
Therefore, an installation of solar panels at the top of Nissos Mykonos would theoretically cover 1.88% of the total power, or 7.5% of the power needed for electricity generation. These results, although being satisfactory, are far from being able to provide even half of the total power required for the ship’s operation. By focusing on the optimistic idea of having commercial ships operating only on solar energy, another idea emerged.
A PV system would certainly require battery storage through which energy will be provided to the ship. Therefore, it is assumed that batteries are an essential installation. However, if the batteries had a bigger capacity, they could store more energy than just the amount provided by the solar panels. The available space on a ship, as mentioned before, forbids the installation of more panels to cover a bigger percentage of the total power requirements, but doesn’t forbid the installment of more batteries. It is worth mentioning that cruise ships, as well as RoRo–passenger vessels, are among the most power-intensive vessels. The average power of the engines of such vessels is able to power small cities. In addition to that, they do also have higher electricity needs compared to other vessels. Therefore, satisfactory battery installments for cruise or RoRo–passenger ships could also be appropriate for other vessels such as cargo, etc., which have significantly smaller power needs.
The new scenario consists of two main parts. Part one considers the installment of a battery system that is quite large in order to be available to provide a substantial amount of energy. Part two considers separating the production of power—the solar panels—from the storage system: the batteries. The main idea is that having the batteries on board the ship is essential; however, charging them can happen either on board or off board as well. Expanding on this, there could be a charge point in each port; then, once the ship docks, it could charge with the required energy for the upcoming trip.
On this occasion, once the ship reaches the port, it could plug in and charge. The amount of energy drawn while charging could power the ship’s needs for travel. There will also be additional power entering the batteries coming from the solar panels placed on the top of the ship. In order to calculate all the above things, such as the capacity of the installed batteries, the area they cover, their contribution to the total energy required for a specific trip of the ship, etc., a specific kind of batteries and ship should be chosen. As far as the ship is concerned, the research will focus on the Nissos Mykonos, Hellenic Seaways. For the batteries, the criteria of selection were: maximum power output, total capacity, feasibility of installment, and energy capacity to area ratio. Reminding the different types of marine batteries already operating in
Figure 6, the best energy capacity to area ratio was that of the lithium poly-battery. However, lithium-ion batteries are also being used in marine operations. Therefore, the battery system selected for the present research in none of the six types already presented, but another—again, a lithium-ion battery—used on shore for grid energy storage. The prototype battery system is placed in Escondido, California [
70]. The system has a power output of 30 MW and a total capacity of 120 MWh. These numbers show that the system provides enough energy, which makes it a considerable idea. Moreover, as far as the feasibility of the installment is concerned, the system consists of 19 containers. Each container has a total capacity 6.316 MWh, and a total of 120 MWh is provided by 19 containers. The length of each container is about 13 m, so a total of 19 containers will occupy a significant, even forbidding amount of space on the ship.
For the above reason, a total of nine containers is chosen. These containers have a total capacity of:
Reminding the power requirements of Nissos Mykonos, P
NMHS = 32 MW, in order to find the percentage that the battery system can cover, the duration that the ship is going to operate is required. For example a four-hour trip will require half the energy of an eight-hour trip. Assuming a seven-hour trip, T
trip, the energy requirements of the Nissos Mykonos, E
NMHS, will be:
So, the percentage of the batteries system contribution to the total energy needed by the ship is around 25.4%, and 101.6% of the energy required for the electricity needs.
Respectively, for a four-hour trip of the Nissos Mykonos, Hellenic Seaways, nine containers provide 44.4% or 177.6% of the total energy for the trip or the electricity needs respectively.
It is important to clarify that the required energy is calculated, assuming that the vessel’s engine is operating at maximum power, utilizing entirely its 32-MW engines, throughout the trip. Within shipping, ships usually operate at the nominal continuous rating (NCR), which is 85% of the 90% of the maximum continuous rating MCR. The 90% MCR is usually the contractual output for which the propeller is designed. Thus, the usual output at which ships are operated is around 75% to 77% of the MCR.
Ferries especially belong to the category of vessels that do not travel at their maximum power. Instead, they very often follow a slow steam (strategy), reducing the fuel consumption to a minimum. The energy required from the battery storage is even less a cause of real NCR, and is using the maximum power of the engines. However, the power stored in the battery system must be converted into propulsion through an electric motor. These transformation from power to propulsion has losses, but these are significantly smaller than those of a fuel engine. Electric motors can easily achieve 85+% efficiency [
71,
72]. Nowadays, electric motors for cars reach 93%, and will soon reach 97% efficiency. Assuming 90% efficiency of the motor, it means that 10% of power is lost, but this is counterweighted by the MCR-NCR difference, leaving 10% plus the energy savings by slow steaming. That final 10+% of energy saved can be counterbalanced by the battery capacity efficiency, which can vary from 85% to 95%.
5. Qualitative Assessment of a Battery-Powered Maritime Industry
The quantitative analysis above along with the state-of-the-art technologies show that a battery system propulsion is technically feasible. However, when it comes to commercial technologies that could disrupt an entire sector through bringing significant changes to it, technical feasibility is just a necessary precondition. Having reassured that, the most decisive factor is the economic viability of the technological solution at hand.
The constantly growing market of batteries is surely coming along with huge costs. The very nature of batteries, the required raw material, the technology, and the manufacturing process are still considered affordable but relatively expensive. Nevertheless, recent technological developments and the market growth are driving these costs down, and as a result, batteries, along with renewable energy sources (RES) such as solar, wind etc., are becoming cheaper [
73,
74,
75].
Despite the falling costs of batteries, the alternatives remain cheaper and hence more competitive. In addition, the maritime sector does have specific characteristics that affect the feasibility of different power sources. Starting with the high power output requirement as a result of a vessel’s power needs, which are high compared to those of other electric vehicles such as bikes, scooters, or cars. Such power output requirements tend to be cheaper and more easily achieved by fuels instead of batteries, since the first have bigger energy density (MWh/kg fuel). However, the situation is more complex. As far as the concern is on reducing emissions, it is clear that in the maritime sector, alternative fuels might have an advantage. Yet, reducing emissions is not the long-term goal, but a short-term transitional stage toward zero emissions. Important players of the maritime industry such as the UK do already plan ahead for a zero-emission maritime industry by considering optimistic forecasts and imposing strict regulations.
The latter cannot be achieved by fuels such as LNG, LPG, etc., or alternative fuels such as hydrogen, ammonia, or methanol, because although they do reduce the emissions, they still cannot reach absolute zero, apart from hydrogen, which could in the future become a totally zero-emission fuel. The only fuels that could still be in accordance with the upcoming regulation about zero emissions shipping would be bio-fuels. Even though these, similar to other fuels, do produce emissions when burnt, these emissions do not burden the atmosphere with additional CO2 because they come from the atmosphere in the first place. Bio-fuels come from biomass that contains CO2 captured by the plants through photosynthesis.
In the short-term to mid-term future of the maritime industry, there exists a high possibility scenario of an emerging competition between batteries and bio-fuels. Both alternatives come with advantages and disadvantages, and it is worth mentioning the most important among them. Starting from the batteries, the continuous growth of the electrification of our society along with the growing penetration of RES into the energy mix facilitates the further penetration of batteries. Among the latest trends in the energy sector are smart grids, where RES play a significant role, and along with digitalization and distributed grids, require large-capacity, trustworthy storage battery systems, mostly for energy security reasons.
The downside is that while electrification and RES both face growth, inevitably the same happens with electric energy demand. Incorporating batteries as the exclusive means of marine propulsion would dramatically increase the electricity demand, affecting the whole energy sector. Forecasts do provide some valuable insight, stating a possible increase in electricity demand around 1150.0% in a scenario where batteries will not become the main propulsion of the maritime industry, and an increase of 15,400.0% [
76]. Satisfying such a demand is uncertain, and if possible, would require significant changes. Continuing this qualitative analysis, it should not be overlooked that over time, energy is having an integral geopolitical-strategic essence [
77]. Batteries consist of rare earths; hence, a multiplied electricity demand that will require numerous battery systems translates directly to a multiplied demand for rare earths, which are difficult to locate and to mine [
78]. This is one of the reasons that in the battery sector, minimizing the rare earth requirements of batteries is a key objective. In the rare earth market and even more in the battery sector, China is by far the undisputed leader [
79]. A completely battery-powered maritime sector could possibly be dependent on China, in the same way that we used to be dependent on the Organization of the Petroleum Exporting Countries OPEC or the EU states on Russian natural gas [
80]. Such a dependency could be even stronger than that between EU–Russia, increasing the possibility of geopolitical and economic implications to emerge. China has the largest rare earth reserves in the world, and has become the largest producer and exporter, as shown in
Table 3.
In 2018, according to
Table 3 from the U.S. Geological Survey, the reserves in China accounted for 36.7% of global reserves and produced about 70.6% of the total world output. History can teach us on this dependence, specifically the event of July 2010 when China’s Ministry of Commerce announced that it would cut rare earth element (REE) exports by 72% for the second half of 2010.
On the other hand, a corresponding growth and penetration of bio-fuels in the maritime sector is probably unfeasible. Most of the core sectors are interconnected, and this is the reality for the maritime industry with transportation and specifically aviation. In that occurrence, when considering bio-fuel usage for propulsion, the two sectors are inversely proportionally interconnected. Bio-fuels currently in use belong in the second generation of bio-fuels, meaning that they are produced from edible biomass [
82]. That is creating an upper boundary in the production capacity of bio-fuels, because they indirectly occupy cultivable land. There is still room to reach that boundary, but apart from this, bio-fuels might be more suitable to be serve the aviation and the heavy duty vehicles industry rather than the maritime industry [
83,
84].To render the complete picture, it is worth noting that developments in third-generation bio-fuels, which come from non-edible plants and note requiring cultivable land, could face the problem of the upper boundary unlocking bigger capacities in fuel produced. Third-generation bio-fuels are very promising, but if they will manage to become commercial remains to be seen.
6. Conclusions
Through the present paper, it became clear that solar energy alone is unable to cover the power needs of commercial ships such as cargo, bulk, tanker, cruiser, or passenger, at least with the current technology. However, it is able to cover a small percentage—near 10% of a passengers–cargo RoRo vessel’s electricity needs. That results in saving fuel and cutting down emissions from the auxiliary engines or saving power from the shaft generator. Having in mind the constantly dropping prices in solar technology, such an installment could possibly be sustainable.
Although solar does not qualify for a main marine power source, electricity might. An electric vessel, with a big enough battery capacity and an electric motor, can cut down emissions significantly. On the other hand, although battery technology has had growth, it is not enough to counterweight its biggest problem: its duration. Ships that carry noble weight or/and have exhausting electricity needs, such as passenger cargo ships, or ships that travel long distances non-stop, cannot rely entirely on battery propulsion for their needs. There seem to be three ways around the problem. The first is to have battery-powered vessels for smaller distances such as ferries, small cargo such as the case of small cargo vessels between the Netherlands and Belgium, and the first already operating, all-electric small cargo in China. The second way is to make frequent recharging stops in ports or install huge capacity battery systems in vessels that have big travel ranges. The last option is to have hybrid vessels that, when their battery system’s capacity is exceeded, will run on fuel or any other zero-emission vessel (ZEV) technology such as hydrogen, ammonia, and bio-fuels.
Another interesting observation is the variation of vessel kinds from cargo to passenger. Each category has different capabilities and needs for implementing battery systems. For example, ferries can be equipped with smaller batteries to provide all-electric short trips, cruise ships not carrying cars, and cargo ships, and can have a fully electric powered system with a large battery capacity, inverters, electric motors, and even hybrid engines. However, cruise ships cannot make use of PVs, because the top of the vessel is occupied for outdoor activities, while ferries RoRo and/or passenger ships do not face that obstacle.
One of the most important conclusions is that electric ships, fully or hybrid, could change the environmental impact of the maritime business. However, there is also the economic feasibility aspect, where strong objections occur. Battery technology does not seem to be competitive yet in terms of performance and cost, in order to be preferable to synthetic fuel options, mostly when referring to mid or long-range travel. However, the case of battery-powered vessels is quite the opposite, in terms of feasibility and affordability, when it comes to small-range travel or shipping. The strongest proof of the feasibility and viability of electric ships in that case is the effort that has been put from numerous companies varying from smaller ones to the biggest players in the maritime industry. However, it is very important to understand, apart from the techno-economic nature of batteries penetrating the maritime industry, the strategic nature of such penetration. The impact could be such that might even affect the geopolitical balances that currently exist. Inevitably, environmental taxes will further affect the shipping sector, in less than a year, along with the gradually stricter environmental targets. Finally, although ZEVs might currently seem visionary and optimistic at the present, in the long term, they are probably the only option.


