Abstract
The energy performance of residential and commercial buildings is a vital topic because of the rapid urbanization occurring throughout the world. Accommodation buildings are considered energy intensive compared to other commercial facilities. In addition, they are the main component of the tourism industry. Therefore, various actions and policies have been introduced to improve the energy performance of accommodation buildings. This research depends on a national scale database of energy consumption of commercial buildings in Japan. It is the main source of data to conduct this study. The Database for Energy Consumption of Commercial buildings (DECC) is a national survey that is provided by the Japan Sustainable Building Consortium (JSBC). Based on the DECC, the study presents a general benchmark which is developed by applying regression and artificial neural network (ANN) methods to assess the energy performance of accommodation buildings in the Kanto region, Japan. The study presents a broad benchmark to evaluate basic energy consumption of accommodation building with three variables. In addition, the study highlights the necessity of designing the ANN model through the choosing of hidden layers and training method. The outcomes of each learning method and hidden layer was examined using main indicators to verify its accuracy.
1. Introduction
Recently, rapid urbanization has increased energy use demands in the building sector. The energy use of buildings has steadily increased worldwide, achieving between twenty to forty percent of total energy in developed countries.
Due to the complexity of the energy systems of buildings, it is difficult to achieve accurate analyses. This is because of the variety of energy types and building categories. For instance, the main energy forms are consumed by condition load, hot water, lighting, and ventilation. The building categories can be classified into commercial, residential, and industrial buildings, differing from small rooms to large assets. At the same time, the energy systems of buildings are affected by different variables, such as weather conditions, building structure and properties, users’ behavior, and the operation of sublevel components like cooling, heating, and lighting systems.
The building sector has a greater potential to improve energy performance than other sectors. Therefore, reducing energy use of buildings is a main goal for various firms at local, national and global scale.
Commercial buildings contain a wide range of building categories such as offices, health care, sport center, retail, lodging and public building. These categories have special energy requirements depending on their substantial function. In general, electricity and natural gas are the main sources of energy within commercial buildings in Japan.
Accommodation Facilities are more energy intensive than other types of commercial buildings in a majority of countries. In addition, it is an essential element of the tourism industry along with transportation and other tourism components.
Accommodation buildings have significant environmentally impacts because of their large consumption of natural resources and production of waste [1].
Benchmarking energy use is a useful tool to evaluate the energy performance of buildings. It enables managers to compare the energy performance of their own buildings with that of other peer buildings. They can improve the energy use of buildings by understanding the what, why, when, where, and how of a building’s energy use [2].
This study utilizes DECC as database to model the energy performance of accommodation buildings since few studies tackled this issue in Japan because of the limitations of data and complexity of this sector.
2. Literature Review
2.1. Energy Use in Buildings and Its Environmental Impact
Building is a basic requirement for human activity and is an essential component of sustainable development. The multiple functions of the accommodation facility require different forms of energy supply. Therefore, electricity, diesel, and LPG are used as the main sources of energy within accommodation buildings in Japan.
Both of electricity and gas provide 36% and 51.1%, respectively, of the entire energy use in Ottawa hotels, while steam represents the rest [3]. The cold climate causes greater consumption of gas for heating rather than consuming electricity. On the other hand, electricity records more than 70% of total energy demand in Hong Kong and New Zealand hotels [4,5]. The facility classification determines the intensity use of certain energy form. For instance, Vietnamese resorts and 4-star hotels consume less electricity than other 2- and 3-star hotels [6].
The accommodation facilities have a negative impact on the environment because of the use of natural material and its waste [1]. The environmental traces of accommodation facilities can be recognized in air, soil and water [7]. For example, two groups of European hotels annually emitted about 200 kg of CO2 per square meter of room in the air, every night each guest discharges 1 kg of waste in the soil and 170–440 L of water [8]. In addition, the growing of the tourist industry worldwide increases the usage of energy and other resources significantly. This growth obviously points out the impact of accommodation buildings on the ecological system and land-use dynamics [9,10].
Therefore, accommodation facilities are energy intensive and have a higher environmental footprint than other commercial categories [11,12,13,14].
Based on the previous findings, more concerns have been raised to investigate energy consumption and the environmental impact of the accommodation sector [15]. At the same time, significant efforts take place to encourage sustainable tourism [16]. New policy and sustainable practices have been adopted to improve the performance of accommodation facilities [17].
2.2. Accommodation Buildings in Japan
Japan imports 91.3 percent of its energy supply. After the oil crises of the 1970s, Japan has taken actions to promote energy conservation, find alternatives to petroleum, and secure a supply of petroleum. However, after the Great East Japan Earthquake, the percentage of fossil fuels has been increasing as a substitute for nuclear power as fuel for power generation [18]. Nowadays, despite actions for decreasing dependence of energy imports, Japan is still considered to be one of the most volatile countries in the world. Therefore, different organizations and government-firms, public institutions, economic agencies and researchers raise concerns about energy security [19]. The law was established in 1980 and has been amended in 1993, 1998, 2002, 2005, and 2008. Every time it was adapted the regulatory requirements have become stricter in scope and obligations. It covers large facilities consuming more than 1500 kl in crude oil equivalent per year (approximates 3000 t-CO2 per year) are regulated. The regulated firms sum up to more than 14,000 facilities and their energy consumption consist of 90% in industrial sector, and 10% in commercial sector [20].
The energy conservation standards for housing and building were first established in 1980 as a part of the revised Energy Conservation Act. These energy conservation standards are called the “Standard of Judgment” in the Act. The “Standard of Judgment” is a set of regulatory reference standards and the construction clients that housing and buildings that fall in the designated group under the Act are recommended to use in implementing their energy conservation obligations as mandated by the Energy Conservation Act. The key obligation includes an annual report on energy conservation measures which shall be submitted by regulated construction clients of housing and building to the government. Since the inception, there were several revisions of the standards regarding this sector in 1992, 1999, and 2012. In the Basic Energy Plan published in 2014, the government plans to strengthen these standards for building and housing towards 2020 in a step by step approach [21].
The direct contribution of Travel & Tourism was 2.4% of total GDP in 2014, and is assumed to rise 2.8% of total GDP in 2025. The total contribution of Travel & Tourism to GDP was 7.5% in 2014, and is forecasted to rise 8.1% in 2025. In addition, Travel & Tourism directly supported 1,152,500 jobs (1.8% of total employment). The growth is expected to rise by 2.2% of total employment in 2025. Travel & Tourism investment in 2014 was JPY3341.8 bn, or 3.1% of total investment. It should rise to JPY4018.1 bn in 2025 (3.2% of total) [22]. In Japan, the increase in commercial sector energy consumption is almost fully caused by the increase in the total floor area of commercial buildings [23]. Energy consumption of the hotel sector in Japan has been specified as one of the larger energy consumers among commercial buildings with about 3421 MJ/m2 annual load [24].
2.3. Modeling of Building Energy Consumption
Energy performance of a building is affected by many factors in different levels, such as climate zone, building structure and properties, and occupants and their behavior [25]. Because of the complexity of the energy systems of buildings and the necessity to obtain an accurate prediction of usage, a large number of approaches have been proposed to solve this complicated issue, including both elaborate and simple methods. These methods are used in different applications, such as designing new buildings and operations or retrofitting existing buildings. Engineering, statistics, and artificial intelligence are used to model and estimate the energy use of buildings [26]. Many software programs have been developed for assessing energy consumption in buildings, such as Energy Plus [27,28]. Although these tools are accurate, they have some difficulties related to detailed parameters as inputs and require a high level of experience to ensure effective usage [29].
Statistical models, such as regression method, are commonly be used for building energy assessments [30]. These models correlate energy consumption with effective variables and depend on historical data. While this is an easy method to use, it is less accurate.
Artificial intelligence methods are widely used to solve nonlinear problems and complex applications. Artificial neural networks (ANNs) and support vector machines (SVMs) are the most widely used models applied to building energy predictions [31,32].
Recently, many studies have used ANNs to model different categories of building energy consumption for various categories of buildings in different climate zones [33,34,35,36]. The input data require specific processing to remove noise and useless variables to achieve the best training results. Some research has focused on the preprocessing stage of input data [37]. The output of ANNs may not be close to expectations or not accurate. Therefore, some correction or calibration is needed to achieve high accuracy outputs [38].
Some comparisons have been made between ANNs and other prediction models, such as regression models [39,40,41], or engineering models [42].
3. Data and Method
A comparison study has been done to validate the benchmarking of energy consumption of accommodation buildings in Japan. The regression model was used to formulate the benchmark equation, and ANNs were used to validate the regression model, since ANNs have more accurate predictions. Both the training method and hidden layers of ANNs were chosen carefully to obtain high accuracy results. Three fit measures, namely, mean square error (MSE), mean absolute percentage error (MAPE) and the coefficient of efficiency (R) were adopted to evaluate the model performance.
The study depends on three main variables which are electricity, gas and water. These variables were selected because of several considerations, such as that the DECC database of accommodation buildings contains some other variables, but there is no good correlation with energy consumption. DECC does not have information regarding HVAC and the behavior of guests. Therefore, the future step for this study is to collect more details for some samples in Japan.
Generally, Japanese accommodation buildings depend on electricity and natural gas for lighting, air condition and hot water supply. In recent years, more buildings have come to depend on natural gas turning on heating and cooling equipment.
3.1. Database of Accommodation Buildings in Kanto
The Database for Energy Consumption of Commercial building (DECC) is a national scale survey that provides energy consumption data for 38,273 samples of commercial buildings from 2006 until 2012.
The Kanto region is one of eight segments of DECC survey, the survey contains 24 types of commercial facilities. As shown in Figure 1, green color segment represents Kanto region, which has the highest annual primary energy comparing to other segments. In addition, Kanto region has the largest floor area of accommodation buildings of DECC, which is five million square meters.
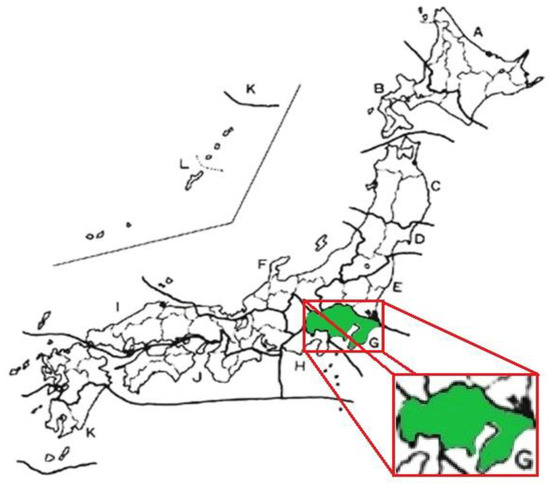
Figure 1.
Main regions of DECC samples. The green area is the Kanto region (Source: JSBC).
Because of the variety of accommodation samples, it is more accurate to cluster samples into similar groups. Using K-means method, the samples have been grouped into 5 clusters based on their primary energy method, as shown in Table 1.

Table 1.
Clusters of DECC samples.
3.2. Eenrgy Benchmarking
Benchmarking energy performance helps energy managers to identify best practices that can be replicated, either within a building or across a portfolio of buildings. Benchmarks can be reference points for measuring and rewarding good performance, as they allow an organization to identify top-performing facilities for recognition and to prioritize poorly performing facilities for immediate improvement.
The most commonly used statistical method to develop benchmark tools is the linear regression technique. It is a statistical method used to model a linear relationship between a scalar dependent variable ‘y’ and one or more explanatory variables indicated by ‘X’. Regression modeling is an easy method to estimate energy use intensity (EUI) for benchmarking purposes. Clear correlation between affected variables and energy consumption has to be recognized to ensure accurate estimation and a useful benchmark.
The regression model is used to develop the benchmark Equation (1) for the energy performance. The benchmark formula estimates energy use intensity (EUI) based on affected variables such as electricity, city gas, and water consumption.
Energy use intensity (EUI) unite is (MJ/m2) per month, year, room, person or other similar indicator, it can be normalized base on building function or the purpose of study.
where α is the intercept; b1, …, bk are the regression coefficients; X1, …, Xk are the significant standardized factors; and ε is the random error.
The examined factors are selected based on their impact on energy intensity; other factors are neglected because they have less effect or an unclear effect on energy use in this category of buildings.
Artificial neural networks (ANNs) imitate the working principles of human brains and perform learning and prediction. They are structured like a nervous system and are based on biological learning. In this study, an ANN was trained and tested using the software MATLAB. MATLAB provides built-in transfer functions that have been used for the hidden layers and outputs a pure linear function for the output neurons. The output of an artificial neuron can be mathematically expressed using Equation (2):
where y is the output of one neuron, h is the number of hidden layers, W is the connection weight, X is the input data, b is the bias value and f is the transfer function.
ANNs is common method to model different categories of building energy consumption in a variety of conditions, such as heating/cooling load, electricity consumption, sublevel component operation and optimization, and estimation of usage parameters.
In Figure 2, the topology of the MLP network shows the input and output of the ANN model for current study.
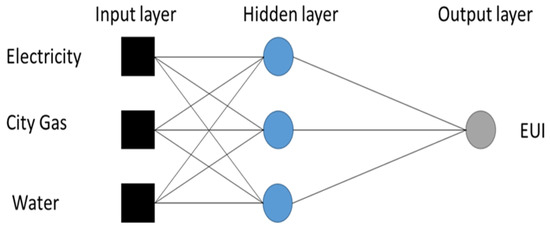
Figure 2.
Topology of a fully connected three-layered MLP network.
The ANN model in this research used the following inputs: Electricity, gas, and clean water consumption from the DECC data of accommodation facilities in the Kanto region.
4. Results and Discussion
4.1. Regression Model
SPSS is the software used for statistical analysis in the current study. It has been used to relate independent parameters with dependent parameters in a regression model. The primary energy is a dependent variable in this study that represents the energy intensity of selected samples, and the independent variables are electricity, gas and clean water consumption. Figure 3 illustrates the predicted value of DECC clusters using the regression model.
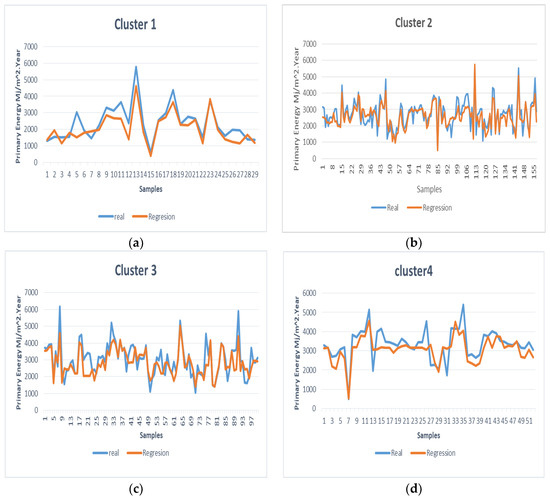
Figure 3.
Prediction results of regression model; (a) cluster 1; (b) cluster 2; (c) cluster 3; (d) cluster 4.
In Figure 3a cluster 1 has low number of samples (29). The predicted value of primary energy has less values than real values, which means the performance of these samples is not efficient. In this case, more efforts have to be done to improve or modify the energy plan. The coefficient of variation (CV) value was an average of 0.1 for this cluster. Cluster 2 has 157 samples of DECC database as shown in Figure 3b, the coefficient of variation CV = 0.08 as average. The predicted value is less than the real one, which means the energy performance of these samples is still not sufficient but it is better than the previous case. In Figure 3c, cluster 3 has sufficient size of samples (97) and has less variance between predicted and real values CV = 0.11. Last cluster has (51) samples and shows good results compared to cluster 1 as a small size of samples, it is illustrated in Figure 3d and it has a good value of coefficient variation where CV = 0.1.
The main aim of using the regression model in benchmark processing is to determine the regression impact of each variable on the primary energy. These values of impact will be used in the general equation of benchmarking (1). This equation introduces a reference for energy evaluation between similar buildings within same cluster. The regression model defines the benchmark equation for DECC data as the following:
where X is the electricity consumption (kWh/m2·year), Y is the city gas consumption (m3 × 10−3/m2·year), Z is the clean water consumption (m3/m2·year), and EUI is the energy use intensity (MJ/m2·year).
4.2. ANNs Model
ANNs are one famous method to predict the energy consumption of buildings. In the current study, the Neural Network toolbox of MATLAB software was used for applying the ANN model. The first step is to design the learning model by choosing the learning algorithm and the number of hidden layers.
Multi-layer perceptron (MLP) is a common feed forward network, it contains one or more layers of hidden neurons, as shown in Figure 2. In MLP, the information transfers forward from inputs through hidden nodes to the output nodes. The training of an MLP is generally performed by using a back-propagation algorithm which encompasses forward step and backward step. The network’s structure has to be nominated by selecting training approach and hidden layers.
In this research, four types of learning algorithms were tested: Bayesian, Levenberg-Marquardt, Scaled conjugate gradient and resilient algorithms. At the same time, the number of hidden layers was examined for 15, 20, 25, and 30 layers. These parameters were tasted on four clusters of DECC data.
The output of the ANN model for different algorithms are validated using three measures, these measures are (MSE), (MAPE), and (R2), also the overall outputs values was taken in account to evaluate the performance of each case. The measures values for different training algorithm are shown in Table 2.
Table 2.
The performance of the ANN models for different training algorithms.
From Table 2, the best learning algorithm is Bayesian, especially in cases of clusters 2 and 3. The overall measures show good values such as the R-value being 0.85 and 0.90 respectively, and are not too different from the trained outputs and the tested output. Other algorithms show good values in some clusters, but there were large differences between the trained and tested outputs, also there are many negative results of trained outputs.
For selection of the hidden layers, same measures used to validate ANN performance as in Table 3. The best results have been obtained in the model with 20 hidden layers for clusters 1, 2, and 3. Actually, Bayesian neural nets are common for solving problems where data is small, as a way to prevent over fitting. Therefore, it shows better performance in the current data of DECC.
Table 3.
The performance of the ANN models for different hidden layers.
Table 3 shows the high R value of the model with 20 hidden layers and the close values between train and test samples. Based on the previous finding, the ANNs models for this research select the Bayesian algorithm as training method with 20 hidden layers for training process.
Based on the previous investigations, the Bayesian method and 20 hidden layers will form ANNs model to estimate the energy use of accommodation facilities based on DECC. The previous literature shows the high performance of the ANNs model and accurate results comparing to statistical methods. Therefore, many studies use the ANNs model to analysis building energy with wide range of variable.
In Figure 4, the outputs of the ANNs models are illustrated for DECC clusters with predicted value of primary energy using the ANNs model. The good results can be seen clearly by comparing to outputs of the regression model in the previous paragraph. Same as in the regression model, the intendant variables are the consumption of electricity, city gas and clean water. These variables are used as inputs to predict the primary energy outputs by using the ANNs model.
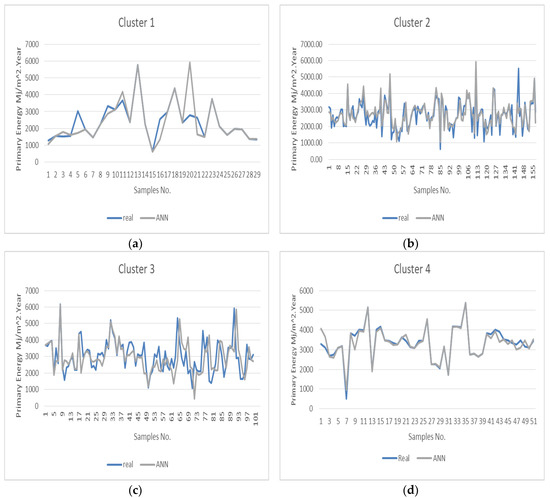
Figure 4.
Prediction results of ANN models using DECC. (a) cluster 1; (b) cluster 2; (c) cluster 3; (d) cluster 4.
It can be seen that there is a small variation between real data and ANNs outputs in four clusters, especially if there are sufficient number of samples in the cluster such as in Figure 3b,c. The variance coefficient shows a smaller value for ANNs results, it was about 0.08 for cluster 1, 2 and 0.03 for cluster 4. Cluster3 has a bigger variance coefficient CV = 0.15.
4.3. Comparison of Regression and ANNs Models
The comparison between the regression model and ANNs is an important process to validate the accuracy of benchmark equation to evaluate energy efficiency of accommodation buildings. Figure 5 illustrates the comparison between both models in two clusters with different numbers of samples.
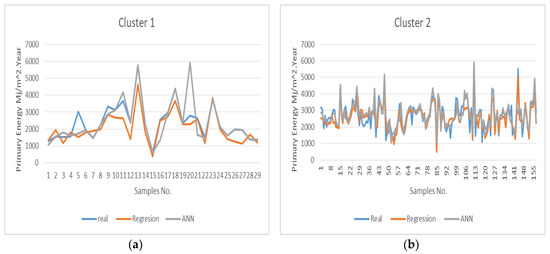
Figure 5.
Comparison between the outputs of regression and ANN models. (a) cluster 1; (b) cluster 2.
As shown in Figure 5a, cluster 1 has good consistency between predicted values and real data in both method, the regression method has less variance compared to the ANNs model. In Figure 5b, bother methods have less variance toward real values since cluster 2 has a sufficient size of samples to improve the accuracy of ANNs method.
The mean absolute percentage error (MAPE) was calculated to evaluate the outputs of both methods for each cluster of DECC. Table 4 presents the value of MAPE for each cluster.
Table 4.
The MAPE value for regression and ANN methods.
MAPE values shows close value of both methods in case of cluster “2” and cluster “3”. In the other hand, in case of cluster “1”, regression model shows best performance comparing to ANNs model. Cluster “4”, shows big difference of performance between ANNs and regression model. The mean reason of MAPE for cluster “1” and “4” is the size of sample in these clusters. Since the regression model has less sensitivity toward data size, the outputs will not be affected as much as in case of ANNs model.
5. Conclusions
This investigation introduced a benchmark system that can be a yardstick for future studies with more detail data of examined buildings especially in accommodation sector. The benchmark equations showed how gas consumption has less impact on energy use intensity. This result supports the current trend to depend more on natural gas in hotel building in order to have less emissions. In addition, the study compared the performance of regression and ANNs methods, they are used to develop energy benchmarking of accommodation buildings in the Kanto region of Japan. A database of national scale surveys is analyzed and the findings illustrate the difference between regression and ANNs outputs.
The study pointed out the necessity to design a prediction system of ANNs model to achieve accurate results by selecting the learning algorithm and hidden layers. Bayesian algorithm and 20 of hidden layer show good values of mean measurement indicators.
Sample size was an important factor that differentiates the outputs of the regression model and ANNs model. This result emphasizes the importance of considering sample size during selection of the modeling method of energy benchmarking in buildings. Therefore, it is essential for managers of accommodation facilities to acquire a sufficient database of energy consumption and other related data to develop an accurate benchmark of energy consumption.
Author Contributions
H.A. carried out all research work such as data acquisition, analyzing and writing the paper. W.Y. supervised the work as the main academic supervisor.
Funding
Keio University funded a part of research work through the following grant “Keio University Doctorate Student Grant-in-Aid Program 2017”.
Conflicts of Interest
The authors declare no conflict of interest. The founding sponsors had no role in the design of the study; in the collection, analyses, or interpretation of data; in the writing of the manuscript, and in the decision to publish the results.
References
- Rahman, I.; Reynolds, D.; Svaren, S. How ‘green’ are North American hotels? An exploration of low-cost adoption practices. Int. J. Hosp. Manag. 2012, 31, 720–727. [Google Scholar] [CrossRef]
- Star Energy. Benchmarking to Save Energy: Protect Our Environment Through Energy Efficiency; Star Energy: Washington, DC, USA, 2007.
- Zmeureanu, R.G.; Hanna, Z.A.; Fazio, P. Energy performance of hotels in Ottawa. ASHRAE Trans. 1994, 100, 314–322. [Google Scholar]
- Shiming, D.; Burnett, J. Energy use and management in hotels in Hong Kong. Int. J. Hosp. Manag. 2002, 21, 371–380. [Google Scholar] [CrossRef]
- Becken, S.; Frampton, C.; Simmons, D. Energy consumption patterns in the accommodation sector—The New Zealand case. Ecol. Econ. 2001, 39, 371–386. [Google Scholar] [CrossRef]
- Trung, D.N.; Kumar, S. Resource use and waste management in Vietnam hotel industry. J. Clean. Prod. 2005, 13, 109–116. [Google Scholar] [CrossRef]
- Han, H.; Hsu, L.T.J.; Lee, J.S.; Sheu, C. Are lodging customers ready to go green? An examination of attitudes, demographics, and eco-friendly intentions. Int. J. Hosp. Manag. 2011, 30, 345–355. [Google Scholar] [CrossRef]
- Bohdanowicz, P.; Martinac, I. Determinants and benchmarking of resource consumption in hotels-Case study of Hilton International and Scandic in Europe. Energy Build. 2007, 39, 82–95. [Google Scholar] [CrossRef]
- Wallbaum, H.; Ostermeyer, Y.; Salzer, C.; Escamilla, E.Z. Indicator based sustainability assessment tool for affordable housing construction technologies. Ecol. Indic. 2012, 18, 353–364. [Google Scholar] [CrossRef]
- Chung, L.H.; Parker, L.D. Managing social and environmental action and accountability in the hospitality industry: A Singapore perspective. Account. Forum 2010, 34, 46–53. [Google Scholar] [CrossRef]
- Robinot, E.; Giannelloni, J.-L. Do hotels’ ‘green’ attributes contribute to customer satisfaction? J. Serv. Mark. 2010, 24, 157–169. [Google Scholar] [CrossRef]
- Bohdanowicz, P. European Hoteliers’ Environmental Attitudes: Greening the Business. Cornell Hotel Restaur. Adm. Q. 2005, 46, 188–204. [Google Scholar] [CrossRef]
- Santamouris, M.; Balaras, C.A.; Dascalaki, E.; Argiriou, A.; Gaglia, A. Energy conservation and retrofitting potential in Hellenic hotels. Energy Build. 1996, 24, 65–75. [Google Scholar] [CrossRef]
- Deng, S. Energy and water uses and their performance explanatory indicators in hotels in Hong Kong. Energy Build. 2003, 35, 775–784. [Google Scholar] [CrossRef]
- Pérez-Lombard, L.; Ortiz, J.; Pout, C. A review on buildings energy consumption information. Energy Build. 2008, 40, 394–398. [Google Scholar] [CrossRef]
- Miao, L.; Wei, W. Consumers’ pro-environmental behavior and the underlying motivations: A comparison between household and hotel settings. Int. J. Hosp. Manag. 2013, 32, 102–112. [Google Scholar] [CrossRef]
- Erdogan, N.; Baris, E. Environmental protection programs and conservation practices of hotels in Ankara, Turkey. Tour. Manag. 2007, 28, 604–614. [Google Scholar] [CrossRef]
- Statistical Handbook of Japan. 2014. Available online: http://www.stat.go.jp/english/data/handbook/index.htm (accessed on 11 July 2015).
- Vorobeva, N.A.; Kolesnikov, M.V. National policy of japan for stimulating innovation process in the energy industry. Int. J. Econ. Financ. Issues 2016, 6, 237–244. [Google Scholar]
- The Energy Conversation Center. Japan Energy Conservation Handbook 2013; The Energy Conversation Center: Tokyo, Japan, 2013. [Google Scholar]
- Yoshino, H.; Hong, T.; Nord, N. IEA EBC annex 53: Total energy use in buildings—Analysis and evaluation methods. Energy Build. 2017, 152, 124–136. [Google Scholar] [CrossRef]
- WTTC 2017. Available online: https://www.wttc.org/search-results/?query=Japan (accessed on 14 June 2017).
- Murakami, S.; Levine, M.D.; Yoshino, H.; Inoue, T.; Ikaga, T.; Shimoda, Y.; Miura, S.; Sera, T.; Nishio, M.; Sakamoto, Y.; et al. Energy consumption and mitigation technologies of the building sector in Japan. In Proceedings of the 6th International Conference on Indoor Air Quality, Ventilation and Energy Conservation in Buildings: Sustainable Built Environment, Sendai, Japan, 28–31 October 2007. [Google Scholar]
- Tong, X. Energy-Efficiency Improvement in the Japanese Hotel Sector. Ritsumeikan J. Asia Pacific Stud. 2011, 30, 56–76. [Google Scholar]
- Alkhalaf, H.; Yan, W. A study on the Correlation between the Energy Use and Occupancy Rate of Accommodation Buildings. Int. J. Acad. Sci. Res. 2017, 5, 96–109. [Google Scholar]
- Zhao, H.; Magoulès, F. A review on the prediction of building energy consumption. Renew. Sustain. Energy Rev. 2012, 16, 3586–3592. [Google Scholar] [CrossRef]
- Fumo, N.; Mago, P.; Luck, R. Methodology to estimate building energy consumption using EnergyPlus Benchmark Models. Energy Build. 2010, 42, 2331–2337. [Google Scholar] [CrossRef]
- Shabunko, V.; Lim, C.M.; Mathew, S. EnergyPlus Models for The Benchmarking of Residential Buildings in Brunei Darussalam. Energy Build. 2016, 169, 507–516. [Google Scholar] [CrossRef]
- Attia, S.; Evrard, A.; Gratia, E. Development of benchmark models for the Egyptian residential buildings sector. Appl. Energy 2012, 94, 270–284. [Google Scholar] [CrossRef]
- Bianco, V.; Manca, O.; Nardini, S. Electricity consumption forecasting in Italy using linear regression models. Energy 2009, 34, 1413–1421. [Google Scholar] [CrossRef]
- Szűts, A.I.K. Estimating Hungarian Household Energy Consumption Using Artificial Neural Networks. Acta Polytech. Hung. 2014, 11, 155–168. [Google Scholar]
- Fumo, N. A review on the basics of building energy estimation. Renew. Sustain. Energy Rev. 2014, 31, 53–60. [Google Scholar] [CrossRef]
- Yang, J.; Rivard, H.; Zmeureanu, R. Building Energy Prediction with Adaptive Artificial Neural Networks. In Proceedings of the Ninth International IBPSA Conference, Montreal, Canada, 15–18 August 2005; pp. 1401–1408. [Google Scholar]
- Oğcu, G.; Demirel, O.F.; Zaim, S. Forecasting Electricity Consumption with Neural Networks and Support Vector Regression. Procedia Soc. Behav. Sci. 2012, 58, 1576–1585. [Google Scholar] [CrossRef]
- Kalogirou, S. Applications of artificial neural networks in energy systems. Energy Convers. Manag. 1999, 40, 1073–1087. [Google Scholar] [CrossRef]
- Buratti, C.; Barbanera, M.; Palladino, D. An original tool for checking energy performance and certification of buildings by means of Artificial Neural Networks. Appl. Energy 2014, 120, 125–132. [Google Scholar] [CrossRef]
- González, P.A.; Zamarreño, J.M. Prediction of hourly energy consumption in buildings based on a feedback artificial neural network. Energy Build. 2005, 37, 595–601. [Google Scholar] [CrossRef]
- Chau, K.W. Particle swarm optimization training algorithm for ANNs in stage prediction of Shing Mun River. J. Hydrol. 2006, 329, 363–367. [Google Scholar] [CrossRef]
- Tso, G.K.F.; Yau, K.K.W. Predicting electricity energy consumption: A comparison of regression analysis, decision tree and neural networks. Energy 2007, 32, 1761–1768. [Google Scholar] [CrossRef]
- Maliki, O.S.; Agbo, A.O.; Maliki, A.O.; Ibeh, L.M.; Agwu, C.O. Comparison of Regression Model and Artificial Neural Network Model for the prediction of Electrical Power generated in Nigeria. Adv. Appl. Sci. Res. 2011, 2, 329–339. [Google Scholar]
- Tosun, E.; Aydin, K.; Bilgili, M. Comparison of linear regression and artificial neural network model of a diesel engine fueled with biodiesel-alcohol mixtures. Alex. Eng. J. 2016, 55, 3081–3089. [Google Scholar] [CrossRef]
- Aydinalp-Koksal, M.; Ugursal, V.I. Comparison of neural network, conditional demand analysis, and engineering approaches for modeling end-use energy consumption in the residential sector. Appl. Energy 2008, 85, 271–296. [Google Scholar] [CrossRef]


© 2018 by the authors. Licensee MDPI, Basel, Switzerland. This article is an open access article distributed under the terms and conditions of the Creative Commons Attribution (CC BY) license (http://creativecommons.org/licenses/by/4.0/).