Abstract
Over the past decade, the rapid development of geospatial tools has significantly expanded the scope of archaeobotanical research, enabling unprecedented insights into ancient plant domestication, agricultural practices, and human-environment interactions. Within the Chinese context, where rich archaeobotanical records intersect with complex socio-ecological histories, GIS-driven approaches have revealed nuanced patterns of crop dispersal, settlement dynamics, and landscape modification. However, despite these advances, current applications remain largely exploratory, constrained by fragmented datasets and underutilized spatial-statistical methods. This paper argues that a more robust integration of large-scale archaeobotanical datasets with advanced ArcGIS functionalities—such as kernel density estimation, least-cost path analysis, and predictive modelling—is essential to address persistent gaps in the field. By synthesizing case studies from key Chinese Neolithic and Bronze Age sites, we demonstrate how spatial analytics can elucidate (1) spatiotemporal trends in plant use, (2) anthropogenic impacts on vegetation, and (3) the feedback loops between subsistence strategies and landscape evolution. Furthermore, we highlight the challenges of data standardization, scale dependency, and interdisciplinary collaboration in archaeobotanical ArcGIS. Ultimately, this study underscores the imperative for methodological harmonization and computational innovation to unravel the intricate relationships between ancient societies, agroecological systems, and long-term environmental change.
1. Introduction
The cultivation and utilization of plants, along with the origins and development of agriculture, represent one of the most significant transformations in human history. These developments not only laid the economic foundation for ancient societies but also played a fundamental role in the emergence of complex civilizations [1,2,3]. As a vital subfield of archaeology, archaeobotany seeks to reconstruct ancient lifeways, subsistence strategies, and human–environment interactions through the analysis of preserved plant remains. Traditional research in archaeobotany has largely relied on macrobotanical analysis, microbotanical analysis, and charcoal studies [3,4,5,6,7]. With the accumulation of carbonized seeds, starch grains, phytoliths, and associated domestication indicators and radiocarbon dates, major advances have been made in understanding the domestication centers, timing, and dispersal routes of staple crops such as millets, wheat (Triticum aestivum), barley (Hordeum vulgare), rice (Oryza sativa), and maize (Zea mays) [4,8,9,10,11,12,13]. In recent years, the integration of novel scientific techniques has accelerated the growth of archaeobotanical research. Notably, breakthroughs in ancient DNA (aDNA) analysis and the refinement of bioinformatics workflows have provided new insights into the evolutionary history of plants [14,15]. Concurrently, with the rapid increase in computational capacity, geographic information systems (GIS)—particularly ArcGIS and its powerful spatial analysis modules—have become essential tools for archaeobotanical research, offering enhanced capabilities in data integration, spatial modeling, and environmental interpretation [16,17], thus infusing archaeobotanical research with renewed analytical vitality and broader developmental momentum.
GIS software encompasses both commercial products such as ArcGIS, GeoMedia, and Smallworld, as well as open-source alternatives including QGIS, GRASS GIS, and SAGA GIS [18]. Among these, ArcGIS excels in terms of overall functionality and has been increasingly adopted in research across various disciplines [19]. ArcGIS is a professional software tool for GIS, which includes multiple core tools: ArcMap, ArcGIS Pro, ArcGIS Enterprise [20]. ArcGIS, developed by the Environmental Systems Research Institute (ESRI), provides a full-process solution that spans from data acquisition to map-based visualization [21]. Its core strengths lie in its rich suite of spatial analytical tools and robust data processing capabilities. Although the application of ArcGIS spatial analysis in archaeobotany emerged relatively late and remains underutilized both domestically and internationally, it possesses unique advantages.
It is widely understood that different plant species require specific environmental conditions—such as soil type, climate patterns, and water availability—for optimal growth. In ancient times, choosing appropriate cultivation zones was crucial for enhancing crop productivity and ensuring stable yields [22]. Planting in ecologically unsuitable areas could lead to poor growth, low output, or even total crop failure. Thus, ancient human decisions regarding where to grow crops were key to improving agricultural efficiency and resource utilization.
In practice, digitizable archaeobotanical data can be grouped into three interrelated levels: (1) Find-level data—referring to individual plant remains or sample records, such as carbonized seeds, starch grains, phytoliths, and associated radiocarbon dates, which directly document ancient plant use [23]; (2) Context- and site-level data—including stratigraphic units, feature types (e.g., pits, hearths, house foundations), and site coordinates, which provide the archaeological and spatial framework for interpretation [24]; (3) Environmental layers—such as digital elevation models, hydrology, soil distributions, and paleoclimate proxies, which can be integrated with archaeobotanical data to explore the relationship between plant use and environmental settings [25].
Through ArcGIS spatial analysis, various types of archaeobotanical data can be digitized and subjected to diverse forms of spatial analysis. This enables researchers to better interpret and address a range of questions concerning settlement layout, the rise and decline of civilizations, and the dynamics of plant exploitation. Consequently, ArcGIS helps elucidate the spatial relationships and changing patterns associated with ancient plant use. In recent years, based on the spatial distribution of archaeobotanical remains, ArcGIS has achieved significant progress in areas such as modeling the spatial distribution patterns of plant remains [26], simulating crop diffusion routes, and analyzing relevant environmental factors [27].
This paper systematically reviews the core application areas, representative case studies, and methodological contributions of ArcGIS in Chinese archaeobotanical research. It also explores future development trends and challenges, aiming to provide a comprehensive overview of its developmental trajectory and to identify potential future directions.
2. Introduction to ArcGIS Spatial Analysis and Its Key Procedures
2.1. Principle of ArcGIS Spatial Analysis
ArcGIS spatial analysis is a computational technique based on the spatial position and morphological attributes of geographic features. At its core, it involves processing, analyzing, and visualizing spatial data using digital tools and geospatial technologies. The foundation of spatial analysis lies in geospatial databases, which store, structure, and support a range of operations including geometric logic, statistical modeling, and algebraic computation. The overarching goal is to extract, interpret, and transmit spatial information—especially implicit spatial patterns—in order to support decision-making [28,29]. Spatial analysis in ArcGIS can be employed to compute geometric attributes such as distances, areas, and orientations between features. It also enables the evaluation of spatial relationships between different regions or features, including overlay analysis, buffer analysis, and proximity modeling. These capabilities allow researchers to address complex spatial problems and derive insights that are otherwise difficult to obtain through non-spatial data alone.
ArcGIS spatial analysis is one of the core functionalities within Geographic Information Systems (GIS), designed to extract and communicate spatial information for decision support. This technology not only encompasses the statistical description and pattern recognition of geospatial data, but also integrates spatial relationships, spatial statistics, and spatial modeling. It has been widely applied across various fields, including urban planning, environmental monitoring, and resource management [28]. As ArcGIS technology has continued to evolve, its spatial analysis capabilities have also advanced considerably. However, several challenges and limitations persist, such as spatial autocorrelation, the modifiable areal unit problem (MAUP), and computational complexity [30].
These issues represent common sources of uncertainty in spatial analysis. Spatial autocorrelation refers to the tendency for nearby sites to have similar values, which can exaggerate statistical significance [31]. The modifiable areal unit problem (MAUP) means that analytical results can vary depending on how data are aggregated or zoned—for example, different conclusions may arise when using modern administrative boundaries versus natural geographic regions [32]. Computational complexity describes the high processing demands of spatial algorithms when handling large archaeobotanical datasets, which can constrain both the scale and resolution of analysis [18].
2.2. Analytical Workflow of ArcGIS in Archaeobotanical Research
Based on current methodological frameworks, the application of ArcGIS spatial analysis in archaeobotanical research typically follows three main stages:
2.2.1. Data Collection and Processing
The first step involves gathering data on ancient plant remains, including their geographic coordinates, species types, quantities, and radiocarbon (14C) dates. Geospatial information covers not only the excavation locations of the plant remains but also surrounding features such as latitude and longitude, topography, landforms, soil types, climatic conditions, and water availability. Spatial attributes such as elevation and landforms can be derived using GIS-based digitization or remote sensing, while data on soils, climate, and hydrology are often extracted from modern geographical databases.
In addition, relevant paleoclimatic data should be collected to contextualize the environmental conditions of the plant remains, including metrics such as mean annual temperature, precipitation, and seasonal variation. These can be accessed through paleoclimate reconstructions or global datasets such as the Climate Research Unit Time-Series (CRU TS v4.06) from the University of East Anglia [33]. Preprocessing and classification of the data are essential for subsequent spatial analyses.
2.2.2. Spatial Analysis
ArcGIS provides a suite of spatial analysis tools that can be applied to archaeobotanical data, including kernel density estimation, buffer analysis, overlay analysis, spatial interpolation, and multi-criteria decision analysis (MCDA). For example, land suitability for ancient crops can be modeled by reclassifying and integrating variables such as soil type and climate condition layers. Topographic tools, such as slope and elevation analysis, further enable researchers to evaluate environmental suitability and infer possible dispersal pathways of prehistoric plants.
In addition, previous studies have emphasized the importance of parameter settings in spatial modeling. For example, kernel density estimation requires careful consideration of sample duplication, projection choice, and search radius, whereas least-cost path analysis depends on assigning appropriate weights to terrain, hydrology, and vegetation layers. These parameters and configuration options are described in the ArcGIS Pro documentation (see Kernel Density and Cost Path tools).
2.2.3. Visualization and Output
ArcGIS enables the visual representation of results such as spatial distributions and probable dispersal routes of ancient plants through maps. This visual format enhances the interpretability of complex data and supports clearer comparative analyses between regions. In addition, results can be exported in formats such as JPEG for further documentation, dissemination, and reuse.
3. Overview and Progress of ArcGIS Spatial Analysis in Chinese Archaeobotany
The application of ArcGIS spatial analysis in China began around the early 2000s, initially in the field of ecology—for example, in the modeling of forest landscape patterns [34]. The use of ArcGIS in archaeobotany started later, with pioneering work by Liu Yan and Chen Minghuan around 2010, who conducted spatial zoning of foraging, hunting, and farming areas in the Neolithic to Warring States periods in Northeast China [35,36].
In the past five years, with the growing availability of archaeobotanical datasets and the integration of modeling tools such as the R language, Python, and artificial intelligence (AI) methods, the number of published studies has increased to more than ten, signaling a phase of rapid development. Across China, archaeological sites analyzed with ArcGIS span from the Neolithic period to the Qing Dynasty, though research is primarily concentrated in the Neolithic and Bronze Age. Geographically, studies have covered regions including Northeast China, East China, Gansu–Qinghai, Xinjiang, the Tibetan Plateau, Southwest China, and the Jiangsu–Zhejiang area.
Early research focused mainly on plant remains, often supplemented by faunal remains and lithic tools, to reconstruct ancient subsistence strategies. More recent studies incorporate radiocarbon dating and regional paleoclimatic datasets to explore environmental factors influencing plant use. At present, the primary contributions of ArcGIS spatial analysis to archaeobotany in China can be summarized in the following two aspects:
3.1. Spatiotemporal Dynamics of Plant Utilization and Environmental Influencing Factors
The tiered topography which stretches across China from the delta plains of the eastern lowlands to the mountainous high-altitude extremes of the Tibetan Plateau, created a complex mosaic of ecological niches that profoundly shaped prehistoric plant-use strategies. Rather than treating geography as a passive backdrop, recent GIS-driven analyses reveal how communities actively negotiated these landscapes. They adapted subsistence practices to local constraints while simultaneously driving regional diversification. This dynamic interplay between environmental parameters and human agency remains central to understanding agricultural trajectories across China’s distinct geomorphological zones.
The Tibetan Plateau exemplifies the catalytic role of elevation in crop adaptation. While millet systems initially clustered below 3000 m ( BP), the strategic adoption of cold-tolerant hull-less (qingke) barley ~3600 BP enabled communities to overcome thermal barriers, transforming highland occupation patterns [27]. This was no passive response—it reflected deliberate experimentation with novel cultigens to exploit marginal environments. Similarly, in Xinjiang’s mountain-framed basins, Bronze Age agro-pastoralists selectively leveraged drought-resistant millets to stabilize subsistence amid climatic fluctuations [26].
Distinct patterns of lowland–highland interdependence emerge across China’s varied topography, revealing how elevation differentially mediated agricultural development. In Shaanxi, Neolithic millet farming was initially concentrated in fertile river valleys during the Early to Middle Neolithic (~7000–5000 BP), only dispersing into higher-elevation zones later—a transition potentially driven by increasing pastoralist mobility and the need for expanded grazing territories [37]. Conversely, Southwest China’s fragmented landscapes fostered concurrent, complementary strategies: intensive rice and millet agriculture dominated low-lying basins, while adjacent uplands sustained diversified smallholder economies integrating foraging with limited cultivation—a flexible adaptation to vertical ecological zonation [38]. Notably, Northeast China diverged from this pattern; its relatively subdued topography facilitated a unified regional transition toward millet-based agro-pastoralism by the Lower Xiajiadian period (~4000–3500 BP), suggesting elevation imposed fewer constraints here than in western highland regions [36].
Rivers functioned as dynamic conduits for agricultural dispersal while simultaneously demarcating ecological boundaries, revealing how hydrological networks both enabled and constrained subsistence strategies across time. In Neolithic Shaanxi (~5000 BP), the Wei River served as a rapid dispersal corridor for rice agriculture, facilitating its westward expansion into Gansu and Sichuan. Yet this waterway also marked a stark ecological threshold: adjacent highlands resisted agrarian adoption despite climatic viability, underscoring how cultural preferences—not merely environmental suitability—dictated land-use boundaries [37,39]. Meanwhile, in East China two millennia later, historical rice systems exhibited gradual spatial progression along Yangtze tributaries. Tang–Song period (618–1279 CE) cultivation centered near Huai’an and Shanghai, shifting toward Nanjing and Zhenjiang by the Yuan–Ming–Qing era (1271–1912 CE)—a migration driven by sediment-driven floodplain evolution and the strategic realignment of trade networks [40].
Emerging GIS methodologies are transcending environmental determinism by exposing the complex interplay between ecology and human decision-making in agricultural systems. In Zhejiang, agent-based modeling of Hemudu Culture settlements (7000–5300 BP) reveals how farmers strategically positioned communities near optimal farmland—a deliberate socioeconomic calculus to maximize labour efficiency that purely ecological analyses would overlook [41]. Meanwhile, studies in the Gansu-Qinghai region demonstrate that wheat and barley remained confined to favourable lowland regions for centuries (~4000–2300 BP) despite their cold tolerance, implying cultural barriers—not environmental constraints—delayed highland adoption [42]. Crucially, connectivity analyses position crop dispersal within broader Bronze Age exchange networks, showing how grains, livestock, and bronze technology co-migrated along least-cost paths [43,44]. Collectively, these approaches transform ArcGIS from a cartographic tool into an analytical framework for decoding how communities negotiated ecological opportunities through cultural strategies, economic imperatives, and knowledge networks—fundamentally reframing subsistence dynamics as products of human agency rather than environmental passivity.
3.2. Research Progress on the Dispersal Routes of Millet, Rice, and Wheat Agriculture
As a primary center for millet and rice domestication and a critical hub for the dispersal of wheat and barley in East Asia, China occupies a pivotal position in archaeobotanical debates on agricultural globalization. While the arrival of Southwest Asian cereals ~4000 BP via steppe, oasis, and Himalayan corridors [45,46,47,48,49] is widely acknowledged, how and why wheat, barley, and indigenous staples dispersed unevenly across the diverse landscapes that form modern-day China remains contentious. However, recent advances in spatial modelling have transformed this discourse, enabling researchers to move beyond descriptive pathways to interrogate environmental, cultural, and methodological drivers of agricultural spread.These recent advances are illustrated in Figure 1, which integrates ArcGIS-based spatial analyses of major crops to visualize their spatial patterns and environmental relationships.
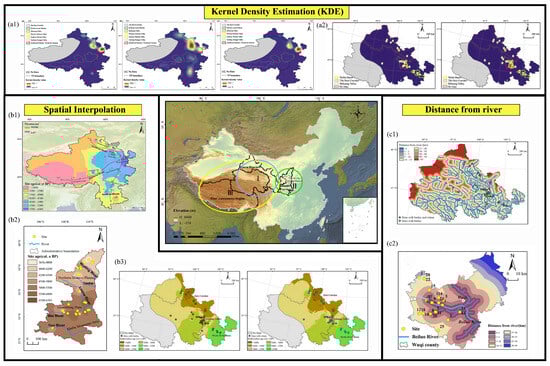
Figure 1.
ArcGIS-based spatial analyses illustrating plant dispersal and environmental relationships across different regions of China. Analytical methods include kernel density estimation (KDE), inverse distance weighting (IDW) interpolation, and proximity (distance-from-river) analysis. Maps (a1,b1) are adapted from [27]; (c2) is adapted from [37]; (b2) is adapted from [39]; and (a2,b3,c1) are adapted from [42].
The application of integrated GIS approaches reveals complex and nonlinear dispersal trajectories, challenging simplified narratives of linear diffusion. In cases where plant remains may not have been cultivated locally, ecological suitability assessments in GIS (e.g., maximum entropy (MaxEnt) and growing degree day (GDD) models) can be used to evaluate whether local environments were suitable for cultivation. If not, least-cost path analysis can be applied to simulate the most plausible routes between potential source regions and archaeological sites. These methods help distinguish local adoption from long-distance dispersal, offering more nuanced interpretations for subsequent case studies [27,50].
In northern Shaanxi, GDD analyses show marked asymmetry:~7000 years BP, millet crops rapidly dispersed southward into the Hanzhong Basin but expanded northward much more slowly, reaching northern Shaanxi only ~3800 BP [37,39]. This disparity raises questions about whether climatic constraints, topographic barriers, or cultural resistance slowed the northern expansion. Similarly, ~5000 BC, rice cultivation spread westward along the Wei River into Gansu and Sichuan, highlighting the importance of river-valley corridors in crop dispersal. However, the simultaneous absence of rice remains at upland sites underscores possible ecological constraints or cultural preferences—factors often overlooked in purely spatial diffusion models [51].
The Gansu–Qinghai–Tibet region further underscores how human decisions mediated agricultural dispersal. Indigenous communities facilitated millet’s expansion along early Holocene pathways (~7800–4800 BP) across the Loess Plateau and Hexi Corridor, leveraging established agro-pastoral networks and seasonal mobility strategies. Conversely, Southwest Asian barley and wheat—though cold-adapted—were selectively integrated centuries after their arrival. Only during the Bronze Age (~4000–2300 BP) did societies actively exploit these crops in favorable niches like the Hexi Corridor, likely driven by risk-buffering strategies, evolving culinary practices, or elite-driven demand for resilient staples [42].
Human agency is equally evident in dispersal across the high-altitude Tibetan Plateau. Modelling reveals three asynchronous routes shaped by cultural landscapes [27]. The first of these is the northwestern route, which shows a stepped chronology. Although millet agriculture transitioned from the Loess Plateau into the Hehuang Valley relatively early (c. 6000–5000 BP), expansion into the Hexi Corridor only occurred after 4000 BP—potentially linked to trade network consolidation. The second, southwestern route sees communities selectively adopting millet in eastern Tibet’s valleys by 5000–4500 BP, suggesting localized experimentation. Finally, the southern route sees the rapid adoption of millet agriculture in Sichuan-Yunnan after 4500 BP, driven by valley-based societies actively reconstituting millet systems within mountain corridors [38].
The 500–1000-year lag between southern acceleration (~4500 BP) and significant adoption in the Hexi Corridor (~4000 BP) or eastern Tibet (~3500 BP) cannot be reduced to environmental constraints. Instead, variable cultural receptivity, divergent knowledge-exchange networks, or competition with indigenous foraging/pastoral traditions likely shaped this asynchronicity. GIS-reconstructed land-use [52] confirms that millet’s success depended on communities reconfiguring entire agro-ecological practices—not merely receiving seeds.Such reorganization likely involved adjustments in cropping regimes and risk-buffering strategies adapted to diverse Holocene environments [51].
Current research transcends mere route description, instead exposing tensions between environmental constraints and cultural dynamics. The uneven tempo of dispersal across regions—millet’s slow northward crawl in Shaanxi versus barley’s rapid corridor-hopping in Gansu—demands interdisciplinary dialogue. Future work must integrate spatial modeling with social archaeology (e.g., labor organization, ritual use of crops) and paleoclimatic reconstructions to answer why certain pathways “succeeded” while others stalled. Only then can we move beyond mapping where crops moved to explain who moved them, why they adopted them, and how these processes reshaped societies.
In essence, the story of crop dispersal in China is not a linear narrative but a mosaic of adaptive responses. By critically deploying spatial technologies and interdisciplinary data, we can better interrogate why crops moved along specific paths at specific times, how they transformed societies, and where the limitations of our current models lie. The focus shifts from cataloging routes to understanding the complex interplay of environment, technology, and culture that shaped one of humanity’s most fundamental transitions.
4. Existing Issues and Solutions
As outlined above there have been significant transformative advances in mapping agricultural dispersal in recent years. However, the integration of ArcGIS and archaeobotany in China faces persistent methodological and epistemological hurdles. These challenges stem not merely from technical limitations but from deeper tensions between predictive ambitions of spatial modelling and fragmented empirical realities of archaeobotany. Three interrelated issues compound these difficulties: (1) divergent sources of archaeobotanical data that impede comparative analysis across regions and periods; (2) limitations in validating and interpreting complex spatial models, particularly when correlating environmental variables with human behavior; and (3) a critical shortage of high-resolution paleoenvironmental datasets essential for contextualizing crop dynamics in China’s heterogeneous landscapes. Collectively, these gaps risk producing spatially precise but historically reductive narratives—where models prioritize pattern over process and environment over agency. Addressing these challenges is vital to ensure GIS serves as a tool for interpretation, not just visualization, in the reconstruction of China’s agricultural past.
4.1. Lack of High-Resolution Environmental Data
High-resolution climatic background data is essential for exploring environmental drivers of ancient plant use and dispersal. However, we frequently face a lack of high-resolution paleoenvironmental datasets for specific periods and regions—such as the mid-Holocene in East Asia. Two forward-looking strategies can be adopted to generate needed environmental data:
(1) Integration and reconstruction using multi-source proxy indicators. By merging proxies of different origins and resolutions—such as tree rings (offering high-frequency annual signals), lake sediments, and ice cores (providing decadal or centennial low-frequency trends)—one can reconstruct a more accurate climate sequence. Statistical techniques such as normalization, standardization, and wavelet analysis are applied to merge high- and low-frequency signals into a unified climate dataset, capturing both long-term trends and short-term variability.
(2) Statistical downscaling, especially through machine learning. Although current global climate models (GCMs) provide coarse-resolution simulations of ancient climate, their resolution can be improved using statistical downscaling. For example, researchers can collect high-resolution modern meteorological data and align it with low-resolution reanalysis data to train machine learning models (e.g., random forests, neural networks). These models can then be applied to low-resolution paleoclimate data to predict high-resolution climate fields for past time periods.
By generating high-resolution environmental backgrounds using the above methods, researchers can more accurately correlate climatic fluctuations (e.g., droughts, floods) with plant remains in archaeological contexts (e.g., changes in pollen concentrations, seed morphology). This allows for a deeper understanding of how environmental stressors influenced agricultural innovation, crop introduction, and human adaptive strategies.
4.2. Divergence in Sources of Archaeobotanical Data
As spatial archaeobotany in China continues to explore big-data approaches, harmonizing diverse data sources emerges as a critical priority for unlocking the full analytical potential of GIS. Over the past decade, significant strides have been made through regional databases from Shaanxi, Gansu-Qinghai, Xinjiang, and the Tibetan Plateau. These compile standardized metrics—site coordinates, absolute counts, and 14C dates—for staple crops (millet, rice, wheat, barley) [37,39,42,53,54,55]. However, there are several challenges which need to be addressed.
Firstly, there are significant variations in fieldwork documentation processes. Although geographic coordinates are now widely recorded, contextual metadata (stratigraphy, feature descriptions, flotation logs) often lack standardized formats, leading to inconsistent terminology (e.g., “ash pit” vs. “refuse deposit”). Moving forward, national frameworks like the Field Archaeology Work Regulations could establish unified digital protocols to ensure cross-site comparability.
Similarly, there is a notable degree of laboratory methodological diversity. Macro-botanical identifications (charred seeds/fruits) depend on lab-specific reference collections, while micro-remains (pollen, phytoliths) use varying taxonomies. Quantitative data often employ project-specific coding systems. Opportunities exist to develop shared digital repositories for comparative specimens and open classification schemas, enhancing reproducibility.
While this review has primarily focused on cereal crops, future applications of ArcGIS spatial analysis could feasibly extend to other plant categories such as fruits, nuts, and weed species, once sufficient archaeobotanical and directly dated (14C) datasets become available. Such an expansion would enable more localized and ecologically nuanced analyses of plant dispersal and land-use strategies, offering new perspectives on the interactions between human subsistence, environmental adaptation, and agricultural diversification in prehistoric China.
This would also assist in analytical research. Heterogeneous statistical approaches—from presence/absence to multivariate models—applied to comparable datasets risk contradictory interpretations (e.g., divergent crop proportions). Future efforts should prioritize community-agreed standards for quantification, such as minimum counts for proportionality calculations.
Collectively, these steps would leverage existing national guidelines (Archaeological Survey Guidelines, Drilling Record Specifications) to build interoperable datasets. Such coordination promises to transform data diversity from an analytical obstacle into a foundation for robust spatial syntheses of China’s agricultural past.
4.3. Advancing Spatial Archaeobotany: Validation, AI Integration, and Mechanistic Frameworks
The credibility of GIS-based crop dispersal simulations hinges on resolving a fundamental epistemological tension: reconstructing nonlinear historical processes from sparse, fragmentary data. Without rigorous validation, even sophisticated models risk devolving into digital speculation—a concern acutely relevant in Chinese archaeobotany, where datasets remain spatially and chronologically uneven. Cross-validation methodologies provide a critical safeguard, partitioning known archaeological sites into training and validation subsets (e.g., k-fold protocols) to quantify predictive accuracy through metrics like RMSE and . This approach proved indispensable when evaluating eight interpolation methods for wheat dispersal in Gansu-Qinghai; Inverse Distance Weighting (IDW) emerged as optimal not due to theoretical superiority, but because its parameters best captured micro-regional dispersal dynamics observable archaeologically [42]. Similarly, R-based validation of Xinjiang millet routes [26] demonstrates how open-source computational ecosystems enable reproducible, iterative refinement of spatial hypotheses.
To transcend inherent data limitations, next-generation frameworks integrate artificial intelligence for controlled uncertainty management. Bayesian deep learning generates synthetic datasets with probabilistic confidence intervals, providing full posterior distributions where physical evidence is sparse—effectively building statistical scaffolding for fragmentary archaeobotanical records. Hybrid spatial-AI architectures, such as Geographically Weighted Convolutional Neural Networks (GW-CNNs), address spatial non-stationarity by adaptively tuning parameters to local topographies, simultaneously mitigating autocorrelation biases. Complementarily, Maximum Entropy (MaxEnt) ecological niche modeling leverages paleoenvironmental rasters (temperature, precipitation, net primary productivity (NPP)) to infer probabilistic crop distributions in unexplored regions, shifting analysis from point-to-point mapping to theoretically grounded surface inference [56,57]. These approaches collectively transform GIS from a descriptive cartographic tool into a platform for predictive uncertainty-aware reconstruction.
As data availability improves, attention shifts decisively from where crops spread to why—requiring fusion of multidimensional causal drivers. Attention-based multimodal deep networks now quantify contributions from: (a) high-resolution paleoenvironmental reconstructions (temperature/precipitation/NPP rasters), (b) geospatial features (topography, hydrology, soil types), (c) archaeological context (site chronology, cultural traditions, technological repertoires), and (d) crop ecophysiology (biological tolerances, growth thresholds). Using tools like GeoPandas for spatial alignment and PyTorch for network training, these models dynamically weight dominant factors—for example, resolving whether delayed millet dispersal in Shaanxi’s highlands reflected thermal constraints (environmental determinism) or cultural resistance to new subsistence strategies (human agency). This mechanistic granularity moves beyond correlation to identify causal pathways underpinning agricultural change.
This tripartite convergence, in the form of robust validation, AI-augmented prediction, and attention-driven explanation, signals an epistemological maturation of spatial archaeobotany. GIS remains foundational as an integrative platform, but its analytical power is exponentially amplified through integration with probabilistic AI frameworks and open-source computational ecosystems.
Future progress demands three synergistic commitments: first, that embedded validation transitions from optional practice to mandatory protocol, ensuring models are rigorously stress-tested against empirical evidence; second, that transparent workflows—via shared code repositories (e.g., GitHub) and containerized environments (Docker)—become standard to guarantee reproducibility and collaborative refinement; and third, that interdisciplinary synthesis actively bridges archaeology, paleoecology, and data science to contextualize findings within complex human-environment systems. When grounded in these principles, spatial archaeobotany transcends descriptive mapping toward falsifiable, mechanistic science—one where simulations not only reconstruct ancient crop geographies but reveal how human societies navigated environmental constraints through innovation, adaptation, and cultural agency.
5. Conclusions
China’s dual legacy as both an agricultural hearth and a continental crossroads positions it as a critical laboratory for understanding ancient food globalization. Through the integration of ArcGIS and archaeobotany, this review has demonstrated how spatial methodologies transcend descriptive cartography to interrogate the complex interplay of environmental constraints, human agency, and cultural dynamics in shaping crop dispersal. Key advances—from reconstructing asynchronous millet pathways across the Tibetan Plateau [27] to modeling Bronze Age wheat-barley adoption in Gansu-Qinghai [42]—reveal that agricultural diffusion was neither environmentally predetermined nor linearly progressive. Rather, it emerged from strategic societal adaptations: agro-pastoralists leveraging elevation gradients, communities resisting or embracing novel crops, and networks exchanging seeds alongside metallurgy and livestock [43,44].
Yet significant methodological and epistemological challenges persist. The era of archaeobotanical “big data” remains hampered by fragmented recording standards, heterogeneous analytical practices, and asymmetrical focus on staple crops over wild taxa. While AI-enhanced frameworks—Bayesian deep learning, attention-based multimodal fusion—promise mechanistic insights into why crops spread, their credibility hinges on rigorous validation protocols and high-resolution paleoenvironmental baselines. Without these, models risk perpetuating digital speculation rather than advancing falsifiable science.
Future progress demands three synergistic shifts: first, the standardization of field-to-lab workflows under national guidelines like the Field Archaeology Work Regulations to establish unified datasets for robust comparative analysis; second, uncompromising transparency in spatial modelling through open-source code sharing (e.g., GitHub repositories), containerized computational environments (Docker), and embedded cross-validation protocols; and third, deliberate interdisciplinarity bridging archaeobotany, paleoclimatology, computational science, and social theory to decode how human societies transformed ecological possibilities into agricultural landscapes through cultural negotiation and innovation.
In this integrated vision, GIS evolves from a mapping tool into an epistemic scaffold—one that reveals not only where millet or wheat moved, but how societies navigated risk, innovation, and choice within China’s tiered topographies. As methodological rigor catches pace with technological ambition, spatial archaeobotany promises nothing less than a new paradigm: replacing deterministic narratives of environmental adaptation with nuanced understandings of agriculture as a cultural negotiation with the earth.
Author Contributions
Conceptualization, Z.M. and F.M.; Literature review and methodological framework, Z.M., S.Y. and B.S.; Visualization, B.S. and S.Y.; Writing—original draft preparation, Z.M.; Writing—review and editing, F.M. and S.Y.; Resources and technical support, L.Z.; Project administration and supervision, Z.M. and F.M.; Funding acquisition, L.Z. All authors have read and agreed to the published version of the manuscript.
Funding
This research was funded by The National Social Science Fund of China (No. 23BKG035), the Key Projects of Philosophy and Social Sciences Research of the Ministry of Education (2024JZDZ058 and 2022JZDZ026).
Data Availability Statement
The original contributions presented in this study are included in the article Materials. Further inquiries can be directed to the corresponding author.
Acknowledgments
The authors would like to thank the China-Central Asia “The Belt and Road” Joint Laboratory on Human and Environment Research for providing laboratory support. We also appreciate the constructive comments from anonymous reviewers. The authors have reviewed and edited the output and take full responsibility for the content of this publication.
Conflicts of Interest
The authors declare no conflict of interest.
References
- Childe, V.G. Man Makes Himself; Watts and Company: London, UK, 1936; pp. 1–275. [Google Scholar]
- Bellwood, P. First Farmers: The Origins of Agricultural Societies; John Wiley & Sons: Oxford, UK, 2004. [Google Scholar]
- Fuller, D.Q.; Stevens, C.J. Between domestication and civilization: The role of agriculture and arboriculture in the emergence of the first urban societies. Veg. Hist. Archaeobot. 2019, 28, 263–282. [Google Scholar] [CrossRef]
- Piperno, D.R.; Flannery, K.V. The earliest archaeological maize (Zea mays L.) from highland Mexico: New accelerator mass spectrometry dates and their implications. Proc. Natl. Acad. Sci. USA 2001, 98, 2101–2103. [Google Scholar] [CrossRef] [PubMed]
- Lu, H.; Zhang, J.; Wu, N.; Liu, K.-B.; Xu, D.; Li, Q. Phytoliths analysis for the discrimination of foxtail millet (Setaria italica) and common millet (Panicum miliaceum). PLoS ONE 2009, 4, e4448. [Google Scholar] [CrossRef] [PubMed]
- Zhao, Z. The formation process of ancient Chinese agriculture: Evidence from flotation of plant remains. Quat. Res. 2014, 34, 73–84. (In Chinese) [Google Scholar]
- Liu, X.; Ren, M.; Fu, Y.; Hu, Y.; Wang, S.; Yang, Y. New insights into the use of Neolithic pottery in Guangxi of South China: Organic residue analysis of experimental and archaeological pottery. Herit. Sci. 2023, 11, 201. [Google Scholar] [CrossRef]
- Tanno, K.; Willcox, G. How fast was wild wheat domesticated? Science 2006, 311, 1886. [Google Scholar] [CrossRef]
- Weiss, E.; Kislev, M.E.; Hartmann, A. Autonomous cultivation before domestication. Science 2006, 312, 1608–1610. [Google Scholar] [CrossRef]
- Fuller, D.Q.; Qin, L.; Zheng, Y.; Zhao, Z.; Chen, X.; Hosoya, L.A.; Sun, G.P. The domestication process and domestication rate in rice: Spikelet bases from the Lower Yangtze. Science 2009, 323, 1607–1610. [Google Scholar] [CrossRef]
- Liu, L.; Ge, W.; Bestel, S.; Jones, D.; Shi, J.; Song, Y.; Chen, X. Plant exploitation of the last foragers at Shizitan in the Middle Yellow River Valley, China: Evidence from grinding stones. J. Archaeol. Sci. 2011, 38, 3524–3532. [Google Scholar] [CrossRef]
- Yang, X.; Wan, Z.; Perry, L.; Lu, H.; Wang, Q.; Zhao, C.; Li, J.; Xie, F.; Yu, J.; Cui, T.; et al. Early millet use in northern China. Proc. Natl. Acad. Sci. USA 2012, 109, 3726–3730. [Google Scholar] [CrossRef]
- Zhang, J.; Jiang, L.; Yu, L.; Huan, X.; Zhou, L.; Wang, C.; Jin, J.; Zuo, X.; Wu, N.; Zhao, Z.; et al. Rice’s trajectory from wild to domesticated in East Asia. Science 2024, 384, 901–906. [Google Scholar] [CrossRef]
- Estrada, O.; Breen, J.; Richards, S.M.; Cooper, A. Ancient plant DNA in the genomic era. Nat. Plants 2018, 4, 394–396. [Google Scholar] [CrossRef] [PubMed]
- Fellows Yates, J.A.; Andrades Valtueña, A.; Vågene, Å.J.; Cribdon, B.; Velsko, I.M.; Borry, M.; Bravo-Lopez, M.J.; Fernandez-Guerra, A.; Green, E.J.; Ramachandran, S.L.; et al. Community-curated and standardised metadata of published ancient metagenomic samples with AncientMetagenomeDir. Sci. Data 2021, 8, 31. [Google Scholar] [CrossRef]
- Groucutt, H.S.; White, T.S.; Clark-Balzan, L.; Parton, A.; Crassard, R.; Shipton, C.; Jennings, R.P.; Parker, A.G.; Breeze, P.S.; Scerri, E.M.L.; et al. Human occupation of the Arabian Empty Quarter during MIS 5: Evidence from Mundafan Al-Buhayrah, Saudi Arabia. Quat. Sci. Rev. 2015, 119, 116–135. [Google Scholar] [CrossRef]
- Zhu, Y.; Hou, G.; Lamu, C.; Zhuoma, C.; Gao, J.; Pang, L. GIS-based analysis of prehistoric transportation routes and regional divisions on the Qinghai–Tibet Plateau. Prog. Geogr. 2018, 37, 438–449. (In Chinese) [Google Scholar]
- Longley, P.A.; Goodchild, M.F.; Maguire, D.J.; Rhind, D.W. Geographic Information Science and Systems, 4th ed.; John Wiley & Sons: Hoboken, NJ, USA, 2015. [Google Scholar]
- Soward, E.; Li, J. ArcGIS Urban: An application for plan assessment. Comput. Urban Sci. 2021, 1, 15. [Google Scholar] [CrossRef]
- Esri ArcGIS Online Will Change How You Think About Mapping and GIS. ArcNews Summer 2012, 34. Available online: https://www.esri.com/news/arcnews/summer12articles/arcgis-online-will-change-how-you-think-about-mapping-and-gis.html (accessed on 28 October 2025).
- Chang, K.-T. Introduction to Geographic Information Systems, 4th ed.; McGraw-Hill: Boston, MA, USA, 2008. [Google Scholar]
- Kupzow, A.J. Basic loci in cultivation of certain crops in the past and modern times. Theor. Appl. Genet. 1976, 48, 209–215. [Google Scholar] [CrossRef] [PubMed]
- Fuller, D.Q.; Denham, T.; Arroyo-Kalin, M.; Lucas, L.; Stevens, C.J.; Qin, L.; Allaby, R.G.; Purugganan, M.D. Convergent evolution and parallelism in plant domestication revealed by an expanding archaeological record. Proc. Natl. Acad. Sci. USA 2014, 111, 6147–6152. [Google Scholar] [CrossRef] [PubMed]
- Bogaard, A.; Filipović, D.; Fairbairn, A.; Green, L.; Stroud, E.; Fuller, D.; Charles, M. Agricultural innovation and resilience in a long-lived early farming community: The 1500-year sequence at Neolithic to early Chalcolithic Çatalhöyük, central Anatolia. Anatolian Studies 2017, 67, 1–28. [Google Scholar] [CrossRef]
- Zhang, H.; Bevan, A.; Fuller, D.; Fang, Y. Archaeobotanical and GIS-based approaches to prehistoric agriculture in the upper Ying valley, Henan, China. J. Archaeol. Sci. 2010, 37, 1480–1489. [Google Scholar] [CrossRef]
- Tan, B.; Tang, L.; Lu, C.; Jiang, L.; Tang, J.; Zheng, L.; Zhang, Y.; Zhang, W.; An, C. Millet in the Bronze Age Altai Mountains: Discovery, progress and research prospects. npj Herit. Sci. 2025, 13, 299. [Google Scholar] [CrossRef]
- Shao, B.; Monteith, F.; You, Z.; Miao, Z.; Gao, Y.; Huan, X.; Ma, Z. The role of environmental factors in the spatiotemporal distribution of millet in Late Neolithic to Bronze Age sites in the Tibetan Plateau and surrounding regions. J. Archaeol. Sci. 2024, 166, 105976. [Google Scholar] [CrossRef]
- Environmental Systems Research Institute (ESRI). Advanced GIS Spatial Analysis Using Raster and Vector Data; ArcGIS Spatial Analyst, An ESRI White Paper; Environmental Systems Research Institute: Redlands, CA, USA, 2001. [Google Scholar]
- Scott, L.M.; Janikas, M.V. Spatial statistics in ArcGIS. In Handbook of Applied Spatial Analysis: Software Tools, Methods and Applications; Fischer, M.M., Getis, A., Eds.; Springer: Berlin/Heidelberg, Germany, 2009; pp. 27–41. [Google Scholar]
- Stocks, C.E.; Wise, S. The role of GIS in environmental modelling. Geogr. Environ. Model. 2000, 4, 219–235. [Google Scholar] [CrossRef]
- Cliff, A.; Ord, J. Spatial Processes: Models and Applications; Pion Press: London, UK, 1981. [Google Scholar]
- Openshaw, S. The modifiable areal unit problem. Concepts and Techniques in Modern Geography; GeoBooks: Norwich, UK, 1984. [Google Scholar]
- Harris, I.; Osborn, T.J.; Jones, P.; Lister, D. CRU TS4.06: Climatic Research Unit (CRU) Time-Series (TS) Version 4.06 of High-Resolution Gridded Data of Month-by-Month Variation in Climate (Jan. 1901–Dec. 2021); Centre for Environmental Data Analysis (CEDA): Chilton, UK, 2020. [Google Scholar] [CrossRef]
- Jiang, L.; Li, M. Spatial pattern change analysis of forest landscape based on GIS. J. Southwest For. Univ. 2001, 21, 96–100. (In Chinese) [Google Scholar]
- Liu, Y. A Preliminary Study of Human–Environment Relationships in the Central and Western Neolithic Northeast China Supported by GIS. Master’s Thesis, Jilin University, Changchun, China, 2013. (In Chinese). [Google Scholar]
- Chen, M. A Preliminary Study of Human–Environment Relationships in the Central and Western Northeast China during the Xia to Warring States Periods Supported by GIS. Master’s Thesis, Jilin University, Changchun, China, 2014. (In Chinese). [Google Scholar]
- Ma, Z.; Liu, S.; Song, J.; Zhang, H.; Zhai, L.; Huan, X. Early millet use and its environmental impact factors in northern Shaanxi, Northwest China. Agronomy 2023, 13, 1272. [Google Scholar] [CrossRef]
- Gao, Y. Research on Plant Resource Utilization and Human–Environment Relationships from the Neolithic to the Bronze Age in Southwest China. Ph.D. Thesis, Sichuan University, Chengdu, China, 2019. (In Chinese). [Google Scholar]
- Ma, Z.; Zhou, M.; Hu, Z.; Monteith, F.; Shao, B.; Xiang, J. The impact of geomorphological settings and environmental influences on crop utilization in the Mid-to-Late Neolithic Period in Shaanxi Province, Northwest China. Land 2025, 14, 234. [Google Scholar] [CrossRef]
- Cui, J. A Study on the Spatiotemporal Distribution Patterns of Ancient Agricultural Sites in East China Based on GIS. Master’s Thesis, Anhui Agricultural University, Hefei, China, 2022. (In Chinese). [Google Scholar]
- Chen, X.; Liu, Y.; Zhao, X.; Liu, S.; Zhao, N.; Lai, X.; Chen, J.; Li, M.; Sun, Q. Rice farming mediated internal competition and reduced external risks during the Neolithic period. Quat. Sci. Rev. 2025, 354, 109249. [Google Scholar] [CrossRef]
- Ma, Z.; Song, J.; Wu, X.; Hou, G.; Huan, X. Spatiotemporal distribution and geographical impact factors of barley and wheat during the Late Neolithic and Bronze Age (4000–2300 cal. a BP) in the Gansu–Qinghai Region, Northwest China. Sustainability 2022, 14, 5417. [Google Scholar] [CrossRef]
- Zhu, Y. Reconstruction and Evolution of Human Communication Routes from the Neolithic to the Bronze Age on the Qinghai–Tibet Plateau. Master’s Thesis, Qinghai Normal University, Qinghai, China, 2019. (In Chinese). [Google Scholar]
- Lancang, T.; Zhuoma, Z. Reconstruction and Evolution of Communication Routes from the Paleolithic to Historical Periods on the Qinghai–Tibet Plateau. Master’s Thesis, Qinghai Normal University, Xining, China, 2021. (In Chinese). [Google Scholar]
- Dodson, J.; Li, X.; Ji, M.; Zhao, K.; Zhou, X.; Levchenko, V. Early bronze in two Holocene archaeological sites in Gansu, NW China. Quat. Res. 2009, 72, 309–314. [Google Scholar] [CrossRef]
- Liu, X.; Lister, D.L.; Zhao, Z.; Staff, R.A.; Jones, P.J.; Zhou, L.; Pokharia, A.K.; Petrie, C.A.; Pathak, A.; Lu, H.; et al. The virtues of small grain size: Potential pathways to a distinguishing feature of Asian wheats. Quat. Int. 2016, 426, 107–119. [Google Scholar] [CrossRef]
- Ren, L.; Dong, G.; Liu, F.; d’Alpoim Guedes, J.; Flad, R.K.; Ma, M.; Li, H.; Yang, Y.; Liu, Y.; Zhang, D.; et al. Foraging and farming: Archaeobotanical and zooarchaeological evidence for Neolithic exchange on the Tibetan Plateau. Antiquity 2020, 94, 637–652. [Google Scholar] [CrossRef]
- Stevens, C.J.; Murphy, C.; Roberts, R.; Lucas, L.; Silva, F.; Fuller, D.Q. Between China and South Asia: A Middle Asian corridor of crop dispersal and agricultural innovation in the Bronze Age. Holocene 2016, 26, 1541–1555. [Google Scholar] [CrossRef]
- Zhao, Z. Research on the Introduction of Wheat into China: Archaeobotanical Evidence. South. Cult. Relics 2015, 3, 44–52. (In Chinese) [Google Scholar]
- Li, X.; Wu, K.; Hao, S.; Yue, Z.; Ran, Z.; Ma, J. Mapping cropland suitability in China using optimized MaxEnt model. Field Crops Res. 2023, 302, 109064. [Google Scholar] [CrossRef]
- Stevens, C.J.; Fuller, D.Q. The spread of agriculture in eastern Asia: Archaeological bases for hypothetical farmer/language dispersals. Lang. Dyn. Change 2017, 7, 152–186. [Google Scholar] [CrossRef]
- Hou, G.; Wei, H.; E, C.; Zhao, X. Prehistoric population and cultivated land changes and their influence on vegetation evolution in eastern Qinghai. Sci. Geogr. Sin. 2013, 33, 299–306. (In Chinese) [Google Scholar]
- Wang, C.; Lu, H.; Zhang, J.; Gu, Z.; He, K. Prehistoric demographic fluctuations in China inferred from radiocarbon data and their linkage with climate change over the past 50,000 years. Quat. Sci. Rev. 2014, 98, 45–59. [Google Scholar] [CrossRef]
- He, K.; Lu, H.; Zhang, J.; Wang, C.; Huan, X. Prehistoric evolution of the dualistic structure mixed rice and millet farming in China. Holocene 2017, 27, 1885–1898. [Google Scholar] [CrossRef]
- Yang, J.; Gao, Y.; Yang, X. The emergence, development, and impact of prehistoric agriculture on the Tibetan Plateau. J. Archaeol. Sci. 2025, 178, 106216. [Google Scholar] [CrossRef]
- Xiong, Q.; He, Y.; Deng, F.; Li, T.; Yu, L. Assessment of alpine vegetation response to climate change in Southwest China based on the MaxEnt model. Acta Ecol. Sin. 2019, 39, 9033–9043. (In Chinese) [Google Scholar]
- Li, X.; Li, Y.; Fang, Y. Prediction of the potential distribution of Quercus fabri in China using an optimized MaxEnt model. Sci. Silvae Sin. 2018, 54, 153–164. (In Chinese) [Google Scholar]
Disclaimer/Publisher’s Note: The statements, opinions and data contained in all publications are solely those of the individual author(s) and contributor(s) and not of MDPI and/or the editor(s). MDPI and/or the editor(s) disclaim responsibility for any injury to people or property resulting from any ideas, methods, instructions or products referred to in the content. |
© 2025 by the authors. Licensee MDPI, Basel, Switzerland. This article is an open access article distributed under the terms and conditions of the Creative Commons Attribution (CC BY) license (https://creativecommons.org/licenses/by/4.0/).