Article

Fire Along the Street of the Dead: New Comprehensive Archaeomagnetic Survey in Teotihuacan (Central Mesoamerica)

by
Karen Arreola Romero
1,
Avto Goguitchaichvili
1,*,
Vadim Kravchinsky
2,*,
Gloria Torres
3,
Verónica Ortega
4,
Jorge Archer
3,
Rubén Cejudo
1,
Francisco Bautista
5,
Alejandra García Pimentel
1,
Rafael García Ruiz
1 and
Juan Morales
1
1
Servicio Arqueomagnetico Nacional, Instituto de Geofísica Unidad Michoacán, Universidad Nacional Autónoma de México, Campus Morelia, Mexico City 04510, Mexico
2
Geophysics, Department of Physics, University of Alberta, Edmonton, AB T6G2E1, Canada
3
Instituto Nacional De Antropología e Historia, Ciudad de México 06060, Mexico
4
Centro Universitario Valle de Teotihuacan, Universidad Autónoma del Estado De México, Toluca 50200, Mexico
5
Centro de Investigaciones en Geografía Ambiental, Universidad Nacional Autónoma de México, Campus Morelia, Mexico City 04510, Mexico
*
Authors to whom correspondence should be addressed.
Quaternary 2025, 8(4), 63; https://doi.org/10.3390/quat8040063 (registering DOI)
Submission received: 19 August 2025 / Revised: 24 September 2025 / Accepted: 14 October 2025 / Published: 1 November 2025

Abstract

Teotihuacan, one of the most significant urban and ceremonial centers of ancient Mesoamerica, was abruptly abandoned in the mid-1st millennium AD. The cause and timing of its collapse—commonly placed between 600 and 650 AD—remain major questions in Mesoamerican archaeology. In this study, we present a new archaeomagnetic investigation of six burned structures distributed along the Street of the Dead, including sites at the Square of the Moon, the Room of Columns, the Northwest Complex of the San Juan River, the Superimposed Buildings, and the West Plaza. Magnetic analyses revealed pseudo-single-domain magnetite as the main remanence carrier and produced well-grouped paleodirections (site-mean declinations ranging from 341.1° to 1.7°, α95 ≤ 3.6°) and reliable absolute paleointensities (ranging from 39.4 ± 3.4 μT to 52.5 ± 5.4 μT), obtained using the Thellier-type double-heating method. Archaeomagnetic dating using both global geomagnetic models (SHAWQ.2k) and regional secular variation curves suggests that the last heating events at these sites occurred between ~400 and 500 AD—well before the traditionally cited Metepec phase (550–650 AD) and the so-called “Great Fire.” These findings challenge the prevailing chronological framework and provide compelling evidence that major episodes of destruction and depopulation may have begun earlier than previously recognized.

1. Introduction

Between approximately 2500 BC and 1500 AD, much of central and northern Mesoamerica was home to a diverse array of pre-Hispanic cultures, including the Olmecs, Zapotecs, Mayans, Mixtecs, Teotihuacans, and later the Aztecs, among others [1]. The Mesoamerican chronology is traditionally divided into three major periods. The Preclassic period (1200 BC to 200 BC) witnessed the rise of the Olmec civilization—considered the first major Mesoamerican culture—alongside the earliest Mayan cities and the Cuicuilco culture in Central México. The Classic period (200 BC to 900 AD) marked the flourishing of urban centers, most notably the great city of Teotihuacan. During the Postclassic period (900 AD to 1500 AD), the Toltecs and Mixtecs were dominant in the early phase, followed by the rise of the Aztecs in the later phase [2].
Teotihuacan was one of the most influential cities in ancient Mesoamerica and remains one of the most thoroughly studied archaeological sites in México. Located at about 2250 m above sea level on the semi-arid Mexican Plateau, Teotihuacan thrived between ~1 BC and 650 AD, centuries before the arrival of the Aztecs [3]. At its peak, between approximately 350 and 450 AD, the city’s population is estimated to have ranged from 100,000 to 200,000 inhabitants, and its urban footprint extended over ~20 km2 [4]. However, Rattray [5] considers the development peak around 500 AD. Teotihuacan served not only as a major religious center but also as a significant economic hub, particularly noted for its role in obsidian extraction and long-distance trade [6]. The city retained its prestige even after its abandonment, becoming part of Aztec mythology as the site of the creation of the Fifth Sun [7]. The name “Teotihuacan,” meaning “the place where the gods were created,” was later given by the Aztecs, who encountered the site in a state of ruin.
The city was planned with remarkable precision. Its ceremonial core was organized along a central axis—the Street of the Dead—which runs roughly north–south and aligns several of the city’s most iconic structures, including the Pyramid of the Moon, the Palace of Quetzalpapálotl, the Patio of the Jaguars, and the Pyramid of the Sun. The Aztecs called this street “Miccaotli,” or “Road of the Dead,” believing the mounds flanking it were tombs. This main thoroughfare is approximately 40 m wide and culminates in the Plaza of the Moon at its northern end. The San Juan River was artificially diverted to intersect the city perpendicularly, dividing Teotihuacan into four quadrants [8].
The causes behind Teotihuacan’s collapse remain unclear. Several hypotheses suggest that internal sociopolitical transformations and external pressures are at play. Manzanilla [9,10] provided a detailed chronology indicating a sequence of transformative events: (1) widespread burning of temples and other key structures, (2) abandonment of the city by its original inhabitants, (3) looting by the Coyotlatelco groups, and (4) subsequent reoccupation by these same groups. A recent archaeomagnetic study by Goguitchaichvili et al. [11], which examined a limited number of samples, suggested that fire exposure events in some structures occurred between ~325 and 440 AD, providing evidence of numerous incendiary events that could have been related to cyclical rituals, long before the final fires. This finding contradicts the general consensus of a single event linked to urban collapse in the 7th century AD. In this work, both full-vector data and paleointensity measurements were acquired. All three analyzed structures yielded nearly indistinguishable mean paleodirections: 1: Inc = 45.2°, Dec = 355.4°, α95 = 1.7°, k = 1038, N = 8; 2: Inc = 44.3°, Dec = 354.4°, α95 = 2.6°, k = 776, N = 8; and 3: Inc = 44.1°, Dec = 356.1°, α95 = 2.3°, k = 573, N = 8. The corresponding absolute paleointensities ranged from 49.5 to 54.5 μT. For archaeomagnetic dating, the geomagnetic field model SHADIF14k was used.
Earlier archaeological investigations, including those by Armillas [12], Bernal [13], and Millon [14,15], supported a later destruction phase, centered between the 6th and 7th centuries AD, as reviewed by Moragas Segura [16]. Many excavations along the Street of the Dead have documented substantial fire damage in buildings [15]. In this study, we conducted an archaeomagnetic investigation of six burned structures—both walls and floors—along the Street of the Dead to refine the chronological framework surrounding Teotihuacan’s abandonment. Our comprehensive approach included thermomagnetic analyses, hysteresis loop measurements, alternating field demagnetization, and double heating archaeointensity experiments. No charcoal remains were found within our sampling areas, precluding the possibility of radiocarbon dating. Regarding luminescence, thermoluminescence (TL) dating has been tested in Mesoamerica in the past, but often produced highly inconsistent results, likely due to complex firing and re-heating histories. Optically stimulated luminescence (OSL) is a promising alternative; however, this technique is currently not available in México. Here, we emphasize the significance of the paleomagnetic method in archaeology. We note that paleomagnetic methods applied to burned archaeological artifacts permit the study of fluctuations and variations in the Earth’s magnetic field—both directions and absolute intensity. Beyond the geomagnetic implications, the benefits to archaeology are evident, as these methods enable absolute dating.

2. Sampling Details and Experimental Procedures

All sampling sites are located along the Street of the Dead (Figure 1), between the Pyramid of the Moon and the San Juan River (Table 1). Clear evidence of fire exposure was the primary criterion for selecting the most promising areas for archaeomagnetic dating. Two adjacent burned structures (laboratory codes T1 and T2) were sampled at the Square of the Moon (Plaza de la Luna). Site T3 corresponds to the Room of the Columns in Structure 28 on Millon’s original site map [14]. Site T4 was sampled from the northwest complex near the San Juan River. Sites T5-1 and T5-2 are adjacent exposures within the area known as the “Superimposed Buildings,” while site T6 is located in the West Square sector.
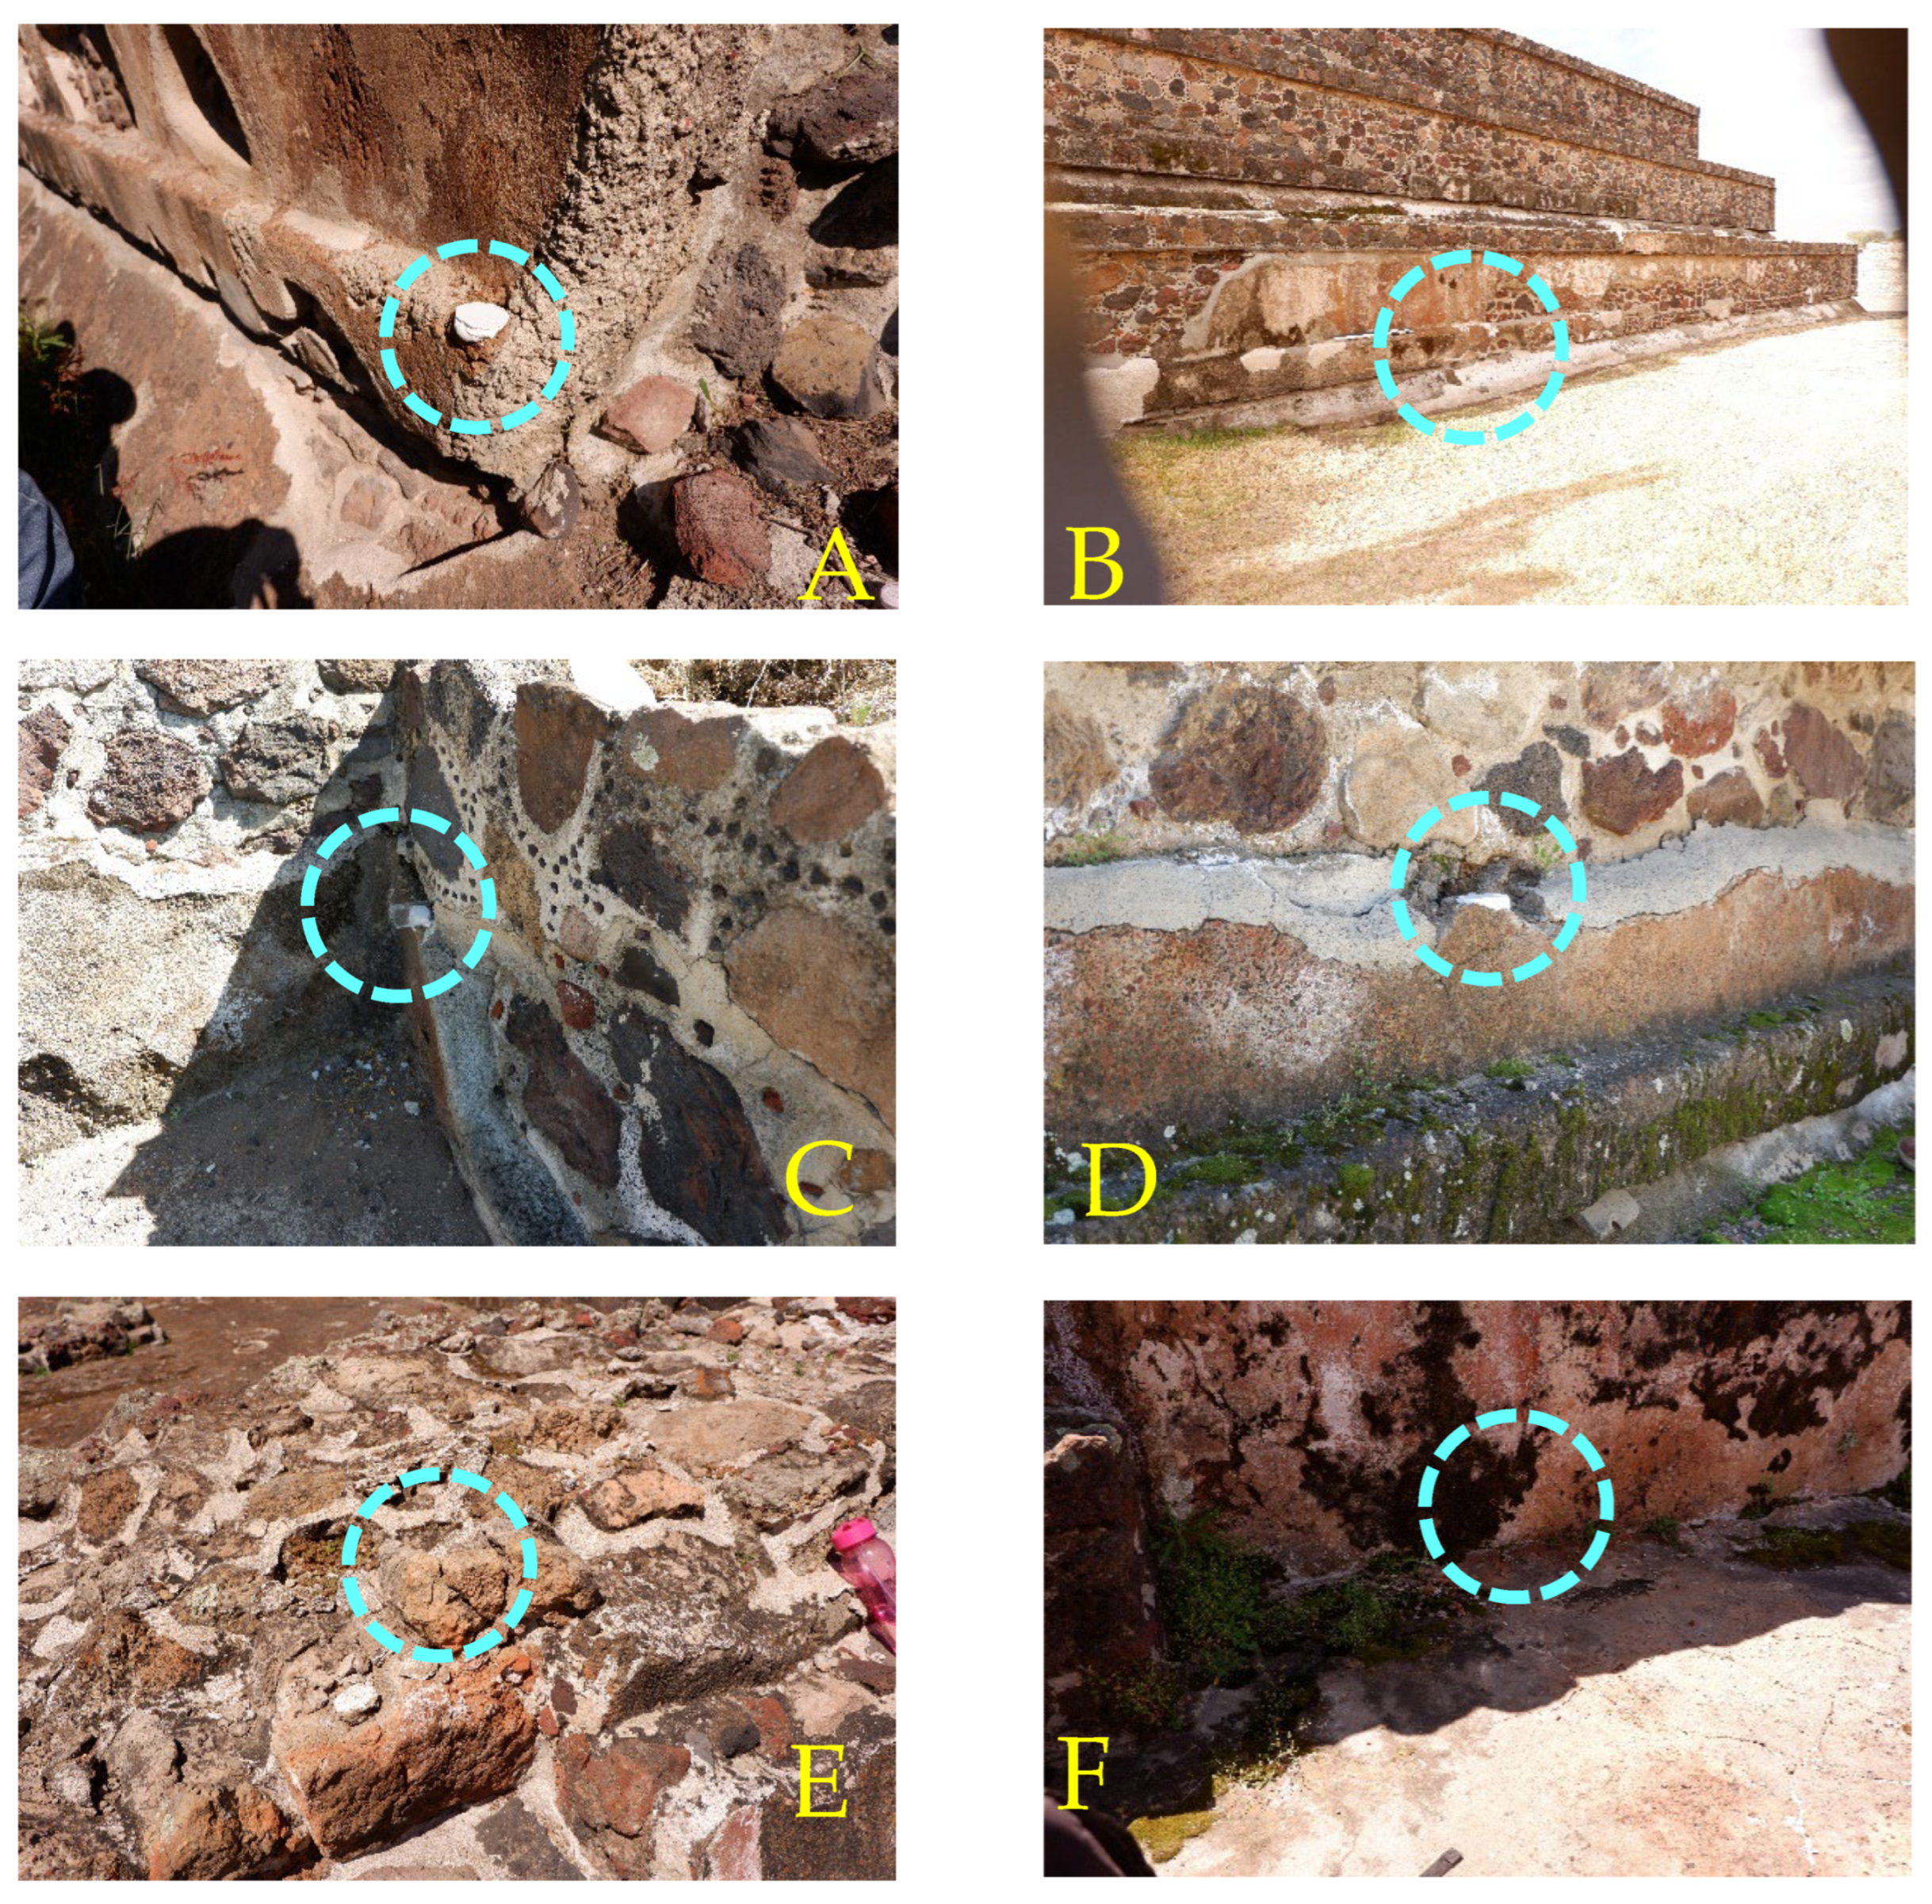
To collect oriented hand samples from burned floors or walls (Figure 2), a small layer of plaster was applied to the horizontal surface of each structure to create a level base. Once leveled, orientation was done using a Brunton-type compass. A straight reference line was marked with a permanent marker in the direction of magnetic north. Simultaneously, the azimuth of the sun’s shadow was recorded using a magnetic compass to allow correction for local magnetic declination. Two oriented hand blocks were collected from each sampled structure. Cubic specimens of approximately 2 cm3 were subsequently cut from these hand samples for magnetic measurements. These specimens were specifically cut for stepwise alternating field demagnetization experiments to isolate the characteristic remanent magnetization (ChRM) directions. We accounted for the local magnetic environment by applying a correction for the local magnetic declination at each sampling point. No significant influence from artificial or lithological magnetic disturbances was detected at any of the sampling sites.
To identify the main magnetic carriers and evaluate their thermal stability, we employed a Variable Field Translation Balance (VFTB), also known as a Curie Balance. These analyses included thermomagnetic curves (magnetization vs. temperature) and hysteresis loop measurements up to ~0.8 Tesla. Hysteresis parameters—saturation magnetization (Ms), saturation remanence (Mrs), coercivity (Bc), and coercivity of remanence (Bcr)—were calculated after correcting for dia- and paramagnetic contributions (primarily paramagnetic). All remanent magnetizations, including laboratory-induced partial thermoremanent magnetizations (pTRMs), were measured using an AGICO JR-6 spinner magnetometer. Archaeomagnetic directions were obtained using an AGICO LDA-5 alternating field demagnetizer, allowing us to identify the primary characteristic remanent magnetization (Table 1).
Absolute paleointensity determinations were performed using the double-heating Thellier method [18] with the Coe-modified protocol [19,20]. Experiments were carried out using a dual-chamber TD-48 thermal demagnetizer equipped with DC field coils. All heating and cooling steps were conducted in air, with specimens cooled naturally in a laboratory field of 50 µT. Heating steps were generally applied up to ~560 °C, with four repeated control steps at key temperature intervals for most samples. Anisotropy corrections were applied using the anhysteretic remanent magnetization (AARM) method, following the approach described in Pérez-Rodríguez et al. [21] and Chauvin et al. [22]. The specimen-wise correction factors ranged from 0.94 to 0.99; the intensities reported in Table 2 are already AARM-corrected and were used for dating.

3. Main Results and Discussion

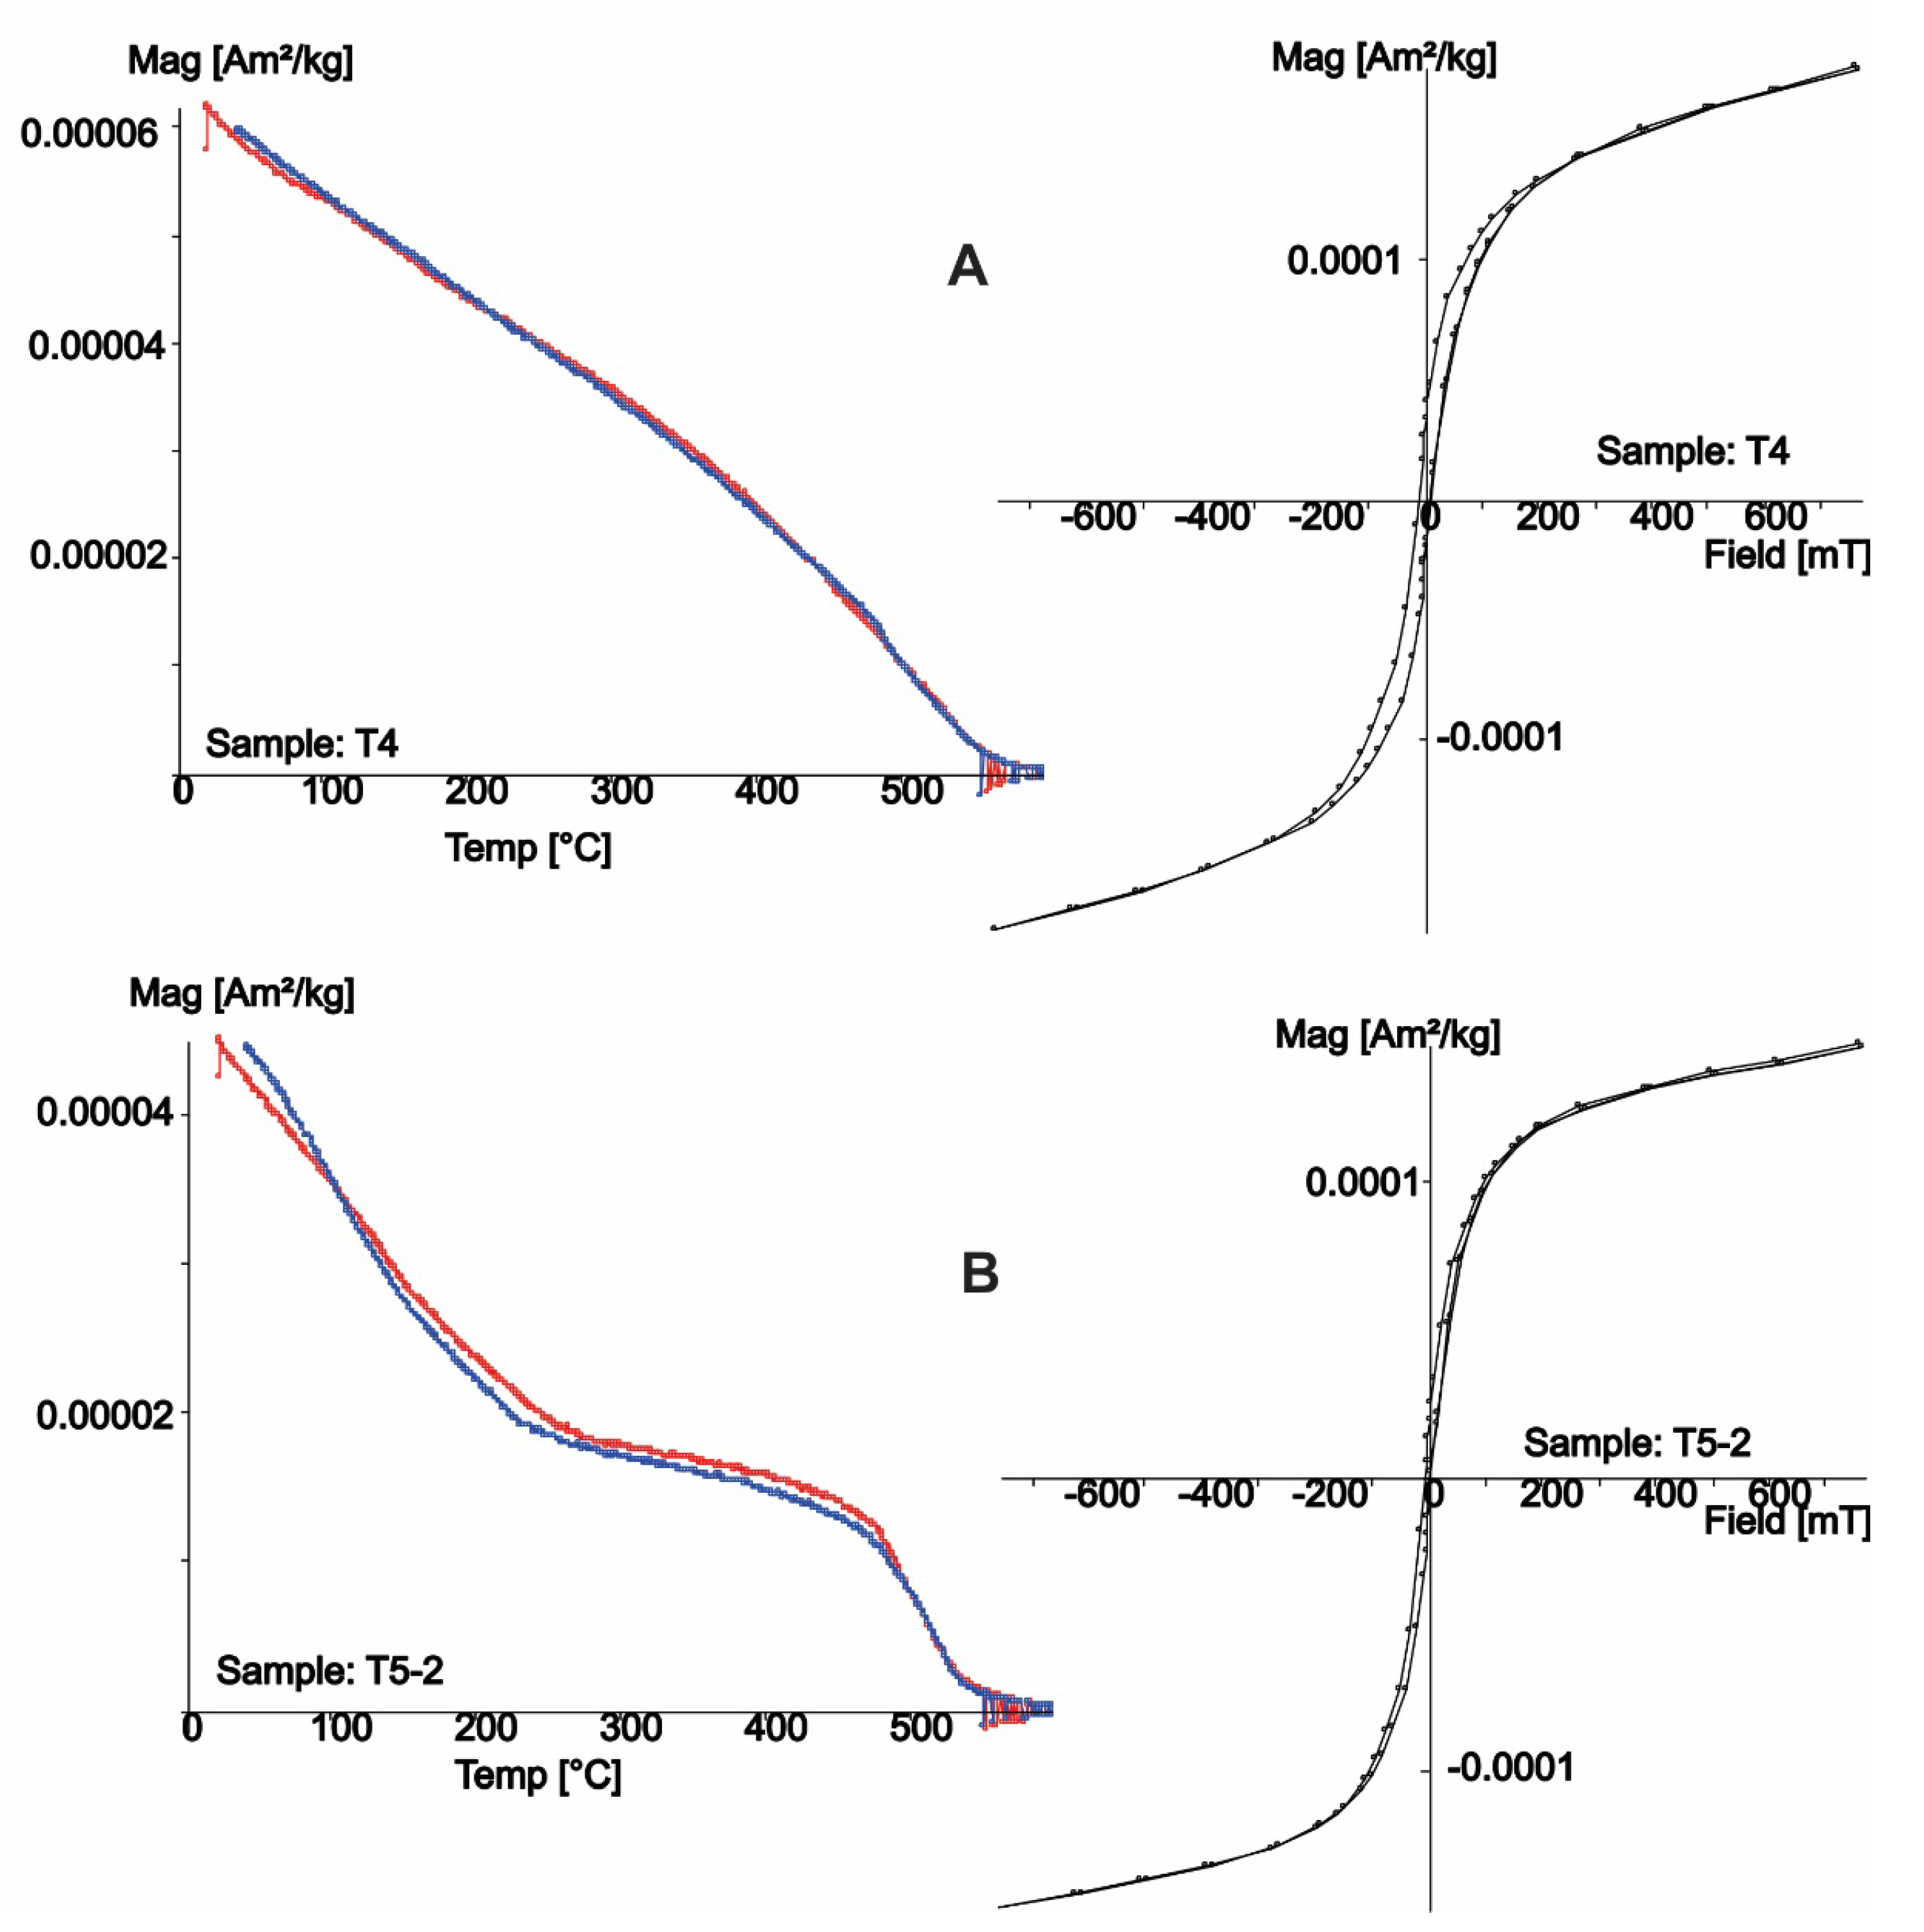
Thermomagnetic curves (Ms–T) revealed two main types of magnetic behavior. Most samples exhibited a single dominant ferrimagnetic phase (Figure 3A), consistent with nearly pure, unsubstituted magnetite. Some curves also showed minor features above 600 °C, suggesting the possible presence of hematite. Several samples from the Square of the Moon displayed evidence for two distinct magnetic phases (Figure 3B), both during heating and cooling cycles. The thermomagnetic curves remained reversible, indicating high thermal stability. A low-temperature phase around 250 °C likely corresponds to Ti-rich titanomagnetite, while magnetite remains the primary magnetic carrier. Despite minor variations in magnetic coercivity, the hysteresis loops were generally consistent across all samples, supporting the interpretation of pseudo-single-domain (PSD) magnetic grains [24]. The Ms–T runs were acquired at a fixed applied field that is below full saturation for these samples, whereas hysteresis loops were measured up to ~0.8 T. Moreover, the Ms–T and hysteresis measurements used different specimen chips and normalizations and involved different dia/paramagnetic corrections. Consequently, absolute magnitudes need not match, even though the diagnostic features (Curie point, reversibility) are fully consistent.
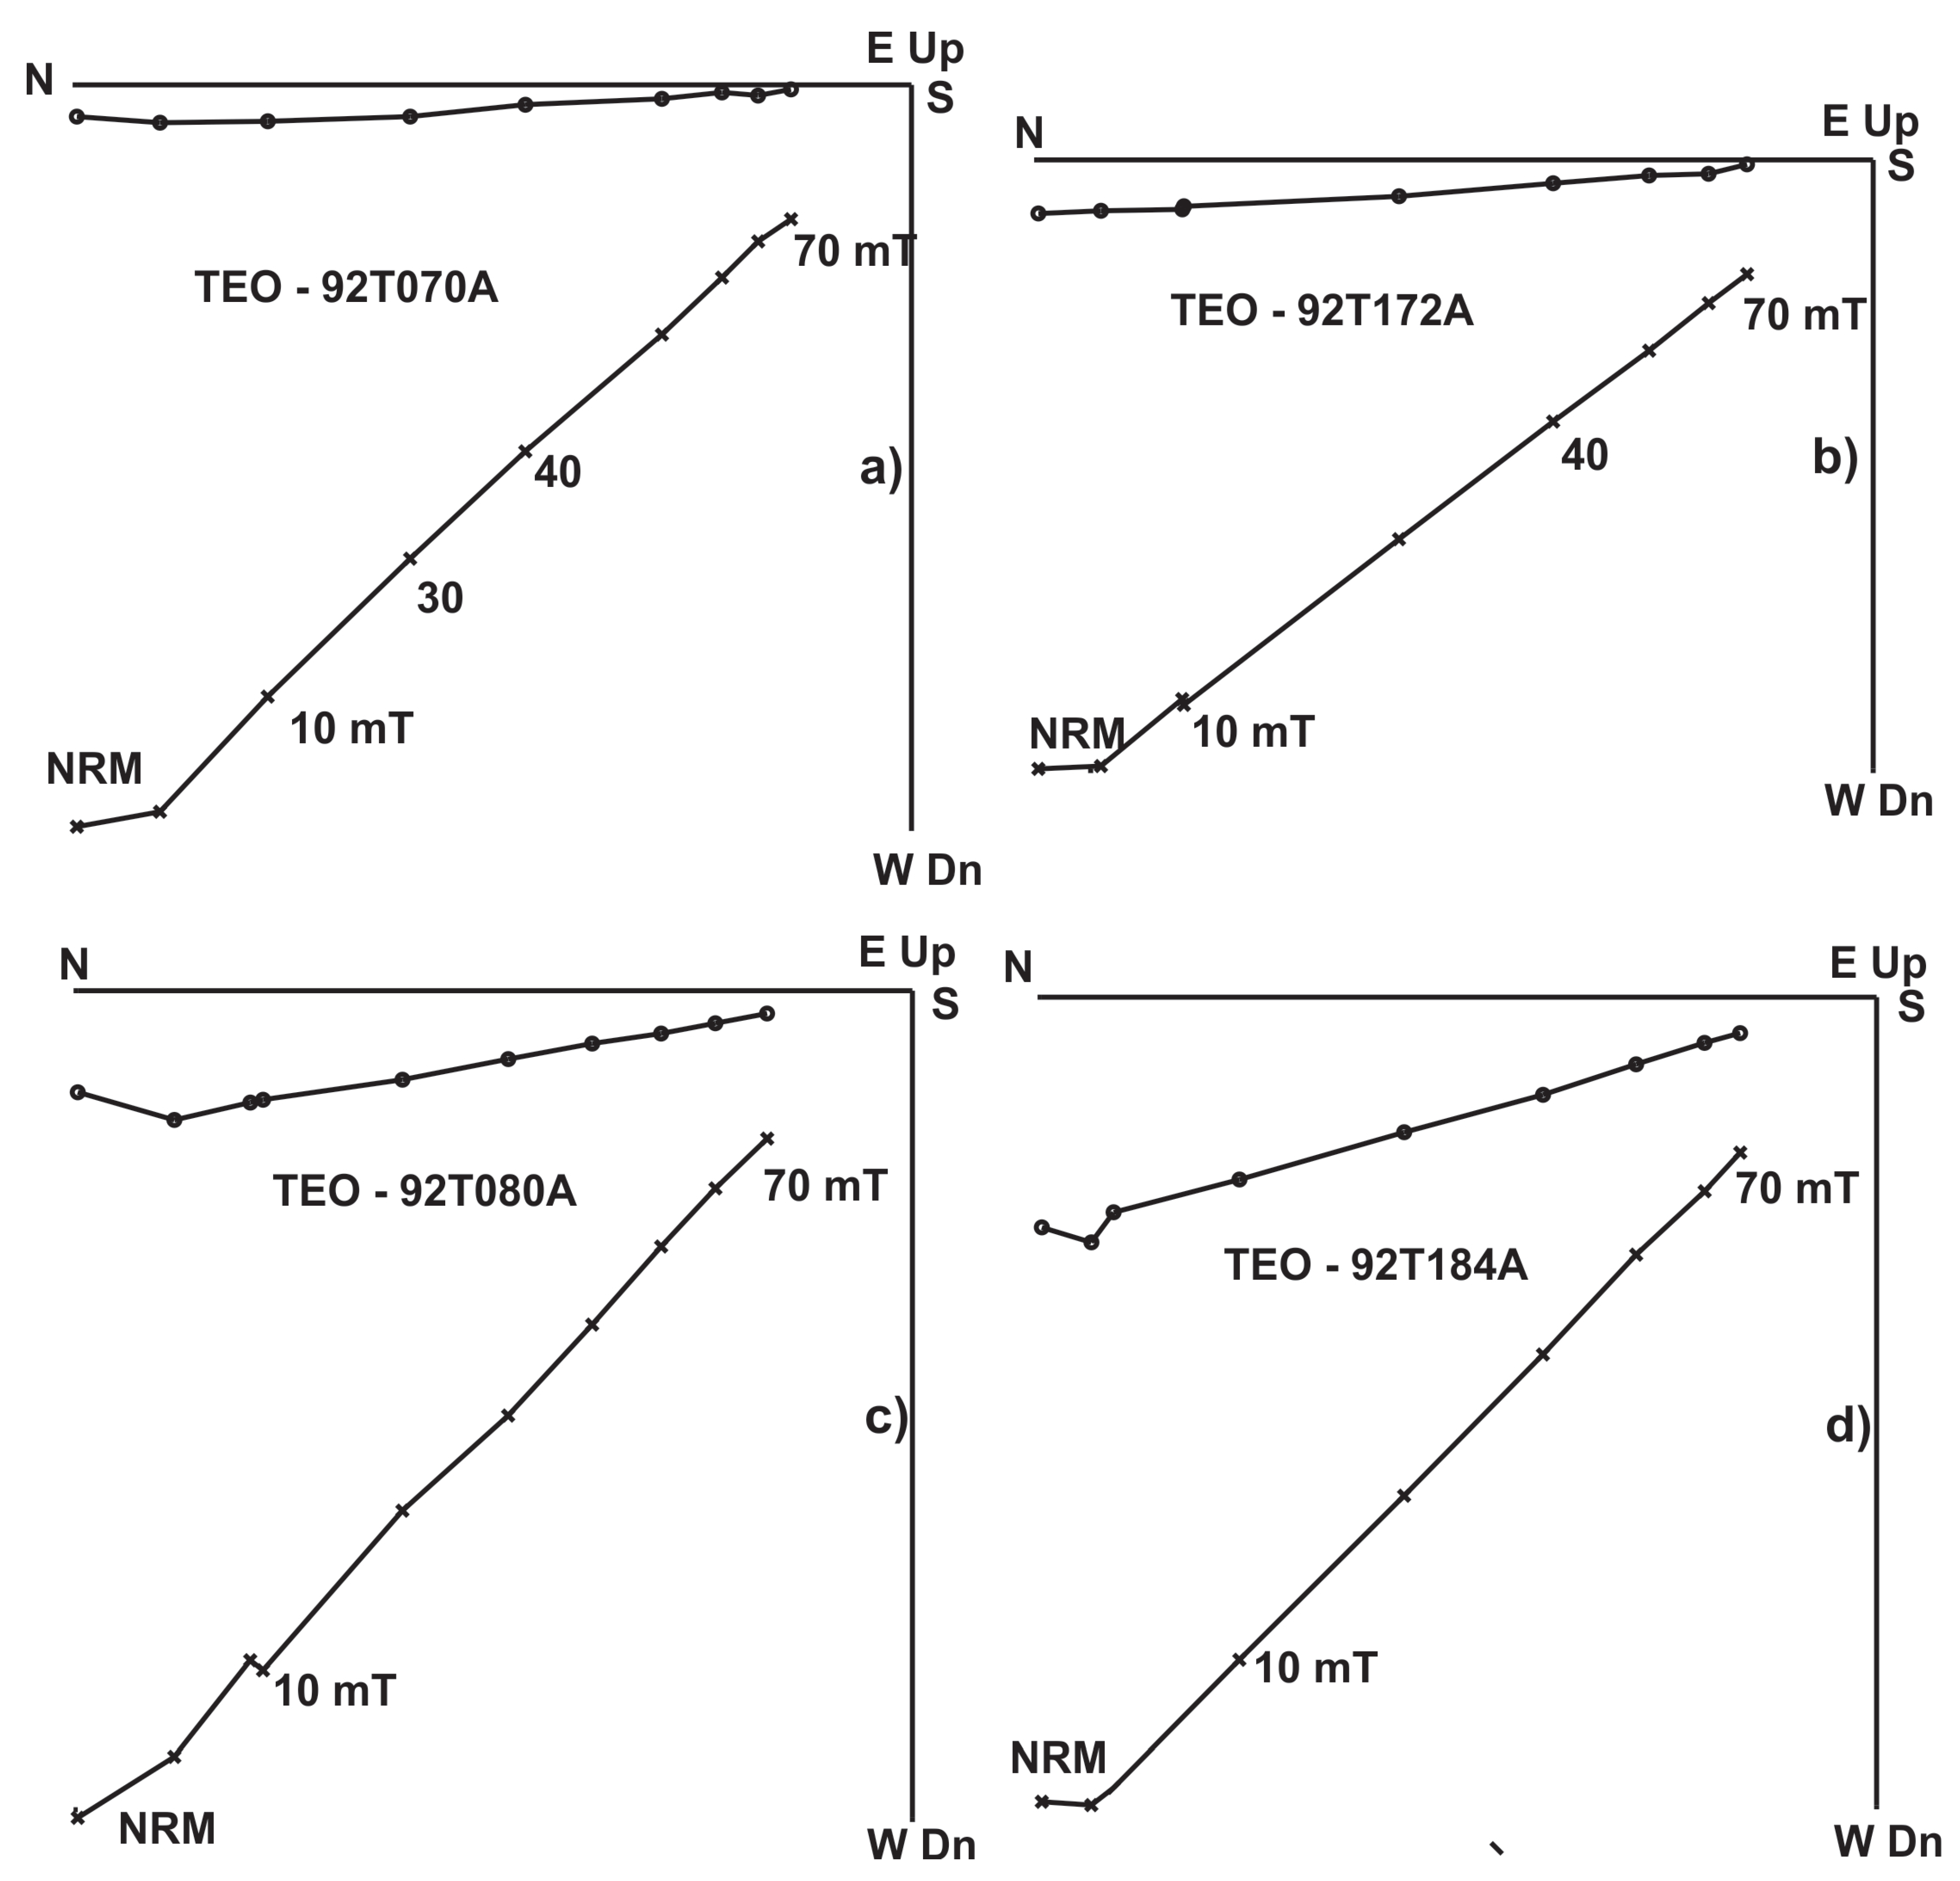
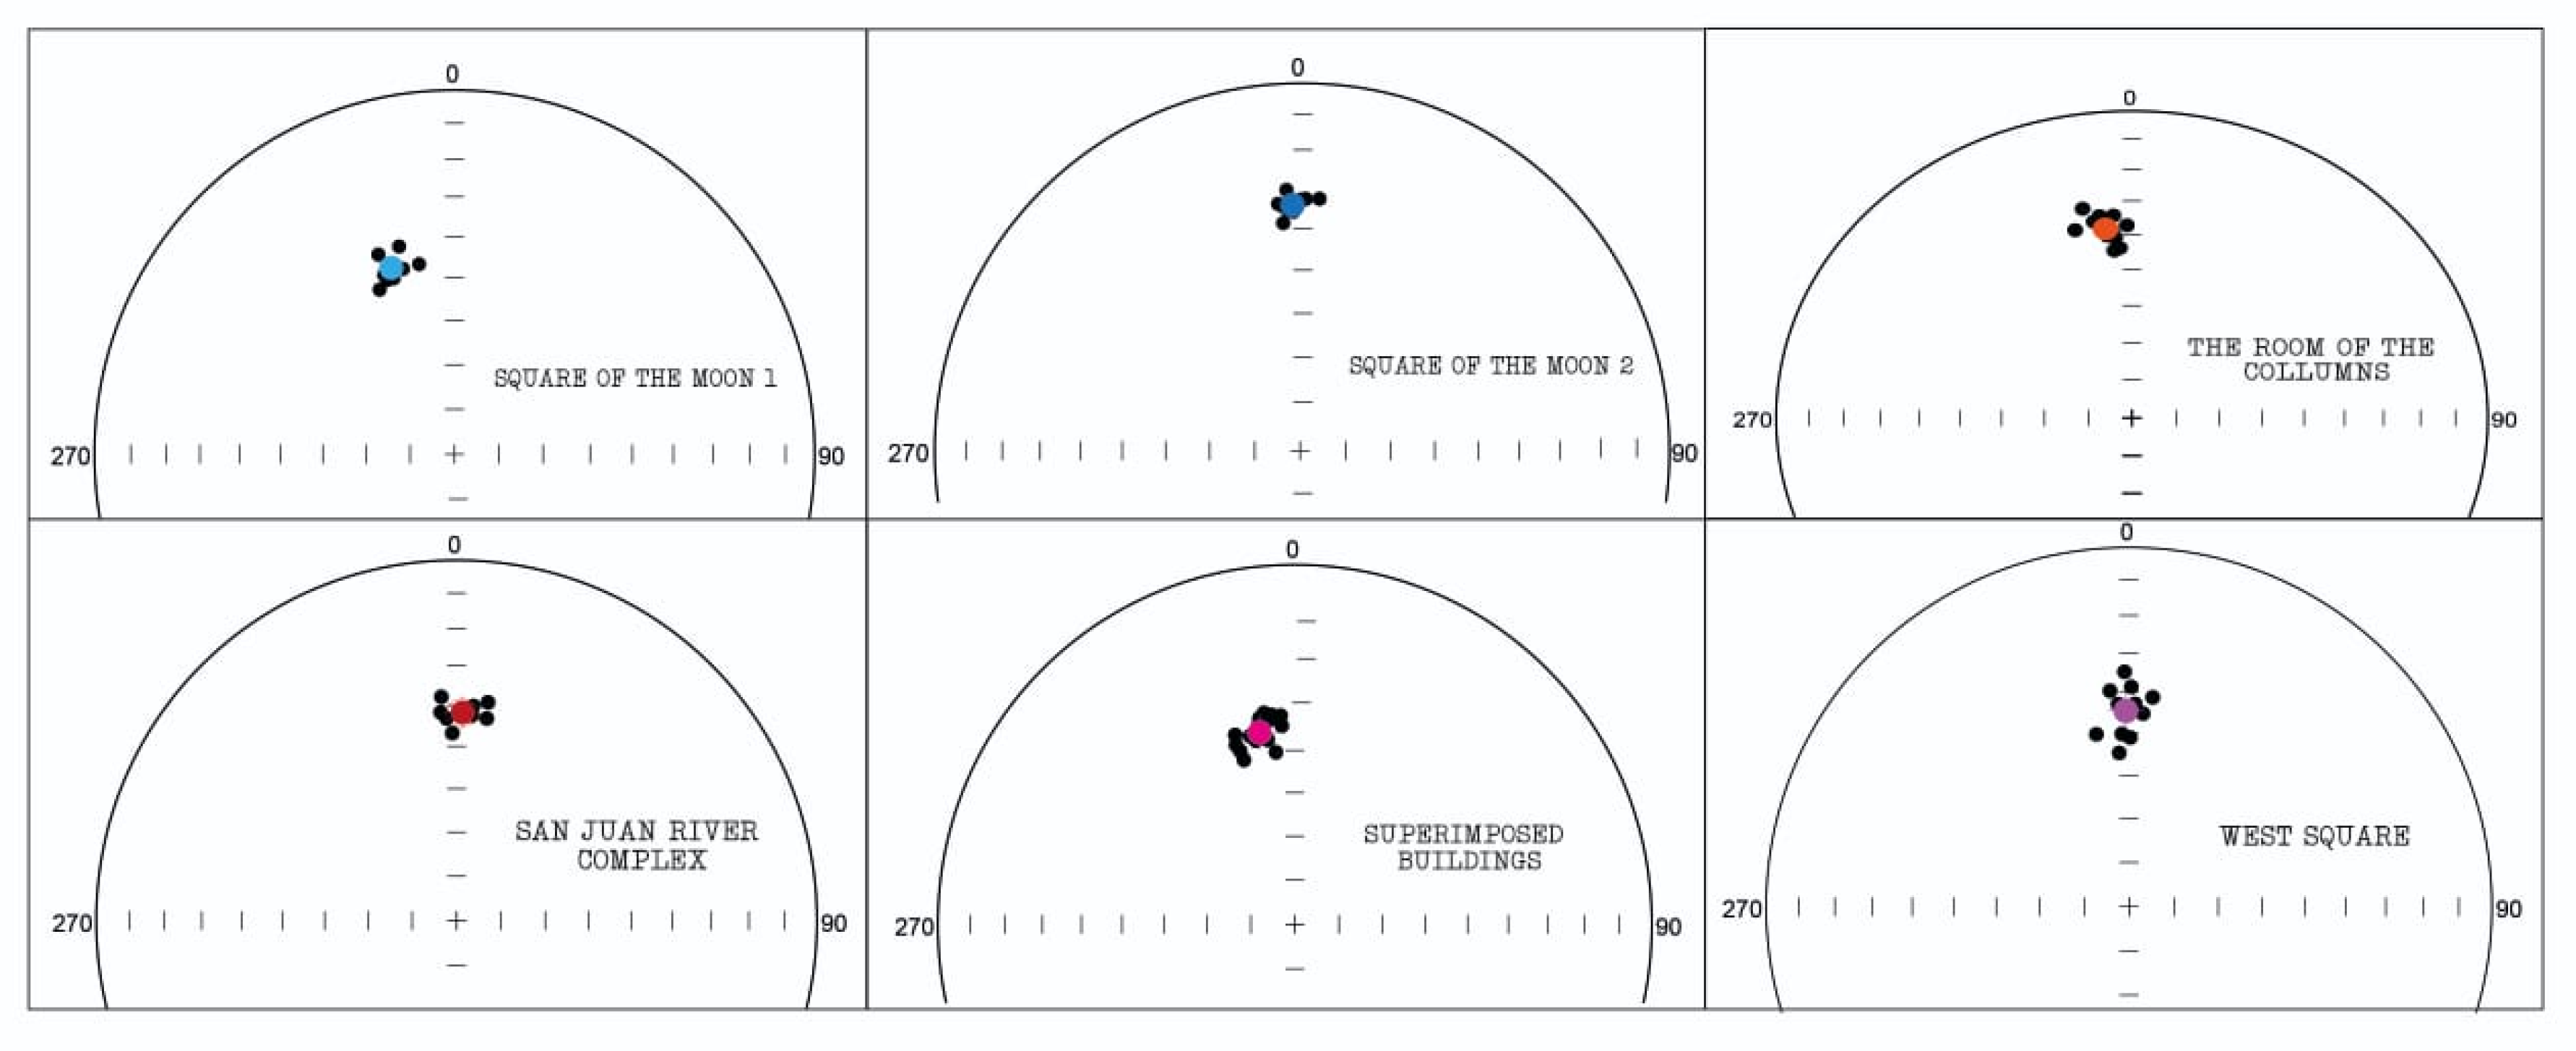
Alternating field (AF) demagnetization revealed that most samples contained a single, stable paleomagnetic component that decayed toward the origin (Figure 4). A weak viscous overprint was typically removed during the initial AF steps. The majority of remanent magnetization was eliminated by a peak AF of 70 mT, confirming that hematite played a negligible role in the acquisition of remanence. Characteristic remanent magnetization (ChRM) directions were successfully isolated in most specimens (Table 1), and site-mean archaeodirections were well-defined, with α95 values consistently below 3.6° (Figure 5).
Absolute archaeointensity determinations were attempted only on samples that displayed a single magnetization component and reversible thermomagnetic behavior. Hysteresis results were not used as a selection criterion. In total, 64 samples were subjected to double-heating Thellier-type paleointensity experiments, of which 34 yielded technically acceptable results (Figure 6; Table 2), based on the basic quality criteria proposed by Coe [19,20] and Patersen [25] for Type A and B determinations. Some individual paleointensity determinations were rejected because they did not meet the selection criteria used in this study. The corresponding parameters, above the threshold, are shown red in Table 2. However, the individual paleointensities are close to the average values. Some specimens exhibited concave-up Arai–Nagata plots [26] and were excluded due to failure to meet these criteria. the concavity—mostly due to the presence of large multidomain magnetic grains—is a subtle feature that is not always directly visible in Arai–Nagata plots but is revealed by the selection-criteria parameters we used. The accepted site/structure mean absolute paleointensities ranged from 52.5 ± 5.4 µT to 39.4 ± 3.4 µT.
Before applying archaeomagnetic dating, it is necessary to consider the well-established archaeological chronology of Teotihuacan. The earliest cultural period is known as the Tezoyuca–Patlachique phase (200 BC–1 AD), during which the first populations began to settle in the Teotihuacan Valley. By approximately 100 BC, the region had a population of around 5000 inhabitants within an area of 4–6 km2. The eruption of the Xitle volcano is believed to have displaced some Cuicuilco populations, contributing to Teotihuacan’s growth. During this phase, Teotihuacan became the principal commercial center for obsidian [14]. In the subsequent Tzacualli phase (1–100 AD), the urban area expanded to ~20 km2, and major architectural projects—including the Pyramids of the Sun and the Moon and the Street of the Dead—were initiated. Construction also began on the Temple of Quetzalcoatl [14]. The population is estimated to have reached ~25,000, primarily concentrated in the northern sector of the city [27].
The Miccoatli phase (100–170 AD) saw further population growth, reaching ~60,000 inhabitants within an area of ~22 km2 [28]. Renovations were made to the Pyramid of the Sun, and the Citadel and Temple of Quetzalcoatl were completed. In the Tlamimilolpa phase (~170–350 AD), Teotihuacan continued to expand through the integration of groups from regions such as Veracruz and Oaxaca [6]. Large residential complexes were developed and consolidated. The Plaza of the Moon and the “Great Market” in front of the Citadel were completed during this time [14]. This period of prosperity appears to have concluded with a series of events: sculptures on the façade of the Temple of Quetzalcoatl were removed, and ritual activities were likely conducted to mark the end of the Tlamimilolpa phase [6].
During the Xolalpan phase (ca. 350–550 AD), Teotihuacan reached its demographic and cultural peak, with an estimated population of 150,000–200,000 [27,28] thanks to the constant migratory flows from various parts of Mesoamerica, mainly from the Mayan, Oaxacan and western regions [29]. Groups from regions such as Michoacán were also incorporated into the urban fabric [6]. This phase, termed by Millon as the “urban renewal phase,” was marked by extensive mural painting—many in red tones—and an iconographic shift from serpents to jaguars, reflecting the influence of migrant populations. Toward the end of this phase, the so-called “Great Fire” (ca. 550–650 AD) likely occurred. Evidence of widespread destruction—burned structures, dismantled architecture, and systematic looting—has been documented both in the ceremonial core and surrounding neighborhoods such as Xalla and Teopancazco [10,30,31,32]. Millon [15] observed signs of burning in nearly all major structures along the Street of the Dead, including temple staircases and platforms. During the Metepec phase (ca. 550–650 AD), the city’s decline accelerated. Buildings became less well constructed, and sociopolitical fragmentation led to the collapse of the Teotihuacan system. The city was ultimately abandoned and later occupied by the Coyotlatelco culture, who looted and reoccupied portions of the site [6]. Despite some localized renovations, the city entered a state of progressive disintegration.
The collapse and abandonment of Teotihuacan had a profound impact on the broader Mesoamerican world, given the city’s significant economic and political prominence during the Classic Period. Numerous internal and external factors likely contributed to its fall. Manzanilla [30,33] proposed that the weakening of centralized authority—driven by the rising wealth and power of intermediate-level elites—played a key role in undermining state cohesion. Environmental degradation, particularly deforestation and reduced rainfall, may have also contributed to agricultural decline [34].
Supporting this interpretation, Lachniet et al. [35] reconstructed 2400 years of precipitation history using a precisely dated stalagmite from southwestern México. Their data suggest that from ~550 to 850 AD, the region experienced anomalously dry conditions. Given that Teotihuacan’s agriculture was valley-based, food scarcity caused by prolonged droughts could have exacerbated societal stress and triggered famine, contributing significantly to the city’s abandonment.
Following abandonment, the city was repeatedly looted. Armillas [36] reported that all offerings in the Viking Group had been removed during the Teotihuacan era, and a new floor was constructed over the looted area. Sugiyama [37,38] documented looting at the Temple of Quetzalcoatl [39], and major plundering was also found in the Palace of Quetzalpapálotl and the Patio de los Pilares [30,33].
The final construction phases at several locations, including Calzada de los Muertos, Tetitla, and Atetelco, revealed the presence of large quantities of Coyotlatelco pottery [11,12]. This confirms that the Coyotlatelco people not only looted the abandoned city but also established a continued presence. Linda Manzanilla’s [30,33] excavations in the tunnels east of the Pyramid of the Sun provided further evidence that Coyotlatelco groups inhabited parts of the city, including several residential complexes, by around 600 AD.
Given the archaeological framework, a time interval of 1–800 AD was selected for archaeomagnetic dating. We used the geomagnetic model SHAWQ.2k which is based on spherical harmonic analysis and penalized cubic B-splines in time. Archaeomagnetic dating was performed using both the MATLAB-based dating tool [40,41,42] and ArchaeoPyDating [43]. Additionally, regional reference curves for Mesoamerica, developed by Mahgoub et al. [44] and García-Ruíz et al. [45], were employed. In this study, we prioritized the local curves. Non-dipole field contribution is critical for any archaeomagnetic research since the geomagnetic field elements varies in different manner at different places of the world. Relatively fast changes and significant shifts in the field may be used to increase the precision of archaeomagnetic dating [46].
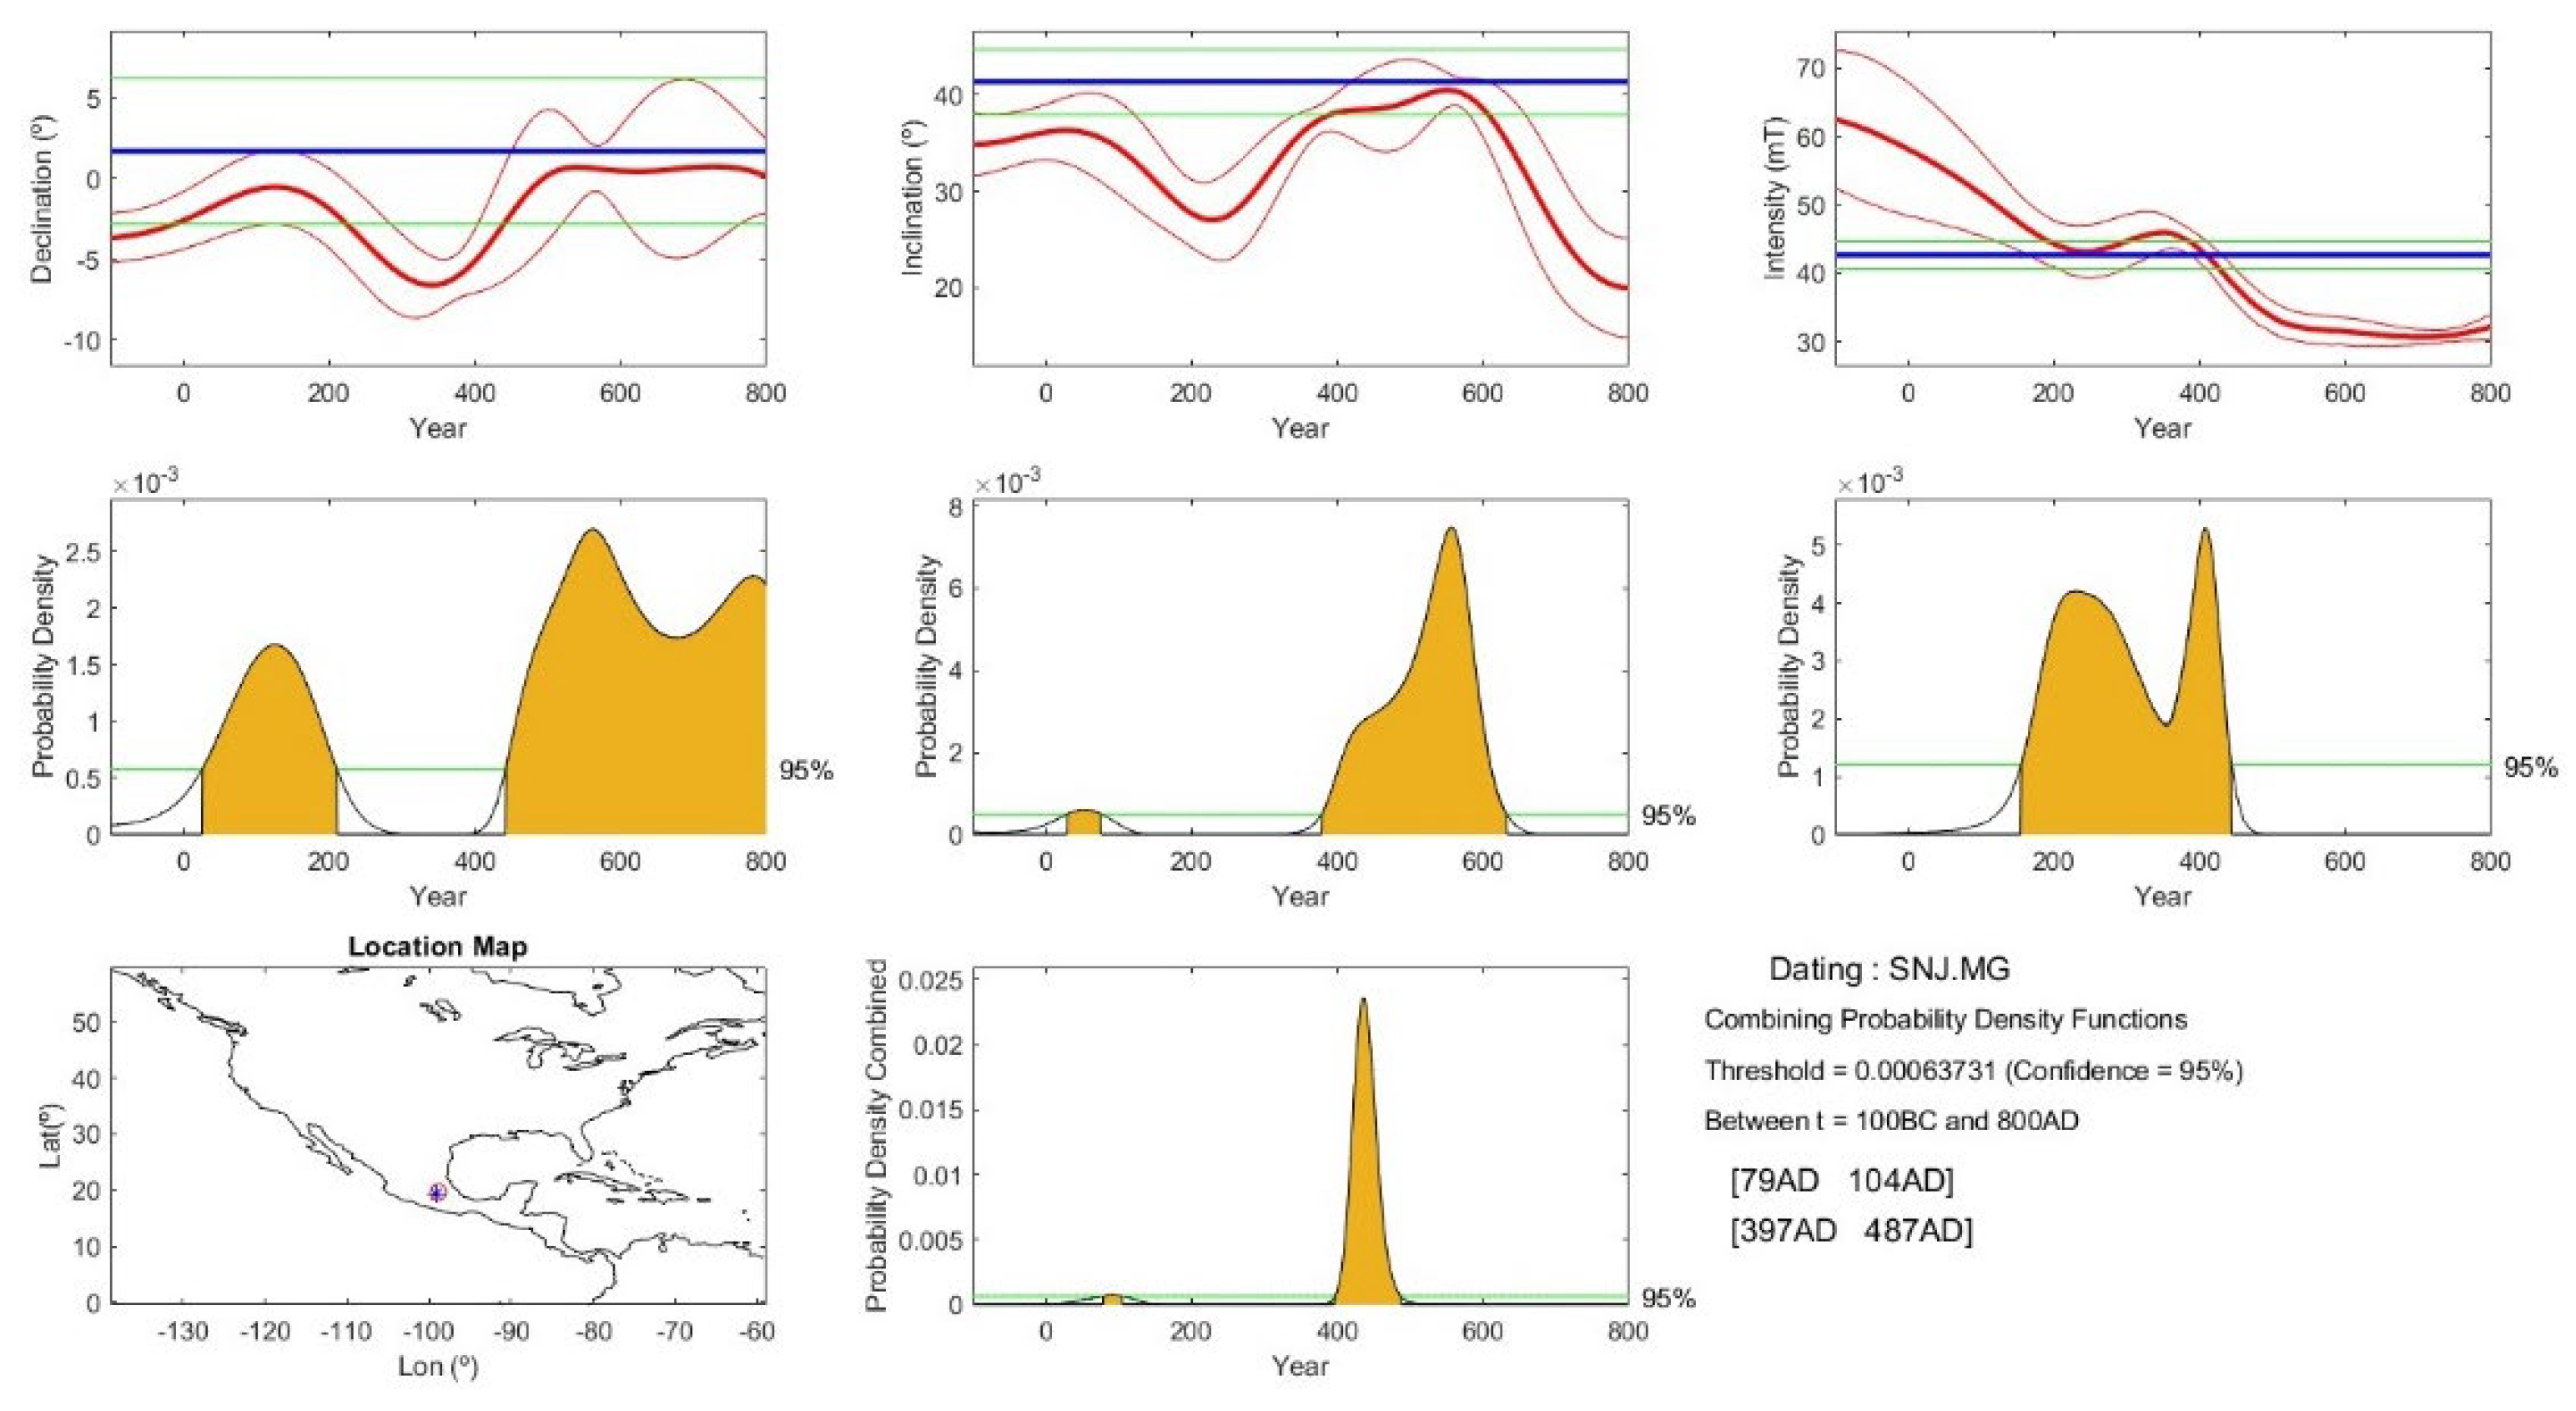
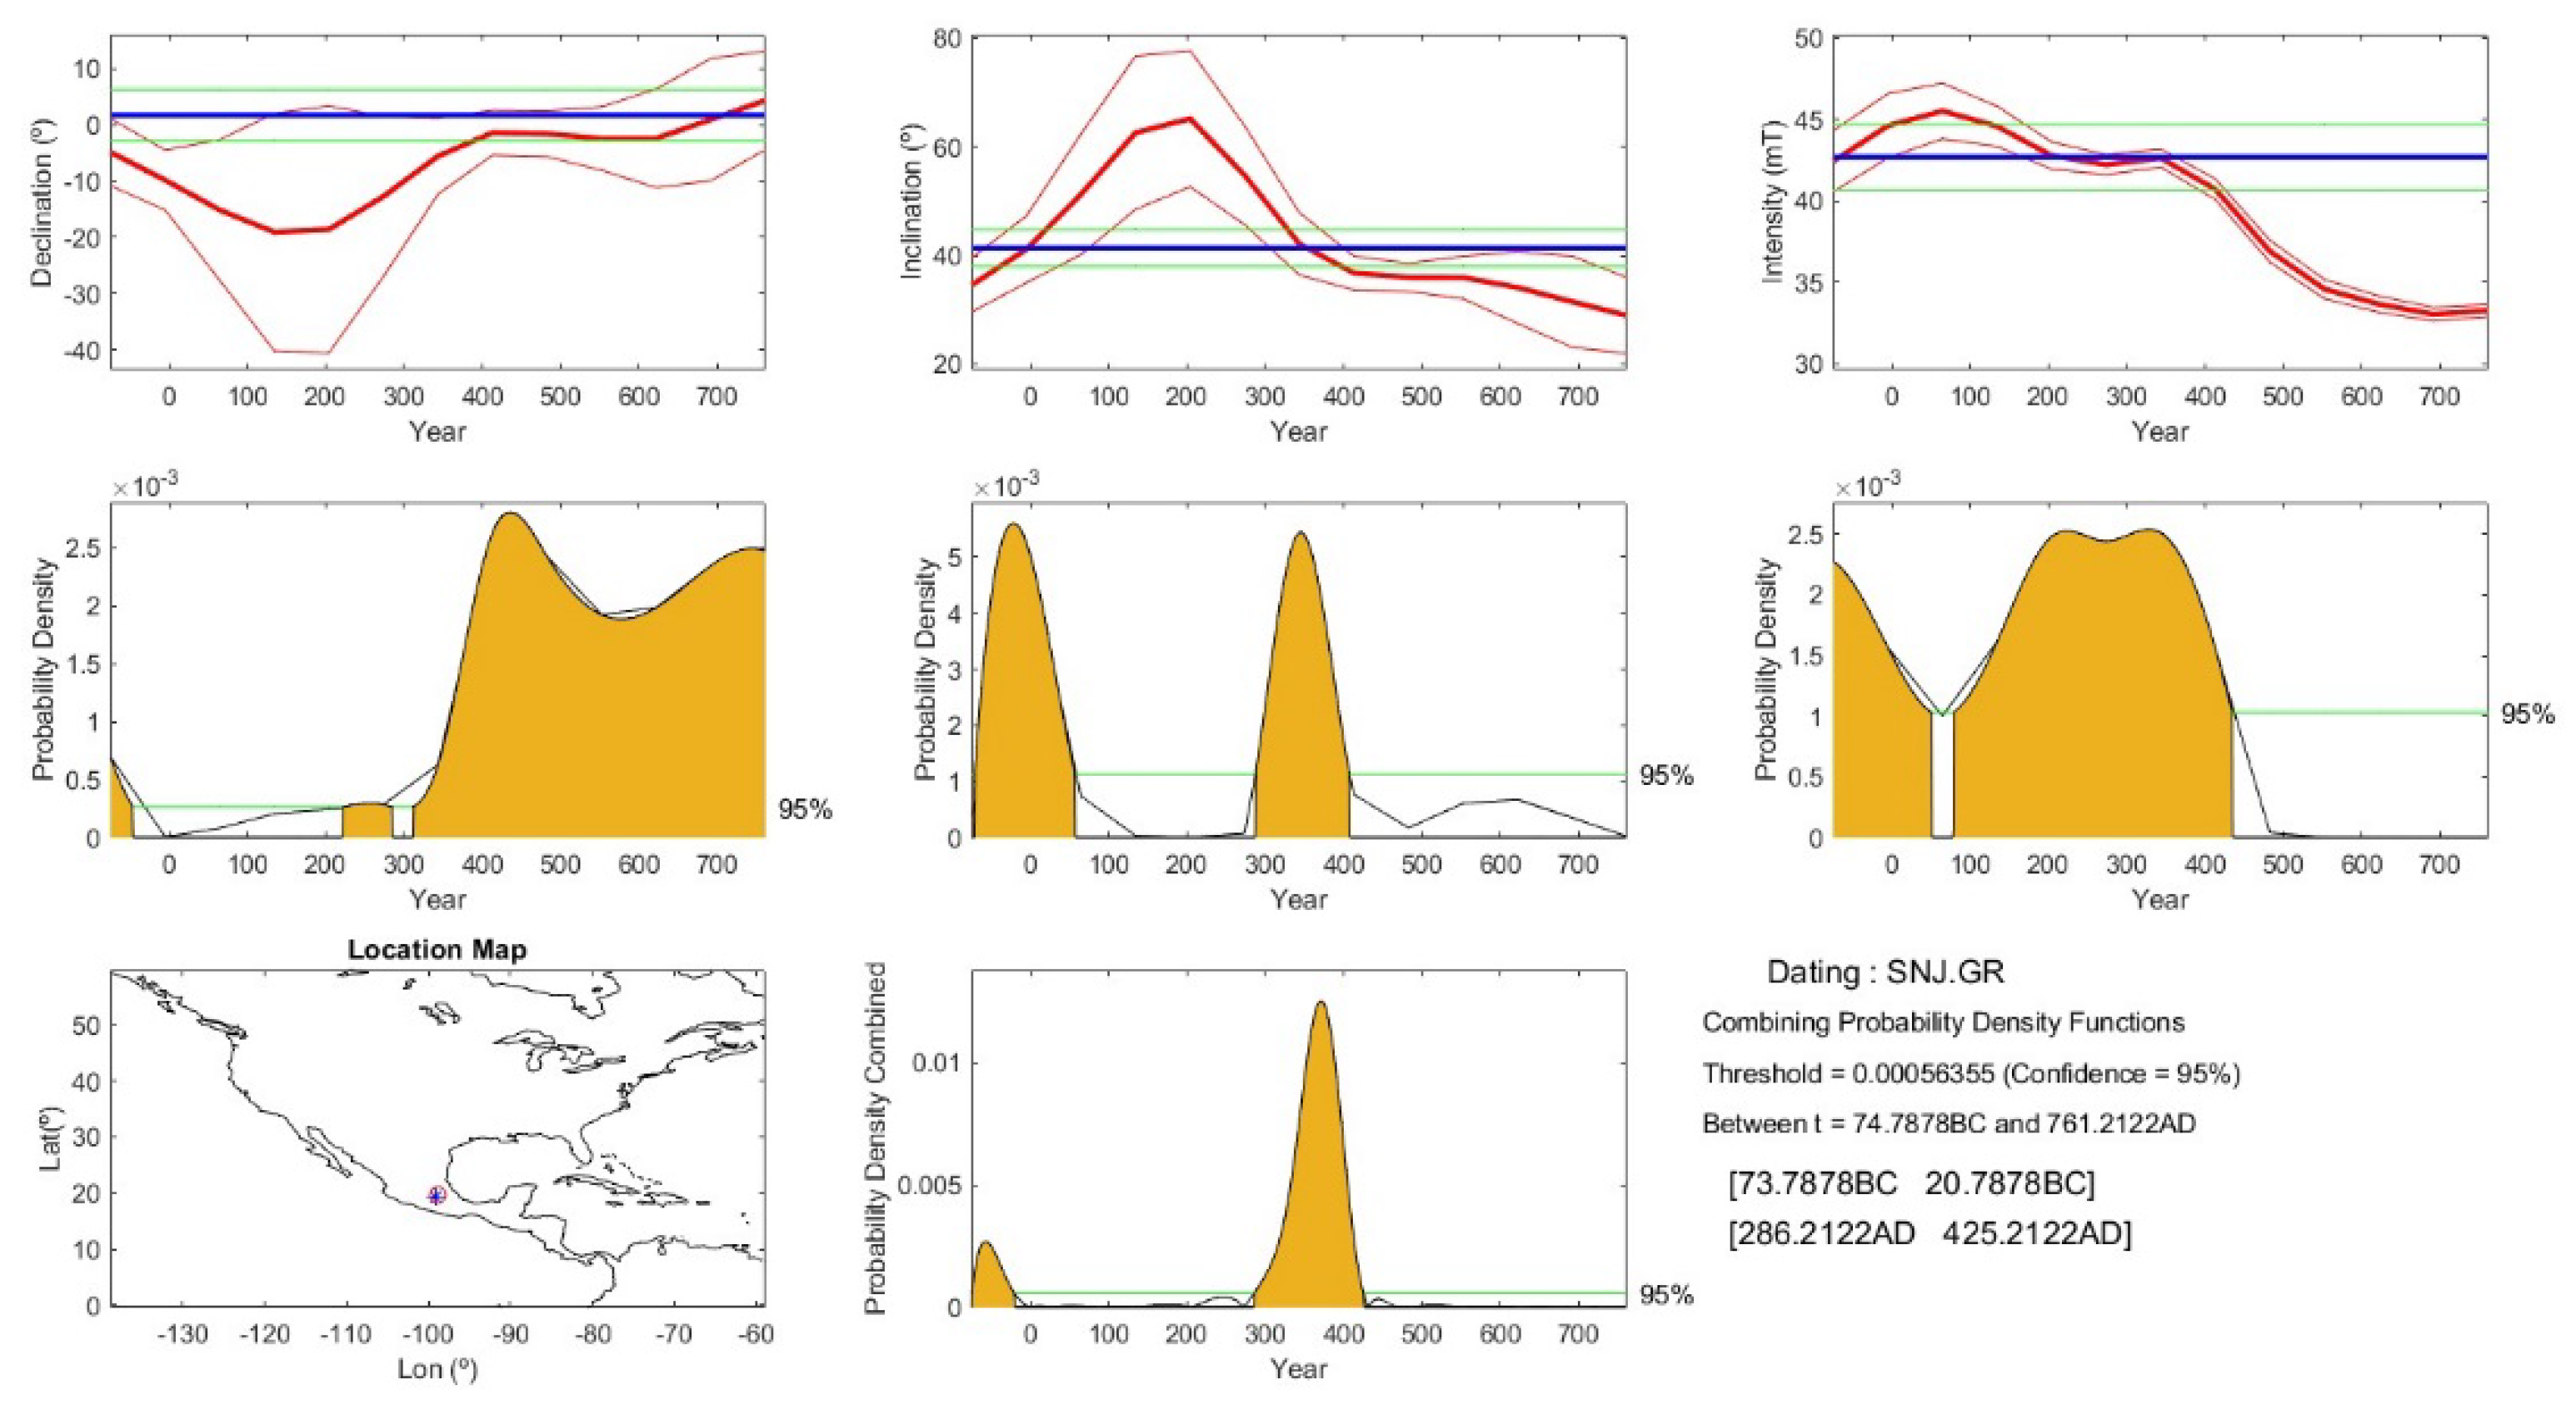
The most probable ages (Figure 7, Figure 8 and Figure 9) were obtained by evaluating the probability density function (PDF) associated with each site/structure (Table 3, Figure 10).
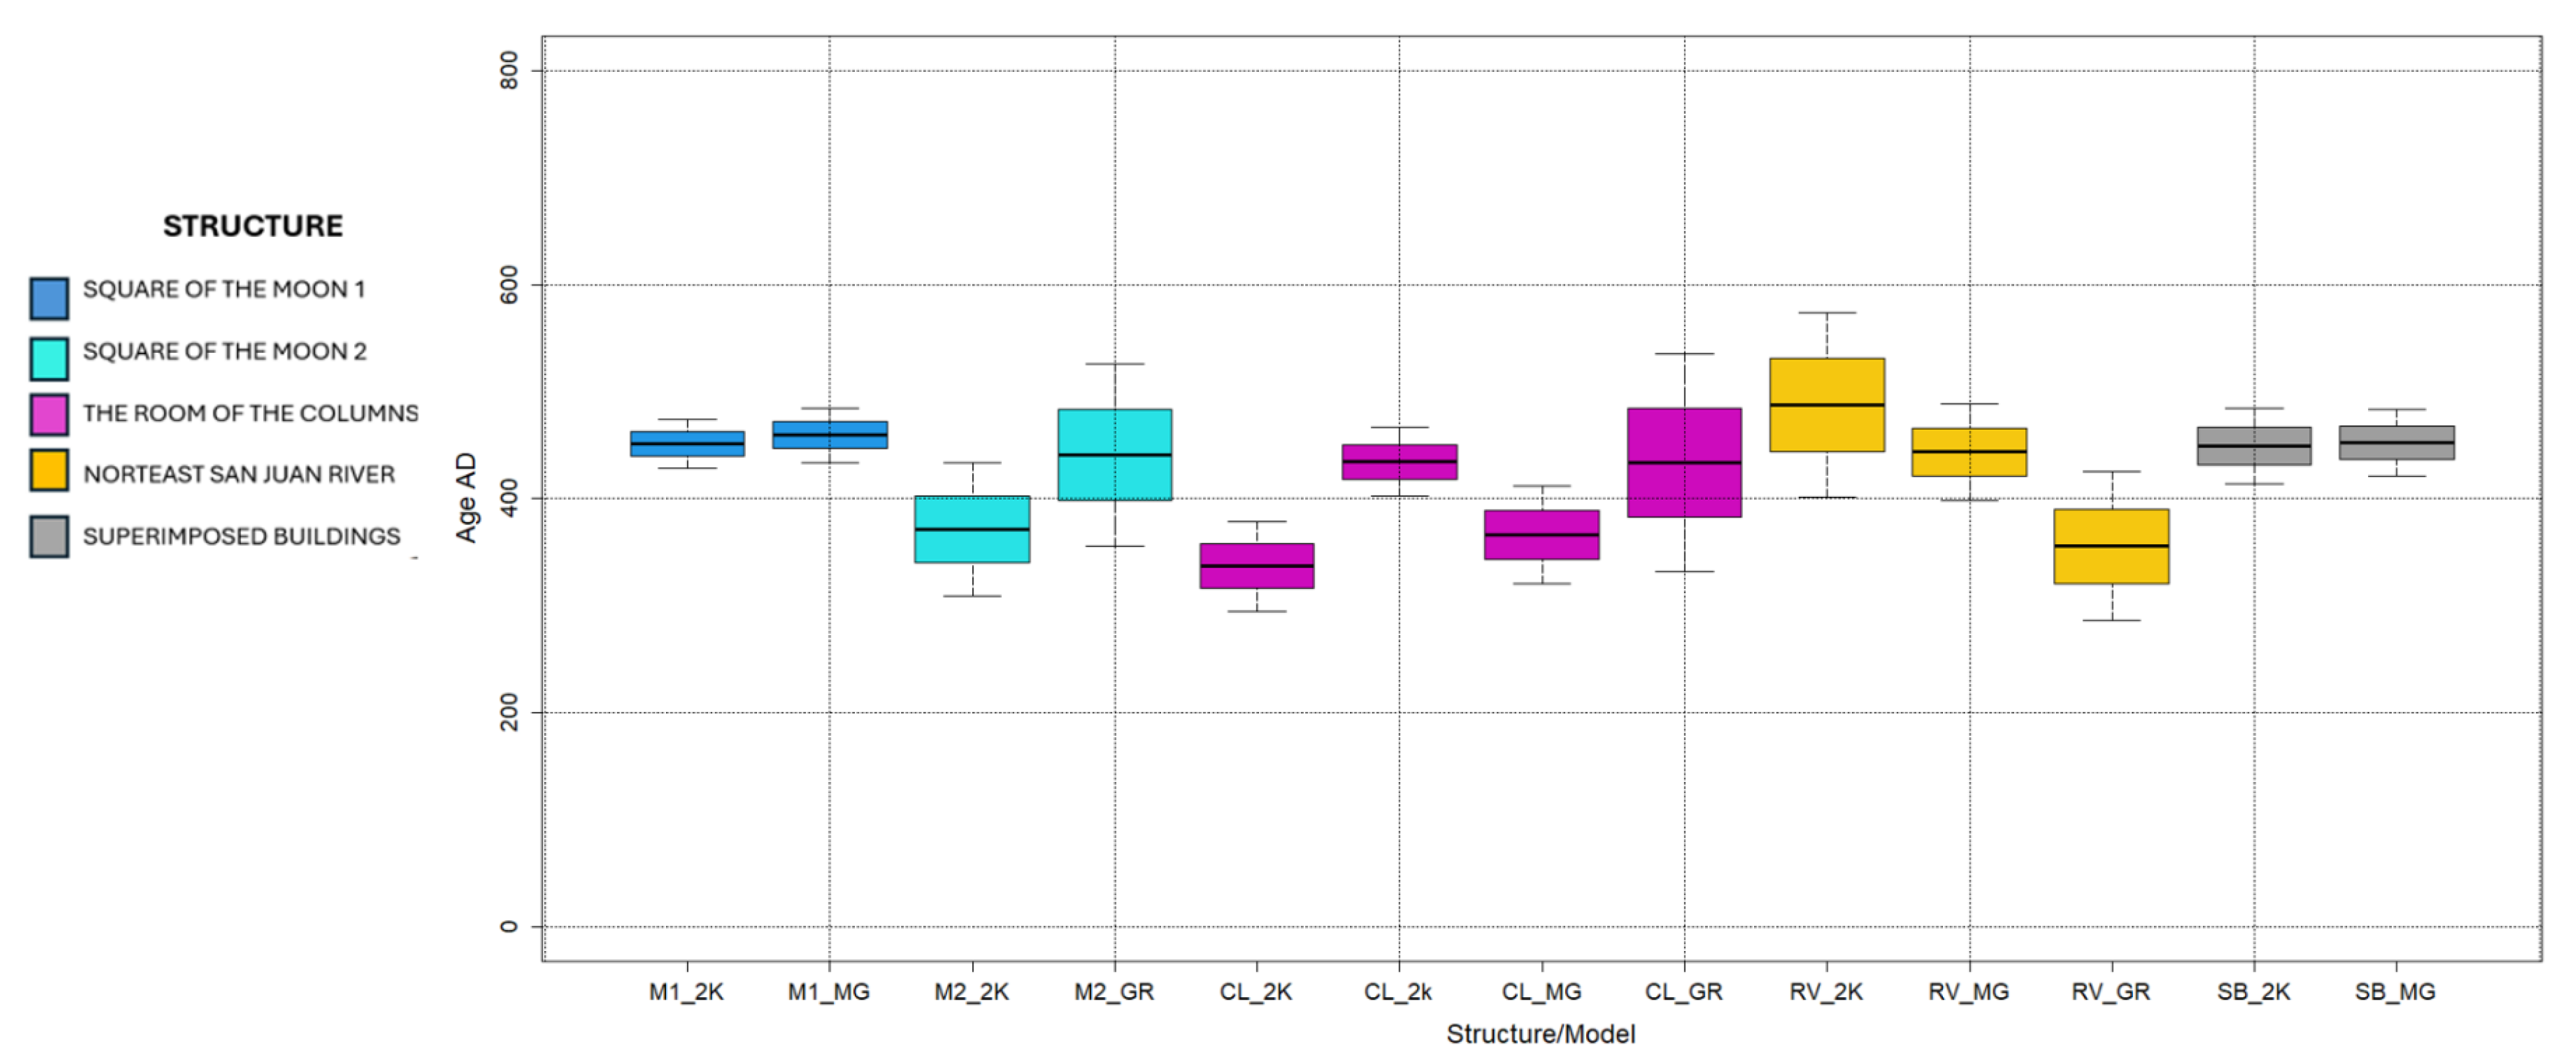
Some variation was observed between global and local models, and dual-age peaks were also common (Table 3, Figure 10). Our approach was to prioritize local paleosecular variation (PSV) curves, which more accurately reflect the regional non-dipole geomagnetic field behavior. When multiple possible intervals emerged from the probability density function (PDF), we selected those that were consistent across both the SHAWQ.2k global model and at least one local curve. This comparative approach allowed us to assign the most probable age intervals based on converging evidence. Overall, the ages derived from SHAWQ.2k align well with the curve presented by Mahgoub et al. [44]. The resulting age intervals for all sites mostly fall within ~400–500 AD, corresponding to the Xolalpan phase, well before the traditionally accepted timing of the “Great Fire” during the Metepec phase (550–650 AD).
Previous archaeomagnetic studies offer both supportive and contrasting results. Daniel Wolfman [47] analyzed burned features—including floors, columns, and pits—from Structure 1D of La Ciudadela, the Viking Group, and Teopancazco, producing age estimates between ~310 and 475 AD. Previously dated burned floors at Xalla yielded ~550 AD. In parallel, Hueda and Soler [48] reported archaeomagnetic ages from the Citadel and the West Plaza Complex, ranging from 553 to 606 AD and 551 to 607 AD, respectively. Rodríguez-Ceja [49] analyzed fired clay fragments from Teopancazco, obtaining dates between 525 and 575 AD. Supporting the “Great Fire” hypothesis, Soler-Arechalde et al. [50,51] dated oriented stucco samples—used for floors, murals, and ceramics—from Xalla and Teopancazco, yielding ages from 500 to 575 AD. On the other hand, Terán-Guerrero et al. [52] provided broader constraints for the Citadel and the Temple of Quetzalcoatl, reporting age intervals between 324–440 AD and 440–600 AD. The latter clearly overlaps with the presumed window of fire destruction. Some methodological differences likely underlie the discrepancy in the age estimation of so-called Big Fire: several previous estimates relied on radiocarbon or relative stratigraphy, whereas our ages derive from full vector archaeomagnetic dating benchmarked to both regional PSV curves and a global field model.

4. Concluding Remarks

  • Continuous thermomagnetic curves of saturation magnetization versus temperature were measured for two specimens from each sampled structure. The primary thermoremanent carriers are nearly pure magnetite or Ti-poor titanomagnetites, as indicated by Curie points between 550 °C and 570 °C. In samples from the Square of the Moon, both magnetite and Ti-rich titanomagnetites appear to coexist.
  • Magnetic domain structures are dominated by pseudo-single-domain grains. Minor contributions from antiferromagnetic hematite may be present, though they appear to have a negligible influence on the remanent magnetization.
  • Alternating field demagnetization proved highly effective in isolating primary, characteristic remanent magnetization (ChRM). Of 74 demagnetized specimens, 60 yielded well-defined directions. Site-mean paleodirections are well-grouped, with α95 values ranging from 1.7° to 3.6°.
  • Of the 64 samples subjected to paleointensity analysis, 34 produced acceptable absolute archaeointensity determinations based on widely accepted quality criteria. Rejected samples exhibited concave-up behavior or evidence of two-slope segments in Arai–Nagata plots. Accepted site/structure mean absolute intensities ranged from 52.5 ± 5.4 µT to 39.4 ± 3.4 µT.
  • Following a review of archaeological and environmental data, the time interval 1–800 AD was selected for archaeomagnetic dating. Both a global geomagnetic model (SHAWQ.2k) and two regional secular variation reference curves were employed.
  • Although some discrepancies between global and local reference models were observed—and dual age solutions were occasionally encountered—most of the archaeomagnetic age intervals fall between ~400 and 500 AD. This timeframe corresponds to the Xolalpan phase, predating the traditionally recognized Metepec phase (550–650 AD) when the “Great Fire” likely occurred.
  • These new results, which challenge the prevailing interpretations and previously published archaeomagnetic studies, highlight the need for a revised and more nuanced chronological framework for Teotihuacan’s collapse as well as the possible existence of urban renewal cycles that included the intentional burning of structures as part of ritual processes.

Author Contributions

Conceptualization, K.A.R., A.G. and V.K.; methodology, K.A.R., R.C. and A.G.P.; software, R.G.R. and A.G.P.; validation, G.T., R.C., V.O. and J.A.; formal analysis, F.B., J.M.; investigation, K.A.R., A.G. and V.K. resources, G.T., V.O. and J.A.; data curation, R.G.R., F.B.; visualization, J.M., F.B. All authors have read and agreed to the published version of the manuscript.

Funding

This work was supported by the DGAPA-PAPIIT grant n° IN100224. This study was partially funded by the Natural Sciences and Engineering Research Council of Canada for V.A.K. (NSERC grant RGPIN-2024-05918).

Data Availability Statement

Data will be available upon reasonable request.

Conflicts of Interest

The authors declare no conflict of interest.

References

  1. González-Jácome, A. Mesoamérica: Un Desarrollo Teórico. Dimens. Antropol. 2000, 19, 121–152. [Google Scholar]
  2. Kirchhoff, P. Mesoamérica: Sus límites geográficos, composición étnica y caracteres culturales. Tlatoani 1960, 20. [Google Scholar]
  3. Cowgill, G.L. An update on Teotihuacan. Antiquity 2008, 82, 962–975. [Google Scholar] [CrossRef]
  4. Cowgill, G.L. Ancient Teotihuacan: Early Urbanism in Central Mexico; Cambridge University Press: Cambridge, UK, 2015. [Google Scholar]
  5. Rattray, E.C. La cerámica de Teotihuacan: Relaciones externas y cronología. An. De Antropol. 2011, 16. [Google Scholar] [CrossRef]
  6. Manzanilla, L. Teotihuacán; Opúsculos; El Colegio Nacional, Ciudad de México: Cuauhtémoc, México, 2017. [Google Scholar]
  7. Ortega Cabrera, V.; Vergara Esteban, E.; del Castillo Gómez, E. La historia tras el nombre de Teotihuacan: Aproximaciones históricas y observaciones solares. Cuicuilco Rev. De Cienc. Antropol. 2021, 28, 271–294. [Google Scholar]
  8. López Luján, L. La Recuperación Mexica del Pasado Teotihuacano; INAH-Asociación de Amigos del Templo Mayor-García Valadés Editores: Cuauhtemoc, México, 1989. [Google Scholar]
  9. Manzanilla, L. El proceso de abandono de Teotihuacán y su re-ocupación por grupos epiclásicos. Trace 2003, 43, 70–76. [Google Scholar]
  10. Manzanilla, L. The abandonment of Teotihuacan. In The Archaeology of Settlement Abandonment in Middle America: Foundations of Archaeological Inquiry; Inomata, T., Webb, R., Eds.; University of Utah Press: Salt Lake City, UT, USA, 2003; pp. 91–101. [Google Scholar]
  11. Goguitchaichvili, A. Refining the absolute chronology of Teotihuacan (Mesoamerica): New archaeomagnetic datings of fire footprints. J. Archaeol. Sci. Rep. 2022, 42, 103363. [Google Scholar] [CrossRef]
  12. Armillas, P. Teotihuacan, Tula y los Toltecas: Las culturas postarcaicas y pre-aztecas del centro de México: Excavaciones y estudios. Run. III 1950, 3, 37–70. [Google Scholar]
  13. Bernal, I. Teotihuacán. Descubrimientos y Reconstrucciones; INAH: Cuauhtemoc, México, 1963. [Google Scholar]
  14. Millon, R. Urbanization at Teotihuacán, Mexico. Volume One: The Teotihuacán Map. Part One: Text; University of Texas Press: Austin, TX, USA, 1973. [Google Scholar]
  15. Millon, R. The last years of Teotihuacan dominance. In The Collapse of Ancient States and Civilizations; Yoffee, N., Cowgill, G.L., Eds.; University of Arizona Press: Tucson, AZ, USA, 1988. [Google Scholar]
  16. Moragas Segura, A. Teotihuacan. Bachelor’s Thesis, Universidad Autónoma del Estado de Hidalgo, Pachuca, México, 2013. [Google Scholar]
  17. Morton, S.G.; Peuramaki-Brown, M.M.; Dawson, P.C.; Seibert, J.D. Civic and household community relationships at Teotihuacan, Mexico: A space syntax approach. Camb. Archaeol. J. 2012, 22, 387–400. [Google Scholar] [CrossRef]
  18. Thellier, E.; Thellier, O. Sur l’intensité du champ magnétique terrestre dans le passé historique et géologique. Ann. De Géophysique 1959, 15, 285–376. [Google Scholar]
  19. Coe, R.S. Paleo-intensities of the Earth’s magnetic field determined from Tertiary and Quaternary rocks. J. Geophys. Res. 1967, 72, 3247–3262. [Google Scholar] [CrossRef]
  20. Coe, R.S.; Grommé, C.S.; Mankinen, E.A. Geomagnetic paleointensities from radiocarbon dated lava flows on Hawaii and the question of the Pacific nondipole low. J. Geophys. Res. 1978, 83, 1740–1756. [Google Scholar] [CrossRef]
  21. Pérez-Rodríguez, N.; Morales, J.; Goguitchaichvili, A. A comprehensive paleomagnetic study from the last Plinian eruptions of Popocatepetl volcano: Absolute chronology of lavas and estimation of emplacement temperatures of PDCs. Earth Planets Space 2019, 71, 80. [Google Scholar] [CrossRef]
  22. Chauvin, A.; Garcia, Y.; Lanos, P.; Laubenheimer, F. Paleointensity of the geomagnetic field recovered on archaeomagnetic sites from France. Phys. Earth Planet. Inter. 2000, 120, 111–136. [Google Scholar] [CrossRef]
  23. Leonhardt, R.; Heunem, C.; Krása, D. Analyzing absolute paleointensity determinations: Acceptance criteria and the software Thellier Tool4.0. Geochem. Geophys. Geosyst. 2004, 5, 12. [Google Scholar] [CrossRef]
  24. Day, R.; Fuller, M.; Schmidt, V. Hysteresis properties of titanomagnetites—Grain-size and compositional dependence. Phys. Earth Planet. Inter. 1977, 13, 260–267. [Google Scholar] [CrossRef]
  25. Paterson, G. The effects of anisotropic and non-linear thermoremanent magnetizations on thellier-type paleointensity data. Geophys. J. Int. 2013, 193, 694–710. [Google Scholar] [CrossRef]
  26. Nagata, T.; Kobayashi, K.; Schwarz, E. Archeomagnetic intensity studies of South and Central America. J. Geomagn. Geoelectr. 1965, 17, 399–405. [Google Scholar] [CrossRef]
  27. Cowgill, G.L. State and society at Teotihuacan, Mexico. Annu. Rev. Anthropol. 1997, 26, 129–161. [Google Scholar]
  28. Cowgill, G.L. The urban organization of Teotihuacan, Mexico. In Settlement and Society: Essays Dedicated to Robert McCormick Adams; Stone, E., Ed.; Cotsen Institute of Archaeology and Oriental Institute: Los Angeles, CA, USA; Chicago, IL, USA, 2007; pp. 261–295. [Google Scholar]
  29. Ortega Cabrera, V. La Presencia Oaxaqueña en Teotihuacán Durante el Clásico. Doctoral Thesis, FFyL UNAM, Coyoacán, México, 2014. [Google Scholar]
  30. Manzanilla, L.; López, C.; Freter, A.C. Dating results from excavation in quarry tunnels behind the Pyramid of the Sun at Teotihuacan. Anc. Mesoam. 1996, 7, 245–266. [Google Scholar] [CrossRef]
  31. Manzanilla, L. El palacio de Xalla. In El Palacio de Xalla en Teotihuacán: Primer Acercamiento; Manzanilla, L., Ed.; Universidad Nacional Autónoma de México: México City, México, 2019; pp. 41–66. [Google Scholar]
  32. Manzanilla, L.; López-Luján, L. Exploraciones en un posible palacio de Teotihuacán: El Proyecto Xalla (2000–2001). Mex. XII 2001, 3, 58–61. [Google Scholar]
  33. Manzanilla, L. Nuevos datos sobre la cronología de Teotihuacán. In Cronología y Periodización de Mesoamérica y el Norte de México; Daneels, A., Ed.; Universidad Nacional Autónoma de México: México City, México, 2009; pp. 21–52. [Google Scholar]
  34. Lorenzo, J.L. Materiales para la arqueología de Teotihuacán; INAH: México City, México, 1968. [Google Scholar]
  35. Lachniet, M.S.; Asmerom, Y.; Polyak, V.J.; Bernal, J.P.; Piperno, D.R. A 2400 yr Mesoamerican rainfall reconstruction links climate and cultural change. Geology 2012, 40, 259–262. [Google Scholar] [CrossRef]
  36. Armillas, P. Exploraciones recientes en Teotihuacán, México. In Pedro Armillas: Vida y obra; Rojas Rabiela, T., Ed.; Centro de Investigaciones y Estudios Superiores en Antropología Social–INAH: México City, México, 1944; Volume I, pp. 77–98. [Google Scholar]
  37. Sugiyama, S. Human Sacrifice, Militarism, and Rulership: The Symbolism of the Feathered Serpent Pyramid at Teotihuacan, Mexico; Cambridge University Press: Cambridge, UK, 2005. [Google Scholar]
  38. Sugiyama, S.; López-Luján, L. Sacrificios de consagración en la Pirámide de la Luna; Instituto Nacional de Antropología e Historia: México City, México, 2006. [Google Scholar]
  39. Acosta, J.R. El Palacio del Quetzalpapalotl; Memorias; INAH: México City, México, 1964; No. 10. [Google Scholar]
  40. Campuzano, S.A.; Osete, M.L.; Pavón-Carrasco, F.J. Emergence and evolution of the South Atlantic Anomaly revealed by the new paleomagnetic reconstruction SHAWQ2k. Earth Planet. Sci. Lett. 2019, 512, 17–26. [Google Scholar] [CrossRef]
  41. Pavón-Carrasco, F.J.; Rodríguez-González, J.; Osete, M.L.; Torta, J.M. A MATLAB tool for archaeomagnetic dating. J. Archaeol. Sci. 2011, 38, 408–419. [Google Scholar] [CrossRef]
  42. Pavón-Carrasco, F.J.; Osete, M.L.; Torta, J.M.; De Santis, A. A geomagnetic field model for the Holocene based on archaeomagnetic and lava flow data. Earth Planet. Sci. Lett. 2014, 388, 98–109. [Google Scholar] [CrossRef]
  43. Serrano, M.; Pavón-Carrasco, F.J.; Campuzano, S.A.; Osete, M.L. ArchaeoPyDating: A new user-friendly release for archaeomagnetic dating. Archaeometry 2024, 66, 1424–1437. [Google Scholar] [CrossRef]
  44. Mahgoub, A.; Juárez-Arriaga, E.; Böhnel, H.; Manzanilla, L.; Cyphers, A. Refined 3600 years palaeointensity curve for Mexico. Phys. Earth Planet. Inter. 2019, 296, 106328. [Google Scholar] [CrossRef]
  45. García-Ruíz, R.; Goguitchaichvili, A.; Pavón-Carrasco, F.J.; Soler-Arechalde, A.; Pérez-Rodríguez, N.; Osete, M.L.; Kravchinsky, V.A. Fluctuations of magnetic inclination and declination in Mexico during the last three millennia. Quat. Geochronol. 2022, 71, 101309. [Google Scholar] [CrossRef]
  46. Liritzis, I. Cracking the code of earth’s magnetic mysteries: Ancient secrets unveiled by byzantine bricks reconfirmed by Mesopotamian ceramics. Proc. Eur. Acad. Sci. Arts 2024. [Google Scholar] [CrossRef]
  47. Wolfman, D. Mesoamerican chronology and archaeomagnetic dating, AD 1–1200. In Archaeomagnetic Dating; Eghmy, J.L., Sternberg, R.S., Eds.; University of Arizona Press: Tucson, AZ, USA, 1990; pp. 199–210. [Google Scholar]
  48. Hueda, Y.; Soler-Arechalde, A.M.; Urrutia-Fucugauchi, J.; Barba, L.; Manzanilla, L.; Rebolledo, M.; Goguitchaichvili, A. Archaeomagnetic studies in central México: Dating of Mesoamerican lime-plasters. Phys. Earth Planet. Inter. 2004, 147, 269–283. [Google Scholar] [CrossRef]
  49. Rodríguez-Ceja, M. Análisis y Fechamientos Arqueomagnético de estucos de zonas habitacionales de Teotihuacán (Xalla) y Templo Mayor. Bachelor Thesis, Facultad de Ciencias, UNAM, México City, México, 2003. [Google Scholar]
  50. Soler-Arechalde, A.M.; Sánchez, F.; Rodríguez, M.; Caballero-Miranda, C.; Goguitchaichvili, A.; Urrutia-Fucugauchi, J.; Manzanilla, L.; Tarling, D.H. Archaeomagnetic investigation of oriented pre-Columbian lime-plasters from Teotihuacan, Mesoamerica. Earth Planets Space 2006, 58, 1433–1439. [Google Scholar] [CrossRef]
  51. Soler-Arechalde, A.M.; Caballero-Miranda, C.; Urrutia-Fucugauchi, J.; Osete-López, M.L.; López-Delgado, V.; Goguitchaichvili, A.; Barrera-Huerta, A. An updated catalog of pre-Hispanic archaeomagnetic data for north and central Mesoamerica: Implications for the regional paleosecular variation reference curve. Boletín De La Soc. Geológica Mex. 2019, 71, 497–518. [Google Scholar] [CrossRef]
  52. Terán-Guerrero, A.G.; Soler-Arechalde, A.M.; Goguitchaichvili, A.; Urrutia-Fucugauchi, J. Dataciones arqueomagnéticas en la Ciudadela de Teotihuacán, Sierra de las Navajas y Xalasco. Arqueol. Iberoam. 2016, 29, 15–20. [Google Scholar]
Figure 1. Location of the analyzed structures along the Street of the Dead in Teotihuacan, spanning from the Pyramid of the Moon to just south of the San Juan River. The map shows the spatial distribution of the six sampled sites targeted for archaeomagnetic analysis, marked as T1 through T6. Sites T1 and T2 correspond to burned structures at the Square of the Moon. Site T3 is located within the Room of the Columns. T4 is situated in the Northeast San Juan River Complex. Sites T5-1 and T5-2, closely spaced within the same architectural area of the Superimposed Buildings, are considered a single site for interpretive purposes. T6 lies within the West Square complex. These sampling locations were selected based on clear evidence of thermal alteration, making them ideal for archaeomagnetic dating aimed at constraining the timing of fire-related events and assessing their relationship to Teotihuacan’s broader cultural decline. Map modified from Morton et al. [17]. Aerial image (left) for reference.
Quaternary 08 00063 g001
Figure 2. Photographs of the sampled burned structures along the Street of the Dead in Teotihuacan. (A,B): Burned wall and floor surfaces at the Square of the Moon. (C): Room of the Columns, showing in situ-burned surfaces. (D): Northeast San Juan River Complex. (E): Superimposed Buildings, characterized by well-preserved plastered surfaces with thermal exposure. (F): West Square Complex, showing evidence of intense fire alteration. These field sites were selected based on visual indicators of thermal damage and accessibility for oriented sampling.
Quaternary 08 00063 g002
Figure 3. (A) Saturation magnetization versus temperature (Ms–T) curves for representative samples from the burned structures, showing Curie points near 550–570 °C, consistent with Ti-poor magnetite. Red color—heating cycle, Blue—cooling. (B) Corresponding hysteresis loops for the same samples, indicating pseudo-single-domain behavior. These results confirm the high thermal stability of the remanence carriers and the suitability of the samples for archaeomagnetic intensity analysis.
Quaternary 08 00063 g003
Figure 4. Representative orthogonal vector plots (Zijderveld diagrams) showing the results of stepwise alternating field (AF) demagnetization up to 70 mT. (a) sample 92T070A, (b) sample 92T172A, (c) sample 92T080A and (d) sample 92T184A. Most specimens exhibited a single, well-defined component of remanent magnetization with minor viscous overprints removed at low AF steps.
Quaternary 08 00063 g004
Figure 5. Equal-area stereographic projections of the characteristic remanent magnetization (ChRM) directions for each of the six analyzed structures. Each site yields tightly clustered directions with α95 values below 3.6°, attesting to the reliability of the directional data for archaeomagnetic dating.
Quaternary 08 00063 g005
Figure 6. Representative Arai–Nagata plots (NRM remaining vs. TRM gained) for selected samples. Examples of technically successful double-heating Thellier-type experiments with linear segments suitable for intensity determination.
Quaternary 08 00063 g006
Figure 7. Archaeomagnetic dating results for the San Juan River Structure, calculated using the regional paleosecular variation curve developed by Mahgoub et al. [44]. The probability density function (PDF) identifies the most likely age interval for the last heating event associated with this structure.
Quaternary 08 00063 g007
Figure 8. Archaeomagnetic age determination for the San Juan River Structure, using the regional paleosecular variation curve proposed by García-Ruíz et al. [45]. We left unaltered the dating numbers as provided by the archaeomagnetic dating software. This reference confirms the most probable dating window derived from the Mahgoub et al. [44] curve.
Quaternary 08 00063 g008
Figure 9. Archaeomagnetic age estimate for the San Juan River Structure, based on the global SHAWQ.2k geomagnetic model [40]. The model incorporates spherical harmonic analysis and penalized B-splines, providing a robust global reference for comparison with local secular variation curves.
Quaternary 08 00063 g009
Figure 10. Summary of the most probable archaeomagnetic age intervals obtained for all sampled structures using three different reference datasets: the global SHAWQ.2k model [40] and two local paleosecular variation curves [44,45]. Each bar represents a dating interval derived from full-vector comparisons, with dual peaks shown where applicable. Overall, the majority of the samples cluster between 400 and 500 AD, consistent with the Xolalpan phase and predating the traditionally proposed timing of Teotihuacan’s collapse.
Quaternary 08 00063 g010
Table 1. Summary of characteristic remanent magnetization (ChRM) directions and associated statistical parameters for each of the six analyzed structures along the Street of the Dead. The parameters include site-mean declination (DEC), inclination (INC), confidence angle (α95), and precision parameter (k). Also shown are the number of accepted samples (n) out of the total analyzed (N). Paleodirectional data were derived from alternating field demagnetization experiments, with well-clustered directions (α95 values ranging from 1.7° to 3.6°), confirming the high directional quality of the data. The table also lists the mean absolute paleointensities (±1σ) obtained from accepted Thellier-type experiments per site.
Archaeomagnetic directions
Structuren/NDec [°]Inc [°]α95 [°]K
Square of the Moon 19/12−18.9452.8335.69
Square of the Moon 210/12−1.833.52580.07
The Room of the Columns11/12−6.937.92.9247.05
Northeast San Juan River8/121.741.73.4270.37
Superimposed Buildings20/24−10.544.91.7363.8
West Square12/12−0.944.63.6150.27
Absolute paleointensities
Structuren/NIntensity (μT)
Square of the Moon 15/1139.4 ±3.4
Square of the Moon 25/1248.1±2.0
The Room of the Columns5/1149.3±3.6
Norteast San Juan River5/1142.9±2.1
Superimposed Buildings5/1747.5±6.2
West Square9/1252.5±7.5
Table 2. Results of absolute archaeointensity determinations using the double-heating Thellier method for all accepted samples. The associated quality parameters were obtained using the ThellierTool4.0 software described in Leonhardt et al. [23]. The table includes for each specimen: Tmin–Tmax: the range of temperature steps used, N: the number of points used in the linear segment of the Arai–Nagata plot, f: the fraction of NRM used in intensity determination, g: the gap factor, q: the quality factor, and B ± σB: the calculated paleointensity value (in µT) and its uncertainty. MAD: Maximum angular deviation of NRM end-point directions at each step acquired during paleointensity experiments; α: Angle between the vector average of the data selected for paleointensity calculation and the principal component of the data; δ(CK): Difference between the pTRM check and original TRM value at a specified temperature normalized to the TRM; δ(pal): Cumulative check error [23]; δ(t*): Normalized pTRM tail [23]; δ(TR): Relative intensity difference in pTRM-tail check. The results are grouped by structure, and the site-mean intensity (±1σ) is listed at the bottom of each group. Only samples meeting all selection criteria—including successful pTRM checks and linear Arai–Nagata plots—were retained (Please see text for more details). These paleointensity values form the basis for subsequent archaeomagnetic dating.
Square of the Moon—1 (Plaza de la Luna)
SampleTmin-Tmax [°C]NfgqMADα (alpha)δ(CK)δ(pal)δ(t*)δ(TR)B ± σB [μT]
92T001A150–40060.650.7610.92.33.55.24.73.11.739.8 ± 1.8
92T003A150–560110.660.8611.71.51.5517.82.8239.6 ± 1.9
92T005A150–540100.470.8713.87.225.41.76.80.71.335.1 ± 0.9
95T061A150–540100.580.8624.61.40.84.12.70.32.944.5 ± 1.1
95T063A250–50070.720.8715.41.71.21.30.31.25.138. 8 ± 1.4
Mean39.4 ± 3.4
Square of the Moon—2 (Plaza de la Luna)
SampleTmin-Tmax [°C]NfgqMADα (alpha)δ(CK)δ(pal)δ(t*)δ(TR)B ± σB [μT]
92T008A200–50080.710.7720.22.41.91.10.55.25.949.7 ± 1.8
92T011A250–51580.720.8411.22.41.71.92.23.84.645.3 ± 2.2
95T068A200–47570.590.786.84.34.40.51.30.30.849.9 ± 3.2
95T069A250–54090.820.8421.42.81.83.55.11.41.846.8 ± 1.2
95T070A150–560120.910.8528.63.11.311.56.30.83.848.6 ± 1.4
Mean48.1 ± 2.0
The Room of the Columns
SampleTmin-Tmax [°C]NfgqMADα (alpha)δ(CK)δ(pal)δ(t*)δ(TR)B ± σB [μT]
92T014A150–50080.750.8615.12.42.65.98.32.61.251.5 ± 1.8
92T015A150–50080.780.8413.82.10.66.89.12.2344.6 ± 2.2
92T016A200–51580.710.8527.412.814.553.112.91.52.654.1 ± 1.3
92T017A150–51590.830.8622.33.74.35.44.91.52.647.7 ± 1.5
95T073A150–47580.820.8122.12.81.83.91.20.60.648.4 ± 1.5
Mean49.3 ± 3.6
Superimposed Buildings
SampleTmin-Tmax [°C]NfgqMADα (alpha)δ(CK)δ(pal)δ(t*)δ(TR)B ± σB [μT]
92S020A150–560120.750.8811.61.21.34.44.42.41.448.5 ± 2.7
92S023A150–515100.680.8617.44.46.13.34.93.1336.8 ± 1.1
92S024A150–560120.870.8545.11.50.91.62.31.32.549.1 ± 0.8
95S076A150–47570.540.767.72.855.94.61.72.150.8 ± 2.8
95S079A300–560 80.810.8320.71.50.56.80.93.34.152.5 ± 1.7
Mean47.5 ± 6.2
Northeast San Juan River Complex
SampleTmin-Tmax [°C]NfgqMADα (alpha)δ(CK)δ(pal)δ(t*)δ(TR)B ± σB [μT]
92T032M200–51590.860.8531.91.71.25.415.11.41.144.6 ± 0.9
92T033M200–51590.730.7924.22.62.54.811.40.91.845.5 ± 1.2
92T034M200–51590.710.7616.42.82.93.60.33.82.742.3 ± 1.3
92T035M200–51590.840.8527.93.546.69.73.42.542.0 ± 1.1
92T036M200–540100.740.7811.93.14.76.41.55.74.340.3± 1.6
Mean42.9 ± 2.1
West Square
SampleTmin-Tmax [°C]NfgqMADA (alpha)δ(CK)δ(pal)δ(t*)δ(TR)B ± σB [μT]
92T037A200–540100.790.8629.21.61.131.20.40.339.5 ± 0.9
92T038A200–560110.680.8821.81.90.52.86.12.11.164.2± 1.8
92T039A300–560100.720.8614.63.20.51.30.73.81.458.8 ± 2.7
92T040A200–540100.720.8614.71.90.19.4200.91.847.1 ± 2.0
92T041A250–560100.770.8639.42.50.92.141.91.558.3 ± 1.5
92T042A150–540100.760.8538.21.80.53.43.74.41.150.2 ± 0.9
95T087A300–56090.680.8612.61.80.810.338.95.753.2 ± 2.4
95T088A300–560100.750.8627.11.50.78.74.22.71.854.7 ± 1.3
95T090A250–50070.620.826.98.613.98.70.44.33.546.1 ± 2.9
Mean52.5 ± 7.5
Table 3. Most probable age intervals (in AD) for each analyzed structure, based on comparison of full vector archaeomagnetic data with global and local geomagnetic reference models. The three models used are: SHAWQ.2k global geomagnetic model [40], Mahgoub et al. [44] regional paleosecular variation (PSV) curve for Mesoamerica, and García-Ruíz et al. [45] regional PSV curve. Results were obtained using the MATLAB-based dating tool [41,42], and assessed based on associated probability density functions. In some cases, dual age intervals reflect multiple probability peaks. * The ages in bold font are most likely dates of the burning events based on archaeological and relative chronological frameworks.
STRUCTURESHAWQ2KMG_2019GR_2022
SQUARE OF THE MOON 1428–474 *437–485269–339
SQUARE OF THE MOON 2309–439
574–713
26–185356–526
THE ROOM OF THE COLUMNS295–379
402–467
321–412332–535
NORTEAST SAN JUAN RIVER401–57479–104
397–487
286–425
SUPERIMPOSED BUILDINGS414–484421–483274–391
WEST SQUARE196–31421–10928 BC–98 BC
Disclaimer/Publisher’s Note: The statements, opinions and data contained in all publications are solely those of the individual author(s) and contributor(s) and not of MDPI and/or the editor(s). MDPI and/or the editor(s) disclaim responsibility for any injury to people or property resulting from any ideas, methods, instructions or products referred to in the content.