Article

The Late Glacial Advance of the James Lobe, South Dakota, Suggests Climate-Driven Laurentide Ice Sheet Behavior

by
Stephanie L. Heath
* and
Thomas V. Lowell
Department of Geosciences, University of Cincinnati, Cincinnati, OH 45221, USA
*
Author to whom correspondence should be addressed.
Quaternary 2025, 8(4), 58; https://doi.org/10.3390/quat8040058
Submission received: 24 June 2025 / Revised: 20 August 2025 / Accepted: 27 August 2025 / Published: 22 October 2025

Abstract

The relationship between climate and independent glacier masses is now understood, but what is not understood is how ice sheets respond during times of rapid climate change. At its maximum extent the southern Laurentide Ice Sheet (LIS) was sourced from two domes that terminated in multiple lobes across central North America. The extent and timing of the eastern lobes, which were sourced from the Labrador Dome are relatively well constrained. Although the extent of the lobes sourced from the western Keewatin Dome is better understood, there is little chronologic data on them. Twenty-six radiocarbon ages recovered from within the drift of the James Lobe from South Dakota are used to reconstruct the timing of late-glacial fluctuations of the James Lobe. Lithologic logs from 21 South Dakota counties were analyzed and provide stratigraphic context for the radiocarbon ages. Analysis of the stratigraphy reveals two distinct glacial till units with a distinct, widespread layer of silt between them. The silt is interpreted here as evidence for interstadial conditions between two separate advances of the James Lobe. Radiocarbon ages of organics from this silt layer and from within the uppermost oxidized till indicate that interstadial conditions persisted from ~15.8 to 13.7 ka, followed by an advance of the James Lobe of at least 230 km to its maximum position at the Missouri River. Comparison to other locations in Wisconsin, northern lower Michigan, and western New York reveals a similar period of interstadial conditions followed by ice margin advance. We correlate this advance across ~1000 km and suggest that the simplest explanation is reduced summer ablation caused by widespread climatic cooling.

1. Introduction

The southern Laurentide Ice Sheet (LIS) margin extended over 3000 km across central North America, culminating in seven distinct land-based lobes that reached as far south as 38° latitude (Figure 1). Yet, it is debated whether different portions of the Laurentide Ice Sheet acted in unison or independently [1,2,3]. The seven lobes were sourced from either the Labrador or Keewatin ice dome [4]. The lobes that comprised the eastern sector, which extended from Illinois to Massachusetts, were likely sourced from the Labrador Dome [5,6] and advanced to their maximum extent before ~20.0 ka [7,8,9,10,11]. Conversely, the Des Moines Lobe in Iowa reached its maximum extent after 16.1 ka [8,11], but unlike the eastern sector, there remains a debate between the Keewatin Dome and the saddle between domes as its source [4,6]. However, west of the Des Moines Lobe was the James Lobe (Figure 1 and Figure 2), which occupied eastern South Dakota and was sourced from the Keewatin Dome [4,6].
The most recent study of the James Lobe used 10Be surface exposure age dating on glacial deposits of the Pierre Sublobe (Figure 2), a westward-flowing sublobe along the western James Lobe margin [12]. The surface exposure ages suggest that the Pierre Sublobe stabilized at an inboard moraine complex after 15.9 ka and thus may correlate with the maximum extent of the Des Moines lobe [8,11,13,14]. Past workers have also correlated the James and Des Moines Lobe advances based on radiocarbon chronology [15], which indicates that both lobes underwent significant advance after ~14.0 ka—during the Bølling-Allerød warm period. Lundstrom et al. suggest that the warm conditions and increased meltwater may have caused the late advances of the western lobes. Iverson et al. took this a step further and suggested that the subsurface hydrology of the James and Des Moines Lobe advances after ~14 ka were a result of surging. This is based on the lack of drumlins associated with the James and Des Moines Lobes and further supported by the notion that the two lobes may have been sourced from the Keewatin Dome or saddle [16]. This is not a new idea—several workers have studied the subglacial hydrology of the western lobes and suggested that these lobes were not only fed by ice streams but surged multiple times during late glacial times [17,18,19,20]. However, other chronologic reconstructions of the entire southern Laurentide margin have suggested a more widespread pattern of late glacial advances across 3000 km [11]. It is unlikely that surging would be responsible for the synchronous ice margin advances over that distance.
What remains unknown is how the behavior of the main trunk of the James Lobe compares to the rest of the southern Laurentide margin from a purely chronological point of view. Thus, we aim to reconstruct the timing of James Lobe advance and retreat and compare it to the rest of the Laurentide margin.
The objective of this study is to reconstruct the timing and extent of Keewatin Dome-sourced James Lobe fluctuations after its last documented advance ~15.9 ka [12] for comparison to lobes of the southern Laurentide margin sourced by the Labrador Dome. Toward this end, we reanalyze radiocarbon ages of organic material recovered from stratigraphic archives from exploratory boreholes from eastern South Dakota.

2. Methods

2.1. Regional Setting

The southern Laurentide margin spanned over 3000 km from South Dakota to Massachusetts and culminated in seven distinct lobes that terminated in central North America, reaching as far south as 38° latitude. During the late Pleistocene, the James Lobe occupied the James River Lowland of eastern South Dakota. During the late Pleistocene, the James Lobe occupied the James River Lowland of eastern South Dakota and was flanked by the Missouri Coteau to the west and the Prairie Coteau to the east [1,3,21]. Its southernmost margin terminated at the Missouri River, based on till and moraine correlations [21] and extensive mapping efforts by local state geologic survey workers [22,23,24,25,26,27,28,29,30,31,32,33,34,35,36,37,38].
The most comprehensive study of James Lobe deposits and history was conducted by R.F. Flint in 1955 [21]. That report describes the subsurface stratigraphy of eastern South Dakota, as well as the surface landforms, based on field observations [21]. Subsequent county-scale geologic reports published by the South Dakota Geological Survey have improved on this work on a local scale. These reports, available in about half of the counties covered by the James Lobe footprint, provide stratigraphic cross-sections and more detailed geomorphic maps, but largely lack chronology.
The presence of the elevated Missouri Coteau along the James Lobe’s western flank allowed for the preservation of glacial deposits associated with several ice margin positions through the Pleistocene [21]. The James Lobe advanced westward onto the Missouri Coteau in several places, one example being its advance to the Missouri River near Pierre, SD, called the Pierre Sublobe [12]. This sublobe deposited a series of distinct, arcuate moraine ridges separated by extensive plains of ground moraine and stagnation deposits. Scattered, rounded igneous boulders on the western side of the Missouri River suggest an earlier expansion beyond the current river route (“Iowan” glaciation) [21]. Based on the well-preserved, extensive moraines east of the Missouri River, which is our area of focus, three separate phases of advance during the last glacial period were proposed [21]. These phases were named “Tazewell”, “Cary”, and “Mankato”, with suggested ages of >20.0 ka, 20.0 ka, and 15.0 ka, respectively [1,21].

2.2. Stratigraphic Analysis

The stratigraphy of the James River Lowland was analyzed to establish geologic and stratigraphic context for the radiocarbon chronology. The basemap was derived from SRTM 1-arc-second-resolution DEM files, which were downloaded from the United States Geological Survey’s EarthExplorer tool (http://earthexplorer.usgs.gov, accessed on 1 July 2019). Hill shade layers were created in QGIS using the DEM files. The raster layer of South Dakota county boundaries was downloaded from the South Dakota GIS Data site (http://opendata2017-09-18t192802468z-sdbit.opendata.arcgis.com, accessed on 1 May 2025). The lithologic logs from radiocarbon sample locations come from exploratory drill holes and well installations and were downloaded from the South Dakota Geologic Survey (SDGS) Lithologic Log database (http://cf.sddenr.net/lithdb/, accessed on 1 May 2025). Lithologic logs were compared to stratigraphic unit descriptions in SDGS bulletins and county reports to correlate units across the James River Lowland. These unit delineations were then used to establish context for each of the radiocarbon ages used in this study. The sediment descriptions and interpretations were analyzed and correlated based on stratigraphic sections and descriptions published in SDGS county reports [21,22,23,24,25,26,27,28,29,30,31,32,33,34,35,36,37,38].

2.3. Acquisition and Reduction of Radiocarbon Ages

Radiocarbon ages were acquired from county reports and bulletins published by the SDGS, and through personal communication with L. Schulz of the SDGS. All the material used for radiocarbon dating was recovered from the subsurface during exploratory drilling. Given this recovery, we established selection criteria to vet these radiocarbon age data. These were as follows:
The original source or citation was available for every sample number, and the radiocarbon age could be verified.
Each sample had location data (i.e., latitude, longitude, depth).
Each sample was from organic material that was in place and showed minimal signs of transport (i.e., glaciotectonic disturbance).
Finally, each sample required clear and definite descriptions of its stratigraphic placement. We considered the stratigraphic unit from which each sample was collected to determine whether it was a maximum or minimum constraining age. The radiocarbon ages presented below offer maximum age constraints for glacial advance because they were collected from within or below the glacial till unit. For example, if the sample was collected from a till unit, then it would be interpreted as a maximum age for the enclosing till and for all overlying stratigraphic units. If a sample was collected from interstadial sediments between till units, then the radiocarbon age would be a maximum for the overlying till, and a minimum age for the underlying till. If the sample was collected from a surface outwash unit, then the radiocarbon age would be a minimum constraining age for the presence of the James Lobe at that location. If the sample were from a subsurface outwash, the age would be both a minimum for the underlying unit and a maximum for the overlying unit. Both maximum and minimum are considered limiting brackets.
In total, thirty-five radiocarbon ages were retained, and six were excluded based on the above criteria (Table 1). All radiocarbon ages were recalibrated with the IntCal20 calibration curve [39,40]. Radiocarbon ages are presented in the text and figures as the mean calibrated age (abbreviated as ka, thousands of years before 1950).

2.4. Analysis of Radiocarbon Ages

For analysis, we recovered the summed probability density function (PDF) of individual radiocarbon ages reflecting the same stratigraphic context [58,59,60,61]. The age of a population of ages stratigraphically above or below a glacial till is either a minimum or maximum age, respectively, for that till. Since a given PDF is only a bracket, we do not consider the peak probability of individual summed ages as the age, as previous workers did [58]. Instead, we take the limiting age, as defined by where the PDF of all combined ages is some specified percentage of the area. This provides a reproducible approach to combining samples of different numbers of ages and interprets that PDF as a stratigraphic bracket with defined uncertainties. For convenience, the summed probabilities are represented as bar graphs that represent the 99, 95, and 68% areas. In this report, both the maximum and minimum 95% areas as well as the peak ages are reported.

3. Results

3.1. Stratigraphy of the James Basin

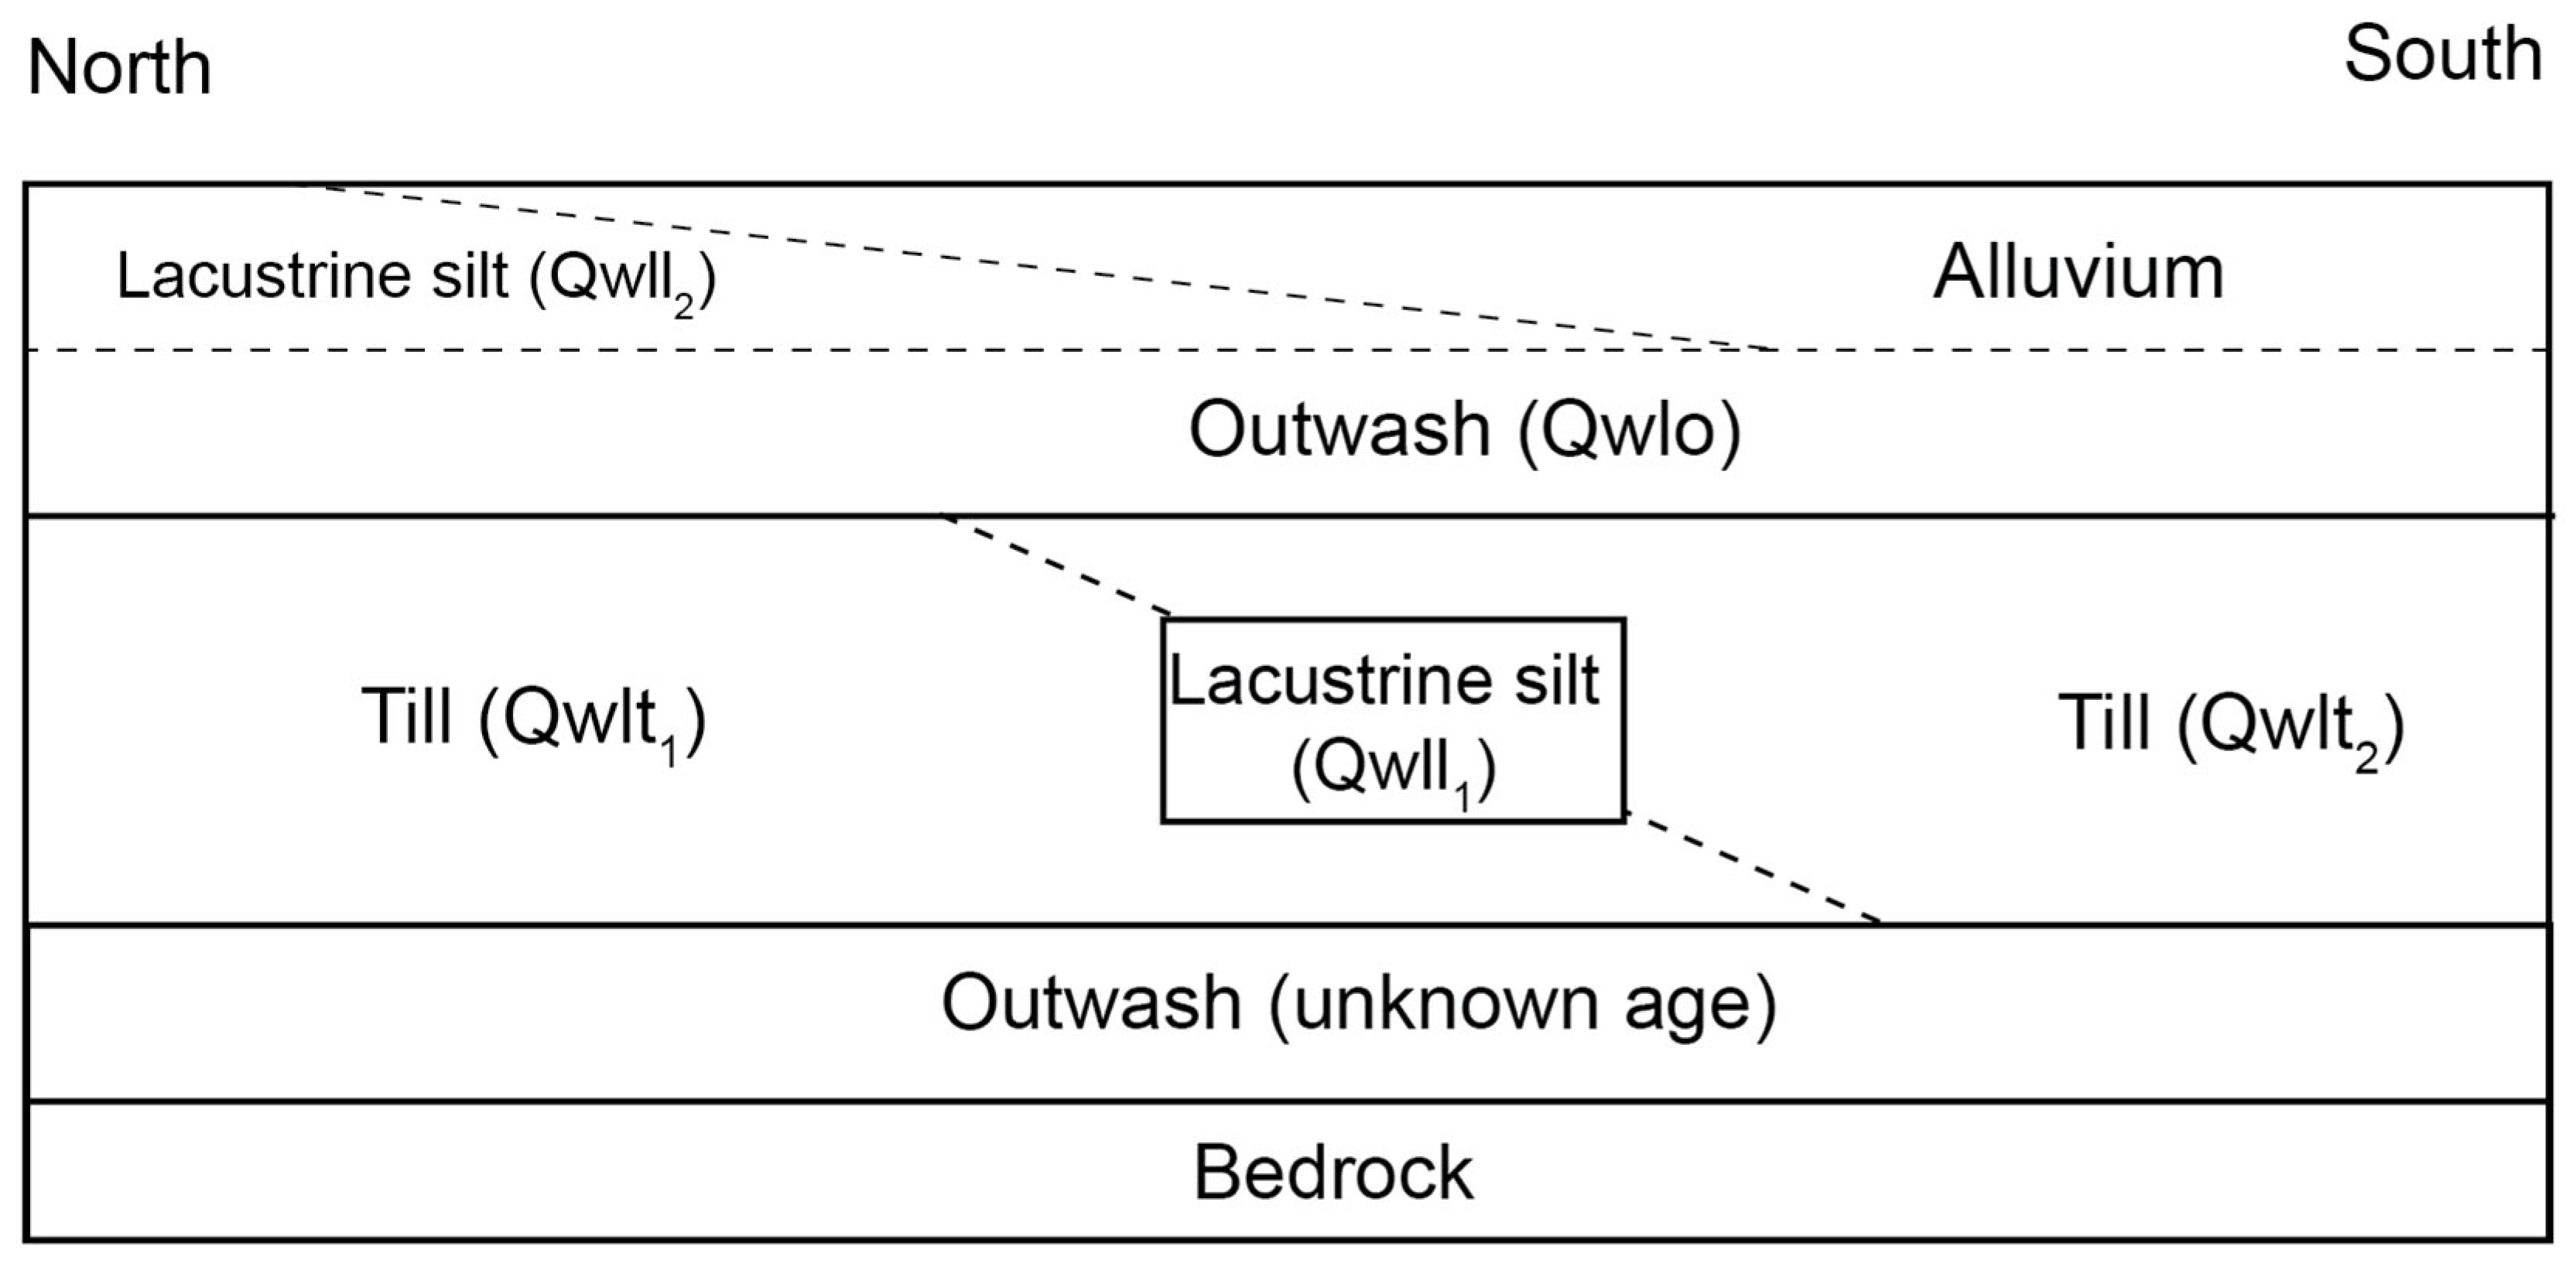
The Quaternary stratigraphy of the James Basin is characterized by late Wisconsin-age glacial drift directly overlying Upper Cretaceous-age Niobrara Formation, Pierre Shale, Carlisle Shale, or Lower Proterozoic-age Sioux Quartzite [62]. In the northern and central James Basin, the bedrock is overlain by outwash of indeterminant age, followed by late-Wisconsin till, here named Qwlt1, which is characterized by gray, unoxidized massive units of clayey sand and gravel with interbedded sections of sand and gravel, lenses of fine to medium sand, and lenses of laminated silt. Reworked pieces of Pierre Shale are common, and in some places make up most of the till lithology [33]. This till is traceable in the James Basin as far south as central Jerauld County [37] but is not detected in nearby Davison or Sanborn Counties (Figure 3) [26,35].
In the central James Basin is a thick package of lacustrine sediment overlying Qwlt1, indicative of interstadial conditions following the deposition of Qwlt1 (Figure 4). This lacustrine sediment (Qwll1) is observed in boreholes in Hyde, Hand, Spink, Aurora, Jerauld, and Beadle counties (Figure 3 and Figure 4) [26,27,33,36,37] between approximately 45.25° and 43.85° latitude, about 270 km.
Overlying Qwll1 is the youngest till in the James Basin, Qwlt2, which is exposed at the surface across central and southern James Basin. Qwlt2 is usually logged as two till units, although they represent the same glacial advance. The upper 25 feet of Qwlt2 is oxidized and described as yellow, clayey sand and fine gravel with common gravel stringers, and in some places the till is stratified [35,37]. The underlying unoxidized Qwlt2 is described as gray, silty, sandy, pebbly clay and ranges in thickness from 75 feet in Davison and Hanson Counties [35] to 160 ft thick in Yankton County [25]. Qwlt1 is the most expansive till unit in the James Basin, extending from southern Beadle County to the modern-day Missouri River valley at the Nebraska border (Figure 3 and Figure 4). Qwlt1 is the only identifiable till south of Jerauld County [37], and generally overlies massive outwash which, in turn, directly overlies bedrock. Surficial deposits across the James Basin range include outwash, alluvium, and loess. In the northern James Basin, lacustrine deposits associated with Glacial Lake Dakota are present at the surface.

3.2. Radiocarbon Chronology

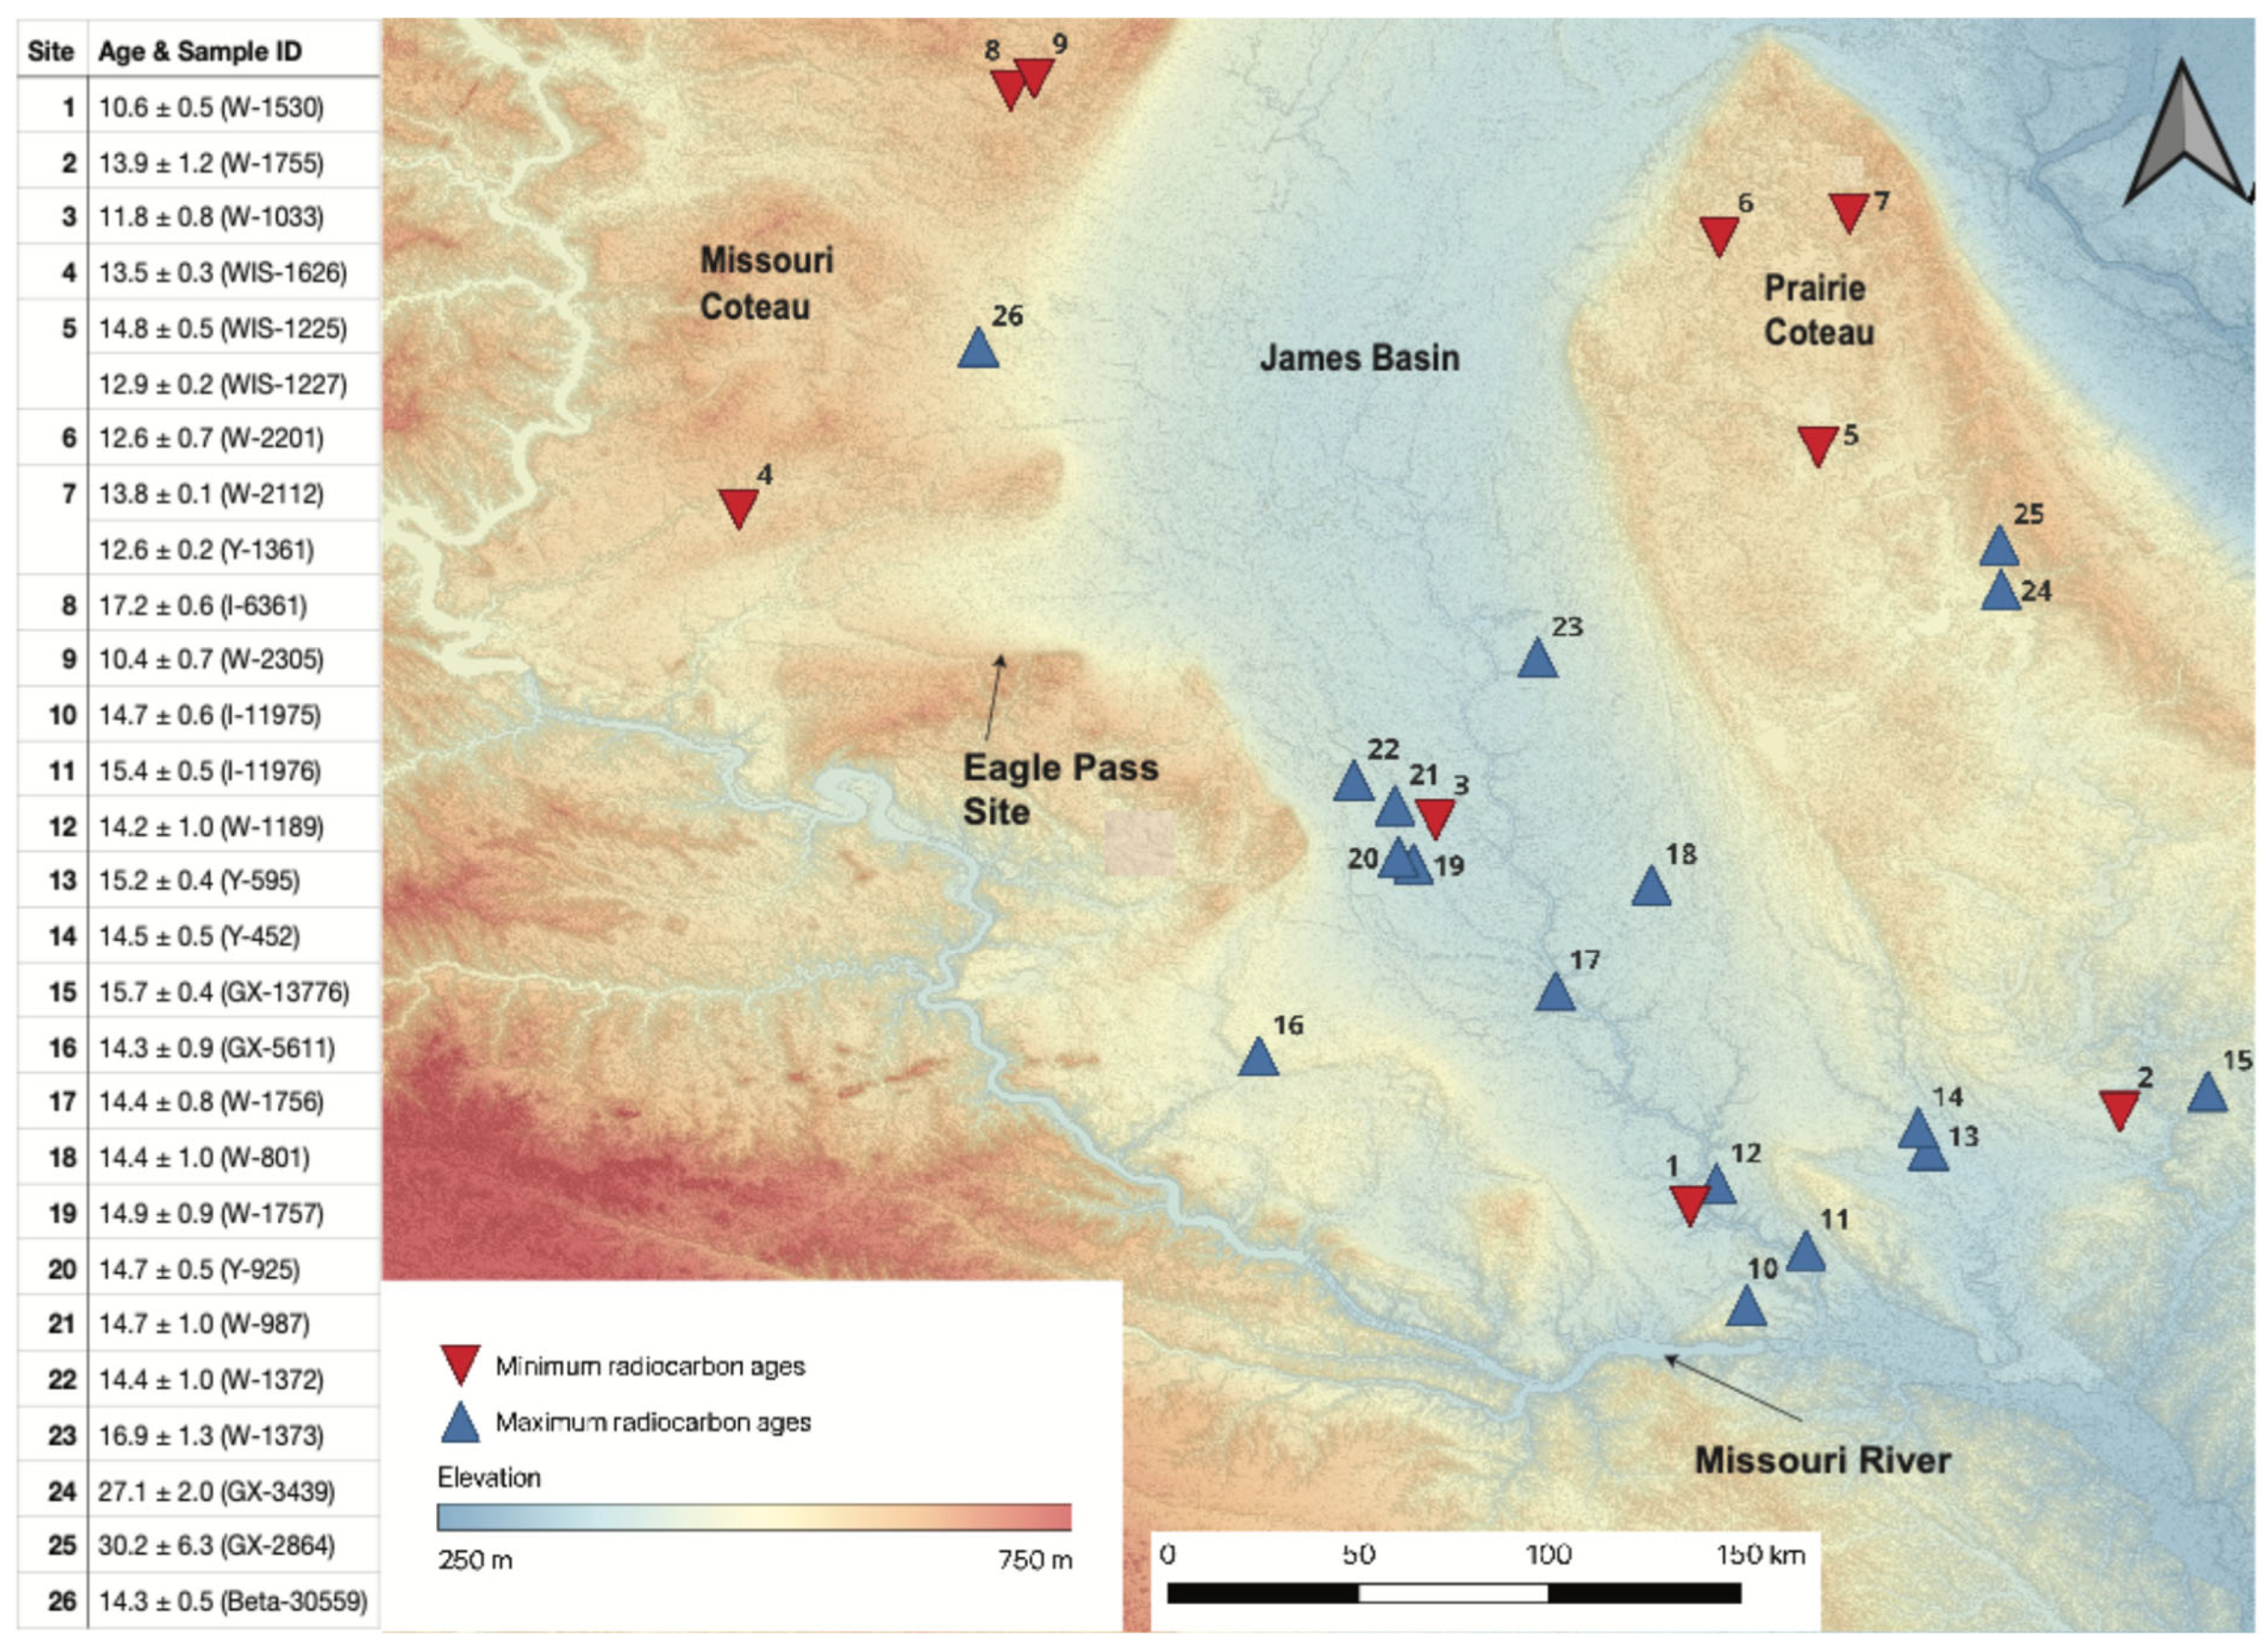
Radiocarbon ages were sorted into three sets based on stratigraphic context (Table 1). Two radiocarbon ages of 30.2 ± 6.3 and 27.2 ± 2.1 (GX-2864, and GX-3439, respectively; Sites 24 and 25; Figure 2) come from organics collected from the lowermost till unit Qwlt1. These form maximum brackets on that till.
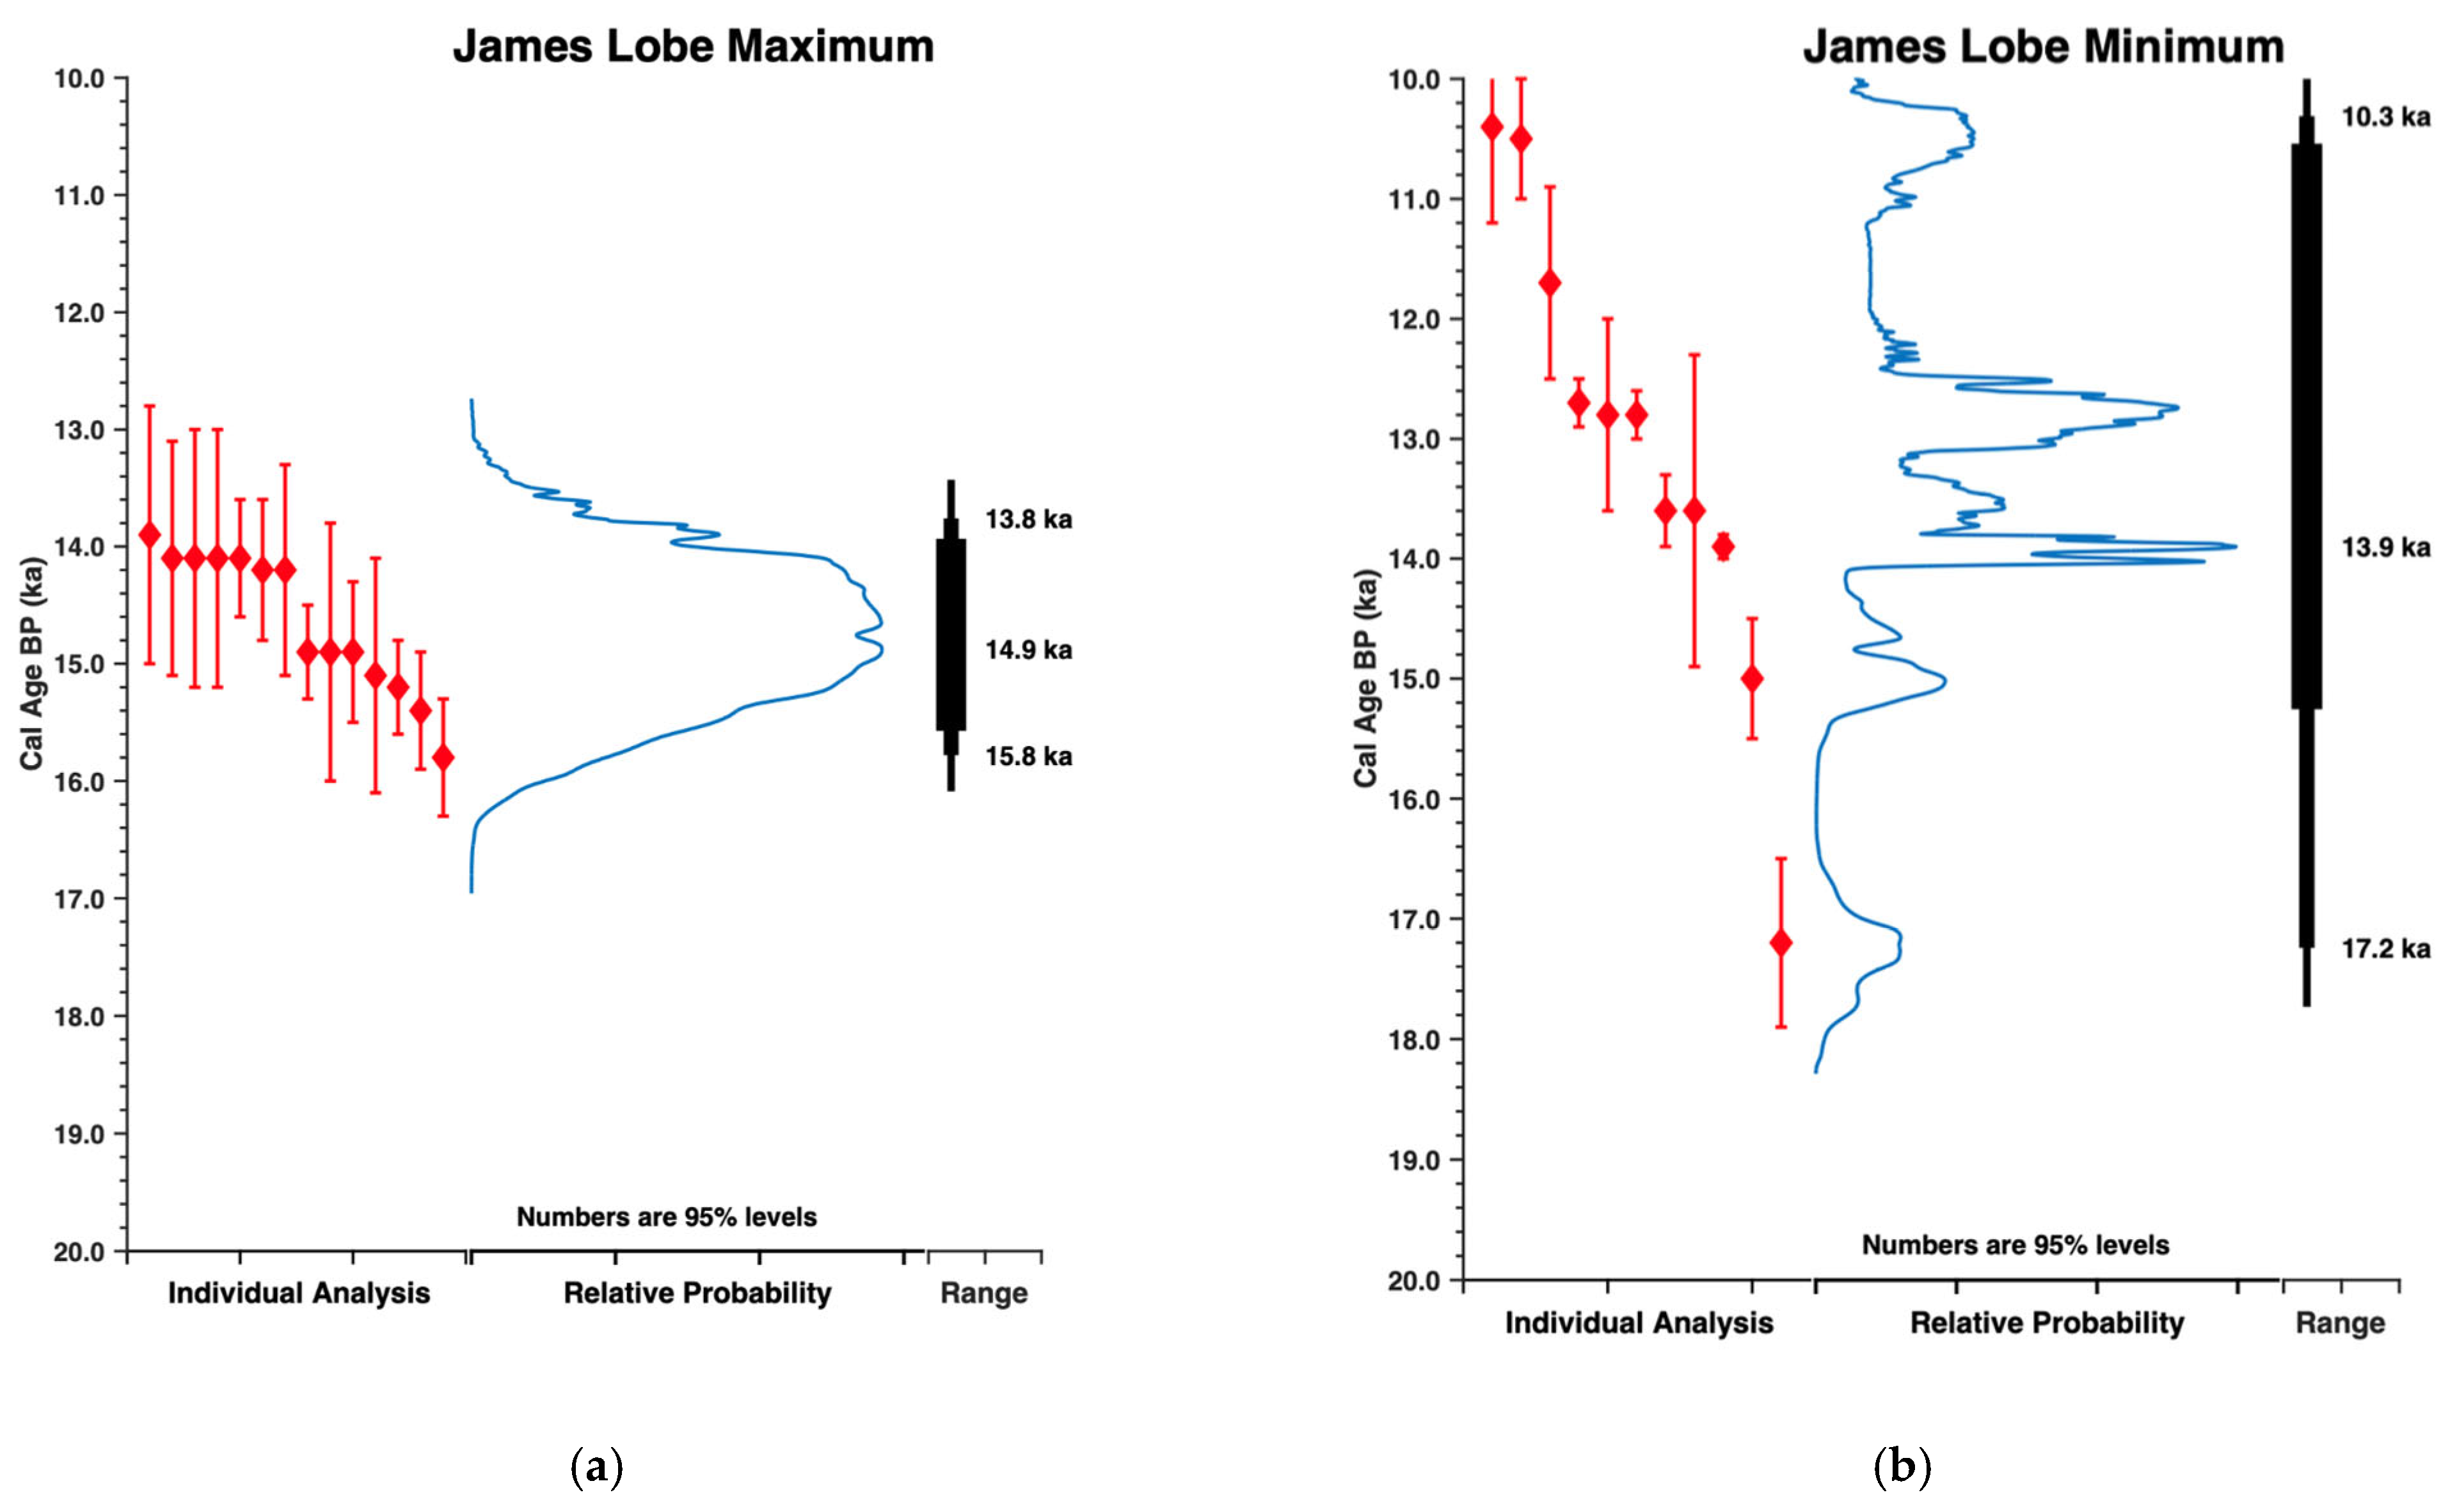
Fifteen radiocarbon ages come from wood or shells collected from the base of or within the till unit Qwlt2 (Figure 2). These ages range from 15.7 ± 0.4 to 14.2 ± 1.0 ka (Beta-30559, GX-13776, W-1757, GX-5611, I-11975, I-11976, W-1189, W-1372, W-1373, W-1756, W-801, W-987, Y-452, Y-925, and Y-595; Sites 10–22, 26). One sample yields an age of 16.9 ± 1.3 ka (W-1373; Site 23) and was excluded as a statistical outlier, although this age still offers a minimum age constraint for the underlying unit Qwlt1. The probability density function (PDF) from maximum radiocarbon ages is plotted in Figure 5a.
Finally, the radiocarbon ages of organics collected from surficial sediments provide minimum age constraint for the timing of deglaciation of the James Lobe. Three radiocarbon ages come from organics encased in surficial sediments in the James Basin and range from 13.9 ± 1.2 to 10.6 + 0.5 ka (W-1033, W-1530, W-1755; Sites 1–3). Seven additional radiocarbon ages come from organics encased in surficial sediments on the Missouri and Prairie Coteaus and range from 14.8 ± 0.5 to 10.4 ± 0.7 ka (W-2305, WIS-1626, W-2112, W-2201, WIS-1225, WIS-1227, and Y-1361; Sites 4–7, 9). Finally, one age of 17.2 ± 0.6 ka (I-6361; Site 8) comes from shells collected from superglacial deposits in McPherson County along the eastern edge of the James Basin. This age is interpreted as a maximum age for the stagnation of ice on the Missouri Coteau [30]. The probability density function calculated from minimum radiocarbon ages are plotted in Figure 5b.

4. Discussion

In the above sections we identified two glacial till units in the James Basin: the lowermost Qwlt1, which is present in the north and central James Basin, and Qwlt2, which is present in the central and southern James Basin. Only in the central James Basin are both tills present, and they are easily distinguishable by an intermediary unit of lacustrine silt [27,33,34,37].
The youngest maximum age from Qwlt1 suggests that the till was deposited after ~27.0 ka. The distribution of Qwlt1 suggests that the James Lobe reached at least as far south as 45.25° latitude in the James Lobe Basin, and flowed west onto the Missouri Coteau [30,33,37] and the Prairie Coteau to its east [29,31,33,38,62]. The conservative southern limit of this advance is based on the southernmost latitude at which both late-Wisconsin tills are present in the James Basin. Further south, only the younger Qwlt2 is detected. It is possible that Qwlt1 extends further south and is indistinguishable from Qwlt2. Regardless of its extent, the timing of the initial James Lobe advance after ~27 ka may correspond to a similar advance of the Des Moines Lobe in Iowa [63].
Following its initial advance after ~27 ka, we estimate that the James Lobe retreated at least ~150 km—the approximate distance between the southernmost extent of Qwlt1 and the northernmost extent of lacustrine sediment (Figure 2) [36]. This retreat occurred before ~15.9 ka, after which it stabilized, based on surface exposure ages from the Pierre Sublobe, a small westward-flowing sublobe along the James Lobe’s western margin (Figure 2) [12]. Similarly, the terminus of the Des Moines Lobe also stabilized at its maximum extent ~16 ka [8,11].
Retreat of the James Lobe continued as interstadial conditions persisted in the James Basin between 15.8 and 13.7 ka based on radiocarbon ages from organics collected from within the silt of Qwll and the base of Qwlt2. Whether the silt is of lacustrine or eolian origin remains unknown [37]. Regardless of its source, combined with the weathered surface of Qwlt1, the presence of the silt with organic remains indicates subaerial conditions between the two episodes of till deposition.
The final and most extensive advance of the James Lobe occurred after ~14.2 ka, based on the youngest radiocarbon age from organics collected from the base of Qwlt2. During this episode, the lobe advanced at least ~300 km to its southernmost maximum extent—this distance is measured from the northernmost extent of till unit Qwlt2 to its terminus at the Missouri River (Figure 2). During this advance, the ice margin overrode the interstadial silt, depositing Qwlt2, and based on the absence of terminal moraines, the lobe may have terminated in the Missouri River.
The final event of James Lobe margin change was a substantial retreat from its southernmost maximum position at the Missouri River, though the available radiocarbon ages from surficial outwash deposits exhibit a large range and do not sufficiently constrain the timing of deglaciation.

Comparing the Timing of Glacial Advance Across the Southern Laurentide Margin

In this section, we will compare the timing of interstadial conditions in the James Lobe between ~15.8 and 13.7 ka and its subsequent advance with other southern Laurentide lobes with radiocarbon chronologies of similar stratigraphic context. We compare the computed 95% confidence limit radiocarbon ages from each site (Figure 6).
Radiocarbon ages of wood from the Two Creeks forest bed in Wisconsin (Figure 1), which underlies the uppermost Valders till, range from 14.5 to 13.3 ka. Like the James Lobe chronology, these ages are suggestive of interstadial conditions there during that time, followed by advance, during which the Two Creeks forest bed was overrun by the Green Bay Lobe [64,65,66,67]. Further east, a thin bryophyte bed underlying glacial till in Cheboygan in northern lower Michigan yields radiocarbon ages ranging from 14.1 to 13.5 ka [68]. New radiocarbon ages from the Laurentide ice margin in western New York suggest that the ice margin south of Lake Ontario also experienced interstadial conditions between ~14.7 and ~13.4 ka, followed by a short-lived advance [69].
Taken together, all four sites described above—the James Lobe, Two Creeks forest bed, Cheboygan Bryophyte Bed and western New York, some 1700 km apart—yield similar radiocarbon ages of organics collected from the same stratigraphic context, which is below or within the uppermost till. Thus, we take these radiocarbon ages as representing the maximum ages of the overlying till that represent a time of subaerial, interstadial conditions at each site between glacial advances. Collectively, by our interpretation scheme these are 13.7, 13.3, 13.1, 13.4 ka respectively. In Figure 6, we provide a visual comparison of the relative probability distributions for each site that further clarifies the consistency between the four sites. It is apparent that there is a signal of widespread interstadial conditions along the southern Laurentide margin between ~15.5 and 13.1 ka, followed by significant advance of the ice margin in each respective region. If these correlations are valid, we would collectively assign an age of ~13.3 ka for this advance based on larger and lower errors of the Two Creeks data set.
The coeval advance of the ice sheet some 1700 km apart, which is likely sourced from both the Keewatin and Labrador domes, precludes some mechanical explanations such as surging. Rather a climate-driven change in the mass balance is more likely. The presence of organic material below the till in the James Lobe, some 230 km along the flow line, indicates the minimum distance of readvance. Likewise, Two Creek age organics in Wisconsin are distributed over about 50 km, and in Western New York they are distributed in the order of 40 km. To cover these distances implies a mass balance change and associated ice margin readvance that occurred earlier than the age of the burial.
A recent report noted that the Esmark moraine and other glacial landforms of Lysefjorden in southwestern Norway yield ages within dating uncertainties that were constructed at the same time as multiple-moraine systems in the southern hemisphere [70]. These authors point out that these ages align with a cooling recorded in Antarctic ice cores that is termed the Antarctic Cold Reversal, which has an assigned age of 12,778 ± 80 years before present [71]. This opens the possibility that this well-established climate event impacted both multiple-valley glacier systems as well as the Laurentide Ice Sheet.

5. Conclusions

The James Lobe experienced interstadial conditions between 15.8 and 13.7 ka, followed by an advance to its maximum extent. Interstadial conditions also persisted in Wisconsin (14.4 to 13.2 ka), Michigan (14.1 to 13.1 ka), and New York (13.3 to 13.0 ka), followed by ice margin advance at each site. Taken together, these may reflect a widespread climate impact on the Laurentide Ice Sheet.

Author Contributions

Conceptualization, S.L.H. and T.V.L.; methodology, S.L.H. and T.V.L.; software, T.V.L.; validation, S.L.H. and T.V.L.; formal analysis, S.L.H. and T.V.L.; investigation, S.L.H.; resources, S.L.H. and T.V.L.; data curation, S.L.H.; writing—original draft preparation, S.L.H.; writing—review and editing, S.L.H. and T.V.L.; visualization, S.L.H.; supervision, T.V.L.; project administration, S.L.H. All authors have read and agreed to the published version of the manuscript.

Funding

This research received no external funding.

Data Availability Statement

All data in this paper are available from the corresponding author upon request.

Conflicts of Interest

The authors declare no conflicts of interest.

References

  1. Clayton, L.; Moran, S.R. Chronology of Late Wisconsinan Glaciation in Middle North America. Quat. Sci. Rev. 1982, 1, 55–82. [Google Scholar] [CrossRef]
  2. Hallberg, G.R.; Kemmis, T.J. Stratigraphy and Correlation of the Glacial Deposits of the Des Moines and James Lobes and Adjacent Areas in North Dakota, South Dakota, Minnesota, and Iowa. Quat. Sci. Rev. 1986, 5, 65–68. [Google Scholar] [CrossRef]
  3. Mickelson, D.M.; Colgan, P.M. The southern Laurentide Ice Sheet. Dev. Quat. Sci. 2003, 1, 1–16. [Google Scholar]
  4. Margold, M.; Stokes, C.R.; Clark, C.D. Reconciling records of ice streaming and ice margin retreat to produce a paleogeographic reconstruction of the deglaciation of the Laurentide Ice Sheet. Quat. Sci. Rev. 2018, 189, 1–30. [Google Scholar] [CrossRef]
  5. Denton, G.H.; Hughes, T. The Last Great Ice Sheets; John Wiley and Sons: New York, NY, USA, 1981. [Google Scholar]
  6. Dyke, A.S.; Prest, V.K. Paleogeography of Northern North America, 18000–5000 Years Ago; Map No. 1703A, scale 1:12,500,00; Geological Survey of Canada: Ottawa, ON, Canada, 1987. [Google Scholar]
  7. Hansel, A.K.; Johnson, W.H. Wedron and Mason Groups: Lithostratigraphic Reclassification of Deposit of the Wisconsin Episode, Lake Michigan Lobe Area; Bulletin No. 104; Illinois State Geological Survey: Champaign, IL, USA, 1986. [Google Scholar]
  8. Lowell, T.V.; Hayward, R.K.; Denton, G.H. Role of Climate Oscillations in Determining Ice-Margin Position: Hypothesis, Examples, and Implications. Geol. Surv. Am. Spec. Pap. 1999, 337, 193–203. [Google Scholar]
  9. Balco, G.; Schaefer, J. Cosmogenic-nuclide and Varve Chronologies for the Deglaciation of Southern New England. Quat. Geochronol. 2006, 1, 15–28. [Google Scholar] [CrossRef]
  10. Curry, B.B. Surficial Geology of Hampshire Quadrangle; Illinois Geologic Quadrangle Map IGQ Hampshire-SG; Illinois State Geological Survey: Champaign, IL, USA, 2008. [Google Scholar]
  11. Heath, S.L.; Loope, H.M.; Curry, B.B.; Lowell, T.V. Pattern of Southern Laurentide Ice Sheet Margin Position Changes During Heinrich Stadials 2 and 1. Quat. Sci. Rev. 2018, 201, 362–379. [Google Scholar] [CrossRef]
  12. Heath, S.L.; Lowell, T.V.; Hall, B.L. Surface Exposure Dating of the Pierre Sublobe of the James Lobe, Laurentide Ice Sheet. Quat. Res. 2020, 97, 88–98. [Google Scholar] [CrossRef]
  13. Benn, D.W.; Bettis III, E.A. Archaeological & Geomorphological Survey of the Downstream Corridor, Saylorville Lake, Iowa; Report of Investigations No. 109; Luther College Archaeological Research Center: Decorah, IA, USA, 1981. [Google Scholar]
  14. Bettis, E.A.; Hoyer, B.E. Late Wisconsin and Holocene Landscape Evolution and Alluvial Stratigraphy in the Saylorville Lake Area, Central Des Moines River Valley, Iowa; Open File Report No. 86-1; Iowa Geological Survey: Iowa City, IA, USA, 1986. [Google Scholar]
  15. Lundstrom, S.; Paces, J.; Iles, D.; Cowman, T. Nature and Timing of the Latest Wisconsin Advance of the James River Lobe, South Dakota. Available online: https://www.researchgate.net/publication/252728989_Nature_and_timing_of_the_latest_Wisconsin_advance_of_the_James_River_lobe_South_Dakota (accessed on 20 June 2025).
  16. Iverson, N.R.; Krueger, S.E.; Harding, C. Absent Drumlins Beneath Southern Lobes of the Laurentide Ice Sheet: A New Hypothesis Based on Des Moines Lobe Dynamics Inferred from Landforms. Earth Surf. Process. Landf. 2023, 48, 3181–3198. [Google Scholar] [CrossRef]
  17. Clayton, L.; Teller, J.T.; Attig, J.W. Surging of the Southwestern Part of the Laurentide Ice Sheet. Boreas 1985, 14, 235–241. [Google Scholar] [CrossRef]
  18. Patterson, C.J. Southern Laurentide Ice Lobes were Created by Ice Streams: Des Moines Lobe in Minnesota, USA. Sediment. Geol. 1997, 111, 249–261. [Google Scholar] [CrossRef]
  19. Patterson, C.J. Laurentide Glacial Landscapes: The role of Ice Streams. Geology 1998, 7, 643–646. [Google Scholar] [CrossRef]
  20. Jennings, C.E. Terrestrial ice streams—A view from the lobe. Geomorphology 2006, 75, 100–124. [Google Scholar] [CrossRef]
  21. Flint, R.F. Pleistocene Geology of Eastern South Dakota; Professional Paper No. 262; U.S. Geological Survey: Denver, CO, USA, 1955.
  22. Christensen, C.M.; Stephens, J.C. Geology and Hydrology of Clay County South Dakota; Bulletin No. 19; South Dakota Geological Survey: Vermillion, SD, USA, 1967.
  23. Christensen, C.M. Geology and Water Resources of Bon Homme County, South Dakota, Part I: Geology; Bulletin No. 21; South Dakota Geological Survey: Vermillion, SD, USA, 1974.
  24. McCormick, K.A.; Hammond, R.H. Geology of Lincoln and Union Counties, South Dakota; Bulletin No. 39; South Dakota Geological Survey: Vermillion, SD, USA, 2004.
  25. Johnson, G.D.; McCormick, K.A. Geology of Yankton County, South Dakota; Bulletin No. 34; South Dakota Geological Survey Bulletin: Vermillion, SD, USA, 2005.
  26. Steece, F.V.; Howells, L.W. Geology and Ground Water Supplies in Sanborn County South Dakota; Bulletin No. 17; South Dakota Geological Survey: Vermillion, SD, USA, 1965.
  27. Hedges, L.S. Geology and Water Resources of Beadle County South Dakota Part I: Geology; Bulletin No. 18; South Dakota Geological Survey: Vermillion, SD, USA, 1968.
  28. Jorgenson, D.G. Geology and Water Resources of Bon Homme County South Dakota, Part II: Water Resources; Bulletin No. 21; South Dakota Geological Survey: Vermillion, SD, USA, 1971.
  29. Koch, N.C. Geology and Water Resources of Marshall County, South Dakota; Bulletin No. 23; South Dakota Geological Survey: Vermillion, SD, USA, 1975.
  30. Christensen, C.M. Geology and Water Resources of McPherson, Edmunds and Faulk Counties, South Dakota, Part I: Geology; Bulletin No. 26; South Dakota Geological Survey: Vermillion, SD, USA, 1977.
  31. Leap, D.I. Geology and Water Resources of Brown County, South Dakota, Part I: Geology; Bulletin No. 25; South Dakota Geological Survey: Vermillion, SD, USA, 1986.
  32. Christensen, C.M. Geology and Water Resources of Clark Couty, South Dakota, Part I: Geology; Bulletin No. 29; South Dakota Geological Survey: Vermillion, SD, USA, 1987.
  33. Helgerson, R.; Duchossois, G.E. Geology and Water Resources of Hand and Hyde Counties, South Dakota, Part I: Geology; Bulletin No. 28; South Dakota Geological Survey: Vermillion, SD, USA, 1987.
  34. Schroeder, W. Geology and Water Resources of Miner County, South Dakota, Part I: Geology; Bulletin No. 31; South Dakota Geological Survey: Vermillion, SD, USA, 1988.
  35. Christensen, C.M. Geology of Davison and Hanson Counties, South Dakota; Bulletin No. 33; South Dakota Geological Survey: Vermillion, SD, USA, 1989.
  36. Tomhave, D.W. Geology of Spink County, South Dakota; Bulletin No. 38; South Dakota Geological Survey: Vermillion, SD, USA, 1997.
  37. Hedges, L.S. Geology of Aurora and Jerauld Counties, South Dakota; Bulletin No. 32; South Dakota Geological Survey: Vermillion, SD, USA, 2001.
  38. Schulz, L.D.; Jarret, M.J. Geology of Brookings and Kingsbury Counties, South Dakota; Bulletin No. 40; South Dakota Geological Survey: Vermillion, SD, USA, 2009.
  39. Reimer, P.J.; Austin, W.E.N.; Bard, E.; Bayliss, A.; Blackwell, P.G.; Bronk Ramsey, C.; Butzin, M.; Cheng, H.; Edwards, R.L.; Friedrich, M.; et al. The IntCal20 Northern Hemisphere Radiocarbon Age Calibration Curve (0-55 kBP). Radiocarbon 2020, 62, 725–757. [Google Scholar] [CrossRef]
  40. Lougheed, B.C.; Obrochta, S.P. MatCal: Open-source Bayesian 14C age Calibration in Matlab. J. Open Res. Softw. 2016, 4, e42. [Google Scholar] [CrossRef]
  41. Ives, P.C.; Levin, B.; Oman, C.L.; Rubin, M. U.S. Geological Survey Radiocarbon Dates IX. Radiocarbon 1967, 9, 505–529. [Google Scholar] [CrossRef]
  42. Steece, F.V. Late Wisconsin Ice-Perched Lake Deposit, Lincoln County, South Dakota. Proc. S. D. Acad. Sci. 1966, 45, 67–73. [Google Scholar]
  43. Ives, P.C.; Levin, B.; Robinson, R.D.; Rubin, M. U.S. Geological Survey Radiocarbon Dates VII. Radiocarbon 1964, 6, 37–76. [Google Scholar] [CrossRef]
  44. Barnosky, C.W.; Grimm, E.C.; Wright, H.E., Jr. Towards a Postglacial History of the Northern Great Plains: A Review of the Paleoecologic Problems. Ann. Carnegie Mus. 1987, 56, 259–273. [Google Scholar] [CrossRef]
  45. Bender, M.M.; Baerreis, D.A.; Bryson, R.A.; Steventon, R.L. University of Wisconsin Radiocarbon Dates XIX. Radiocarbon 1982, 1, 83–100. [Google Scholar] [CrossRef]
  46. Sullivan, B.M.; Spiker, E.; Rubin, M. U.S. Geological Survey Radiocarbon Dates XI. Radiocarbon 1970, 12, 319–334. [Google Scholar] [CrossRef]
  47. Dean, W.E.; Schwalb, A. Holocene Environmental and Climatic Change in the Northern Great Plains as Recorded in the Geochemistry of Sediments in Pickerel Lake, South Dakota. Quat. Int. 2000, 67, 5–20. [Google Scholar] [CrossRef]
  48. Watts, W.A.; Bright, R.C. Pollen, Seed and Mollusk Analysis of a Sediment Core from Pickerel Lake, Northeastern South Dakota. Geol. Soc. Am. Bull. 1968, 79, 855–876. [Google Scholar] [CrossRef]
  49. Lithologic Logs: 094N56W18CCCB. Available online: https://gis.usd.edu/lithlogs/YANKTON/094N56W18CCCB.pdf (accessed on 22 June 2025).
  50. Deevey, E.S.; Gralenski, L.J.; Hoffren, V. Yale Natural Radiocarbon Measurements IV. Radiocarbon 1959, 1, 144–172. [Google Scholar] [CrossRef]
  51. Barendsen, G.W.; Deevey, E.S.; Gralenski, L.J. Yale Natural Radiocarbon Measurements III. Science 1957, 126, 908–919. [Google Scholar] [CrossRef]
  52. Lithologic Logs: 096N56W36DDCD. Available online: https://gis.usd.edu/lithlogs/YANKTON/096N56W36DDCD.pdf (accessed on 22 June 2025).
  53. Rubin, M.; Alexander, C. U.S. Geological Survey Radiocarbon Dates V. Radiocarbon 1960, 2, 129–185. [Google Scholar] [CrossRef]
  54. Stuiver, M. Yale Natural Radiocarbon Measurements IX. Radiocarbon 1969, 11, 545–658. [Google Scholar] [CrossRef]
  55. Levin, B.; Ives, P.C.; Oman, C.L.; Rubin, M. U.S. Geological Survey Radiocarbon Dates VIII. Radiocarbon 1965, 7, 372–398. [Google Scholar] [CrossRef]
  56. Biessel, D.R.; Gilbertson, J.P. Geology and Water Resources of Deuel and Hamlin Counties, South Dakota, Part 1: Geology; Bulletin No. 27; South Dakota Geological Survey: Vermillion, SD, USA, 1987.
  57. Martin, J.E.; Klukas, R.W. New Locality for Late Pleistocene Fossils from Edmunds County, South Dakota. Proc. S.D. Acad. Sci. 1989, 68, 57–58. [Google Scholar]
  58. Lowell, T.V. The Application of Radiocarbon Age Estimates to the Dating of Glacial Sequences: An Example from the Miami Sublobe, Ohio, USA. Quat. Sci. Rev. 1995, 14, 85–99. [Google Scholar] [CrossRef]
  59. Kelly, M.A.; Lowell, T.V.; Applegate, P.J.; Phillips, F.M.; Schaefer, J.M.; Smith, C.A.; Kim, H.; Leonard, K.C.; Hudson, A.M. A Locally Calibrated Late Glacial 10Be Production Rate from a Low-Latitude, High-Altitude Site in the Peruvian Andes. Quat. Geochronol. 2015, 26, 70–85. [Google Scholar] [CrossRef]
  60. Kopczynski, S.E.; Kelley, S.E.; Lowell, T.V.; Evenson, E.B.; Applegate, P.J. Latest Pleistocene advance and collapse of the Matanuska—Knik glacier system, Anchorage Lowland, southern Alaska. Quat. Sci. Rev. 2017, 156, 121–134. [Google Scholar] [CrossRef]
  61. Kozlowski, A.L.; Bird, B.C.; Lowell, T.V.; Smith, C.A.; Feranec, R.S.; Graham, B.L. Minimum Age of the Mapleton, Tully, and Labrador Hollow Moraines Indicates Correlation with the Port Huron Phase in Central New York State. In Quaternary Glaciation of the Great Lakes Region: Process, Landforms, Sediments, and Chronology; Kehew, A.E., Curry, B.B., Eds.; The Geological Society of America: McLean, VA, USA, 2018; Volume 530. [Google Scholar]
  62. Tomhave, D.W.; Schulz, L.D. Bedrock Geologic Map Showing Configuration of the Bedrock Surface in South Dakota East of the Missouri River; General Map No. G-09; South Dakota Geological Survey: Vermillion, SD, USA, 2004.
  63. Kerr, P.J.; Tassier-Surine, S.A.; Kilgore, S.M.; Bettis, E.A.; Dorale, J.A.; Cramer, B.D. Timing, Provenance, and Implications of Two MIS 3 Advances of the Laurentide Ice Sheet into the Upper Mississippi River Basin, USA. Quat. Sci. Rev. 2021, 261, 106296. [Google Scholar] [CrossRef]
  64. Broecker, W.S.; Farrand, W.R. Radiocarbon Age of the Two Creeks Forest Bed, Wisconsin. Geol. Soc. Am. Bull. 1963, 74, 795–802. [Google Scholar] [CrossRef]
  65. Leavitt, S.W. A New Tree-Ring δ13C and 14C Investigation of the Two Creeks Site. Radiocarbon 1992, 34, 792–797. [Google Scholar] [CrossRef]
  66. Kaiser, K.F. Two Creeks Interstade Dated through Dendrochronology and AMS. Quat. Res. 1994, 42, 288–298. [Google Scholar] [CrossRef]
  67. Rech, J.A.; Nekola, J.C.; Pigati, J.S. Radiocarbon ages of terrestrial gastropods extend duration of ice-free conditions at the Two Creeks bed, Wisconsin, USA. Quat. Res. 2012, 77, 289–292. [Google Scholar] [CrossRef]
  68. Larson, G.J.; Lowell, T.V.; Ostorm, N.E. Evidence for the Two Creeks interstade in the Lake Huron basin. Can. J. Earth Sci. 1994, 31, 793–797. [Google Scholar] [CrossRef]
  69. Young, R.A.; Gordon, L.M.; Owen, L.A.; Huot, S.; Zerfas, T.D. Evidence for a late glacial advance near the beginning of the Younger Dryas in western New York State: An event postdating the record for local Laurentide ice sheet recession. Geosphere 2020, 17, 271–305. [Google Scholar] [CrossRef]
  70. Putnam, A.E.; Denton, G.H.; Schaefer, J.M. A 10Be Chronology of the Esmark Moraine and Lysefjorden Region, Southwestern Norway: Evidence for Coeval Glacier Resurgence in Both Polar Hemispheres During the Antarctic Cold Reversal. Quat. Sci. Rev. 2023, 316, 108259. [Google Scholar] [CrossRef]
  71. WAIS Divide Project Members. Precise Interpolar Phasing of Abrupt Climate Change During the Last Ice Age. Nature 2015, 520, 661–665. [Google Scholar] [CrossRef]
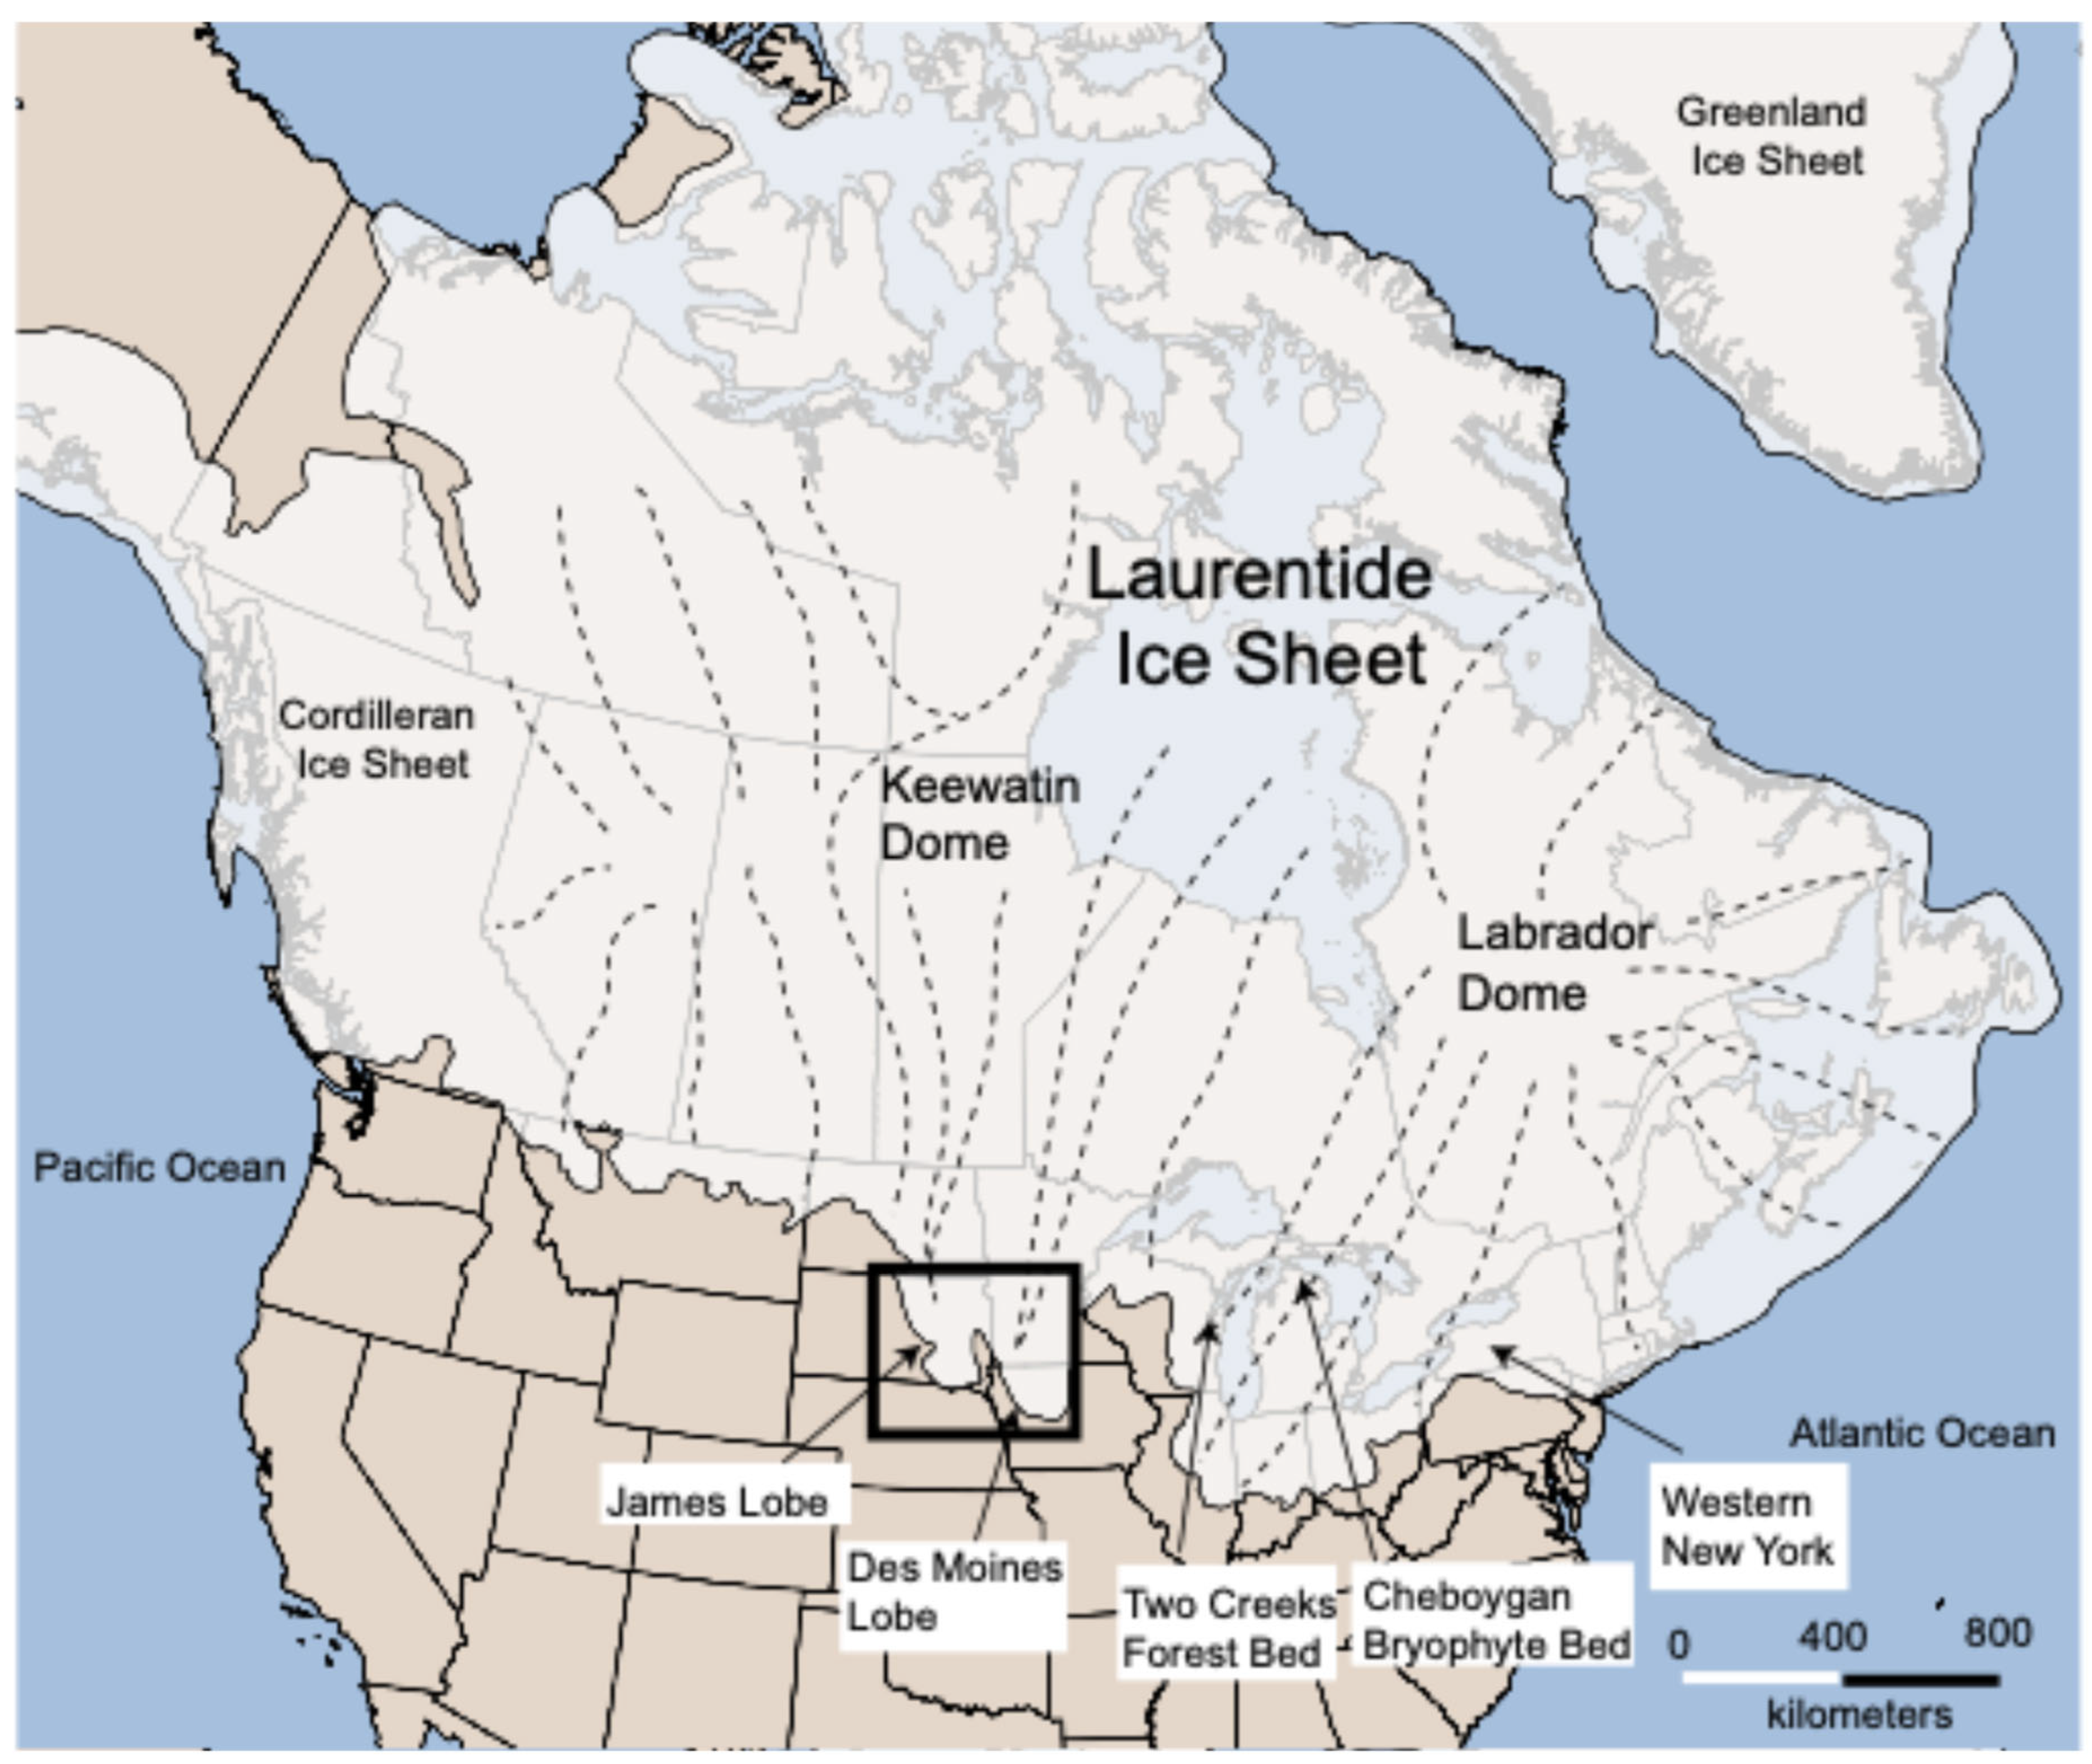
Figure 1. The maximum extent of the Laurentide Ice Sheet during the last glacial period. The dashed lines represent approximate flow lines, after Denton and Hughes (1981) [5]. The James Lobe is outlined by a black box and is detailed in Figure 2. Also noted are place names as mentioned in the text.
Quaternary 08 00058 g001
Figure 2. A digital elevation model of the James Lobe in eastern South Dakota. Significant landmarks are labeled in bold. South Dakota county names are labeled in italics. Blue triangles represent locations of maximum radiocarbon ages. Red inverted triangles represent the locations of minimum radiocarbon ages. Radiocarbon ages are presented as thousands of years before present (ka) followed by the sample lab number. The green star represents Eagle Pass Site [12].
Quaternary 08 00058 g002
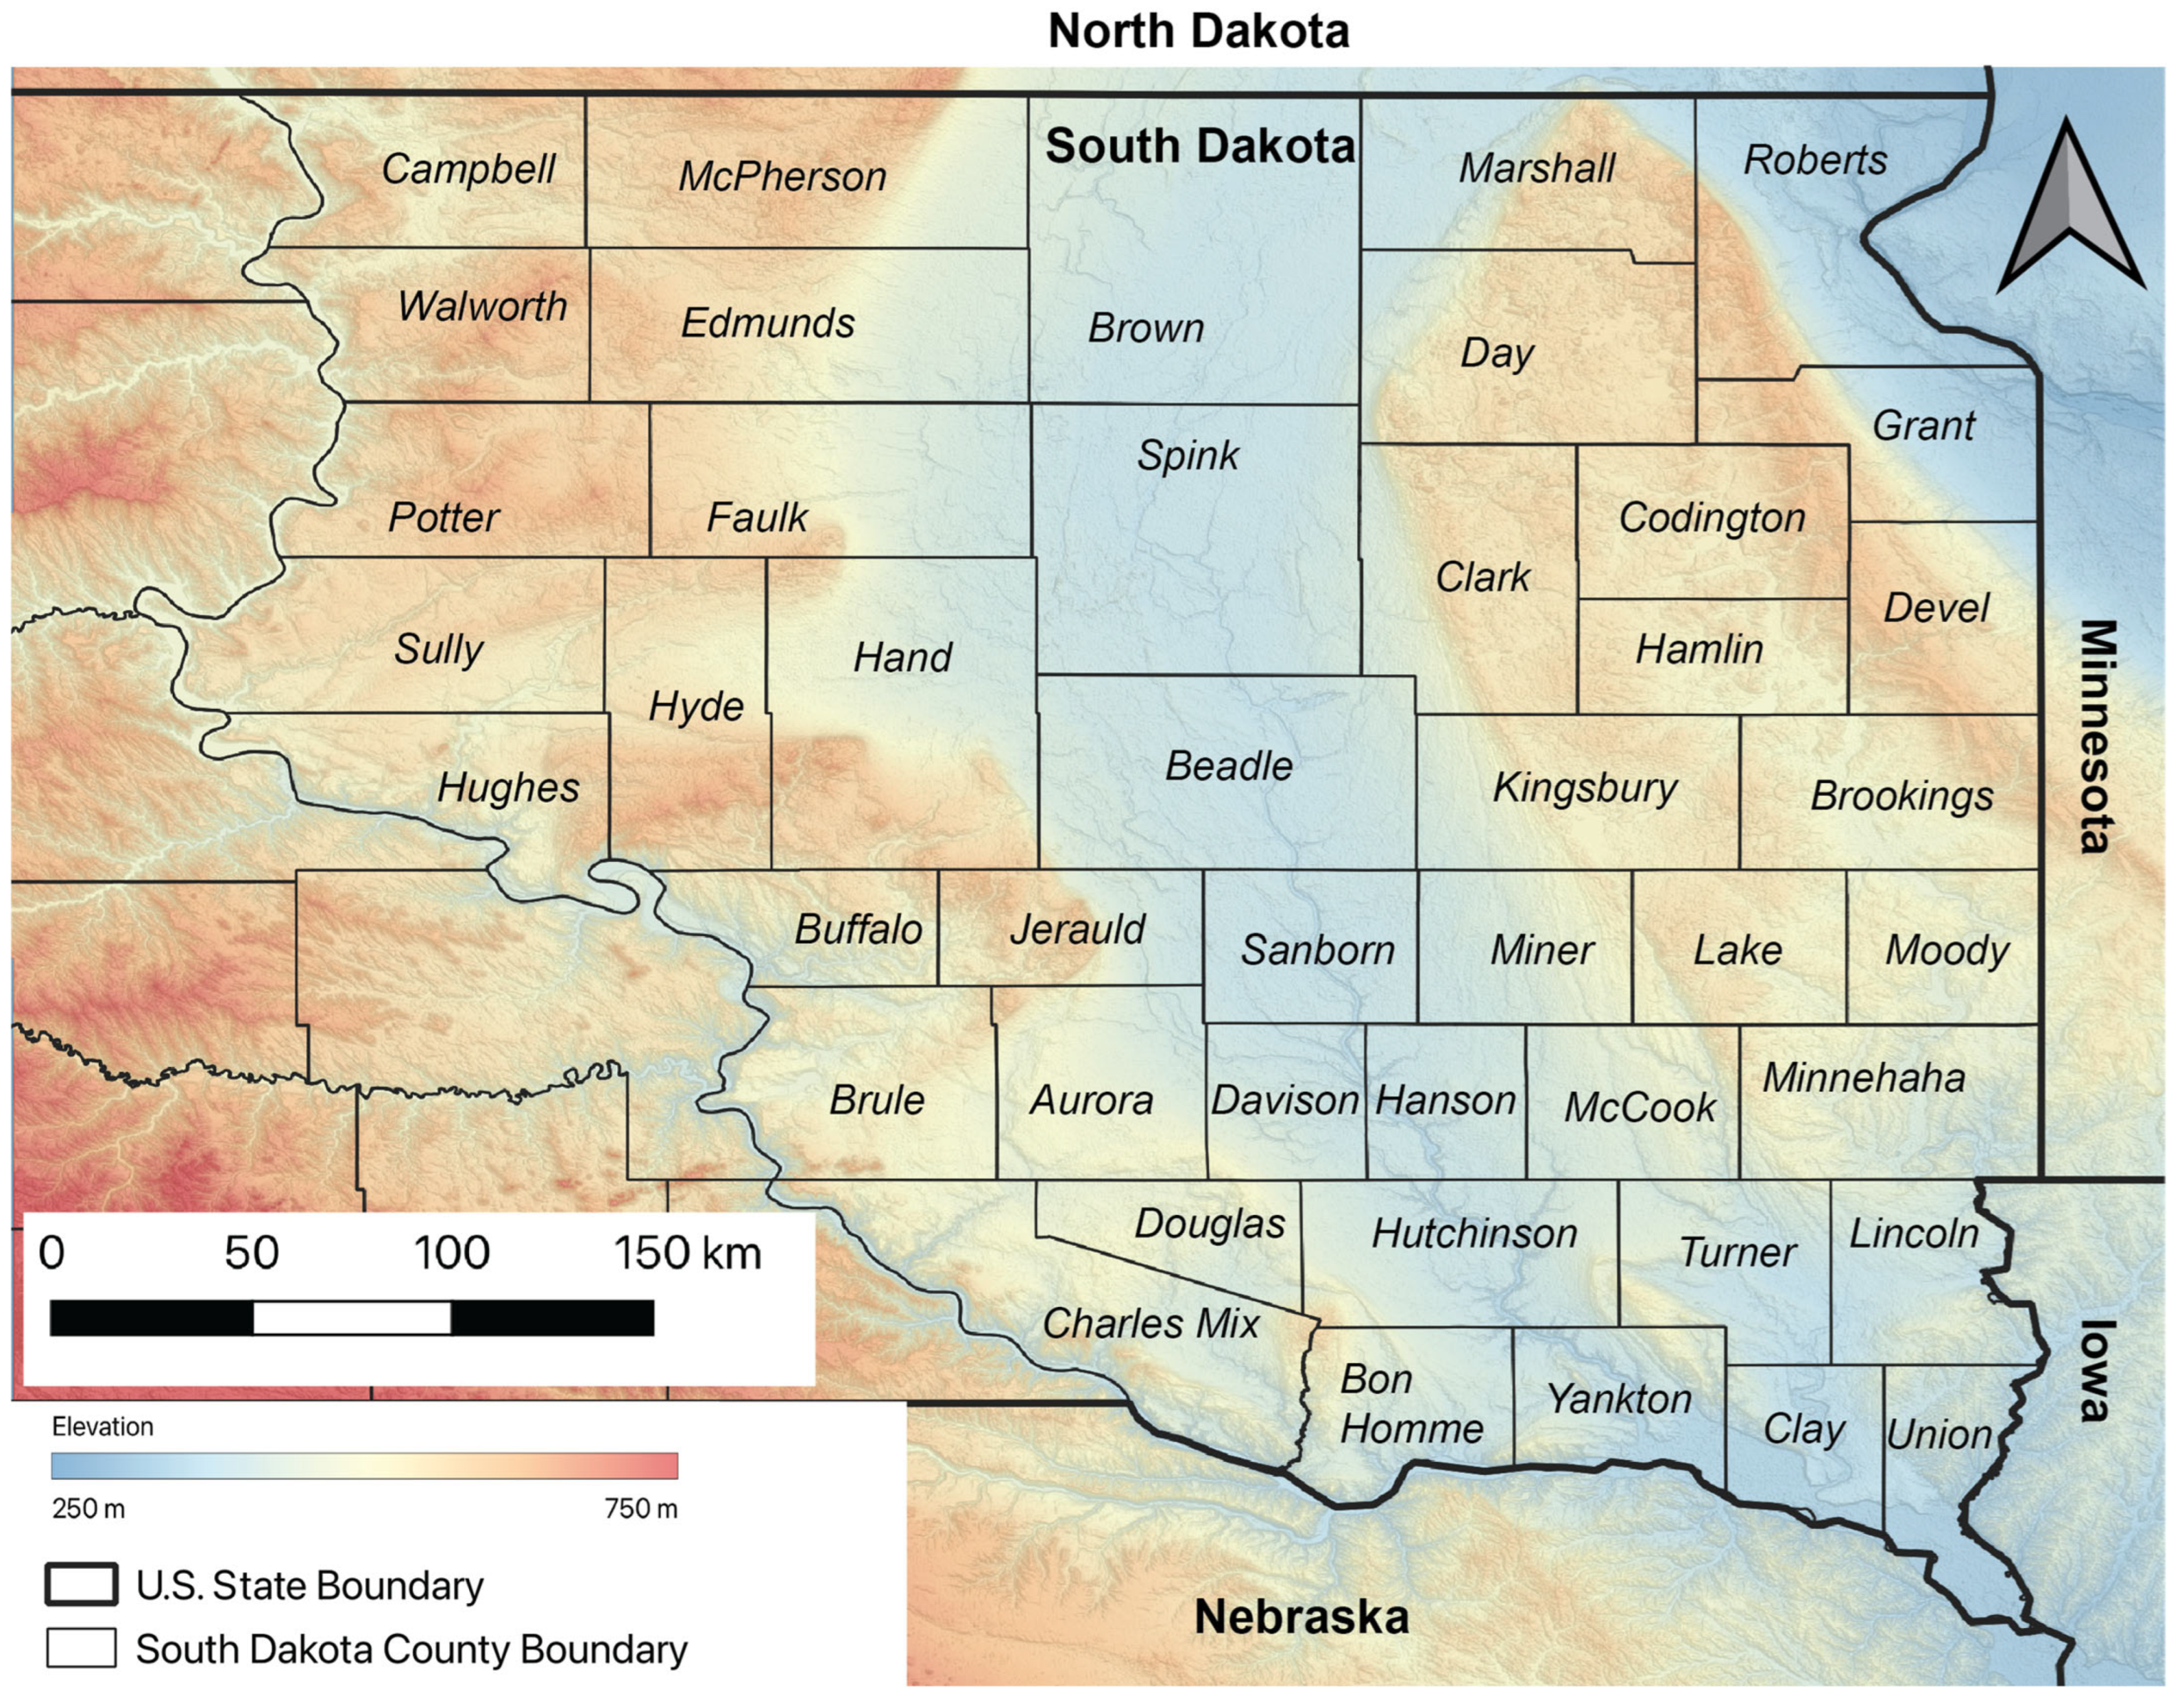
Figure 3. Counties and place names of eastern South Dakota as referenced in the text. State names are indicated in bold font, and county names are indicated in italics.
Quaternary 08 00058 g003
Figure 4. A simplified stratigraphy of the James Basin. Two distinct till units are present in the James Basin, which are both present in the central basin, separated by a lacustrine silt unit. Overlying the youngest till is outwash and alluvium. The dashed lines represent unclear contacts, especially between tills Qwtl1 and Qwtl2. Organics that yield maximum ages come from within the till units or at the contact between the till and outwash. Organics that yield minimum ages come from the outwash unit that overlies the till.
Quaternary 08 00058 g004
Figure 5. Graphical representation of the data plotted in Figure 2. These summed probability plots represent the age ranges of ages from (a) organic-bearing beds between drift sheets and (b) superglacial and outwash deposits.
Quaternary 08 00058 g005
Figure 6. Correlation along the southern margin of the Laurentide Ice Sheet. These come from maximum stratigraphic positions, and thus the 95% younger value should be used for comparisons. By this approach, 13.8 ka, 13.3 ka, 13.5 ka, and 13.4 ka represent the timing of advance along ~1000 km of the southern margin of the Laurentide Ice Sheet. (a) The James lobe, from this report, (b) the Two Creeks Forest Bed (only those analyses with errors 200 yr or less) [64,65,66,67], (c) the Cheboygan Bryophyte Bed [68], (d) the Buttermilk and Avon sites of Western New York [69].
Quaternary 08 00058 g006
Table 1. Radiocarbon ages of organics recovered from the subsurface in eastern South Dakota.
Site IDSample IDLatitudeLongitudeMaterial14C AgeAge, ka
(95.4% Probability)
Stratigraphic ContextRef.
1W-153043.186−97.658Wood9300 ± 20010,121–11,182Min. age—James Basin[41]
2W-175543.408−96.646Lymnaea shells11,770 ± 50012,737–15,237Min. age—James Basin[42]
3W-103344.099−98.258Shells10,060 ± 30010,992–12,623Min. age—James Basin[43]
4WIS-162644.833−99.9Picea needles11,690 ± 18013,229–13,872Min. age—Missouri Cot.[44]
5WIS-122544.981−97.357Gyttia12,610 ± 12014,312–15,326Min. age—Prairie Cot.[45]
5WIS-122744.981−97.357Wood10,940 ± 14012,701–13,115Min. age—Prairie Cot.[45]
6W-220145.477−97.589Pelecypod shells10,880 ± 32011,878–13,447Min. age—Prairie Cot.[46]
7W-2112 45.533−97.283Wood12,070 ± 4013,808–13,962Min. age—Prairie Cot.[47]
7Y-136145.533−97.283Picea wood10,670 ± 14012,419–12,900Min. age—Prairie Cot.[48]
8I-636145.824−99.26Organic material14,190 ± 22016,607–17,938Min. age—Missouri Cot.[30]
9W-2305 45.853−99.204Pelecypod shells9220 ± 30096,656–11,195Min. age—Missouri Cot.[30]
10I-1197542.954−97.525Wood12,540 ± 17014,105–15,313Max. age—Qwlt2[49]
11I-1197643.083−97.385Wood12,880 ± 17014,864–15,947Max. age—Qwlt2[25]
12W-118943.24−97.596Wood12,050 ± 40013,167–15,284Max. age—Qwlt2[43]
13Y-59543.321−97.097Picea wood12,760 ± 12014,837–15,636Max. age—Qwlt2[50]
14Y-45243.373−97.121Spruce wood12,330 ± 18013,985–15,089Max. age—Qwlt2[51]
15GX-1377643.459−96.439Wood13,150 ± 16015,317–16,211Max. age—Qwlt2[52]
16GX-561143.543−98.674Wood12,180 ± 36013,342–15,337Max. age—Qwlt2[37]
17W-175643.696−97.975Wood12,340 ± 30013,602–15,389Max. age—Qwlt2[41]
18W-80143.946−97.749Wood12,200 ± 40013,320–15,502Max. age—Qwlt2[53]
19W-175743.996−98.31Wood12,680 ± 30014,038–15,932Max. age—Qwlt2[41]
20Y-92544.014−98.346Wood12,520 ± 10014,272–15,158Max. age—Qwlt2[54]
21W-98744.135−98.354Wood fragments12,530 ± 35013,758–15,833Max. age—Qwlt2[43]
22W-137244.195−98.451Wood12,200 ± 40013,320–15,502Max. age—Qwlt2[55]
23W-137344.484−98.018Pelecypod shells14,000 ± 50015,601–18,253Max. age—Qwlt2[55]
24GX-343944.645−96.926Wood22,900 ± 100025,100–29,195Max. age—Qwlt1[56]
25GX-286444.751−96.929Wood26,150 ± 300023,899–36,612Max. age—Qwlt1[56]
26Beta-3055945.22−99.335Picea wood12,220 ± 15013,794–14,880Max. age—Qwlt2[57]
Disclaimer/Publisher’s Note: The statements, opinions and data contained in all publications are solely those of the individual author(s) and contributor(s) and not of MDPI and/or the editor(s). MDPI and/or the editor(s) disclaim responsibility for any injury to people or property resulting from any ideas, methods, instructions or products referred to in the content.