Article

Ice-Flow Dynamics During the Final Stage of the Fraser Glaciation (MIS2) in the Fraser Lowland, BC, Canada

Department of Earth Sciences, Simon Fraser University, 8888 University Dr., Burnaby, BC V5A 1S6, Canada
*
Author to whom correspondence should be addressed.
Quaternary 2025, 8(1), 13; https://doi.org/10.3390/quat8010013
Submission received: 4 July 2024 / Revised: 8 January 2025 / Accepted: 20 January 2025 / Published: 17 March 2025

Abstract

:
Although the Late Pleistocene glaciation history of the Fraser Lowland (BC, Canada) is relatively well studied, little is known about ice-flow directions during the last glaciation (Fraser glaciation). Lidar imagery from the western Fraser Lowland was used to identify and interpret previously unrecognized glacial landforms in a heavily urbanized and vegetated area. This indicates patterns of ice flow during the latest stage of the Fraser glaciation (Vashon stade) of the Cordilleran Ice Sheet. The imagery provides a picture of dominant SSE flow from the Strait of Georgia in the western part of the study area, and SSW flow from the southern Coast Mountain valleys in the eastern part, resulting in an overall southward flow, as documented in the uplands in the southern part of our study area. No evidence for a substantially different ice flow could be identified. Three new radiocarbon ages from the Sechelt area ca. 40 km northwest of the Fraser Lowland indicate a proximal ice margin in the Strait of Georgia already ca. 30 cal ka BP, well before the Coquitlam ice advance in the Fraser Lowland. These ages contribute to the unsolved discussion if this ice margin advanced onto the Fraser Lowland, yet further studies are needed.

1. Introduction

Reconstructing the ice-flow history of formerly glaciated regions may come with major challenges. This is especially true for regions near the periphery of ice sheets, in settings where multiple valley ice streams are interacting in a low relief area, creating a highly variable ice-flow regime. It becomes even more challenging when field evidence is overprinted by dense vegetation or heavy urbanization, or is simply too localized to be resolved by other remote sensing techniques or field mapping [1,2,3]. An excellent example of such a setting is the western Fraser Lowland (BC, Canada).
The Fraser Lowland, in southwest British Columbia (Figure 1), was overridden by the Cordilleran Ice Sheet (CIS) several times during the Pleistocene [4,5,6,7,8,9]. This area has been the focus of numerous studies over the past several decades, for example at the former Mary Hill gravel pit in Port Coquitlam (e.g., [10,11]), Point Grey in Vancouver (e.g., [7,12]), and the valleys in the Coast Mountains bordering the lowland to the north (Capilano, Lynn, Seymour, Coquitlam; Figure 1 [10,13,14,15,16]). Thorough sedimentological and chronological investigation of exposed sediments provide the regional stratigraphic framework and draws a conclusive picture of repeated ice advances into the Fraser Lowland and non-glacial periods. A recent study of Pleistocene sediment cores acquired immediately before the construction of a rapid transit tunnel in Port Moody (Figure 1) is the latest of such contributions [17]. The latter study revealed a continuous sedimentary succession including at least the last four glacial advances in the Port Moody region (Figure 1).
Two well-dated advances occurred in the Fraser Lowland during the Fraser glaciation (correlative with the MIS 2 Late Wisconsinan). These advances were bracketed by radiocarbon ages on organics from under- and overlying sediments as well as from organic material recovered from within till. The earlier Coquitlam advance has been dated to ca. 21.3–18.7 14C ka BP (ca. 25.6–22.7 cal ka BP) on organic material from pre-Coquitlam Quadra Sand deposits, wood fragments from within Coquitlam till, and post-Coquitlam peat [6,10,18]. It was followed by the Vashon advance, which reached its maximum extent in the Puget Lowland (Washington State, USA) around 14.5 14C ka BP (ca. 17.7 cal ka BP) [6,19,20,21,22,23]. The latter also represents the maximum extent of the CIS in southwest BC. The two advances are separated by the Port Moody interstade (18.5–17.5 14C ka BP; ca. 22.4–21.2 cal ka BP), a brief period of glacier retreat documented at several sites in the Fraser Lowland including Port Moody and in the southern Coast Mountain valleys [16,17,24]. At all the above-mentioned studied sites in the Fraser Lowland (Mary Hill gravel pit, the Port Moody area, and the Capilano, Lynn, Seymour, and Coquitlam valleys in the southern Coast Mountains), Coquitlam and Vashon stade tills were identified, with the exception of the Point Grey site, where only one till is present.
Figure 2. Colorized Lidar image of the western Fraser Lowland. The map extent is outlined in Figure 1. Red lines and arrows highlight ice-flow directions derived from orientations of drumlinoids, flutings, and crag-and-tail features. Black dashed rectangles indicate areas covered by subsequent figures. Red-outlined black triangles are mountain summits mentioned in the text. Black-filled squares mark locations mentioned in the discussion. Hatched areas are not covered by Lidar imagery. White areas represent open water. L.V. = Lynn Valley; S.V. = Seymour Valley; Coq.V. = Coquitlam Valley; P.M. upland = Port Moody upland; HT = Highbury Tunnel; BH09-214 = 122 m deep drill core; FD87-1 = 367 m deep drill core. Figure without annotations is provided in the supplement to this publication (Figure S4).
Quaternary 08 00013 g002
While the timing of Fraser glaciation ice advances into the Fraser Lowland is relatively well established, less is known about ice dynamics and ice-flow directions during these two stades. Our current understanding of ice-flow directions is based on till fabrics, striations, and qualitative provenance analyses (e.g., [13,14,15]). During the early stages of the Coquitlam and Vashon stades, glaciolacustrine sediments were deposited in the valleys of the southern Coast Mountains (Figure 1) because piedmont ice blocked their outlets, creating ice-dammed lakes (e.g., [10,14,16]). There are two possibilities about the source of the ice that blocked those valleys; specifically, ice either crossed the westernmost Fraser Lowland and Burrard Inlet from the west (Howe Sound/Strait of Georgia) or the east (Indian Arm/Pitt Lake/eastern Fraser Lowland; [10,13]). It has been proposed that repeated glacial advances in the Fraser Lowland followed nearly identical routes [10], it thus can be speculated that the ice responsible for the blockages had similar sources during the early stages of both stades. Based on directional data, Hicock and Lian [13] concluded that during the build-up and maxima of both the Coquitlam and Vashon stades, the pattern of ice flow evolved through three stages. First, southern Coast Mountain valleys glaciers flowed southward and coalesced with the ice in the adjacent Fraser Lowland. Second, at the maxima of the two stades, flow was westward across the Fraser Lowland, with contributions of the southern Coast Mountain valleys. Third, during the terminal stages, down-valley flow from the southern Coast Mountain valleys continued before general deglaciation of the Fraser Lowland. This sequence was later questioned by Ward and Thomson [18] based on radiocarbon ages on Late Pleistocene sediments in Chehalis Valley, ca. 70 km to the east (Figure 1). Their data indicate that no ice blocked the Chehalis Valley during the early stages of the Coquitlam stade, and speculate that ice cover in the eastern Fraser Lowland was less extensive than proposed by Hicock and Lian [13]. Ice cover there occurred after the watersheds in the southern Coast Mountains farther west were been blocked, precluding a western source for Coquitlam stade ice.
Although these pioneering studies provide valuable insights into local ice-flow directions, they rely on artificial and natural exposures, which are spatially limited in the heavily populated Greater Vancouver metropolitan area in the western Fraser Lowland. Light detection and ranging (Lidar) overcomes these obstacles and provides an excellent spatial tool to reconstruct the ice-flow history of populated and forested regions such as the Fraser Lowland. In this paper, we used high-resolution Lidar data covering the western Fraser Lowland and new radiocarbon ages from the Lehigh gravel pit near Sechelt (eastern shore of Strait of Georgia; Figure 1) northwest of the Fraser Lowland to provide new insights into the regional ice-flow history and ultimately refine the glacial history of the region.

2. Regional Setting

Our study area comprises the Canadian portion of the western Fraser Lowland, a rolling lowland area, mainly below 100 m a.s.l. (above sea level) and mostly underlain by Quaternary sediments, that extends eastward from the shores of the Strait of Georgia (part of the Salish Sea) to the Langley upland, and southward from the southern Coast Mountains to the International Boundary between Canada and the United States (Figure 1 and Figure 2). Metro Vancouver, which includes the City of Vancouver, Richmond, and Surrey, covers much of the western Fraser Lowland, although small parts of the lowland are agricultural land.
The southernmost Coast Mountains north of the Fraser Lowland are rugged, with steep slopes, roughly north–south-oriented U-shaped valleys (Capilano, Lynn, Seymour valleys), a fjord (Indian Arm, and two fjord lakes (Coquitlam and Pitt lakes)) (Figure 1 and Figure 2). Here, peaks reach up to about 1500 m a.s.l. (Figure 1). Although the mountain watersheds supported small glaciers during the Little Ice Age, there is currently only one small glacier (Coquitlam Glacier) remaining. The southern Coast Mountains are formed mainly of Cretaceous granitic rocks of the Coast Plutonic Complex, with some roof pendants of older metavolcanic and metasedimentary rocks [25,26]. Prominent volcanic rocks relate to the Pleistocene Garibaldi Volcanic Field (Figure 1). On the west, Burrard Inlet is a west–east arm of the sea separating the Coast Mountains from the Fraser Lowland and continues northward into the mountains as Indian Arm (Figure 2). Farther south, the Holocene Fraser River delta plain, which is <5 m a.s.l., extends from a gap in the Pleistocene uplands to the Strait of Georgia on the west and Boundary Bay on the south [27]. The bordering Pleistocene uplands include the informally named Burrard, Port Moody, Surrey, White Rock, and Langley uplands (Figure 2).

3. Materials and Methods

We use Lidar imagery available from the Government of British Columbia (LidarBC—Open LiDAR Data Portal) to identify surficial glacial features in the western Fraser Lowland. The point cloud data has a resolution of 8 points per m2, and the final DEM was produced with 1 m vertical resolution. Lidar digital elevation models (DEMs) were converted to hillshade images using ArcMap 10.8.2 software. The coordinate system used in this study is North America Datum (NAD) 1927 for UTM Zone 10N.
Glacial features were identified visually using the hillshade images. We mapped linear features to determine ice-flow directions including flutings, drumlinoids, and crag and tails [28,29,30] (Figure 3). Flutings in the project area are low elongate till ridges ca. 90–3400 m in length. Crag and tails are large rounded and linear bedrock protrusions bordered in the down-ice direction by a tail of till [31]. Drumlinoids are streamlined bedforms composed of till, usually—but not always—encompassing one rounded and one elongated streamlined side [32,33,34]. Flutings and drumlinoids are depositional features that elongate in the direction of ice flow. While flutings indicate flow in one direction or the other [35], crag and tails and drumlinoids—in most cases—provide a vector direction of ice flow [31,32,33]. All linear features were located on surficial geology maps [36,37] to verify they are composed of till. Moreover, satellite imagery was used to exclude the interpretation of artificial structures. Symbols for mapped ice-flow indicators were placed directly on top of the streamlined features.
Outside the area covered by the Lidar imagery to the northeast, radiocarbon concentrations of three samples (two ages are from one lodgepine cone, one from a tree branch) reported in the paper were collected at the Lehigh gravel pit near the City of Sechelt (49°29′25″ N, 123°44′27″ W; Figure 1; Table 1; Supplementary Figures S1–S3). The dated wood was recovered from near the bottom (10–14 m a.s.l.) of a thick sequence of ice-proximal kame terrace or kame delta sediments consisting mainly of poorly sorted sandy gravel, but grading up into sand with gravel lenses and outsized boulders. These sediments are truncated and overlain by ice-proximal Vashon recessional deltaic sediments (sand, gravel) deposited in the isostatically depressed Salish Sea at the end of the last glaciation at the front of the glacier in Sechelt Inlet. The samples were measured at the Keck Carbon Cycle AMS Facility. The samples were treated with acid-base-acid (1N HCl and 1N NaOH, 75 °C) prior to combustion. Radiocarbon concentrations are given as fractions of the modern standard, D14C, and conventional radiocarbon age, following the conventions of Polach and Stuiver [38]. All 14C ages were calibrated using the IntCal20 calibration curve [39].
Figure 3. Methods used to identify and map geomorphological features. Hillshade images are used in combination with contours to identify potential features. Sample features are chosen for cross-sectional elevation profiles and the results are generalized for all similar features in a region. (A) Example of a fluting identified in the Burrard uplands. The long-axis profile maintains a consistent height and the short-axis profile is symmetrical. (B) Example of a bench that can be mistaken for a flute. The long-axis cross-section shows a dip to the northwest and the short-axis cross-section shows extreme asymmetry with a bench-like profile. (C) Example of a drumlinoid identified in the Surrey uplands. The long axis shows an asymmetry with a short steep side to the north and a tailing gentler slope to the south. The cross-section of the short axis is symmetrical around the center. (D) Example of an inconclusive geomorphological feature. The hillshade and the contours suggest a possible drumlinoid; however, the cross-section of the short axis is asymmetrical. Features with those or similar characteristics as shown in (B,D) were not interpreted as flutings or drumlinoids and were excluded from our interpretation. (E) Crag-and-tail structure identified on the Burrard upland. Resistant bedrock crag at the up-ice end and elongated tapering tail in down-ice direction.
Quaternary 08 00013 g003

4. Results

Lidar imagery reveals multiple landforms that serve as ice-flow indicators (Figure 2, Figure 4, Figure 5, Figure 6, Figure 7, Figure 8 and Figure 9). A total of 311 streamlined landforms (269 flutings, 21 drumlinoids, 21 crag and tails) were mapped. Unidirectional flow can be interpreted with confidence in all cases from the distribution of drumlinoids and crag-and-tail features. These features occur mainly in upland areas and near the mouths of major southern Coast Mountain valleys. No ice-flow indicators exist in areas dominated by exposed bedrock, such as West Vancouver, and in built-up areas, and on the surface of the Holocene Fraser Delta (Figure 1 and Figure 2).

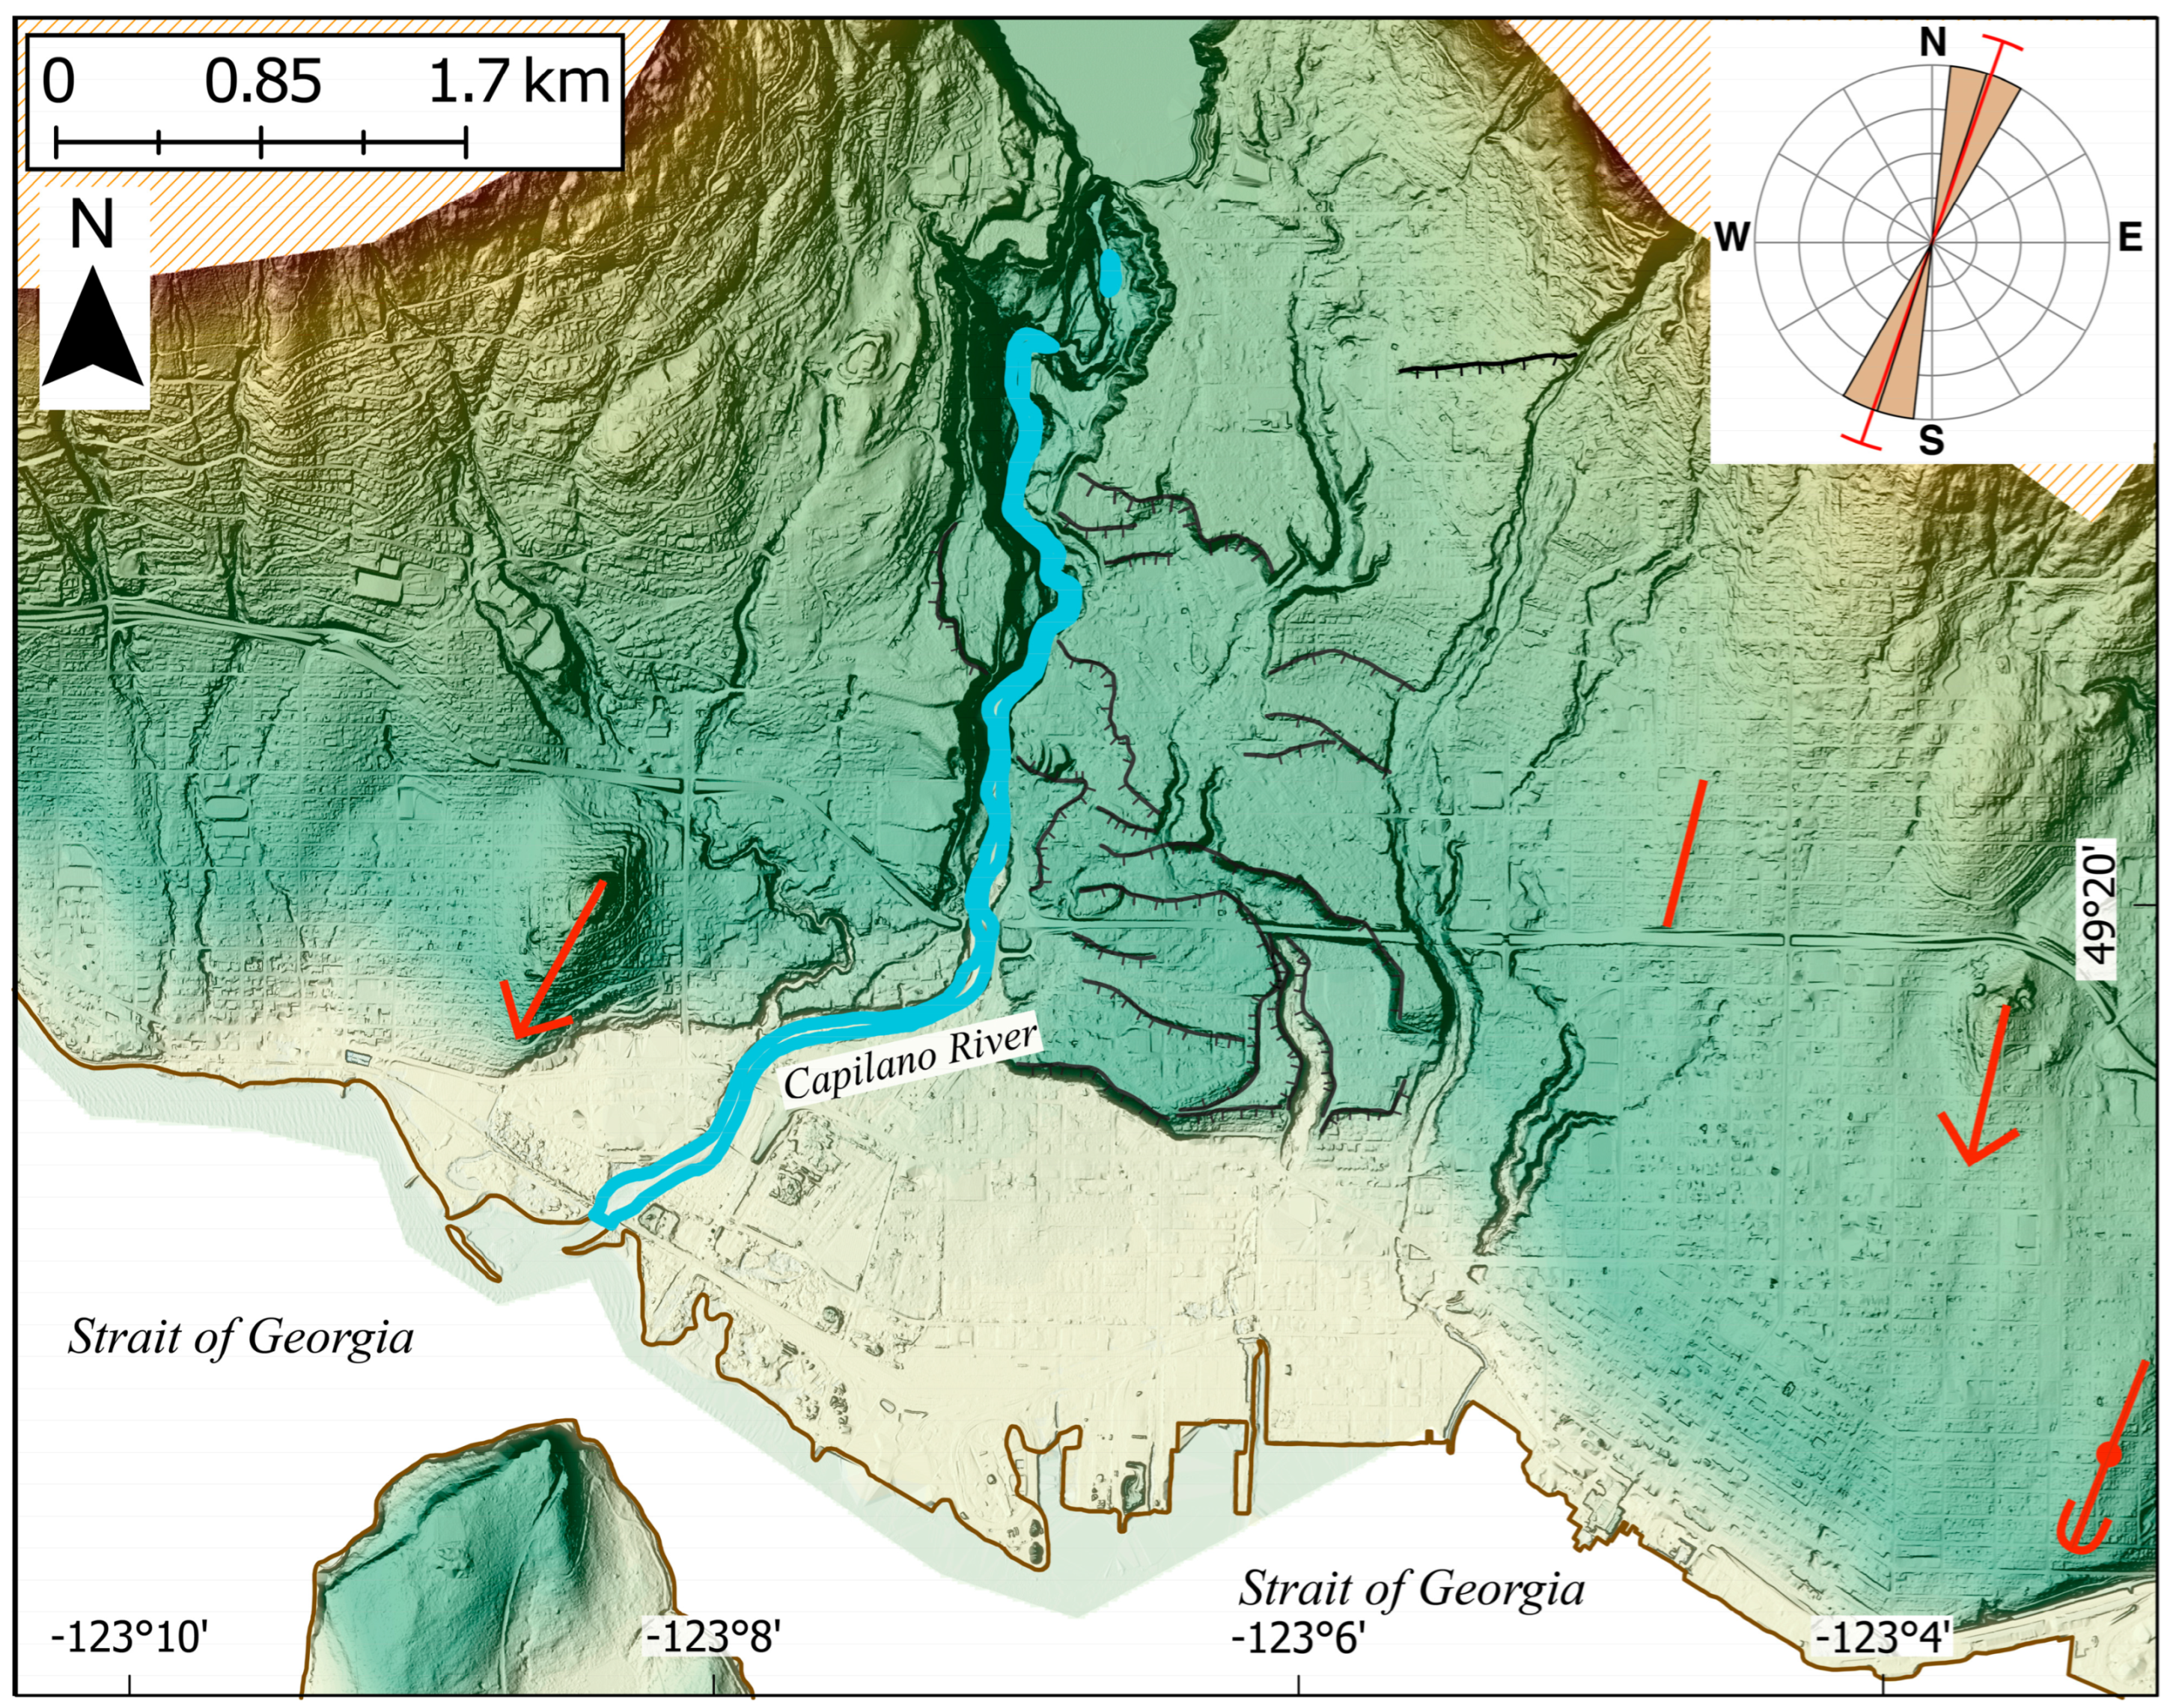
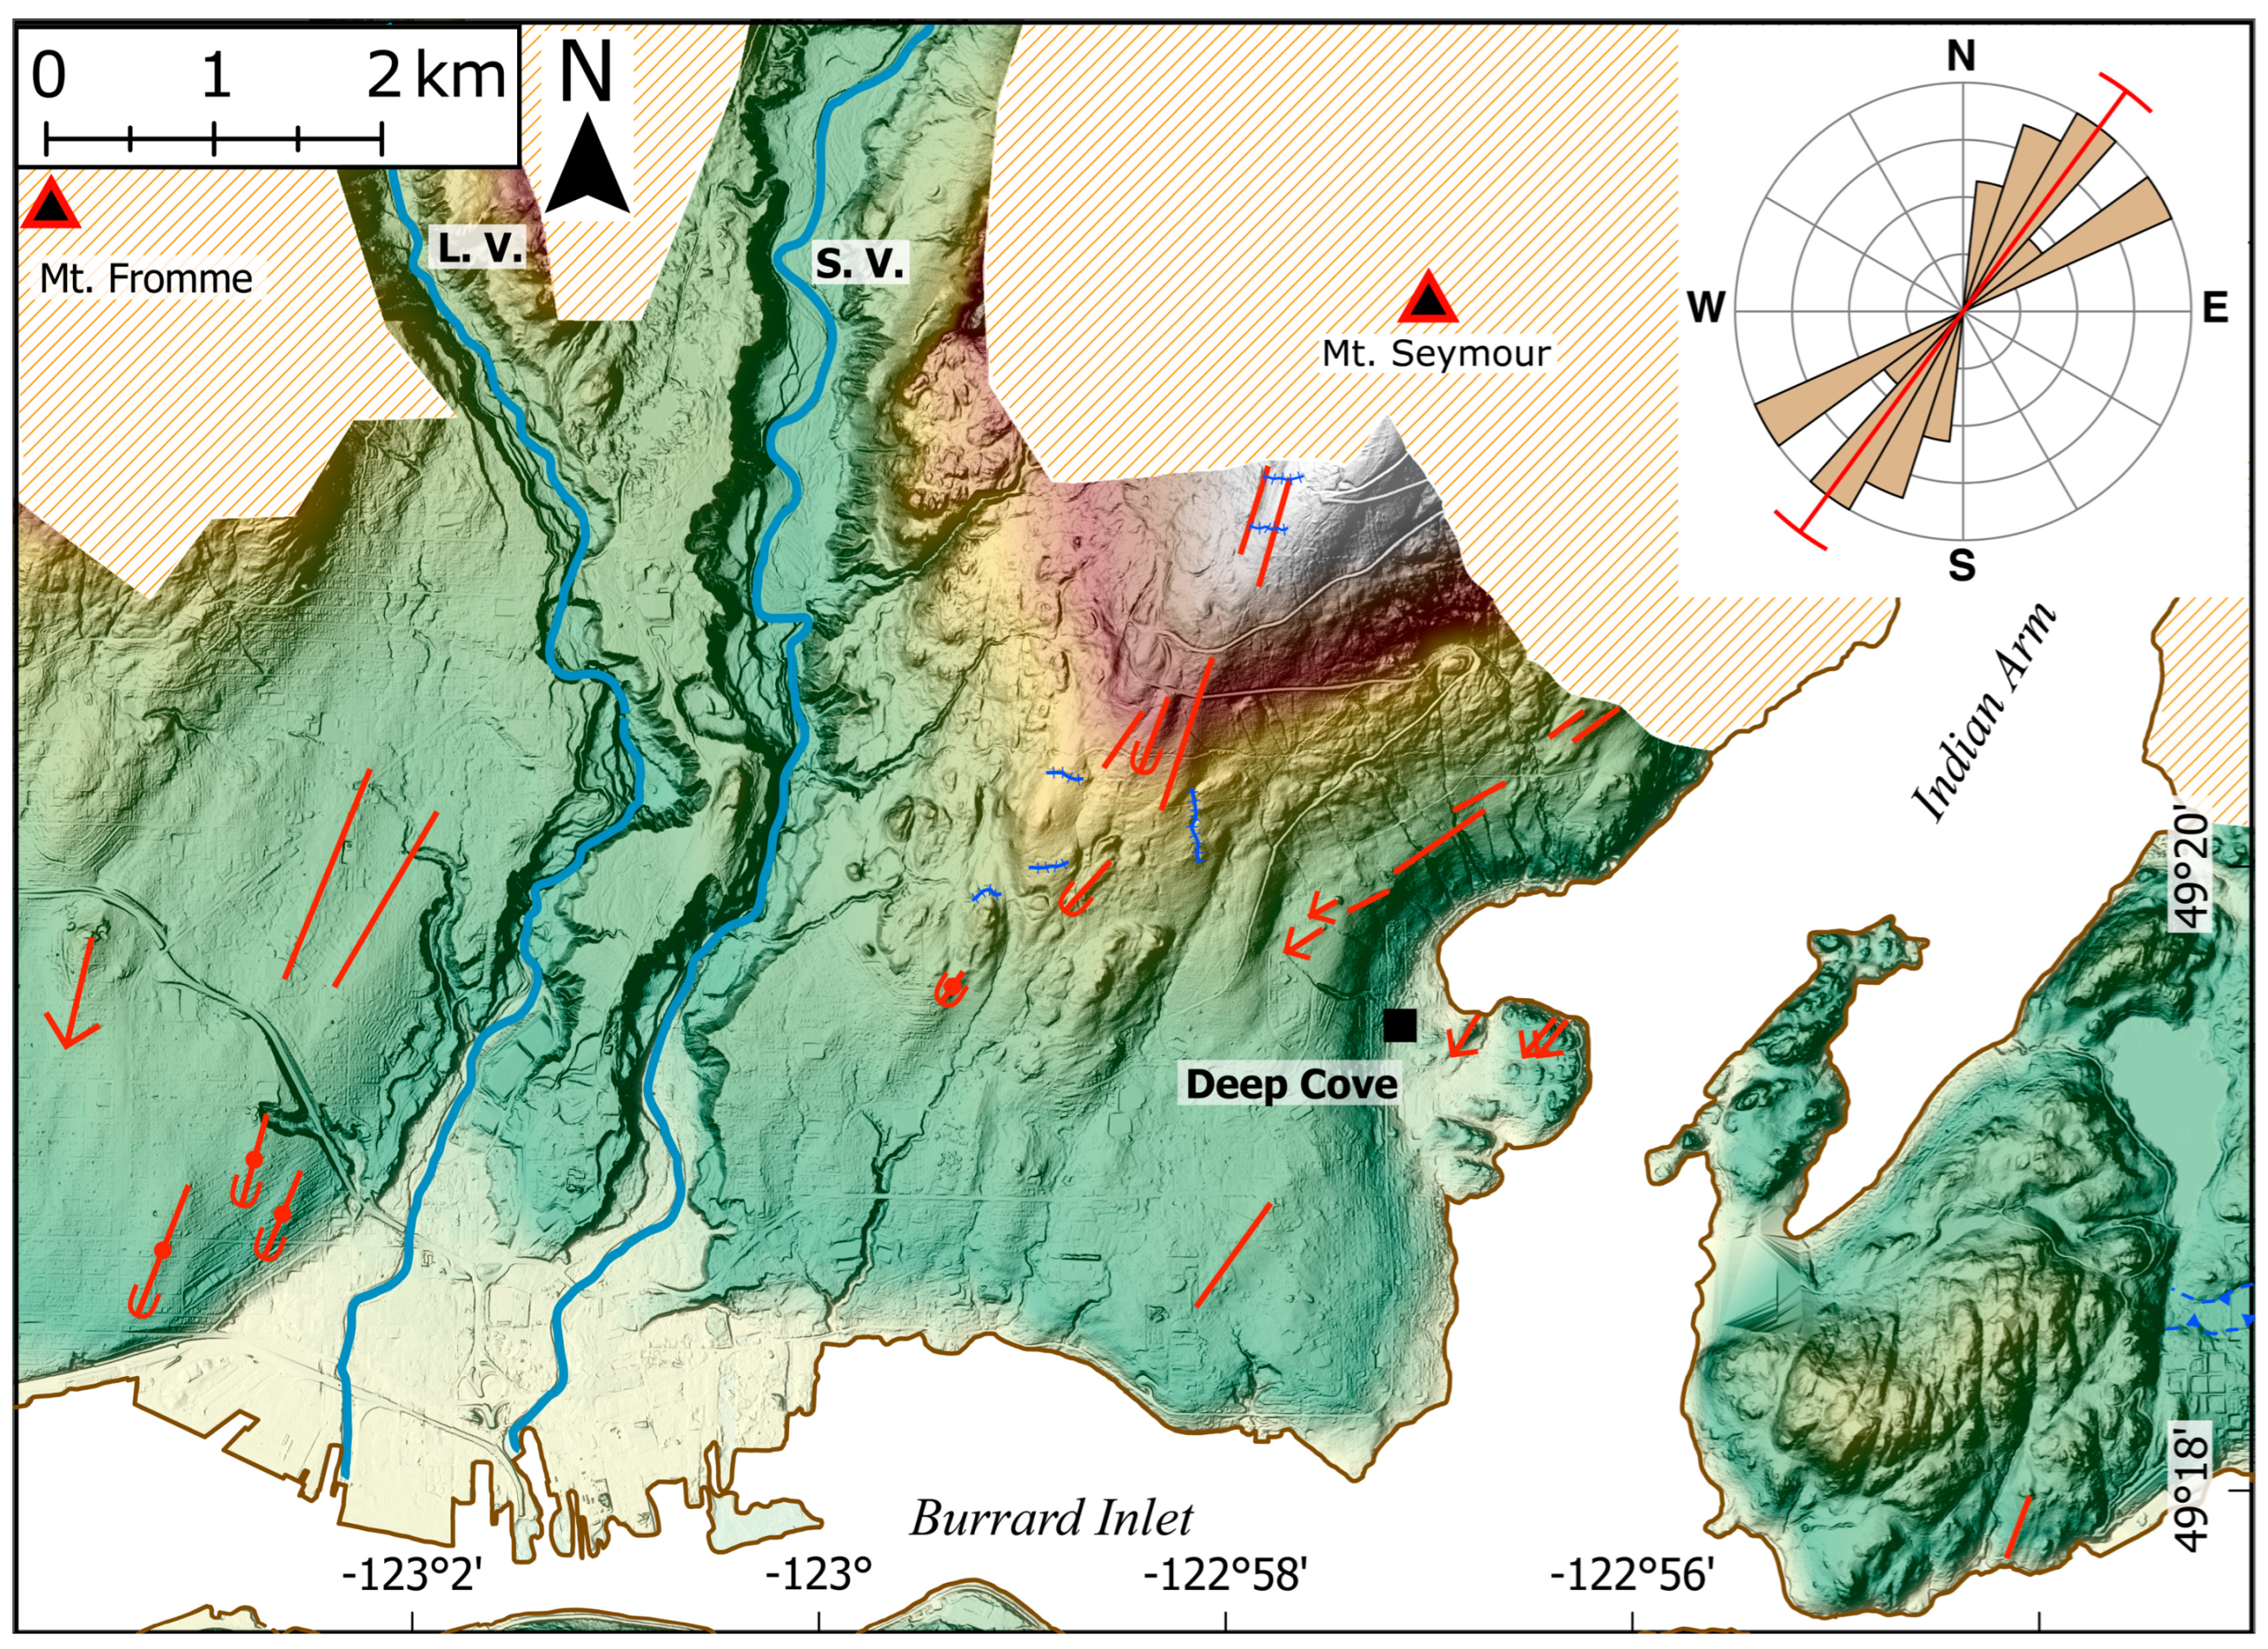
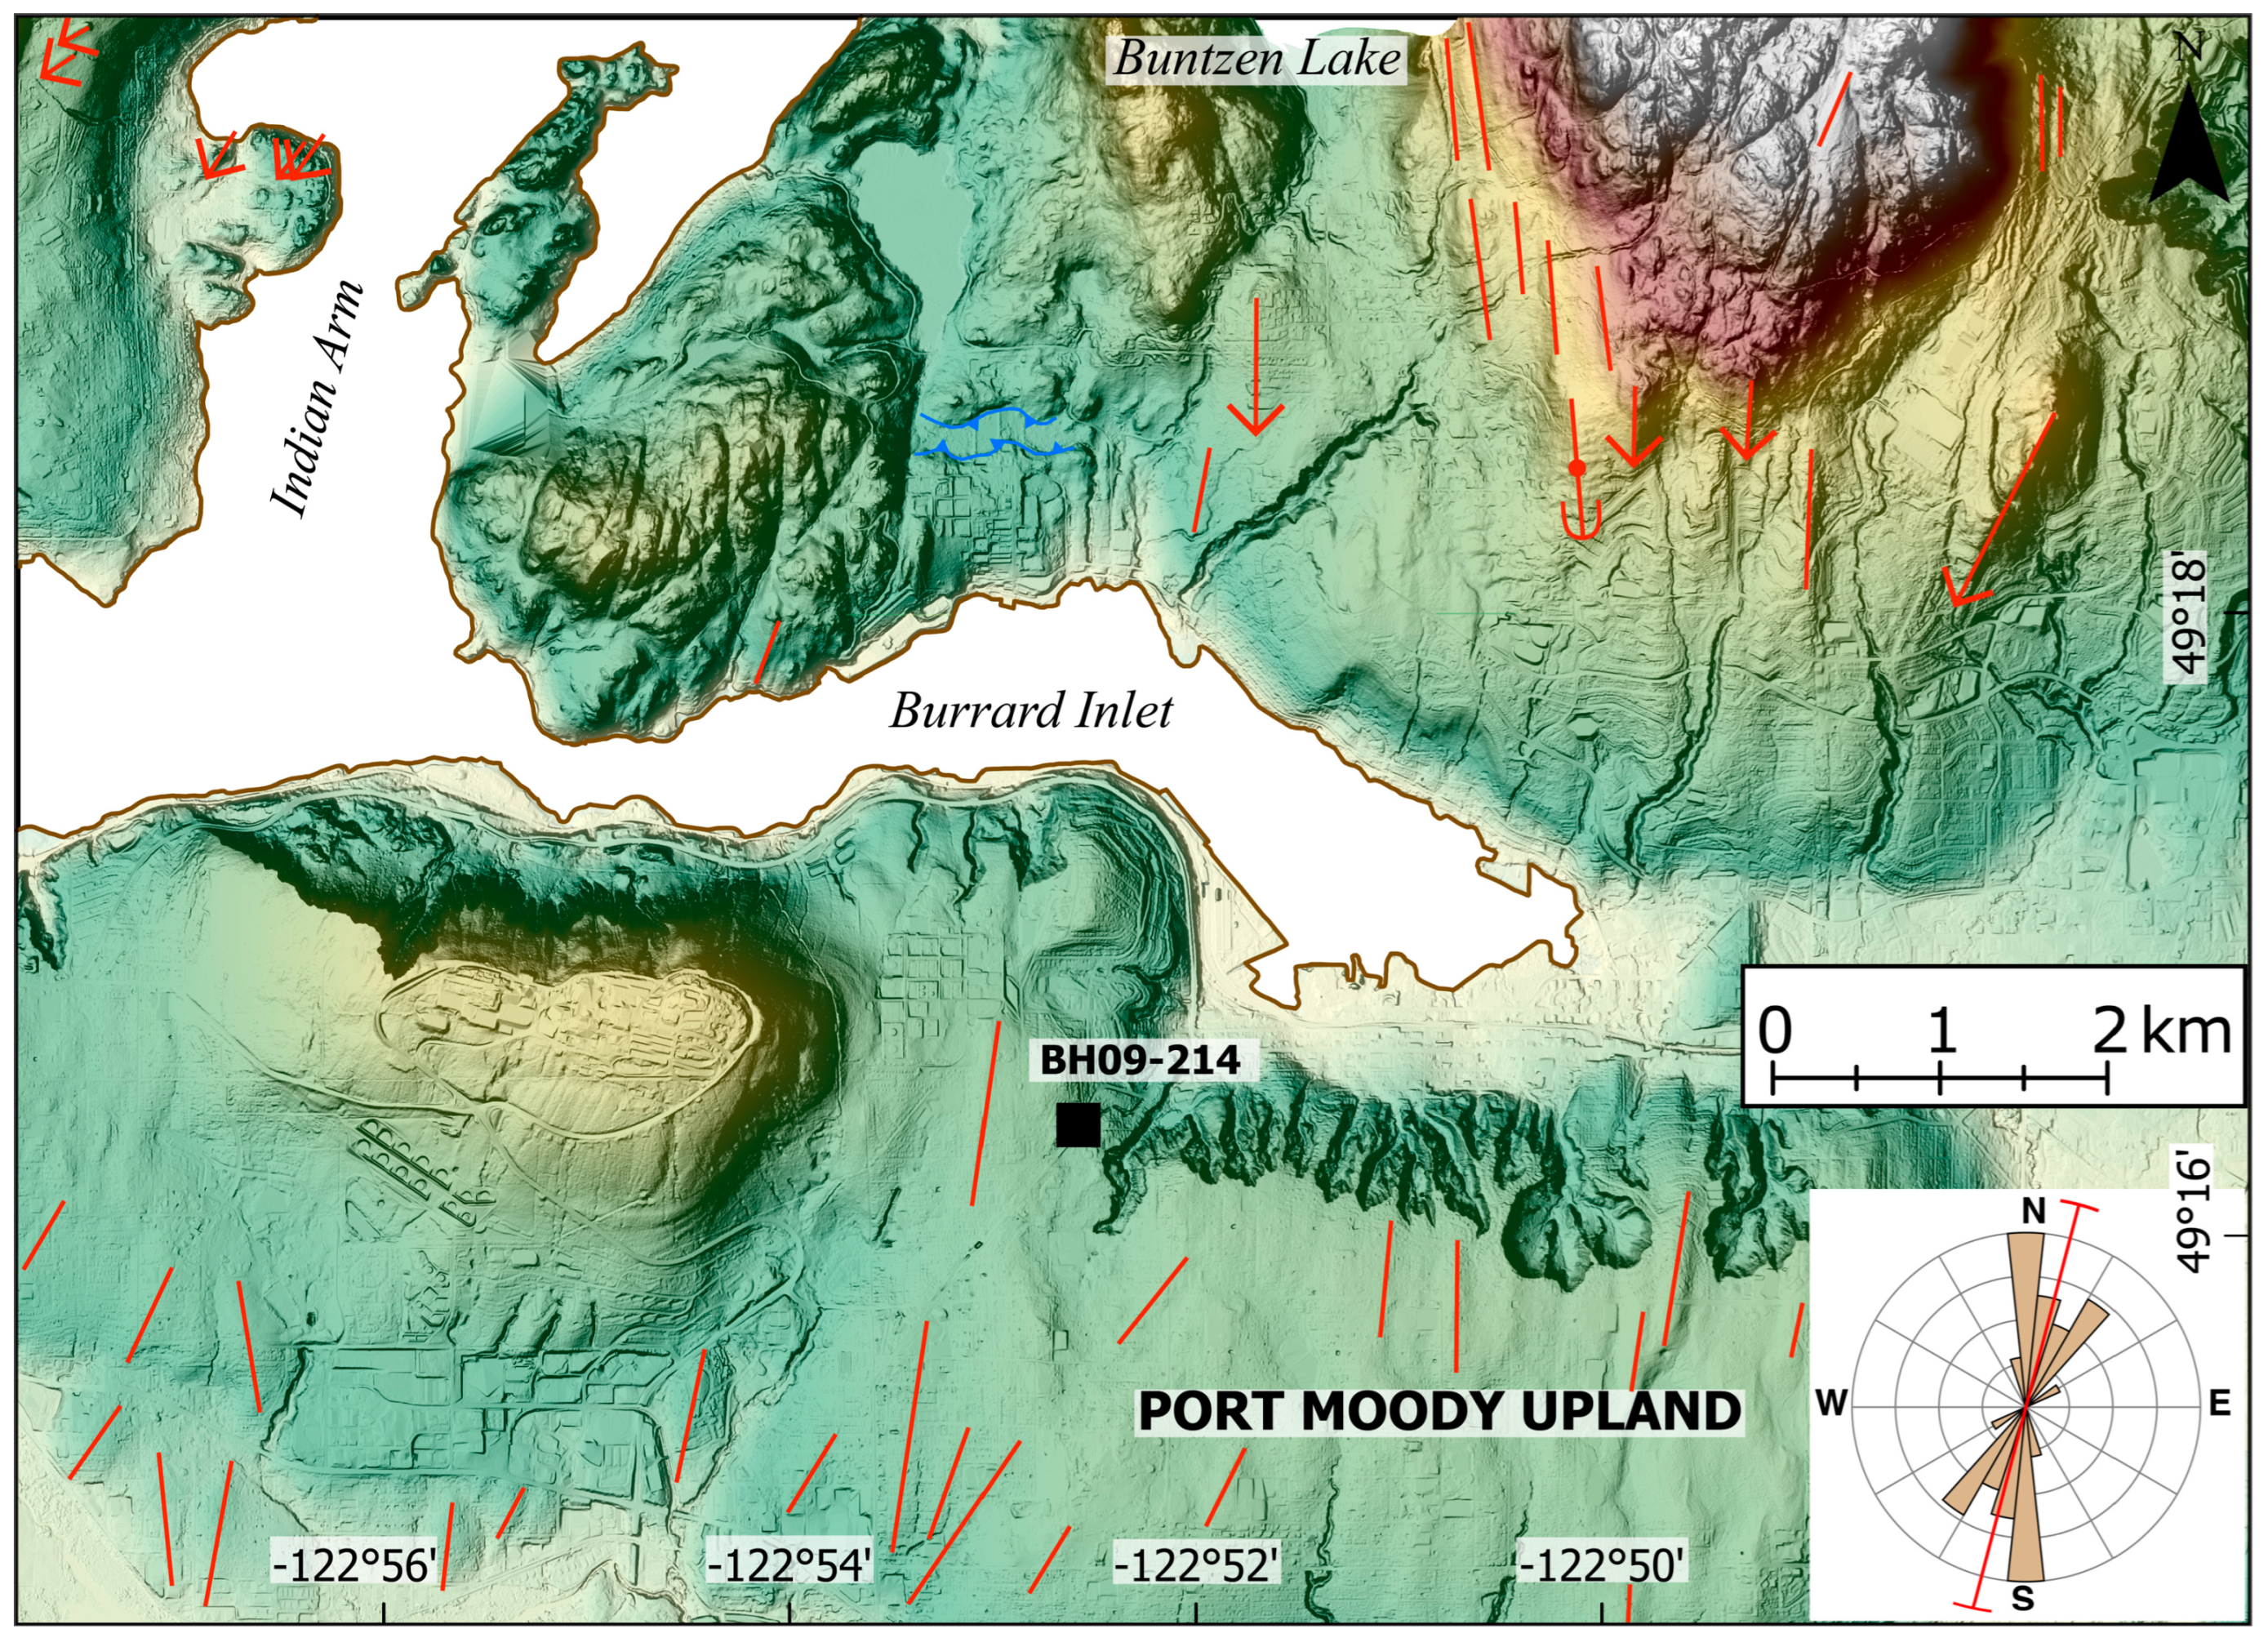
4.1. Southern Coast Mountains
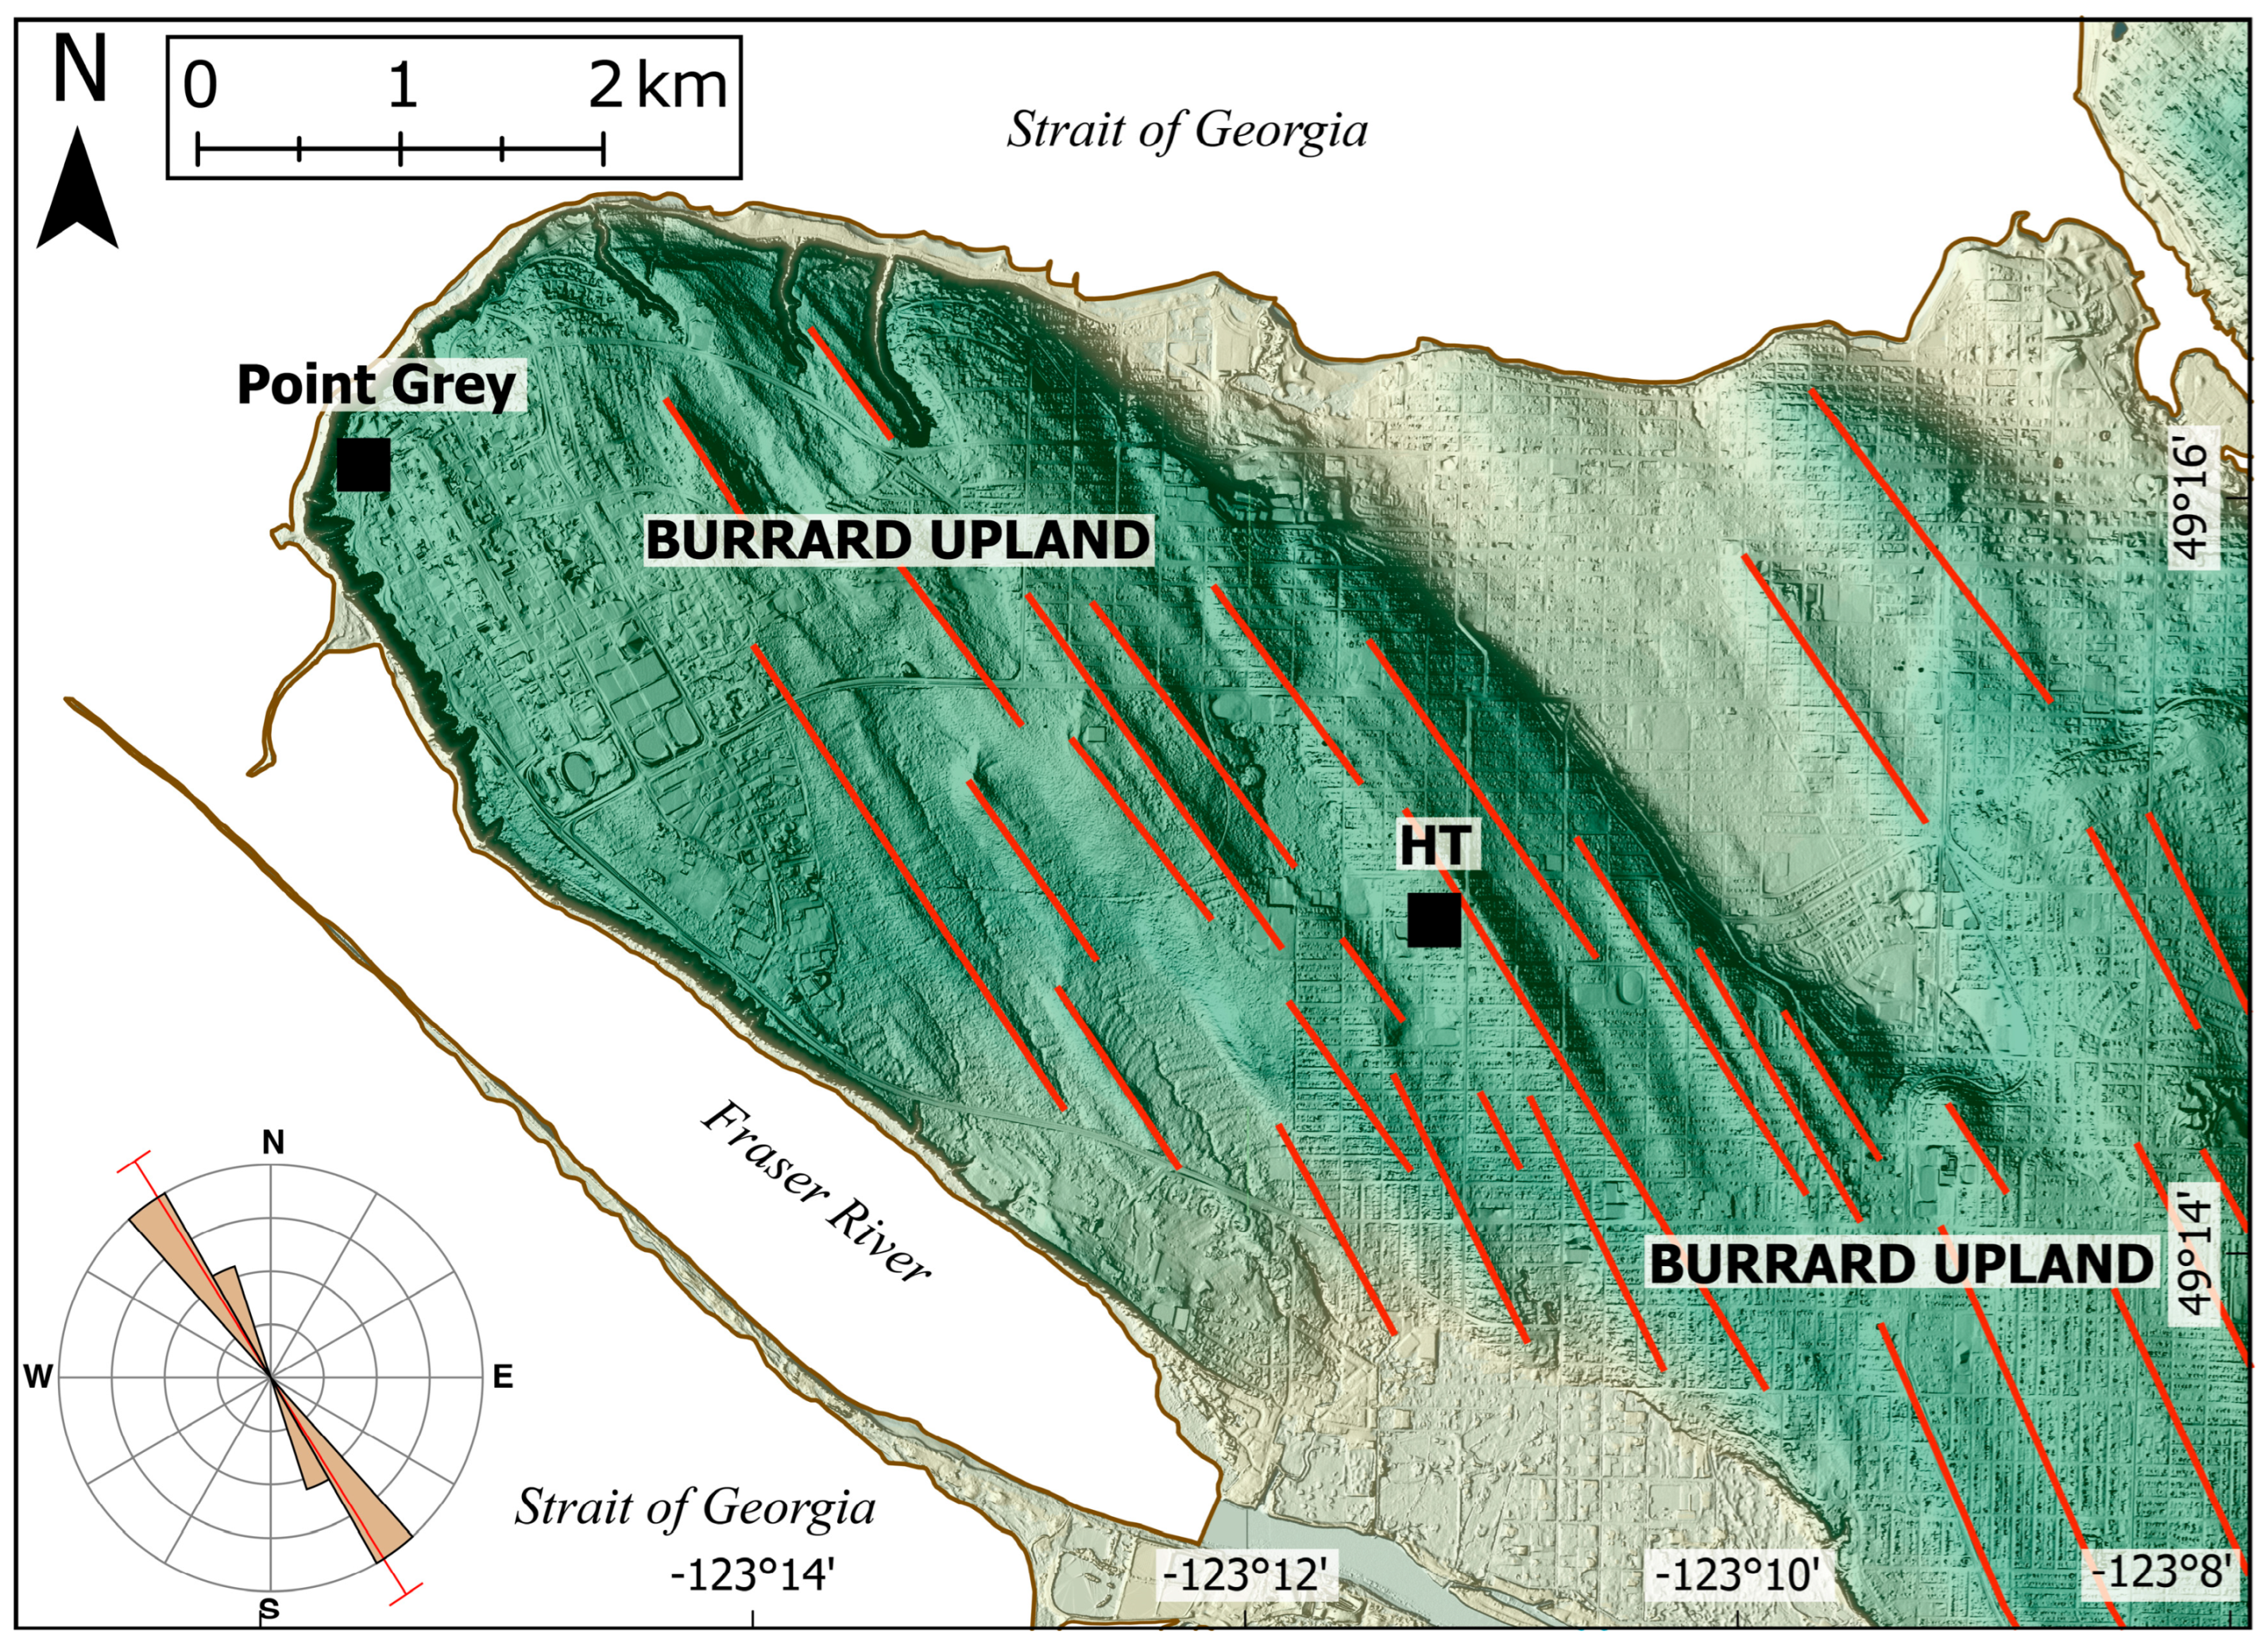
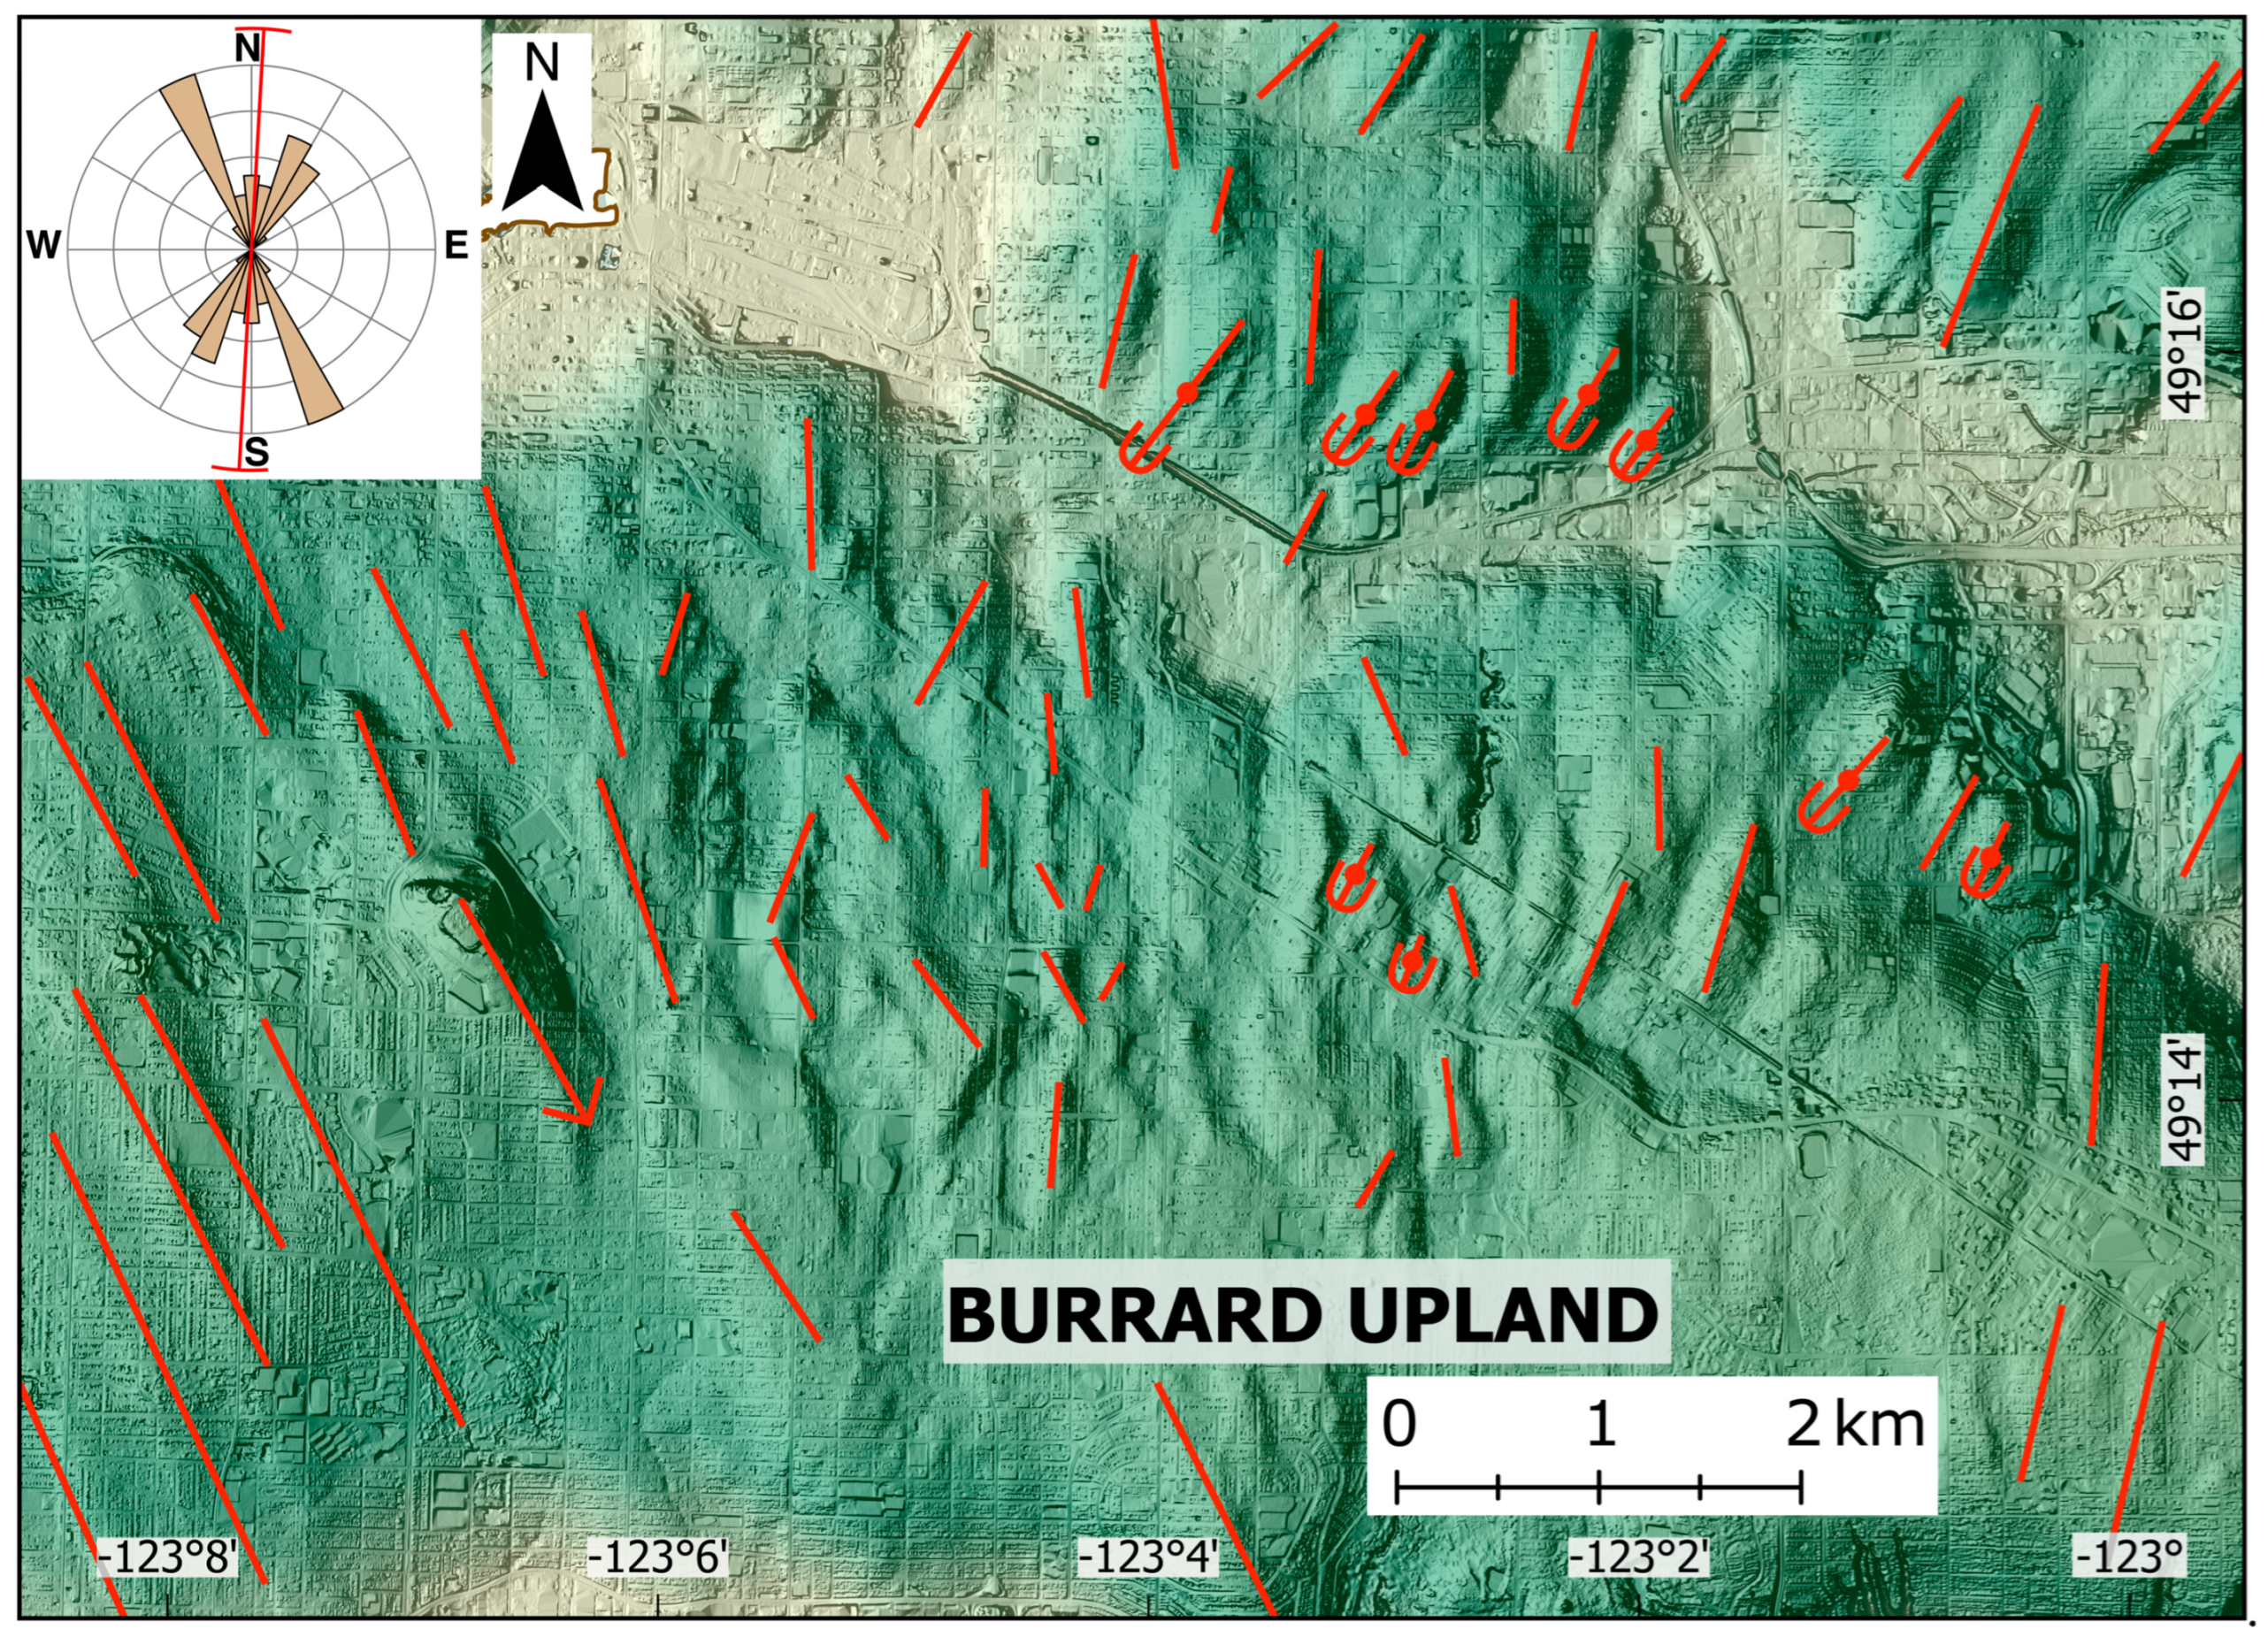
Flutings and drumlinoids indicate an almost uniform north–south to NNE–SSW direction of glacier flow out of Coast Mountain valleys north of the Burrard Inlet (Figure 2, Figure 4, Figure 5 and Figure 6). These ice-flow indicators are found on gentler slopes in till assigned to the Vashon stade [36]. They are, in places, crossed by meltwater channels and overprinted by glaciomarine shorelines and marine terraces (Figure 4 and Figure 5). Flutings are present on the sides of Mt. Fromme, Lynn Creek Valley, Mt. Seymour, and Coquitlam Mountain (Figure 2 and Figure 5). Southward flow is also documented north of Port Moody (Figure 6). There are deviations from the general southward ice-flow direction at the south end of Indian Arm, just northwest of the town of Deep Cove (Figure 5). Flutings there indicate southwestward flow, likely controlled by the northeast–southwest-trending axis of the Indian Arm.
Figure 4. Colorized Lidar image of the area south of Capilano Valley (cf. Figure 2). Areas east of Capilano River are overprinted by marine terraces and glaciomarine shorelines. Mapped streamlined bedforms indicate ice flow to the SSW. White areas represent open water. See Figure 2 for the legend.
Quaternary 08 00013 g004
Figure 5. Colorized Lidar image of the area near the mouth of Indian Arm. Glacial streamlined features that substantially deviate from the dominant NNW-SSE direction are visible north of Deep Cove. White areas represent open water. See Figure 2 for the legend.
Quaternary 08 00013 g005
Figure 6. Colorized Lidar image of the area around the City of Port Moody. Streamlined bedforms indicate that ice flowed out of the Indian Arm (Figure 2), partly through the topographic low containing Buntzen Lake. South and southwestward flow is further indicated by streamlined features on the Port Moody upland. White areas represent open water. See Figure 2 for the legend.
Quaternary 08 00013 g006
There are only a few ice-flow indicators west of Lynn Valley (Figure 2, Figure 4 and Figure 5). That area and the area at the mouth of Capilano Valley are heavily developed and covered by marine terraces and deltas [20,36]. The surface south of Cypress Mountain consists mostly of bare or till-veneered granitic rocks [36]. There, foliation, fractures, and faults, rather than ice-flow features, dominate the geomorphology (Figure 2).

4.2. Burrard Upland

The surface of the Burrard upland (Figure 7 and Figure 8) is underlain by Vashon till with a glaciomarine veneer [36]. There are two dominant ice-flow directions on this surface, one to the southeast on the western part of the upland (Figure 7) and a second to the southwest on the eastern part (Figure 8). The zone where they converge is located roughly between what is now Main Street and Clark Drive in Vancouver (Figure 8). This area contains several smaller ridges, some of which could not reliably be identified as linear glacial features and were thus not mapped. The orientation of the mapped features is chaotic, with directions ranging from SW to SE.
Figure 7. Colorized Lidar image of the Point Grey area on the Burrard upland. Streamlined features indicate a consistent SSE-directed ice flow. Black-filled squares mark sites mentioned in the discussion. White areas represent open water. HT = Highbury tunnel. See Figure 2 for the legend.
Quaternary 08 00013 g007
Figure 8. Colorized Lidar image of the central Burrard Upland area around Main Street in Vancouver, where there is convergence of SSW and SSE directed ice flow. The overall ice flow is southward. White areas represent open water. See Figure 2 for the legend.
Quaternary 08 00013 g008

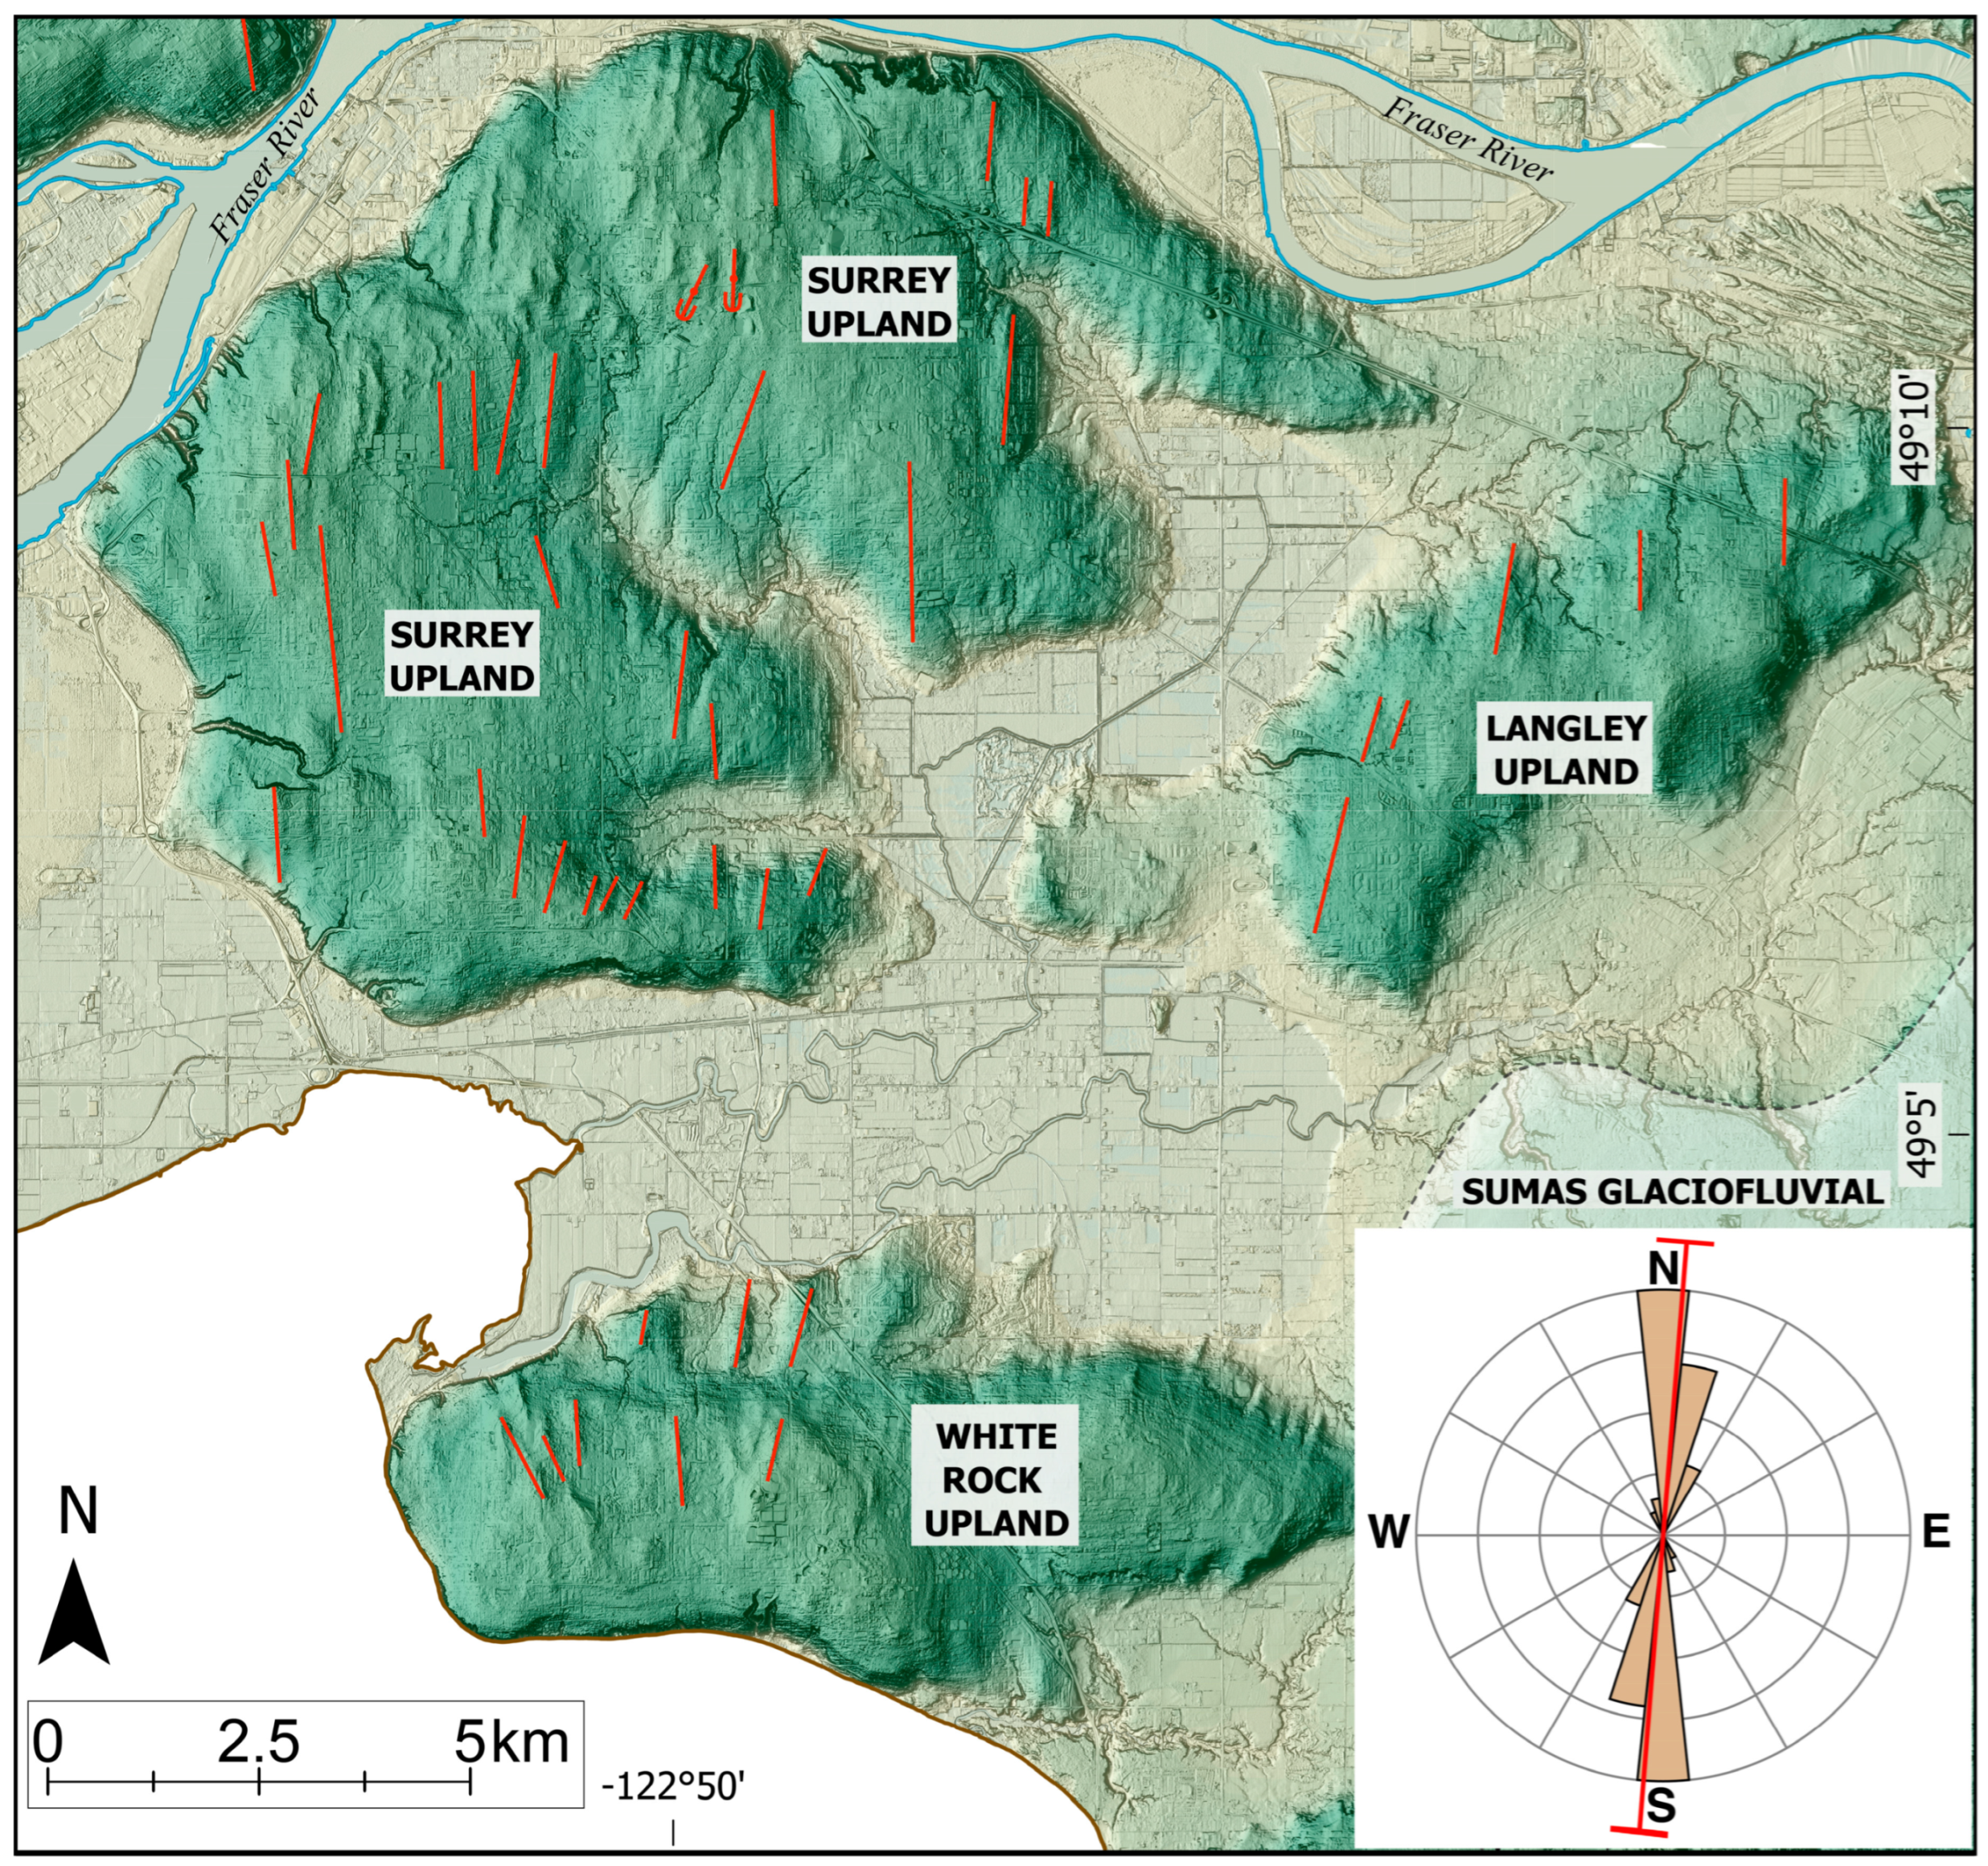
4.3. Surrey, Langley, and White Rock Uplands

Streamlined landforms are common on the Surrey, Langley, and White Rock uplands (Figure 9). They have an overall southerly orientation, with only small deviations towards the southeast on the Langley and White Rock uplands.
Figure 9. Colorized Lidar image of the Surrey, Langley, and White Rock uplands. The overall ice flow is southward. White areas represent open water. The transparent white layer in the southeast corner of the map indicates an area that is overprinted by Sumas stade glaciofluvial deposits. See Figure 2 for the legend.
Quaternary 08 00013 g009

4.4. Radiocarbon Ages

Three radiocarbon ages from the Lehigh gravel pit near Sechelt (western shore of the Strait of Georgia; Figure 1, Table 1, Supplementary Figures S1 and S2) range from 27.1 to 23.5 14C ka BP (31.2 to 27.4 cal ka BP). The youngest age is derived from a lodgepole pine cone (CIA 2019-4), the other sample (CIA 2019-1) is a tree branch. The Lehigh pit exploits a very large body of glacially streamlined sand and gravel, which we interpret as being deposited in a kame terrace setting at the mouth of Sechelt Inlet. This inlet is the southernmost part of a complex of fjords and inlets west of the Fraser Lowland that are incised into the southern Coast Mountains. The sediments were deposited between the glacier flowing southward in the Sechelt Inlet and a trunk glacier in the Strait of Georgia. Because the deposit extends up to 200 m a.s.l. at the mouth of the inlet, the kame terrace probably developed just inside the buttressing terminus of the trunk glacier in the Strait of Georgia. The deposit is capped by Vashon till and thus consistent with the three radiocarbon ages reported in Table 1.

5. Discussion

The Lidar dataset presented in this paper allows us to reconstruct ice flow in the western Fraser Lowland during the latest phase of the Vashon stade and, together with previously published research and a set of new radiocarbon ages, also provides insights into flow during the earlier Coquitlam stade of the Fraser Glaciation.

5.1. General Southward Flow and Deglaciation

Lidar imagery provides a picture of dominant SSE flow from the Strait of Georgia in the western portion of the Burrard upland, and SSW flow from the southern Coast Mountain valleys just north and south of the Burrard Inlet, resulting in an overall southward flow (Figure 2 and Figure 10D). This southward flow is best documented in the Surrey, White Rock, and Langley uplands in the southern part of our study area (Figure 9). No evidence for substantially different ice-flow directions was identified (Figure 2). This indicates that ice flow in the western Fraser Lowland during the Vashon stade was controlled by ice masses flowing down the Strait of Georgia, Howe Sound, and the Coast Mountain valleys (Figure 10D). Only south of Langley is evidence of some westward oriented features (Figure 2), but those are associated with post-Vashon readvances of eastern Fraser Lowland ice during the Sumas stade near the end of the Pleistocene [37], which are not the focus of this paper.
Evidence of extensive south-flowing Vashon ice raises doubt about the westward flow of piedmont ice blocking the southern Coast Mountain valley front during the early stade, as well as the sequential maximum stadial flow of Hicock and Lian [13]. Specifically, their westward-directed flow at the maximum of the Vashon stade is markedly different from the pattern that we see in the Lidar imagery, with ice flowing in SSE to SSW direction across the entire study area (Figure 2). Our data further imply that late Vashon ice dynamics in the study area were controlled principally by ice sources to the north rather than the east. Streamlined forms reflecting earlier, westward flow would have to have been completely reset by this southerly late Vashon flow, but there is no preserved evidence for this in the landscape.
A large-scale reorientation of westward ice flow across the Fraser Lowland into a southward flow should have left palimpsest landforms [40]: modified drumlinoid structures with evidence of the previous east–west flow. Such palimpsest landforms have been observed in other areas affected by the southwestern Cordilleran Ice Sheet. Haugerud [41], for example, documented the redirection of ice flow at several locations in Puget Sound from north–south to northeast–southwest or northwest–southeast. Comparable changes in ice-flow directions have also been observed in other glaciated landscapes, for example on the Wollaston Peninsula [42], in Alberta [43], and in northern Iceland [44]. Thus, if westward flow occurred during the maximum Vashon stade, some evidence preserving this pattern might be expected in the Fraser Lowland. Rather than such a large-scale reorientation, ice in the eastern Fraser Lowland may have been deflected south over the North Cascades in Washington State without affecting ice in the western Fraser Lowland [45] (Figure 10D). However, as there is a slight chance surging southward flow completely erased earlier westward flow, we suggest this as a further research topic.
Our data imply that late Vashon ice dynamics in the study area were controlled principally by ice sources to the north rather than the east. This indicates significant and likely rapid growth of glaciers in the southern Coast Mountains that dominated ice flow in the area and likely contributed to ice flowing further south into Puget Sound. As this advance occurred after the global LGM 26.5–19 ka; [46], when globally there was significant ice sheet retreat, it thus implies there was a significant change in precipitation patterns to allow this growth [47]. The Laurentide Ice Sheet retreat may have caused a shift of the winter Jet Stream further north, combined with a weakening of the glacial anticyclone, allowing winter storm tracks to bring more moisture to the southern Coast Mountains [17,48,49,50].

5.2. Implications for the Coquitlam Stade

Three new radiocarbon ages from the Lehigh gravel pit, within ice-proximal kame terrace or kame delta deposits and capped by Vashon recessional outwash sediments, near Sechelt (western shore of Strait of Georgia; Figure 1) range from 27.1 to 23.5 14C ka BP (31.3 to 27.4 cal ka BP). The significance of these ages is that they indicate an extensive cover of glaciers in the southern Coast Mountains and part of the Strait of Georgia already at about 30 cal ka BP. This ice margin was less than 40 km northwest of the Burrard upland (Figure 10A), several thousand years before the advance of Coquitlam stade ice blocked drainages in the southern Coast Mountains around 26 cal ka BP. The Sechelt ages are consistent with calibrated radiocarbon ages from proglacial sediments of the Quadra Sand unit at Point Grey, which range from 30.9 to 27.7 cal ka BP, and also suggest a relatively proximal ice margin triggering significant isostatic depression at around the same time [12].
These ages, indicating such a proximal ice margin, suggest that ice in the Strait of Georgia might have continued advancing to inundate Burrard Inlet and blocked the southern Coast Mountain valleys creating these ice-dammed lakes (Figure 10B) [10,13]. However, our Lidar data indicate that the single till unit at the top of the sea cliff at Point Grey [7,12] is most likely associated with the Vashon stade, as indicated by streamlined landforms that clearly indicate southeastward ice flow from the Strait of Georgia and Howe Sound onto the Burrard upland (Figure 7 and Figure 10D) (e.g., [4,15,22,51]). Other sites on the westernmost Fraser Lowland also have only a single (Vashon) till and that till is associated with southeastward ice flow during the late Vashon stade (e.g., Highbury tunnel, core FD87-1; Figure 2 and Figure 7; [9,52,53]).
If this till at Point Grey is solely a Vashon stade deposit, it is possible that the nearby ice margin just ca. 40 km northwest of the Burrard upland might not have advanced onto the western Fraser Lowland during the Coquitlam stade (Figure 10B). In this scenario, ice from one of the larger southern Coast Mountain valleys must have blocked the mouths of the smaller valleys. More likely, however, the ice margin in the Strait of Georgia advanced and did not retreat from the Burrard upland during the Port Moody interstade, unlike several valleys of the southern Coast Mountains and the Port Moody area (Figure 10C). Those areas were ice free, as indicated by the deposition of the Sisters Creek Formation interstade deposits, which comprise subaerial organic-rich sediments as well as non-organic silt, sand, and gravel [16,24]. In any case, robust chronological data and/or provenance studies on the till at Point Grey are needed to unambiguously resolve how far the ice in the Strait of Georgia advanced towards the south into the Fraser Lowland during the Coquitlam stade.

6. Conclusions

Lidar imagery has proven a powerful tool to identify previously unrecognized glacial landforms in a heavily urbanized and vegetated area. The data complements numerous studies that were conducted on local exposures and sediment cores in the Fraser Lowland. These data reveal an overall south-directed ice flow in the western Fraser Lowland during the latest stage of the Fraser glaciation. Ice flow out of the southern Coast Mountain valleys is to the SSW. In the western part of the study area streamlined bedforms indicate ice flow from the Strait of Georgia in the SSE direction, combining into an overall southward flow further south, as evident by ice-flow indicators in the Surrey, White Rock, and Langley uplands.
No landforms could be identified that show a significant deviation from the mapped dominant ice-flow directions. If there was a substantially different general ice-flow direction in the western Fraser Lowland, palimpsest landforms would be expected. However, it cannot be excluded that ice flow during the late Vashon stade erased those landforms.
Three radiocarbon ages from the Lehigh gravel pit near Sechelt in the Strait of Georgia ca. 40 km northwest of the Burrard upland support a proximal ice margin already around ca. 30 cal ka BP, corroborating radiocarbon ages from the proglacial outwash Quadra Sand deposits at the Point Grey site on the Burrard upland. Although the ages indicate a proximal ice margin well before the Coquitlam stade ice advance, it remains unclear if the ice advanced onto the Burrard upland. Lidar data indicate that the single till erosively overlying the Quadra Sand at Point Grey is related to the Vashon stade. If this area was covered by ice during the Coquitlam stade, one would expect a second till unit, unless the ice remained in that area during the Port Moody interstade. However, based on the available data, the position of the ice margin during the Coquitlam stade cannot be reconstructed with certainty. Further studies are needed to resolve this question.

Supplementary Materials

The following supporting information can be downloaded at: https://www.mdpi.com/article/10.3390/quat8010013/s1, Figure S1: Satellite image of the area around Sechelt.; Figure S2: Lidar image of the area around Sechelt.; Figure S3: Examined section in Lehigh gravel pit.; Figure S4: Colorized Lidar image of the western Fraser Lowland without annotations.

Author Contributions

Conceptualization, R.G., K.F., B.W. and J.J.C.; Investigation, R.G., K.F., B.W. and J.J.C.; Resources, B.W. and J.J.C.; Data Curation, K.F.; Writing—Original Draft Preparation, R.G.; Writing—Review and Editing, R.G., K.F., B.W. and J.J.C.; Visualization, R.G. and K.F. All authors have read and agreed to the published version of the manuscript.

Funding

Funding for R.G. was provided by the German Research Foundation (DFG grant no. GR 5663/1-1). Funding for B.W. and K.F. was provided by the NSERC Discovery Grant (R611719).

Institutional Review Board Statement

Not applicable.

Informed Consent Statement

Not applicable.

Data Availability Statement

Data is contained within the article.

Acknowledgments

We thank Tom Millard (BC’s Ministry of Forests, Lands, Natural Resource Operations and Rural Development) for initially providing the Lidar data. We are grateful to the two anonymous reviewers who significantly helped to improve the manuscript.

Conflicts of Interest

The authors declare no conflicts of interest.

References

  1. Johnson, M.D.; Fredin, O.; Ojala, A.E.K.; Peterson, G. Unraveling Scandinavian geomorphology: The LiDAR revolution. GFF 2015, 137, 245–251. [Google Scholar] [CrossRef]
  2. Smith, M.J.; Rose, J.; Booth, S. Geomorphological mapping of glacial landforms from remotely sensed data: An evaluation of the principal data sources and an assessment of their quality. Geomorphology 2006, 76, 148–165. [Google Scholar] [CrossRef]
  3. Putkinen, N.; Eyles, N.; Putkinen, S.; Ojala, A.E.K.; Palmu, J.-P.; Sarala, P.; Väänänen, T.; Räisänen, J.; Saarelainen, J.; Ahtonen, N.; et al. High-resolution LiDAR mapping of glacial landforms and ice stream lobes in Finland. Bull. Geol. Soc. Finl. 2017, 89, 64–81. [Google Scholar] [CrossRef]
  4. Clague, J.J.; Ward, B. Chapter 44—Pleistocene Glaciation of British Columbia. In Developments in Quaternary Sciences; Ehlers, J., Gibbard, P.L., Hughes, P.D., Eds.; Elsevier: Amsterdam, The Netherlands, 2011; Volume 15, pp. 563–573. [Google Scholar]
  5. Blaise, B.; Clague, J.J.; Mathewes, R.W. Time of maximum Late Wisconsin glaciation, West Coast of Canada. Quat. Res. 1990, 34, 282–295. [Google Scholar] [CrossRef]
  6. Clague, J.J.; James, T.S. History and isostatic effects of the last ice sheet in southern British Columbia. Quat. Sci. Rev. 2002, 21, 71–87. [Google Scholar] [CrossRef]
  7. Ryder, J.; Fulton, R.; Clague, J. The Cordilleran Ice Sheet and the glacial geomorphology of southern and central British Colombia. Géographie Phys. Quat. 1991, 45, 365–377. [Google Scholar] [CrossRef]
  8. Booth, D.B.; Troost, K.G.; Clague, J.J.; Waitt, R.B. The Cordilleran Ice Sheet. Dev. Quat. Sci. 2003, 1, 17–43. [Google Scholar] [CrossRef]
  9. Armstrong, J.E. Environmental and engineering applications of the surficial geology of the Fraser Lowland, British Columbia. Geol. Surv. Can. Pap. 1984, 83, 54. [Google Scholar] [CrossRef]
  10. Hicock, S.R.; Armstrong, J.E. Coquitlam Drift: A pre-Vashon Fraser glacial formation in the Fraser Lowland, British Columbia. Can. J. Earth Sci. 1981, 18, 1443–1451. [Google Scholar] [CrossRef]
  11. Hicock, S.R.; Hebda, R.J.; Armstrong, J.E. Lag of the Fraser glacial maximum in the Pacific Northwest: Pollen and macrofossil evidence from western Fraser Lowland, British Columbia. Can. J. Earth Sci. 1982, 19, 2288–2296. [Google Scholar] [CrossRef]
  12. Clague, J.J.; Froese, D.; Hutchinson, I.; James, T.S.; Simon, K.M. Early growth of the last Cordilleran ice sheet deduced from glacio-isostatic depression in southwest British Columbia, Canada. Quat. Res. 2005, 63, 53–59. [Google Scholar] [CrossRef]
  13. Hicock, S.R.; Lian, O.B. Cordilleran Ice Sheet lobal interactions and glaciotectonic superposition through stadial maxima along a mountain front in southwestern British Columbia, Canada. Boreas 1999, 28, 531–542. [Google Scholar] [CrossRef]
  14. Lian, O.B.; Hickin, E.J. Late Pleistocene stratigraphy and chronology of lower Seymour Valley, southwestern British Columbia. Can. J. Earth Sci. 1993, 30, 841–850. [Google Scholar] [CrossRef]
  15. Lian, O.B.; Hicock, S.R. Insight into the character of palaeo-ice-flow in upland regions of mountain valleys during the last major advance (Vashon Stade) of the Cordilleran Ice Sheet, southwest British Columbia, Canada. Boreas 2010, 39, 171–186. [Google Scholar] [CrossRef]
  16. Hicock, S.R.; Lian, O.B. The Sisters Creek Formation: Pleistocene sediments representing a nonglacial interval in southwestern British Columbia at about 18 ka. Can. J. Earth Sci. 1995, 32, 758–767. [Google Scholar] [CrossRef]
  17. Jackson, L.E.; Ward, B.C.; Hicock, S.R.; Gromig, R.; Clague, J.J.; Turner, D.G. New insights into the glacial and relative sea-level history of the western Fraser Lowland based on sediment cores from geotechnical drilling for the Evergreen Tunnel, British Columbia, Canada. Quat. Res. 2024, 122, 40–61. [Google Scholar] [CrossRef]
  18. Ward, B.C.; Thomson, B. Late Pleistocene stratigraphy and chronology of lower Chehalis River valley, southwestern British Columbia: Evidence for a restricted Coquitlam Stade. Can. J. Earth Sci. 2004, 41, 881–895. [Google Scholar] [CrossRef]
  19. Thorson, R.M. Ice-Sheet glaciation of the Puget Lowland, Washington, during the Vashon Stade (Late Pleistocene). Quat. Res. 1980, 13, 303–321. [Google Scholar] [CrossRef]
  20. Kovanen, D.; Slaymaker, O. The paraglacial geomorphology of the Fraser Lowland, southwest British Columbia and northwest Washington. Geomorphology 2015, 232, 78–93. [Google Scholar] [CrossRef]
  21. Porter, S.C.; Swanson, T.W. Radiocarbon Age Constraints on Rates of Advance and Retreat of the Puget Lobe of the Cordilleran Ice Sheet during the Last Glaciation. Quat. Res. 1998, 50, 205–213. [Google Scholar] [CrossRef]
  22. Hicock, S.R.; Armstrong, J.E. Vashon Drift: Definition of the formation in the Georgia Depression, southwest British Columbia. Can. J. Earth Sci. 1985, 22, 748–757. [Google Scholar] [CrossRef]
  23. McKenzie, M.A.; Miller, L.E.; Lepp, A.P.; DeWitt, R. Spatial variability of marine-terminating ice sheet retreat in the Puget Lowland. Clim. Past 2024, 20, 891–908. [Google Scholar] [CrossRef]
  24. Lian, O.B.; Mathewes, R.W.; Hicock, S.R. Palaeoenvironmental reconstruction of the Port Moody Interstade, a nonglacial interval in southwestern British Columbia at about 18 000 14C years BP. Can. J. Earth Sci. 2001, 38, 943–952. [Google Scholar] [CrossRef]
  25. Bustin, A.M.M.; Clowes, R.M.; Monger, J.W.H.; Journeay, J.M. The southern Coast Mountains, British Columbia: New interpretations from geological, seismic reflection, and gravity data. Can. J. Earth Sci. 2013, 50, 1033–1050. [Google Scholar] [CrossRef]
  26. Roddick, J.A.; Price, R.A.; Heywood, W. Vancouver North, Coquitlam, and Pitt Lake Map-areas, British Columbia: With Special Emphasis on the Evolution of the Plutonic Rocks. Geol. Surv. Can. Mem. 1965, 335, 276. [Google Scholar]
  27. Clague, J.J.; Luternauer, J.L.; Hebda, R.J. Sedimentary environments and postglacial history of the Fraser Delta and lower Fraser Valley, British Columbia. Can. J. Earth Sci. 1983, 20, 1314–1326. [Google Scholar] [CrossRef]
  28. McKenzie, M.A.; Simkins, L.M.; Principato, S.M.; Munevar Garcia, S. Streamlined subglacial bedform sensitivity to bed characteristics across the deglaciated Northern Hemisphere. Earth Surf. Process. Landf. 2022, 47, 2341–2356. [Google Scholar] [CrossRef]
  29. Schoof, C.G.; Clarke, G.K.C. A model for spiral flows in basal ice and the formation of subglacial flutes based on a Reiner-Rivlin rheology for glacial ice. J. Geophys. Res. Solid Earth 2008, 113, B05204. [Google Scholar] [CrossRef]
  30. Syverson, K.M. The ability of ice-flow indicators to record complex, historic deglaciation events, Burroughs Glacier, Alaska. Boreas 1995, 24, 232–244. [Google Scholar] [CrossRef]
  31. Benn, D.I.; Evans, D.J.A. Glaciers and Glaciation, 2nd ed.; Hodder Education: London, UK, 2010; p. 802. [Google Scholar]
  32. Clark, C.D.; Hughes, A.L.C.; Greenwood, S.L.; Spagnolo, M.; Ng, F.S.L. Size and shape characteristics of drumlins, derived from a large sample, and associated scaling laws. Quat. Sci. Rev. 2009, 28, 677–692. [Google Scholar] [CrossRef]
  33. Spagnolo, M.; Clark, C.D.; Hughes, A.L.C.; Dunlop, P.; Stokes, C.R. The planar shape of drumlins. Sediment. Geol. 2010, 232, 119–129. [Google Scholar] [CrossRef]
  34. Spagnolo, M.; Clark, C.D.; Hughes, A.L.C.; Dunlop, P. The topography of drumlins; assessing their long profile shape. Earth Surf. Process. Landf. 2011, 36, 790–804. [Google Scholar] [CrossRef]
  35. Gordon, J.E.; Brian Whalley, W.; Gellatly, A.F.; Vere, D.M. The formation of glacial flutes: Assessment of models with evidence from Lyngsdalen, North Norway. Quat. Sci. Rev. 1992, 11, 709–731. [Google Scholar] [CrossRef]
  36. Armstrong, J.E.; Hicock, S.R. Surficial geology, Vancouver, British Columbia. Geological Survey of Canada, Map 1486A, Scale 1:50,000; 1979. Available online: https://ostrnrcan-dostrncan.canada.ca/entities/publication/67e8a376-fce2-4c02-bb67-c30b2fdef80d (accessed on 3 July 2024).
  37. Armstrong, J.E.; Hicock, S.R. Surficial geology, New Westminster, west of sixth meridian, British Columbia. Geological Survey of Canada, “A” Series Map 1484A, Scale 1:50,000; 1980. Available online: https://ostrnrcan-dostrncan.canada.ca/handle/1845/112051 (accessed on 3 July 2024).
  38. Polach, H.A.; Stuiver, M. Discussion reporting of 14C data. Radiocarbon 1977, 19, 355–363. [Google Scholar] [CrossRef]
  39. Reimer, P.J.; Austin, W.E.N.; Bard, E.; Bayliss, A.; Blackwell, P.G.; Bronk Ramsey, C.; Butzin, M.; Cheng, H.; Edwards, R.L.; Friedrich, M.; et al. The IntCal20 Northern Hemisphere radiocarbon age calibration curve (0–55 cal kBP). Radiocarbon 2020, 62, 725–757. [Google Scholar] [CrossRef]
  40. Clark, C.D. Mega-scale glacial lineations and cross-cutting ice-flow landforms. Earth Surf. Process. Landf. 1993, 18, 1–29. [Google Scholar] [CrossRef]
  41. Haugerud, R.A. Deglaciation of the Puget Lowland, Washington. In Untangling the Quaternary Period—A Legacy of Stephen C. Porter; Waitt, R.B., Thackray, G.D., Gillespie, A.R., Eds.; Geological Society of America: Boulder, CO, USA, 2021; Volume 548, pp. 279–298. [Google Scholar]
  42. Stokes, C.R.; Clark, C.D.; Winsborrow, M.C.M. Subglacial bedform evidence for a major palaeo-ice stream and its retreat phases in Amundsen Gulf, Canadian Arctic Archipelago. J. Quat. Sci. 2006, 21, 399–412. [Google Scholar] [CrossRef]
  43. Evans, D.J.A.; Atkinson, N.; Phillips, E. Glacial geomorphology of the Neutral Hills Uplands, southeast Alberta, Canada: The process-form imprints of dynamic ice streams and surging ice lobes. Geomorphology 2020, 350, 106910. [Google Scholar] [CrossRef]
  44. Benediktsson, Í.Ö.; Aradóttir, N.; Ingólfsson, Ó.; Brynjólfsson, S. Cross-cutting palaeo-ice streams in NE-Iceland reveal shifting Iceland Ice Sheet dynamics. Geomorphology 2022, 396, 108009. [Google Scholar] [CrossRef]
  45. Riedel, J.L.; Clague, J.J.; Ward, B.C. Timing and extent of early marine oxygen isotope stage 2 alpine glaciation in Skagit Valley, Washington. Quat. Res. 2010, 73, 313–323. [Google Scholar] [CrossRef]
  46. Clark, P.U.; Dyke, A.S.; Shakun, J.D.; Carlson, A.E.; Clark, J.; Wohlfarth, B.; Mitrovica, J.X.; Hostetler, S.W.; McCabe, A.M. The Last Glacial Maximum. Science 2009, 325, 710–714. [Google Scholar] [CrossRef] [PubMed]
  47. Palacios, D.; Stokes, C.R.; Phillips, F.M.; Clague, J.J.; Alcalá-Reygosa, J.; Andrés, N.; Angel, I.; Blard, P.-H.; Briner, J.P.; Hall, B.L.; et al. The deglaciation of the Americas during the Last Glacial Termination. Earth-Sci. Rev. 2020, 203, 103113. [Google Scholar] [CrossRef]
  48. Gavin, D.G.; Brubaker, L.B. Postglacial Climate on the Olympic Peninsula. In Late Pleistocene and Holocene Environmental Change on the Olympic Peninsula, Washington; Gavin, D.G., Brubaker, L.B., Eds.; Springer International Publishing: Cham, Switzerland, 2015; pp. 51–60. [Google Scholar]
  49. Bartlein, P.J.; Anderson, K.H.; Anderson, P.M.; Edwards, M.E.; Mock, C.J.; Thompson, R.S.; Webb, R.S.; Webb Iii, T.; Whitlock, C. Paleoclimate simulations for North America over the past 21,000 years: Features of the simulated climate and comparisons with paleoenvironmental data. Quat. Sci. Rev. 1998, 17, 549–585. [Google Scholar] [CrossRef]
  50. Munroe, J.S.; Laabs, B.J.C. Temporal correspondence between pluvial lake highstands in the southwestern US and Heinrich Event 1. J. Quat. Sci. 2013, 28, 49–58. [Google Scholar] [CrossRef]
  51. Barrie, J.; Conway, K. A preliminary interpretation of surficial marine geology of central and northern Strait of Georgia, British Columbia. Geol. Surv. Can. Curr. Res. 2000, 2000-A21, 1–7. [Google Scholar]
  52. Luternauer, J.L.; Clague, J.J.; Feeney, T.D. A 367 m core from south western Fraser River delta, British Columbia. In Current Research, Part E, Geological Survey of Canada Paper 91; Geological Survey of Canada: Ottawa, ON, Canada, 1991; pp. 127–134. [Google Scholar]
  53. Clague, J.J.; Luternauer, J.L.; Monahan, P.A.; Edwardson, K.A.; Dallimore, S.R.; Hunter, J.A. Quaternary stratigraphy and evolution of the Fraser delta. Geol. Surv. Can. Bull. 1998, 525, 57–90. [Google Scholar]
Figure 1. Colorized DEM of the study area in southwest British Columbia, Canada, showing the sites mentioned in the text, and the location and extent of the Garibaldi volcanic field. The red dashed rectangle outlines the area shown in Figure 2. Cap V. = Capilano Valley; Lynn V. = Lynn Valley; Seymour V. = Seymour Valley; Coquitlam V. = Coquitlam Valley; W-V = West Vancouver; N-V = North Vancouver; PG = Point Grey; SC = Sisters Creek; MH = Mary Hill; LGP = Lehigh gravel pit. Major watersheds are outlined in blue.
Quaternary 08 00013 g001
Figure 10. Conceptual model of assumed major ice-flow directions at different stages of the Fraser glaciation. Red arrows depict inferred ice flow. Solid red lines showcase the minimum ice margin. Dashed red lines indicate maximum ice margin positions as discussed in Section 5.1 and Section 5.2. (A) Pre-Coquitlam stade: ice margin in the Strait of Georgia situated at least as far south as the Lehigh gravel pit, somewhere between Sechelt and Point Grey (Figure 1). (B) Coquitlam stade: ice blocking the mouths of the southern Coast Mountain valleys during early Coquitlam stade either from the west or the east (indicated by dashed arrows), creating ice-dammed lakes (highlighted in dark blue). Position of the ice margin in the Strait of Georgia is unknown but may have covered the Burrard upland. (C) Port Moody interstade: mouths of southern Coast Mountain valleys and Port Moody/Coquitlam area are ice free; deposition of Sisters Creek Formation. Burrard upland is possibly covered by ice. (D) Late Vashon stade: major SSE directed ice flow down the Strait of Georgia, out of Howe Sound, and over parts of the Burrard upland. Ice flow from southern Coast Mountain valleys is SSW. Ice flow in the western Fraser Lowland principally to the south. Ice from the eastern Fraser Lowland likely deflected south and southwestward.
Quaternary 08 00013 g010
Table 1. Radiocarbon ages from Lehigh gravel pit in Sechelt (see Figure 1 for location).
Sample no.UCIAMS 1
no.
Dated
Material
Sample LocationFraction
Modern
D1 4C
14 C Age 2
Error
Cal. Age Range
(yr BP) 3
Lat. (W) Long (W)
CIA 2019-1 4 233906Wood49.29.2° 123.43.9°0.0345−965.527,05013031,005–31,295
CIA 2019-4 5 233907Cone49.29.2° 123.43.9°0.0536−946.423,50015027,355–27,867
CIA 2019-4 233908Cone49.29.2° 123.43.9°0.0352−964.826,89014030,904–31,208
1 University of California Keck Carbon Cycle AMS Facility. 2 1σ age range. 3 2σ age range. 4 Outer several rings. 5 0.040 mg C.
Disclaimer/Publisher’s Note: The statements, opinions and data contained in all publications are solely those of the individual author(s) and contributor(s) and not of MDPI and/or the editor(s). MDPI and/or the editor(s) disclaim responsibility for any injury to people or property resulting from any ideas, methods, instructions or products referred to in the content.

