Article

Late Pleistocene to Holocene Palaeohydrological History of the Thermal-Spring-Fed Lake Pețea (NW Romania) Revealed by Radiocarbon Dating and Complex Sedimentological Investigations

Department of Geology and Paleontology, University of Szeged, H-6722 Szeged, Hungary
*
Author to whom correspondence should be addressed.
Quaternary 2023, 6(2), 37; https://doi.org/10.3390/quat6020037
Submission received: 29 March 2023 / Revised: 31 May 2023 / Accepted: 2 June 2023 / Published: 12 June 2023
(This article belongs to the Special Issue Climate Change and Reconstruction of the Palaeoecological Changes)

Abstract

:
Understanding sedimentation processes in response to past hydrogeological and climatic changes and capturing millennial-scale variations is a key focus of lacustrine paleoenvironmental research. This study presents the first high-resolution chronology and sedimentary data for the small thermal-spring-fed Lake Pețea, NW Romania, and unravels the evolutionary history of the lake harboring a unique endemic fauna. Its small size and single source of water make it particularly sensitive to hydrological changes. In the recent past, over-exploitation of the thermal water has led to the complete drying up of the lake and the extinction of its fauna. Nevertheless, past spatio-temporal variation of environmental factors, in particular the fluctuation of lake levels and water temperature, must have had a significant impact on the survival and evolution of the endemic mollusk fauna. This fact makes this study particularly important. Based on our results, a three-stage sedimentary evolution occurred, mainly controlled by major climate-driven hydrological changes also seen in regional records, i.e., 17.5–14.5 ka shallow eutrophic lake, 14.5–5.5 ka oligotrophic carbonate-rich lake, and 5.5–0.5 ka shallow eutrophic lake. A major lowstand at 11.7–10.2 ka due to drier climate was followed by progressively rising water levels up to 5 ka followed by a drop. The main control on lake level fluctuations and sedimentary phases was the varying input of thermal water due to recurring increased/decreased recharge of the underground shallow karst water system. The driving factor of thermal water discharge was different during the Late Glacial than the Holocene. It was the warming of the climate at 14.5 ka cal BP and melting of regional ice sheets in addition to increased precipitation that created an oligotrophic lake by recharging the underground thermal water system. Conversely, during the Holocene, increasing/decreasing moisture availability driven by major climate forcings was in control of thermal water recharge, erosion, and fluctuating lake levels.

1. Introduction

Lake Peţea (LP), located in NW Romania, harbors a unique endemic warm-water biota whose origin dates to the terminal part of the last ice age [1,2,3,4,5]. It is the only European habitat of the Egyptian white-water lily (Nymphaea lotus thermalis) and the only location where the endemic thermal rudd (Scardinius racovitzai Müller, 1958) and the melanopsid gastropod Microcolpia parreyssii (Philippi, 1847) existed until 2014 [1,2,3,4,5,6,7,8,9,10,11,12,13]. As the lake is relatively shallow and small, having a depth of 2–3 m and a surficial area of a couple of hundred square meters [11,12,14,15,16,17,18], it is highly prone to natural and artificial environmental, climatic, and hydrogeological changes. Minor fluctuations in depth, water coverage, water temperature, chemistry, nutrient supply, and substrate conditions have a significant impact on the biota [15,16,17,18,19]. Up to 2012, the lake underwent a significant reduction in both water level and surface area attributable to a drop in discharge of thermal springs due to thermal water overexploitation causing an exponential decline in populations of the endemic biota [15,16,17,18,19,20]. In response, the Ţării Crişurilor Museum moved some specimens of the endemic fish and gastropods to fish tanks in a desperate attempt for potential repopulation. The unique warm-water biota, however, went extinct when the water disappeared from the lake in 2014, and funding ceased to maintain the last remaining specimens in aquaria [15,16]. The lacustrine sediments can provide us with key information on past processes controlling endemic evolution [1,2,3,4,5,6,7,8,9,10,13,21]. Previous studies presented a cross-section of the lake [22] and maps [6,9] implying that the lake covered larger areas in relatively recent historical times.
Over the past decades, many studies have attempted to decipher the general sedimentary history of the lake based on the observed stratigraphy complemented by comprehensive mollusk-based palaeoecological data [2,3,4,5]. These studies concluded that the lake’s evolution covers three major phases: oligotrophic shallow pond and thermal rivulet, oligo-mesotrophic pond, and highly eutrophic thermal pond. In addition to the constant presence of thermal water gastropods, additional elements of the malacofauna hinted at recurring periods of intense water level and temperature fluctuations in the past [3,4,5]. The mentioned studies dated the beginning of the lake’s evolution to the final parts of the last glacial and the appearance of the melanopsid gastropod Microcolpia parreyssii (Philippi, 1847) to the Pleistocene/Holocene boundary [2,5].
In the thermal-spring-fed Lake Pețea, high-resolution chronostratigraphy complemented by comprehensive sedimentological data is still limited, which hinders the detailed interpretation of sedimentary history. Reliable chronological constraints are essential to interpreting the depositional successions in the lacustrine system, deciphering millennial-scale fluctuations in the lake level, and analyzing the morphospace changes of endemic Microcolpia gastropods. Thus, the primary goals of this study were (1) to establish a detailed chronology for the lacustrine deposits of thermal-spring-fed Lake Pețea, (2) to test if members of the aquatic gastropod Planorbis planorbis chosen partly for 14C dating yield ages concordant with those of closely associated macro-botanical remains, (3) to highlight the evolution of the lacustrine system aided by newly derived information on the sedimentary records complemented by available mollusk-based palaeoecological evidence from previous studies of Sümegi et al. [3,4,5], and (4) to unveil factors that controlled lacustrine sedimentation via comparison with other regional paleoclimate and palaeohydrological records.

2. Materials and Methods
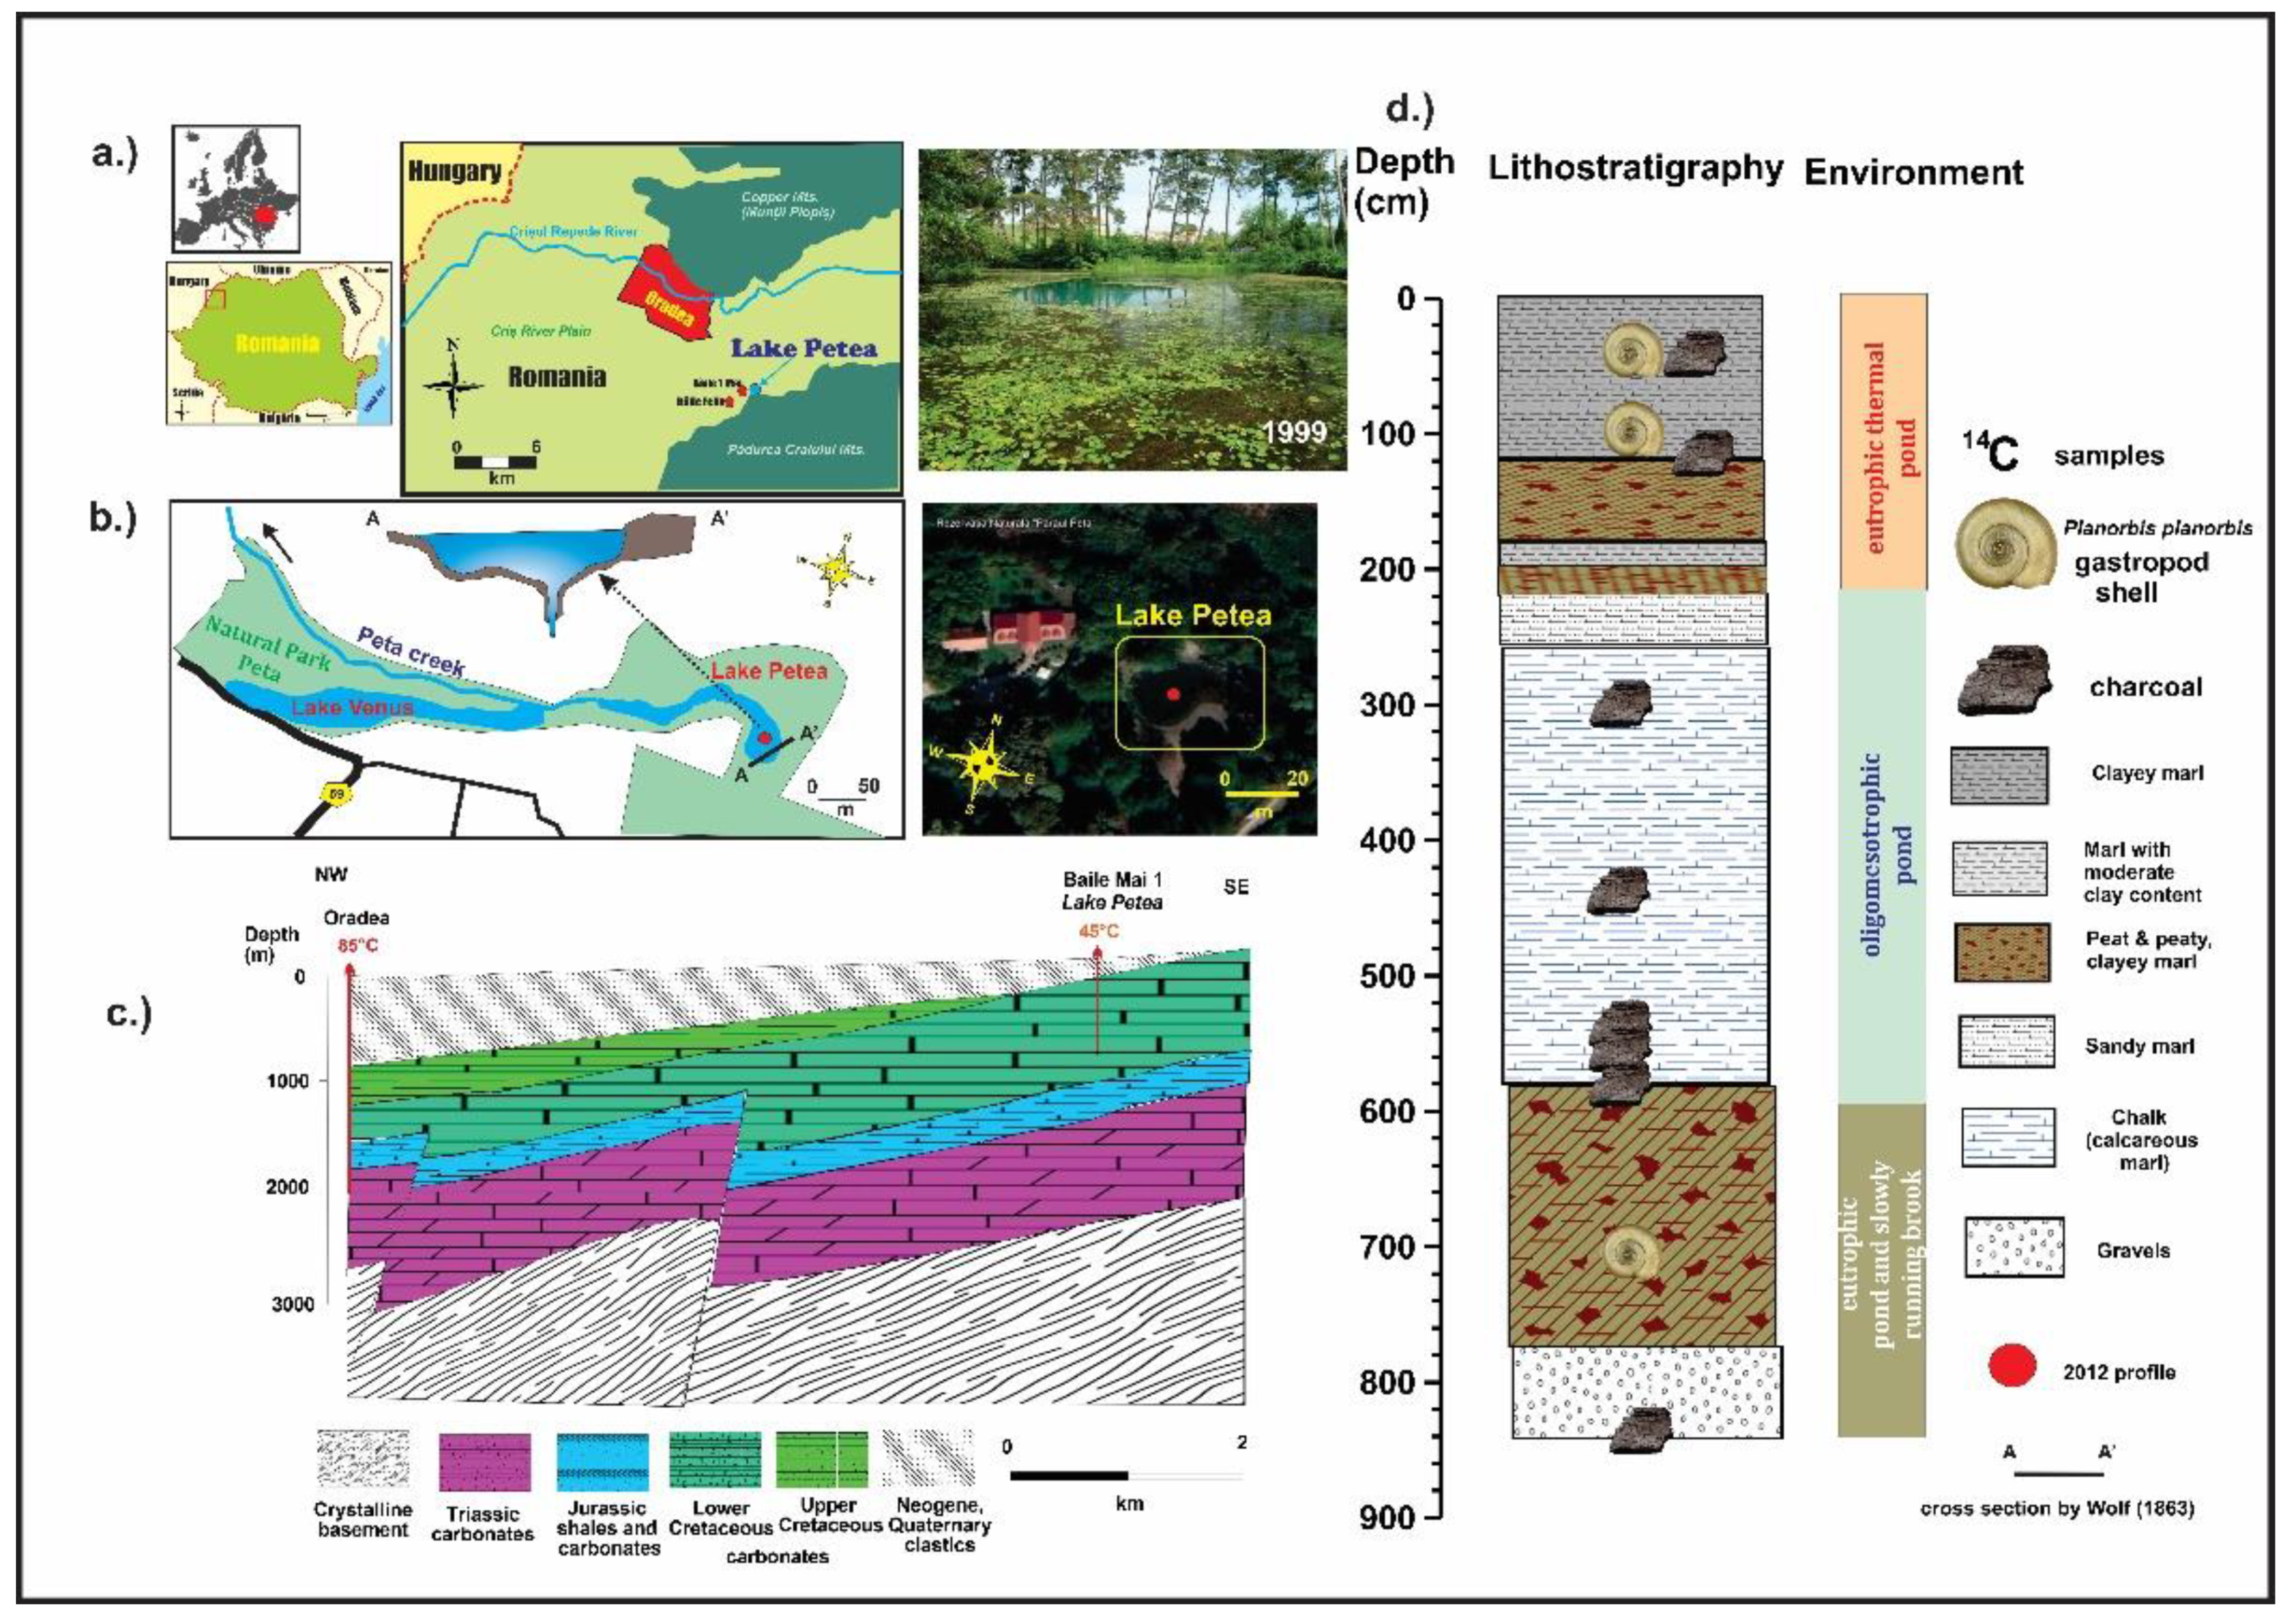
2.1. Study Area

Lake Pețea is in Băile 1 Mai (German: Bischofsbad, Hungarian: Püspökfürdő) approximately 9 km to the southeast of the city of Oradea at the foot of the Somló Hill, which is part of the foothill area of the Pădurea Crauilui Mts. (46°59′51.0″ N 22°00′11.4″ E, an elevation of 140 m ASL) (Figure 1). Locally, it is drained by the Peța rivulet charging into the Crișul Repede river in Oradea. The bicarbonate-, calcium-, and sulfate-rich waters of the lake are maintained by underwater thermal springs. Figure 1c depicts the bedrock geology of the area and the source of aquifer systems [23]. The Triassic aquifer system near Oradea is made up of limestones and dolomites with an average thickness of 800 m producing water with wellhead temperatures of 85–90 °C. The Lower Cretaceous aquifer system developed near Băile Mai 1 yields warmer waters with wellhead temperatures of 50 °C in its upper parts but gradually downward decreasing temperatures to a depth of ca. 1000 m and 35 °C [18,23]. This geothermal inversion was attributed to the ascent and discharge of warmer waters into the karstic cavities of the upper parts of the sequence from depths greater than 1000 m along major and minor faults. The modern karst water level is 10–11 m below the surface [23]. Today, the seasonal variation of water temperatures in the lake is between 26 and 35 °C, with an average water temperature of 30 °C [18]. The area has a warm-summer humid continental climate (Köppen climate classification Dfb) with oceanic influences. The topo-climatic action is determined by the prevailing westerly winds. The annual average temperature is 10.4 °C, and the average annual rainfall is 603.2 mm, with a maximum in June and a minimum in the late autumn and winter months.

2.2. Stratigraphy and Sampling
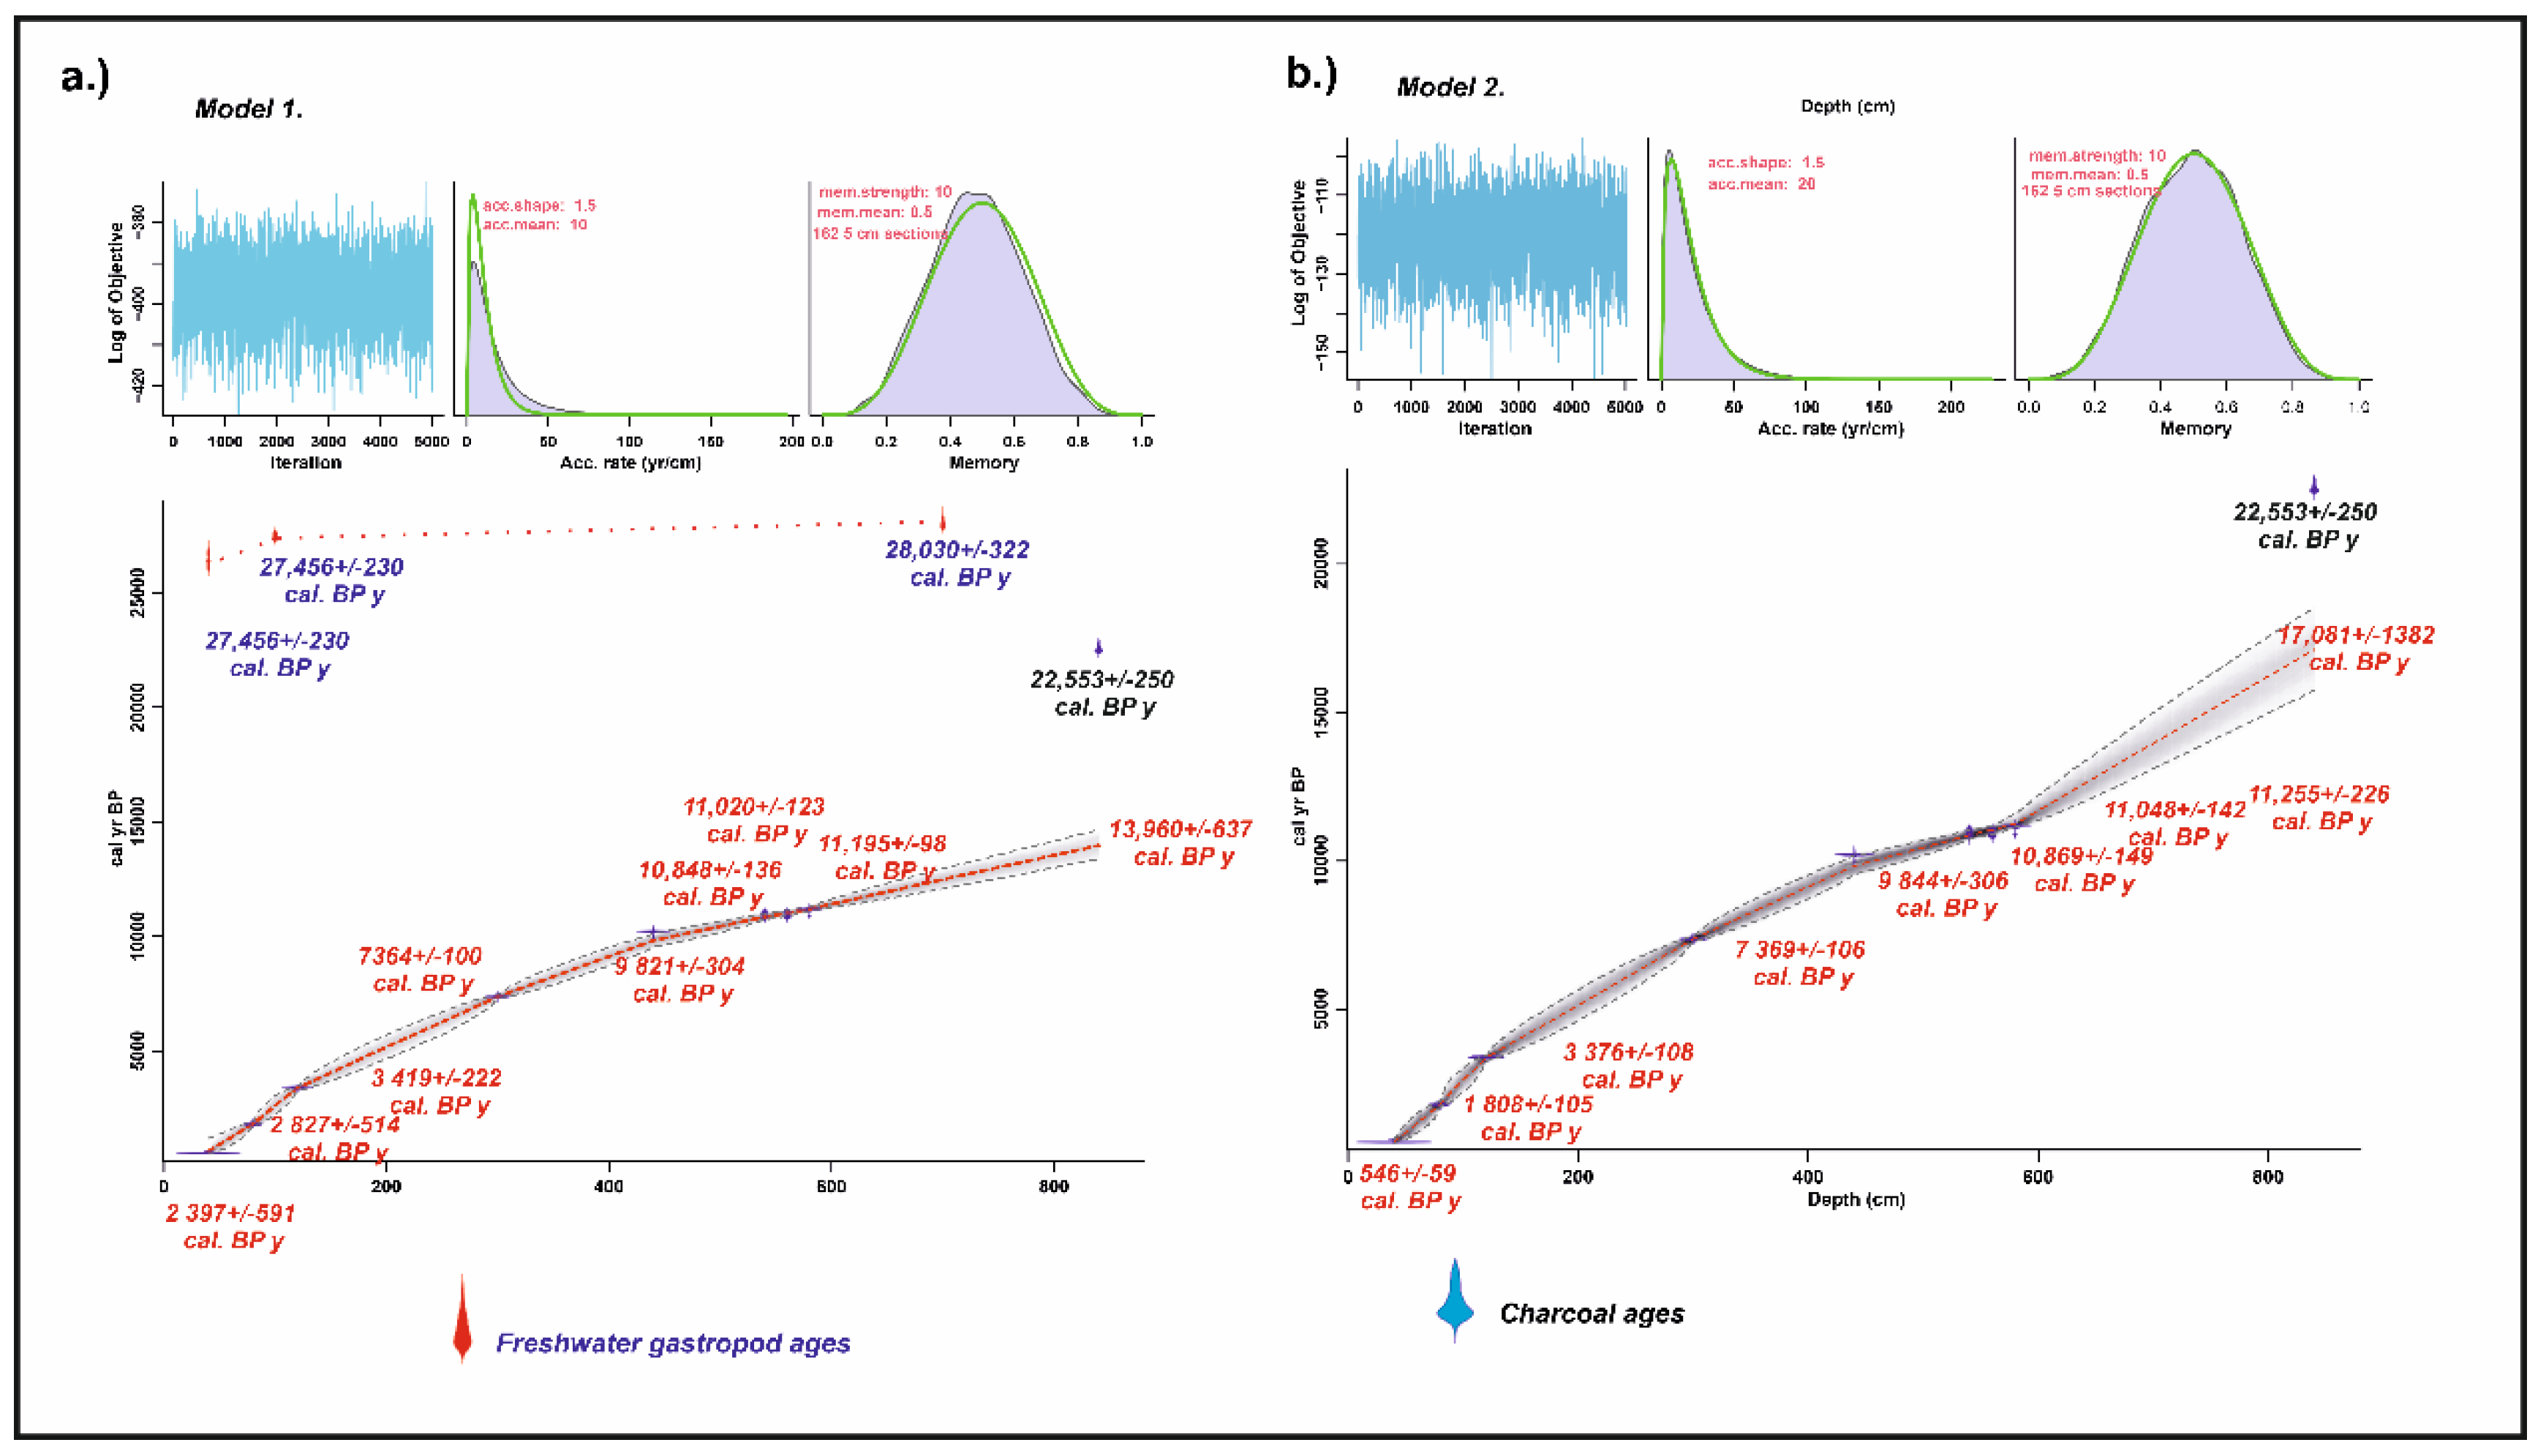
The entire material derives from the geological profile of the 2012 campaign [1,3,4,5] (Figure 1). The bedrock of the 8.4 m sequence consists of limestone pebbles and clayey silt overlain by ca. 2 m thick silt and organic-rich sediments (peaty, clayey silt). This is overlain by ca. 4 m of calcareous marl up to a depth of 2.5 m with thin pebbly, sandy intercalations in its top part. The next unit is a 1 m organic-rich lacustrine sediment with thin silty, sandy marl intercalations overlain by 1 m of clay-rich silty marls. In total, 42 stratified block samples were taken at 20 cm increments for further investigations.

2.3. 14C Dating

Nine charcoal and three gastropod shell samples (Planorbis planorbis Linnaeus, 1758) were submitted for radiocarbon dating. Figure 1 as well as Table 1 presents the exact stratigraphic location of the samples. AMS 14C dating measurements were performed in the AMS laboratory of the Hertelendi Laboratory of Environmental Studies, Institute for Nuclear Research, Debrecen, Hungary (Lab code: DeA-) (Table 1). Sample preparation and measurement protocols are detailed in Hertelendi et al. [24,25] and Molnár et al. [26]. Charcoal fragments were treated using the standard acid–base–acid (ABA) method [27], i.e., 1N HCl was added to the samples, followed by rinsing in distilled water, then 1M NaOH, which was added sequentially followed by rinsing again in distilled water, and then again 1N HCl was added, and the sample was kept at 75 °C for 1–2 h for each step. After the final acid wash, the samples were washed again with distilled water to neutral pH (4–5) and dried at 60 °C. Dried charcoal fragments were combusted in an online combustion system using CuO. Mollusk shell samples were ultrasonically washed and then pretreated using weak acid (2% HCl) before graphitization to remove surficial contamination and carbonate coatings. This removed 20–30% of the shell material. Subsequently, acid-cleaned shells were dried and put into vacuum-tight two-finger reaction ampoules (∼100 cm3 inner volume) and dissolved by phosphoric acid. CO2 was produced by acidic hydrolysis of shells, further purified cryogenically, and then graphitized [26]. All the 14C measurements were performed on the graphitized samples using a compact radiocarbon AMS system (MICADAS) [26,28,29]. Conventional radiocarbon ages were converted to calendar ages using the software RBacon [30] and the most recent IntCal20 calibration curve [31]. Calibrated ages are reported at the 2-sigma confidence level (95.4%).

2.4. Age–Depth Modeling and Sedimentation Time Estimation

Two age–depth models were created with the inclusion of all samples (Model 1) and for the charcoal samples alone (Model 2) (Figure 2). Bayesian modeling was performed using the software package Bacon [30]. Inverse accumulation rates (sedimentation times expressed as year/cm) were estimated from 42 to 48 million Markov Chain Monte Carlo (MCMC) iterations, and these rates form the age–depth model. AR was the first constraint by default prior information: acc. shape = 1.5 and acc. mean = 10 for the beta distribution, a memory mean = 0.7, and memory strength = 4 for the beta distribution describing the autocorrelation of inverse AR. All input data were provided as 14C yr BP, and the model used the northern hemisphere IntCal20 calibration curve [31] to convert conventional radiocarbon ages to calendar ages expressed as cal BP. Age modeling was run to achieve a 5 cm final resolution. All data and figures are presented in calendar ages expressed as cal BP. Sedimentation times (years/cm) were estimated by MCMC iterations using the accrate.depth.ghost and accrate.age.ghost functions of Bacon [32].

2.5. Environmental Magnetism

Environmental magnetic analyses were carried out on bulk samples. Firstly, all samples were crushed in a glass mortar after weighing. Then, all samples were cased in plastic boxes and dried in the air in an oven at 40 °C for 24 h. Afterward, magnetic susceptibilities were measured at a frequency of 2 kHz using an MS2 Bartington magnetic susceptibility meter with an MS2E high-resolution sensor [33]. All samples were measured six times, and the average values of magnetic susceptibility were computed and reported.

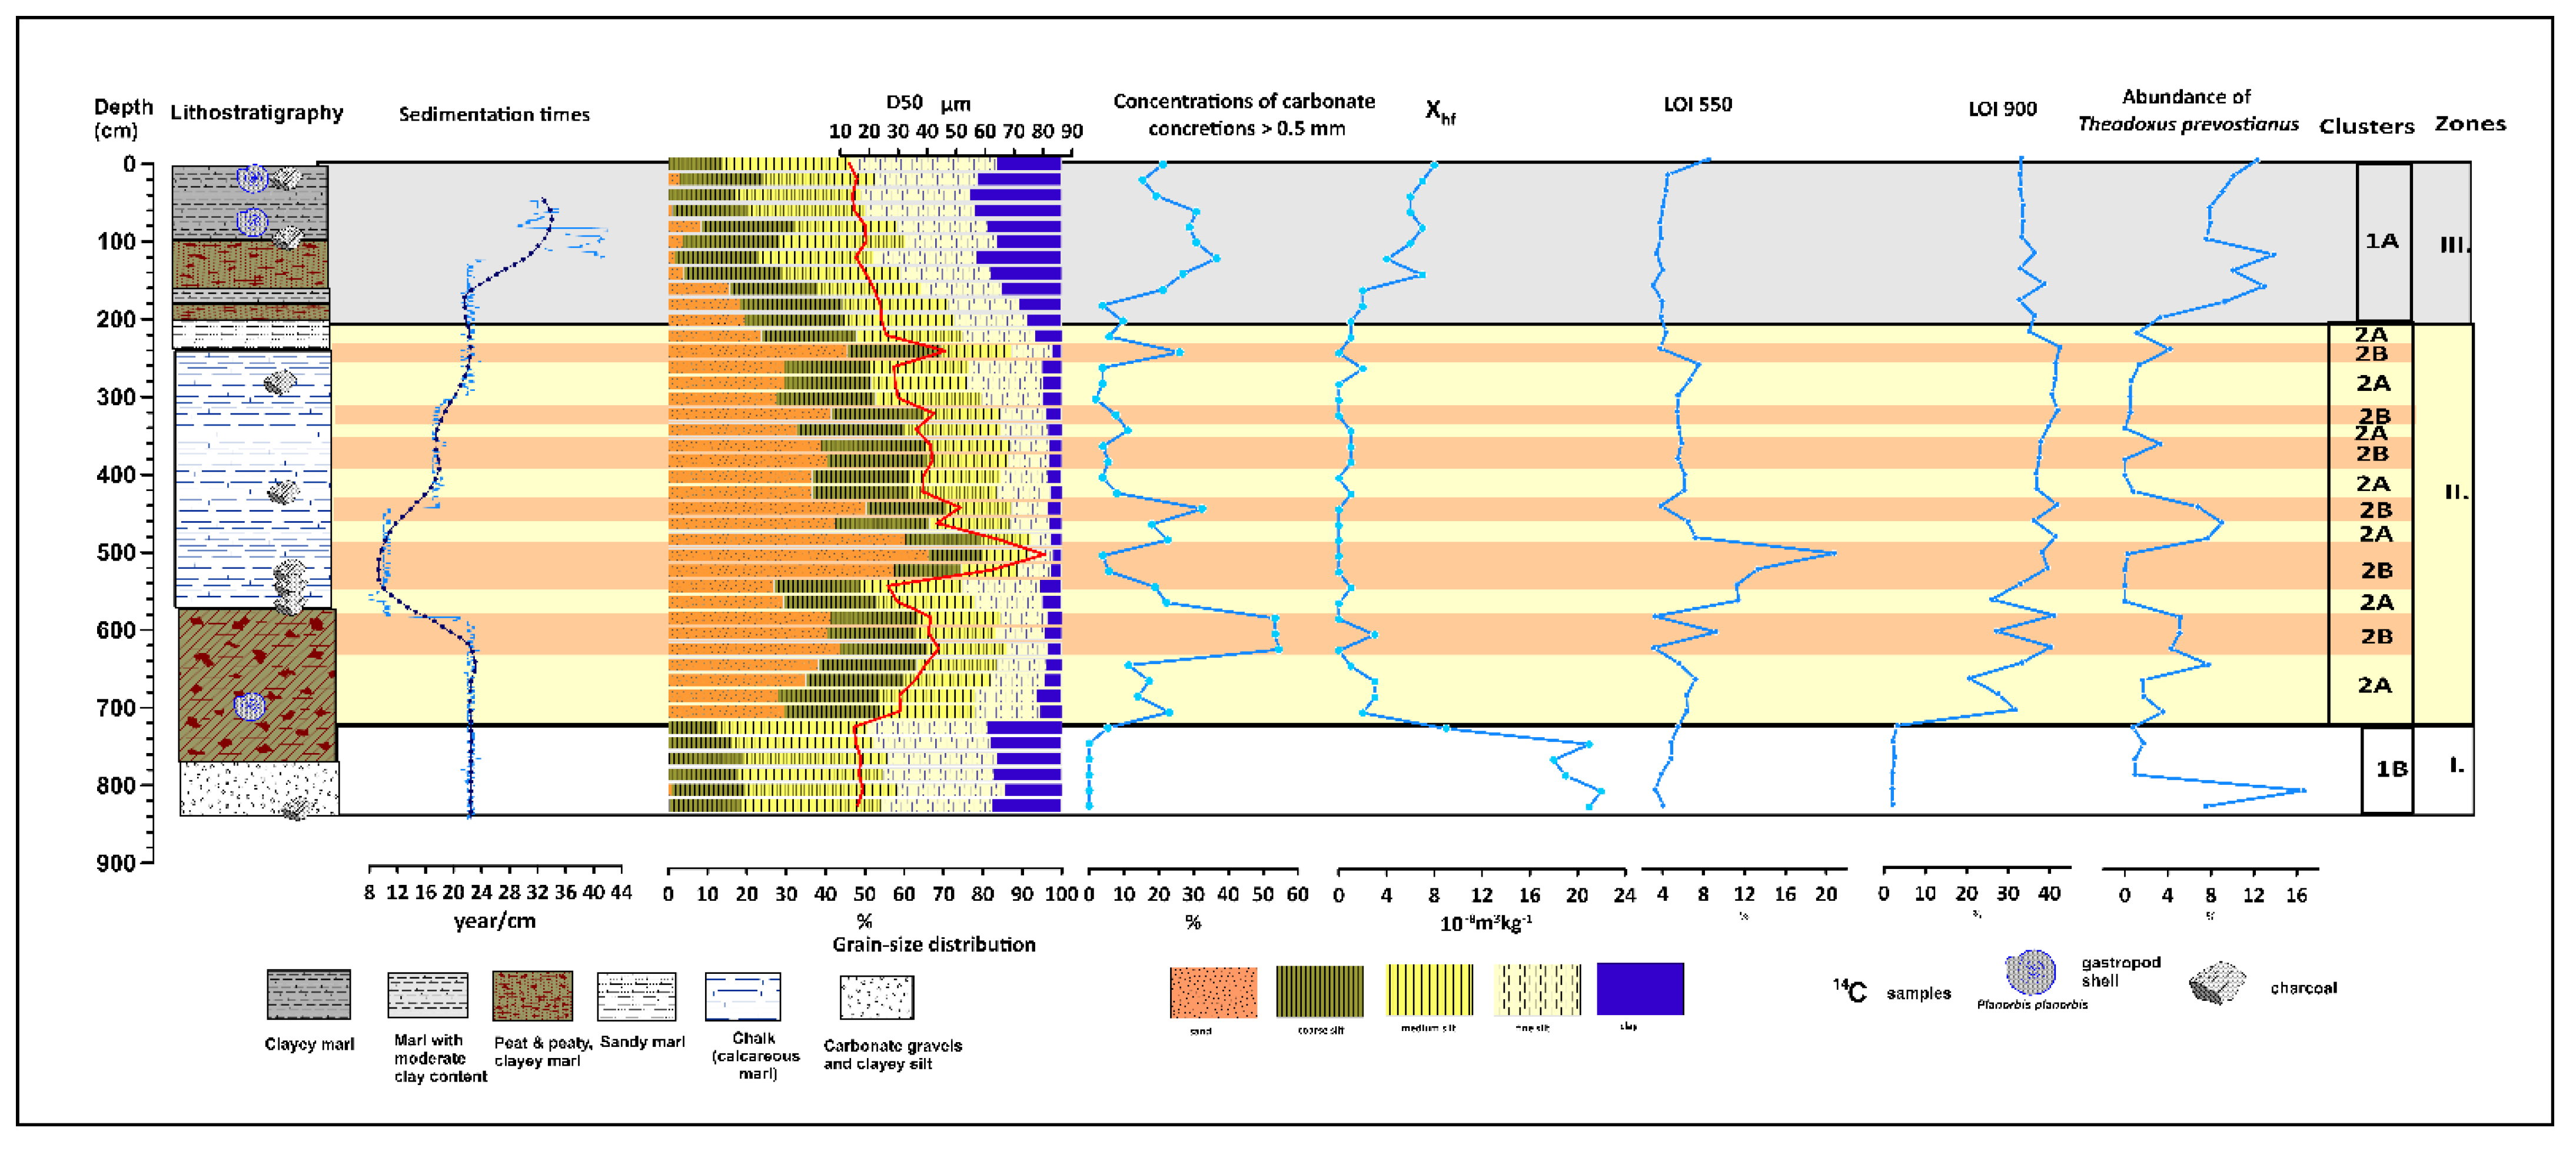
2.6. Grain-Size Distribution and Concentrations of Small Carbonate Concretions and Charcoal

The color was determined using the Munsell Color Scale [34]. The grain-size composition was determined using the Mie method. Samples were pretreated with 1 M HCl and H2O2 to remove CaCO3 and organic matter, respectively. All the samples were measured for 42 size intervals between 0.0001 and 0.5 mm using a Laser Particle Size Analyzer type Easy Sizer 2.0 and Fritsch sieves at the Geoarchaeological and Palaeoecological Lab of the Department of Geology and Paleontology, University of Szeged, Hungary. Grain-size classes were determined in accordance with the Wentworth scale of grain-size distribution. Loss on ignition (LOI) [35] was obtained by weighing after 10 h of calcination at 550 and 900 °C. In addition, the concentration of carbonate concretions > 500 µm and charcoal in 100 g of sample was determined under a stereomicroscope.

2.7. Statistical Data Analysis

Statistical analysis included univariate and multivariate analysis for all measured parameters [36]. Data were subjected to z-score transformation before any further multivariate statistical analysis to allow for putting data from different sources (grain size, LOI, magnetic susceptibility, % of carbonate concretions > 500 µm) onto the same scale. In addition, the normalized data were assembled into a variance–covariance matrix and subjected to factor analysis with varimax rotation. Factor weights helped in interpreting the geological meaning of the derived factors. The normalized raw data and the received factor scores were also put into cluster analysis to determine units of similar sedimentary history. Data were clustered using Ward’s method and the City Block similarity distance to minimize the increase in within-group variance during the procedure and give relatively equal weight to all parameters. The determined clusters were interpreted as sediment zones. The correlation between the recorded parameters (Spearman rho) was also evaluated [36].

3. Results

3.1. Radiocarbon Ages and Chronology

The AMS 14C dating results are listed in Table 1 and shown in Figure 2. The lowermost charcoal sample taken from the base of the profile at the depth of 8.4 m yielded an age of 22,553 ± 250 cal BP years (Table 1. sample 12). The succeeding sample of gastropod shell (sample 11) retrieved from a depth of 7 m (28,030 ± 322 cal BP yr) is about 5500 years older. Gastropod shell ages become gradually younger upwards in the profile. However, the next gastropod sample from the depth of 1 m (sample 4) is merely 574 years younger, while the uppermost one from the depth of 0.4 m (sample 2) is ca. 1600 years younger than the one near the base (sample 11). This implies that gastropod ages are heavily affected by the limestone effect. Charcoal ages also become younger upwards in accordance with the stratigraphic order. The topmost charcoal sample (sample 1) yielded an age of 534 ± 34 cal BP yr. Samples between the depths of 5.4 and 5.8 m (samples 8, 9, 10) were all dated to the Pleistocene/Holocene boundary (10,938 ± 218 cal BP yr, 10,957 ± 228 cal BP yr, and 11,184 ± 102 cal BP yr, respectively). So, based on the unmodelled ages, the lowermost 3 m of the profile corresponds to the period from the nadir of the LGM to the last phase of the Late Glacial. The uppermost 5 m thus represents most of the Holocene.
Figure 2 presents a comparison of the two Bayesian age–depth models. Model 1 includes all ages, while Model 2 omitted gastropod ages due to the mentioned problems of 14C depletion and anomalously old ages. Both Bayesian age–depth models ignored the oldest charcoal age (22, 553 ± 250 cal BP years), placing the start of sediment accumulation at 13,960 ± 632 (Model 1) and 17,081 ± 1382 cal BP yr (Model 2) (Table 2). These dates postdate the unmodelled age of the lowermost charcoal sample (sample 12) by ca. 8600 and 5470 years, moving the start of sediment accumulation to the period of the Late Glacial. The youngest modeled ages were 2397 ± 591 cal BP yr (Model 1) and 546 ± 59 cal BP yr (Model 2), the latter being very close to the unmodelled charcoal age of sample 1 (Table 1 and Table 2). In the case of Model 1, only 60% of the dates overlapped with the age–depth model’s 95% ranges, while there was a 96% overlap in the case of Model 2. While the modeled age differences are minimal between the depths of 6 and 1.2 m for the two models, Model 1 yields 3000–500 years younger ages than Model 2 between the depths of 8.4 and 6 m. Conversely, Model 1 ages are 500 to 1900 years older than Model 2 ages between the depths of 1.2 and 0.4 m. The age difference between the mollusk shell and the charcoal taken from the same depth of 0.4 m (samples 1,2), however, is enormous (25,898 years) (Figure 2, Table 1 and Table 2).
Based on our results, aquatic gastropod shells retrieved from the thermal-spring-fed Lake Pețea are extremely 14C-depleted (5.1, 5.58, and 6.34 percent modern carbon or pMC) throughout the entire sequence, with only a negligible difference, rendering them unsuitable for chronological applications (Figure 2, Table 1). Similarly low pMC values have been reported from shells of spring waters of Nevada (10.6, 3.3, 5.9 pMC) [37,38,39]. This implies a constant supply of 14C-deficient carbon incorporated into the shells by spring waters feeding the lake from the mentioned Lower Cretaceous aquifers.
Due to the mentioned problems with the anomalously old gastropod ages, the results of Model 2 based purely on charcoal dates were adopted in establishing a chronology of the sequence.

3.2. Grain Size, Magnetic Susceptibility, LOI Data, and Sediment Accumulation

Based on the results of cluster analysis of all combined parameters (GS, Xhf, LOI500, LOI 900, % of carbonate concretions > 0.5 mm) the presence of two major groups could have been justified (Figure 3 and Figure S1). Both major groups are further subdivided into two subgroups (Clusters 1a,b and 2a,b). Cluster 1a corresponds to the upper 1.8 m of the profile, while cluster 1b represents the lowermost ca. 1 m (between 7.2 and 8.4 m). The remaining ca. 5 m, i.e., a major part of the profile, corresponds to Cluster 2, where the subclusters (2a and 2b) represent periods of different sedimentation histories. Cluster 1 is characterized by elevated concentrations of clay-sized particles ranging from 16 to 24% compared to samples of Cluster 2 where clay percentages are around or less than 5%. So, it seems that the dominant parameter separating Clusters 1 and 2 is the lower clay content and a concomitant higher percentage of the coarse fraction in the case of the latter (Figure 3). Clusters 1b and 1a, however, are separated based on differences in the carbonate and sand-sized particle content, with Cluster 1b having minimal values of both parameters (Figure 3). So, the entire sequence can be divided into three sedimentation zones, with the lowermost Zone 1 corresponding to Cluster 1b, the overlying Zone 2 corresponding to Cluster 2, and the topmost Zone 3 corresponding to Cluster 1a. Subclusters 2a and 2b within Zone 2 represent recurring periods of different sedimentation histories (Figure 3).
Cluster 1b corresponding to the first sedimentation zone (Zone 1—8.4–7.2 m) is clearly dominated by the fine fraction with minimal sand-sized particle content (between 0.02 and 0.21%) and relatively low coarse silt content (between 12.5 and 18.9%). Limestone gravels appear scattered at the base of the profile alone (8.4–8.5 m) so they have been excluded from grain-size data. Here, the dominant fraction is the fine silt ranging between 27 and 30% in addition to the clay (14.5–18.89%). The D50 values are low, between 14.8 and 17.13 µm (Figure 3). The percentage of carbonate (LOI900) in the samples is minimal (2.07–3.31%), just like the organic content (LOI 550: 3.3–5.5%). Carbonate concretions > 0.5 mm are clearly lacking in this interval in line with the low LOI900 values. Magnetic susceptibility (Xhf) is the highest in the entire profile in this interval (18–22 × 10−8 m3kg−1), indicating sediment accumulation rich in magnetic minerals. Magnetic susceptibility is moderately positively correlated with percentages of the fine components (R2 = 0.4), indicating that the accumulation of magnetic minerals is bound to this fraction. Sedimentation times are generally high (22–23 years/cm), signaling slow deposition in relatively calm conditions in line with the dominance of fines in the grain-size data (Figure 3). Based on this information, we can infer the development of a shallow pond with negligible carbonate content, high clay content, and considerable silt input following an initial stage of fluvial activity marked by the presence of carbonate pebbles at the base of the profile.
There is a marked stepwise change in all parameters from the depth of 7.2 m, signaling the transition into Cluster 2 corresponding to the second zone of sedimentation (Zone 2—7.2–1.8 m) (Figure 3). Here, a sharp drop in the clay content (from 19 to 5.5%) parallel with a marked increase in the proportion of sand-sized particles and coarse silt (from 0 to 29.5% and from 12.5 to 24.5%, respectively) in addition to the carbonate content (from 3.3 to 32%) is noted. There is also a stepwise increase in the percentage of carbonate concretions > 0.5 mm (from zero to values of 23%) and a similar decrease in magnetic susceptibility values (to 1–3 × 10⁻⁸ m3kg−1). Magnetic susceptibility remains low in the entire Zone 2 (0–3 × 10⁻⁸ m3kg−1). All this implies an important transformation of the sedimentary system to a carbonate-rich and minerorganic lacustrine system with a lower input of magnetic minerals (Figure 3).
In this part of the profile, variations in sand-sized particle and coarse silt content are strongly positively correlated (R2 = 0.8), and both parameters are moderately correlated with values of magnetic susceptibility (R2 = 0.4) as well as the D50 values (R2 = 0.45), implying that the input of magnetic-rich minerals must be connected to the transportation and accumulation of the mentioned particle sizes into the sedimentary system. Coarse fractions are moderately negatively correlated with LOI 550 and LOI 900 values (R2 = −0.4 and −0.5, respectively). The proportion of the fines is, however, moderately positively correlated with the LOI 550 and LOI 900 values (R2 = 0.56 and 0.45). So, the accumulation of organic matter and carbonate in this part of the sequence is connected to the deposition of clay and fine silt.
In Cluster 2, the dominant grain-size fractions are sand, with values ranging from 19.43 to 66.13%, and coarse silt (between 13.8 and 27.45%) in general. Clay is minimal generally below 5%, apart from the lowermost two and uppermost two samples where values reach 6–8%. Yet, these are only half of the values of the first sedimentation zone (Cluster 1b Zone 1). The ratio of fine silt ranges between 5 and 19.5%. The mean D50 value is 40 µm, with values ranging from 24.5 to 80.5 µm (Figure 3). D50 values are strongly and positively correlated with the proportion of the coarse fractions, especially the sand-sized particle content (R2 = 0.85), hinting at the important control of these fractions in the sedimentary system. Members of Cluster 2a are clearly separated from Cluster 2b based on the proportion of sands and D50 values. Samples in Cluster 2b are characterized by higher proportions of sand-sized (>30%) and coarse silt-sized particles (>18%) as well as high D50 values (45–55 µm in general, except for the sample at the depth of 5.2 m, where it reaches its all-time maximum of 80.5 µm) (Figure 3). Overall, there is a gradual upward increase in the sand-sized particle content and D50 values between 7.2 and 5.2 m, followed by a gradually decreasing trend to the top of the profile. However, considering the differences and vertical distribution of Cluster 2a and 2b, there is another pattern that emerges. Sedimentation after a stepwise change from Cluster 1b (at the depth of 7.2 m) appears as relatively constant, with sand-sized particle percentages ranging between 30–35% and D50 values around the mean of 40 µm (Cluster 2a) for most of the second zone, but is punctuated by short intervals of coarse material input (Cluster 2b) seen in periodic increases of the sand-sized particle content and the recurring higher peaks of D50 at 6.2–5.8 m, 5.4–4.8 m, 4.6 m, 3.2 m, and 2.4 m (Figure 3). The organic content (LOI 550) after a slight increase from values in Zone 1 also fluctuates between 4–8%, with a minor peak of 11% at 6.2 m, an interval of higher values (11–13%) between 5.6 and 5.2 m, and the marked peak value of 20.79% at 5.2 m (Figure 3). It is important to note that apart from these mentioned intervals of peak LOI 550 values, members of Cluster 2b having higher D50 values and percentages of coarse fractions are generally characterized by minor drops in LOI 550 values compared to members of Cluster 2a, in addition to the clay content (Figure 3).
The carbonate content (LOI 900) after the stepwise increase to 30% at the depth of 7.2 m is followed by a slight decrease to 25% (6.8 m) and a gradual increase to the mean value of 40% of the zone (6.4 m) (Figure 3). Two recurring drops to 25% are notable from this value at depths of 6.2 and 5.8 m after which the value again rises to 40% (5.2 m) and remains relatively constant with some minor recurring 1–4% increases/ decreases for the rest of the zone (Figure 3). However, it is interesting to note that the samples of Cluster 2b which have higher D50 values and a higher proportion of the coarse fraction are where slight periodic increases in the carbonate content are notable. Conversely, samples of Cluster 2a with increased percentages of the finer fraction and somewhat reduced proportions of the coarse fraction are generally characterized by lower LOI900 values, apart from the interval of 6.2 m and 5.8 m (Figure 3). The observable characteristics in all recorded parameters indicate the development of a carbonate-rich oligomesotrophic lake in Zone 2. In parallel with the stepwise increase in the carbonate content, there is also a marked shift in the percent of carbonate concretions > 0.5 mm from values of 0 to 25% at the transition to Zone 2 (7 m) (Figure 3). The next major stepwise increase to the highest value of the entire profile (55%) occurs between the depths of 5.8 and 6.4 m. From here, a general upward decreasing trend is notable similar to that of the D50, and sand-size particle content values are punctuated by numerous peaks of higher values at 4.8 m, 4.4 m, 3.4 m, and 2.4 m. All mentioned peaks correspond to recurring 1–2% increases in the carbonate content. It is also worth noting that, apart from the interval of 5.4 m and 5.2 m, iterative increases in the carbonate content and concentrations of minor carbonate nodules in the sediment are accompanied by periodic rises in the percentages of the coarse fraction too (e.g., at depths of 6.2–5.8 m, 5 m, 4.6 m, 3.2 m, and 2.4 m) (Figure 3). This implies that pulses of increased carbonate input into the lake were accompanied by those of larger sand- and silt-sized particle input as well at the mentioned intervals. The mentioned recurring peaks in sediment parameters are usually accompanied by iterative abundance increases of the thermophilous gastropod Theodoxus prevostianus, indicating that these periods of increased carbonate input must represent increased warm water discharge into the lake, creating ideal conditions for the thriving of the mentioned warm-water gastropod taxa.
In the interval of 5.4 and 5.2 m, minor carbonate nodules are missing. However, at the depth of 5.2 m, a slight 2–3% decrease in the carbonate content parallels the all-time high LOI 550 value (20.79%) as well as the D50 value (80.5 µm) and the highest sand-size particle content (68%). The highest sedimentation times of the entire sequence (8–9 y/cm) are also assigned to the mentioned interval, indicating rapid sedimentation during a very short interval of time (Figure 3). All these point to the transportation of organic-rich coarser sediment into the pond, most likely because of increased soil erosion in the catchment of the rivulet draining the pond.
Sedimentation times in Zone 2 seem to show a good correlation with the general grain-size trend, with periods of higher sand content and high D50 values being characterized by lower sedimentation times and vice versa. (Figure 3). Sedimentation times remain high at the beginning of Zone 2 to a depth of 5.8 m, with values characteristic of the previous zone (22–24 years/cm). There is a marked change to lower values of 10–11 years/cm from 5.8 to 4.4 m, with the mentioned peak low value of 8–9 years/cm at the depths of 5.4 and 5.2 m hinting at more rapid sedimentation following the initial stages (Figure 3). Further stepwise shifts to higher values and significantly smaller accumulation rates are noted at 4.4 m (17 years/cm) and 3 m, where values reach those of the initial phases of sediment accumulation (22–23 years/cm) (Figure 3).
In cluster 1a, corresponding to Zone 3, the percentage of sand-sized particles ranges between 0.08 and 18.19% and shows an upward decrease from this maximum value in parallel with the gradual increase in the clay content from 10.82% to the peak value of 23.7% at the depth of 0.6 m, after which a minor drop to 16.38% is notable in the topmost sample (Figure 3). The proportion of coarse silt also decreases upwards from 26 to 14%, with a concomitant increase in the fine silt content from 18 to 38%. The D50 value also decreases upwards from 24 to 13 µm. The carbonate content slightly decreases to a mean of 33% compared to the higher mean value of 40% in Zone 2. There is a marked increase in the concentration of carbonate concretions > 0.5 mm from 1.6 m, reaching peak values of 30–36% between 0.6 and 1.4 m, and a drop to 20% in the topmost part of the profile. Sedimentation times also show a stepwise further increase from 22–24 years/cm to 43–44 years/cm between 1.2 and 0.8 m, in line with an increasing proportion of the fine fractions (Figure 3). In the uppermost 0.8 m, a slight decrease in the sedimentation times is notable (to 32 years/cm), in parallel with a slightly decreasing clay content and increasing percentage of carbonate concretions > 0.5 mm as well as the sand-size fraction.
The mean value of LOI550 is slightly smaller (3.5–4.5%) than the previous two zones (6%), apart from the topmost sample (8.5%). Magnetic susceptibility displays a sharp increase from the low values of Zone 2 (0–3 × 10⁻⁸m3kg−1) to high values of 8–12 × 10−8m3kg−1, indicating a larger input of magnetic minerals into the lacustrine system in this zone, though values are far lower than those of Zone 1 (Figure 3). Magnetic susceptibility has a moderate positive correlation with the fine silt (R2 = 0.4), clay (R2 = 0.43), and organic content (R2 = 0.56), indicating that the accumulation of magnetic minerals is bound to the organic matter and the fine fraction, in contrast to the previous zone. Based on the observations, Zone 3 marks the emergence of a shallow, carbonate-rich eutrophic lake.

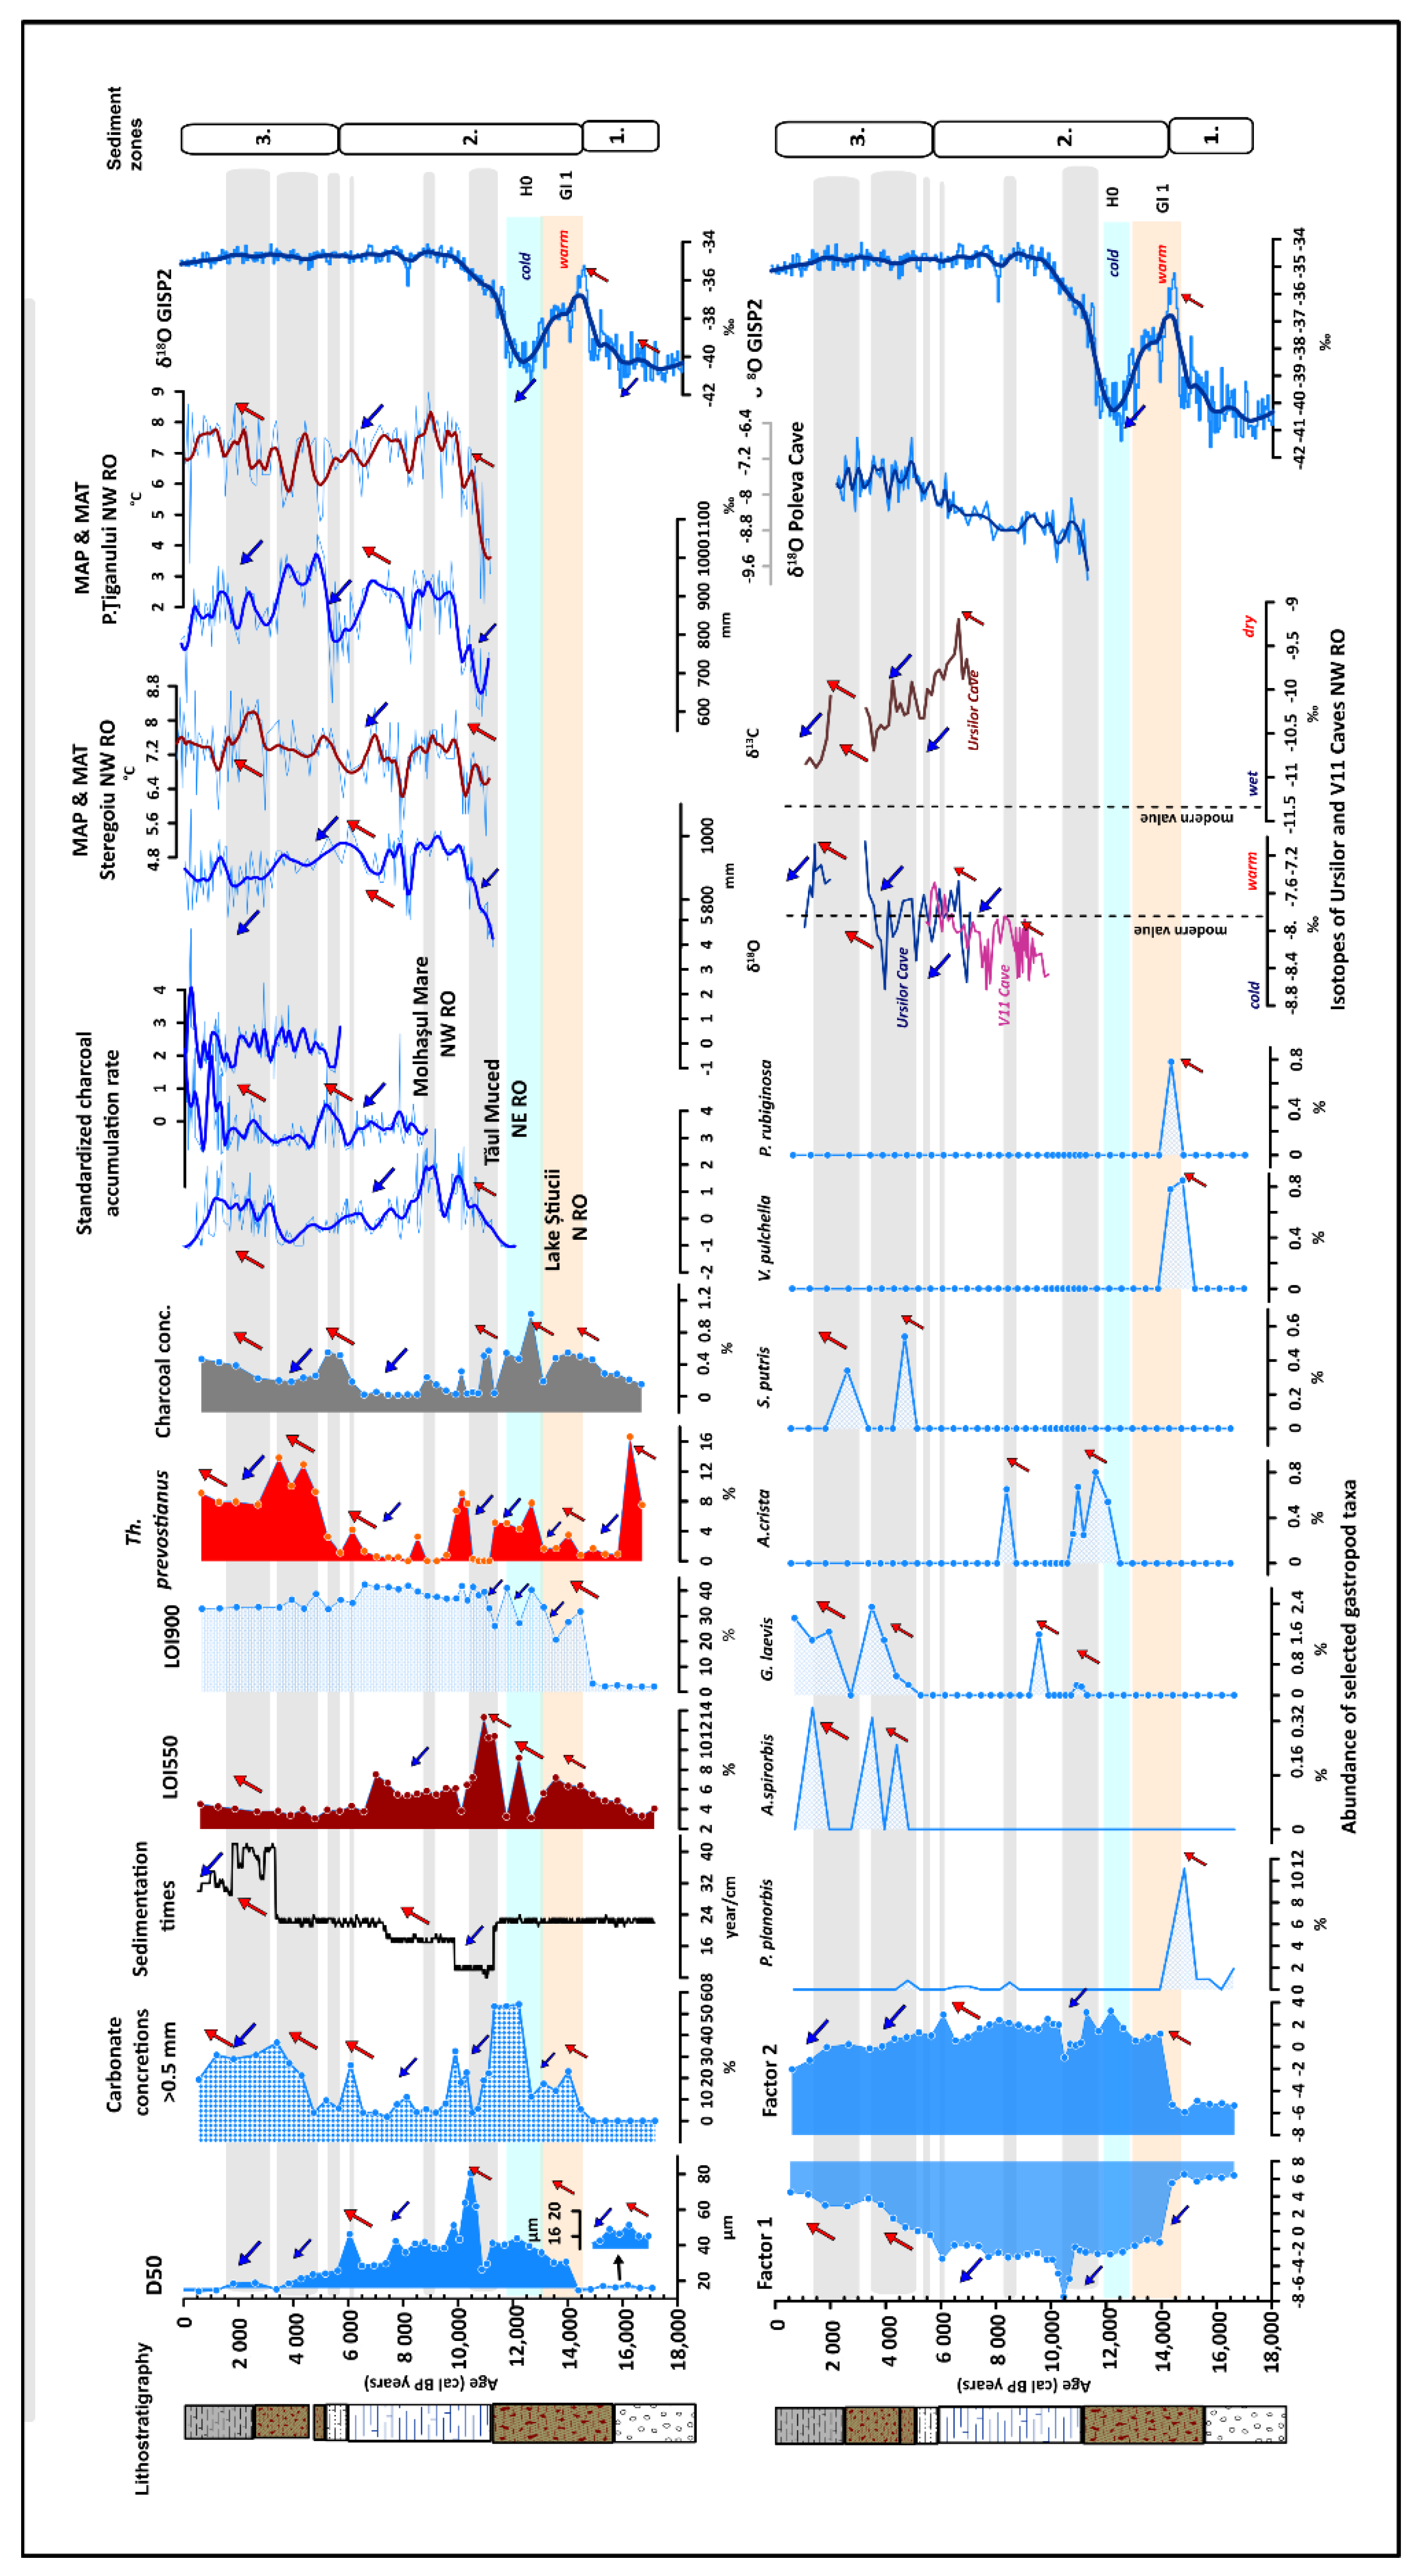
3.3. Factor Analysis

Two factors with eigenvalues larger than 1 were extracted, with Factor 1 describing 62% and Factor 2 26.4% of the variance (88.53% cumulative percentage of variance) (Table S1). Factor 1 has a strong positive loading on the parameters of the percentage of fine silt and clay as well as magnetic susceptibility values (Xhf). Factor 2 has strong positive loadings on LOI 900 as well as the percentages of coarse silt, sand-sized particles, and carbonate concretions larger than >500 µm (Table S2). Considering these parameters, Factor 1 represents autochthonous sedimentary processes characterized by the accumulation of clay and silt in the lake. Factor 2, on the other hand, marks periods of accumulation of coarser particles of sand and silt size in addition to carbonate granules > 0.5 mm plus an increase in the carbonate content, which may hint at periods when larger-sized particles and carbonate-rich waters were transported into the lake, most likely attributable to periodic increases in the discharge of the thermal spring system.
Based on the results of cluster analysis using factor scores, the sequence can be divided into three major groups (Figure 4 and Figure S2). Group 1 with moderately positive Factor 1 scores (between 2 and 5) and slightly negative Factor 2 scores (between 0 and −2) is positioned in the middle right of the scatterplot, depicting the distribution of our samples in relation to the derived factor scores. Group 2 occupies the middle-left part and the upper-left corner, with Factor 1 values below 2 and Factor 2 values above 0 (Figure 4). Group 2 can be further subdivided into two groups. Samples of cluster 2a with Factor 1 values ≤ −2 and Factor 2 values ≥ 1 occupy the upper-left corner, while samples of cluster 2b with Factor 1 values between −2 and 2 and Factor 2 values ≥ 0 and ≤1 are positioned relatively closer to Group 1. Group 3, with high positive Factor 1 scores and strongly negative Factor 2 scores, is well separated from the two previous groups (Figure 4). These groups are clearly well separated on the plot of grain-size distribution as well, with Group 3 corresponding to the lowermost samples between the depths of 8.4 m and 7.2 m. Here, sand-sized particles are missing and there is a clear dominance of silts and a relatively high percentage of clay but very low and almost negligible carbonate content (LOI 900) (Figure 4). Group 2 is the largest, corresponding to samples from depths of 7.2 m to 1.8 m. Group 1 represents the final stage of the lake evolution, with samples above 1.8 m to the surface of the profile. Group 1 has similarly high values for clay content to Group 3 yet is well separated. On the one hand, in the case of both Group 2 and Group 1, a clear presence of sand-sized particles is notable with varying percentages, with Group 1 having low values below 10%. Furthermore, both groups are characterized by high LOI 900 values, indicating the presence of considerable carbonate in the system compared to the lowermost part of the profile (Group 3) (Figure 4). Group 2a represents samples with higher sand content, generally above 30%, and Group 2b has moderate sand content, generally below 30% but above 10%. Group 2b also has larger percentages of clay compared to Group 2a. These parameters also explain why it is positioned relatively close to Group 1 on the scatterplot of the factor scores (Figure 4). So, the interval of Group 3 corresponds to a period dominated by autochthonous processes in the incipient pond with no input of sand-sized particles but the accumulation of fines and minimal or no carbonate (Zone 1 of Figure 3). This is followed by the emergence of a system where coarse particle input increases as well as the carbonate, with periodic pulses of larger sand-sized particle input (Zone 2 of Figure 3). These pulses may represent allochthonous processes in sedimentation. In the final phase, the input minimizes while the carbonate remains high, and again, there is a larger concentration of the fine components, indicating the dominance of autochthonous processes in lacustrine sedimentation.

4. Discussion

Based on the newly established chronology, the temporal evolution of the lake can be divided into three intervals, with Zone 1 representing the period from 17 to 14.3 ka cal BP, Zone 2 covering the period from 14.3 to ca. 5.5 ka cal BP, and Zone 3 representing the Late Holocene till 546 y cal BP. The initial phase of the lake’s evolution corresponds to the period from 17 ka cal BP to 14.3 ka cal BP, i.e., the Oldest Dryas. In this part, a shallow lake was formed with a considerable silt input and minimal clay and carbonate content in its sediments (Figure 5 and Figure 6). The presence of limestone pebbles at the base of the sequence hints at the activity of a rivulet in creating the lake basin. The lack of carbonate nodules and the minimal carbonate content indicates a complete choking of the conduit of the thermal water spring feeding the lake. It is interesting to note that though the D50 values are low compared to the other two zones, a minor increase from 17 ka cal BP to 16.6 ka cal BP followed by a decrease to 15 ka cal BP is clearly visible (Figure 5). This may indicate a temporary larger water discharge to the lake capable of carrying larger-sized particles. The peak D50 value at 16.6 ka cal BP corresponds to the first major peak in the abundance of the thermophilous aquatic gastropod Theodoxus prevostianus (Figure 5). It is also the period when the first representatives of the thermophilous melanopsids in the sequence appear, marking the development of relatively warmer waters with temperatures around 16 °C [3,4,5], most likely because of the significant warm water input. The first peak abundance of the eutrophic shallow-water gastropod Planorbis planorbis along with the increased presence of cold-resistant and mesophilic waterbank taxa (Perforatella rubiginosa and Vallonia pulchella) at the top of the zone signals the development of a shallow oligotrophic lake in the upper part around 14.8–15 ka cal BP in line with the decreasing D50 values after 16.6 ka cal BP (Figure 5 and Figure 6).
Zone 2 represents a major transformation in the sedimentary environment with a stepwise increase in the carbonate content as well as the concentration of carbonate nodules, a shift to the coarser fractions and an increase in the organic content (Figure 5). This transition is coeval with the Bölling/Alleröd interstadial (GI-1). The beginning of GI-1 in the Greenland Ice Core shows a rapid and considerable temperature amplitude increase of 10 °C [40,41,42,43,44]. The δ18O values of speleothems from NW Romania [45] and the growth intervals of another speleothem in Scărişoara Ice Cave [46] also indicate a rapid warming phase initiating at ∼14.8 ka cal BP in the area. This warming trend is notable throughout Central Eastern Europe [47]. Coevally increasing annual and summer temperatures are also seen in other pollen records from the region of NW Romania [47,48] and chironomid-based reconstruction of summer temperatures in the South Romanian Carpathians, indicating an increase of ∼2.8 °C in summer air temperature during the same transition [49]. The emergence of warmer humid conditions must have resulted in the melting of local icefields, increased precipitation, and an elevated recharge of the groundwater system, resulting in higher discharge of the thermal springs in the area supplying warm waters to the lake. The sudden increase in the concentration of carbonate concretions and steady input of coarser grain fractions signals the reopening of the conduit of the underlying spring (Figure 6). The gradual increase in the D50 values and the proportion of sand and coarse silt along with the increase in the carbonate content and the concentration of minor carbonate nodules continued until 11.6 ka cal BP with a minor halt between 13.8 and 12.8 ka cal BP, marking the transition to the Younger Dryas stadial. Here, a ca. 15% decrease in the carbonate content accompanied by an increase in the organic content to one of the peak values of 10% of the sequence is dated around 12.4 ka cal BP, i.e., the middle part of the stadial (Figure 5). A positive shift in Factor 2 to a value of 4 and a negative shift in Factor 1 to a value of −2 marks an increased input of coarse material most likely attributed to a temporal lowstand during the stadial, when lower temperatures and drier conditions must have reduced the discharge rates of the thermal springs.
A transition to markedly warmer and drier conditions occurred at 11.7 ka cal BP, as seen in both our and regional paleoclimatic records. The interval between 12 and 10.2 ka cal BP in our records is characterized by a marked increase in the D50 value, reaching an all-time peak (88 µm) in the sequence at 10.2 ka cal BP. In Parallel, LOI 550 also reaches its all-time peak of 14%, marking the accumulation of a significant amount of organic matter in the lake (Figure 5). There is a stepwise decrease in sedimentation times to again all-time low values of 8 years/cm, indicating a phase change in sediment accumulation compared to both the previous and the succeeding part of the sequence. This is accompanied by a similar stepwise drop in the percentage of carbonate concretions and the abundance of the thermophilous aquatic gastropod Th. prevostianus. There is a minor peak in the abundance of shallow-water eutrophic gastropods G. laevis and A. crista within the mentioned interval and right after 10.2 ka cal BP, indicating the emergence of shallow water conditions as a result of the mentioned changes (Figure 5). This is corroborated by chara remains (Chara hispida) and ostracods (Candona weltneri), which also hint at exceptionally low water levels [50,51,52,53,54]. What is more, this is the only zone where chara remains are present in the entire sequence, signaling that in later periods, lake levels must have been higher, creating unfavorable conditions for calcareous algae. All these may indicate the emergence of a major lowstand in the lake, marked by a significant input of coarse-grained and organic-rich material most likely because of increased erosion from the direct vicinity of the lacustrine basin (Figure 6).
A minor peak of charcoal concentrations in the lacustrine sediments in the mentioned interval hint to the emergence of renewed fire activity in the vicinity of the site because of drier and warmer conditions (Figure 5). Early Holocene records for the lowlands of NW Romania show high summer temperatures (by ca. 4 °C) and ca. 33% lower precipitation rates [47,48,54,55,56,57]. High fire activity, a lowering of the lake level at Ştiucii Lake [55], and lower MAP inferred from the pollen records of the crater lakes of Steregoiu and P. Tiganului in NW Romania [56] also indicate decreasing moisture availability in this interval (Figure 5). Speleothem records both in the southern and northern part of the region [45,58] indicate a gradual warming trend from ~11.5 ka into the Holocene (Figure 5). Regional records also show a decrease in peat surface moisture as well as lake levels in NW and E Romania [55,56,57,59,60]. A shift in river activity characteristic of lower discharge and the related lower amount of precipitation again indicates the emergence of warmer and drier conditions [61,62].
Figure 5. Comparison of Lake Pețea sedimentary and paleoecological data with other regional paleoclimatic and paleohydrological records (note: grey bands correspond to periods of change mentioned in the text, and arrows mark the directions of change; sources of data: gastropod abundances [3], isotopes for GISP2 δ18O [43,44], MAP and MAT for crater lakes of Steregoiu and P. Tiganului in NW Romania [48], charcoal acc. rates for Ştiucii Lake T. Muced and M. mare [48,55,56,57], isotope for Poleva [58] Ursilor and V11 caves [63]).
Quaternary 06 00037 g005
Figure 6. Reconstruction of evolutionary stages of Lake Pețea from the Late Glacial to the Late Holocene.
Quaternary 06 00037 g006
From 10 ka cal BP there is another stepwise increase in sedimentation times to 20 year/cm, marking the return to normal sediment accumulation, similarly to the interval preceding 11.7 ka cal BP (Figure 5). The small peak in D50 values, significantly below the all-time high of the previous period, with a parallel increase in the percentage of carbonate concretions and the abundance of the thermophilous aquatic gastropod Th. prevostianus (Figure 5) indicates the renewed input of warm waters into the lake because of restarting thermal spring activity most likely attributable to increasing moisture availability. From here on until the boundary of Zone 3 at ca. 5 ka cal BP, D50 values show a gradual decrease, while LOI 550 and LOI 900 values remain relatively constant (Figure 5). Sedimentation times slightly increase from 7 ka cal BP but essentially remain the same as in Zone 1 and the beginning of Zone 2 (21–24 year/cm). There are minor recurring peaks in D50 values which correspond to recurring peaks of increased carbonate concretions input and increasing abundances of the thermophilous aquatic gastropod Th. prevostianus (Figure 5). This may hint to a recurring increased supply of warm waters into the basin. The general lack of shallow-water-preferring gastropods and the complete lack of chara remains, as mentioned in this interval, indicate the emergence of a deeper water carbonate-rich oligomesotrophic lake (Figure 6) until ca. 4–5 ka cal BP.
There is a small charcoal peak in our record around 8. 5 ka cal BP, which corresponds to the charcoal peak in Lake Stiucii (Figure 5). This may hint to the emergence of the drier conditions which characterized the region with slightly reduced precipitation rates seen from pollen records as well as higher oxygen isotope values in the regional speleothem records [45,47,54,55,56,57,58]. From here up to about 5.5–6 ka cal BP, charcoal concentration is minimal in our sequence (Figure 5) in line with reduced charcoal accumulation rates in Lake Stiucii and T. Muced [47,54,55,56,57], marking an overall decrease in fire activity. The gradual decrease in oxygen and carbon isotope values of nearby speleothem records in the Apuseni Mts well as the high MAP values reconstructed for the nearby peatlands [45,47,55,56,57,58] (Figure 5) mark the emergence of cooler and wetter conditions, offering a continuous supply of water into the underground karst system and ensuring constant water input into the lake and the maintenance of relatively higher water levels (Figure 6). At 6 ka cal BP, there is a small peak in the D50 values, concentrations of carbonate concretions, and the abundance of the thermophilous Th. prevostianus which may indicate larger warm water input into the lake. The coeval increase in MAP at Steregoiu [56,57] and decreases in oxygen and carbonate isotope values of Apuseni Mts speleothems [45,46,58,63] hint at increased availability of moisture in this interval compared to the previous and succeeding parts (Figure 5).
Another charcoal peak appears in our records between 5.5–5 ka cal BP, marking renewed fire activity (Figure 5). The abundance peaks of the eutrophic shallow-water gastropod taxa A. spirorbis and the littoral-habitat-preferring S. putris hints at the development of shallow water conditions most likely attributable to drier conditions. In this interval, D50 values are markedly lower than at 6 ka cal BP (Figure 5). Low lake levels and reduced river activity were documented between 5.5 and 5.3 ka cal BP in the Eastern Carpathians [59] and the Transylvanian Plain too [55,56,57]. A general increase in fire activity and dry peat surface conditions was identified between 5.5 and 4.8 ka cal BP in the Romanian Carpathians [55,56]. Warmer/drier climatic conditions were also reconstructed around 5.5 ka cal BP based on speleothem isotopes from the Apuseni Mountains [45,46,58,63] and on pollen-based quantitative climate reconstructions in the Gutâiului Mountains, NW Romania [48,55,56,57] (Figure 5).
After ca. 4.5 ka cal BP, there is a marked decrease in the D50 values and a sharp increase in the concentration of small carbonate concretions and the abundance of Th. prevostianus (Figure 5). This is accompanied by the complete disappearance of the eutrophic shallow-water gastropod taxa A. spirorbis and the littoral-habitat-preferring S. putris. The sharp decrease in charcoal concentrations in our deposits here is also notable. There is an abrupt rise in the lake levels of the Eastern Carpathians from 5.3 ka cal BP [59] and the Transylvanian Plain from 5 ka cal BP too [55,56,57]. A marked negative shift in oxygen and carbon isotopes of the Ursilor cave speleothem [63] here with all-time low values around 4 ka cal BP marks the emergence of cooler and wetter conditions (Figure 5). Cooler and wetter conditions associated with the 4.2 kyr event [64] have been widely documented in the region by various records, such as a fluvial activity [61,62], oxygen isotopes [58,63], chironomid-based summer temperature [65], and mire surface wetness reconstructions [66,67,68].
From ca. 3 ka cal BP, there is a marked increase in the sedimentation times to an all-time high in the entire profile (44 cm/y) (Figure 5). This is accompanied by a shift to a dominance of finer grainsize classes with a marked increase in the clay content and a drop in the D50 value to 18–12 µm, also expressed in a gradual increase in Factor 1 values. The concentration of small carbonate concretions also decreases while the carbonate content remains stable along with a small ca. 2% increase in the organic content. A marked presence of the shallow-water littoral-habitat-preferring gastropod S. putris followed by an increase in the abundances of the alkaline shallow- and eutrophic-water-preferring A. spirorbis and A. crista at this level indicates the emergence of a shallow (1–2 m deep), eutrophic lake (Figure 6). This drop in the lake level might be partially attributed to the emergence of drier conditions also seen in the increase in charcoal concentrations in the sediment, marking intensifying fire activity in the neighboring areas. A high peat decomposition and elevated charcoal accumulation rates at 2.7 ka cal BP at the Tăul Muced peatbog in NE Romania also suggest dry climate conditions [67]. High fire activity and a lowering of the lake level at Ştiucii Lake [55,56] and the higher MAT and lower MAP inferred from the pollen records of the crater lakes of Steregoiu and P. tiganului in NW Romania [48] as well as high carbon and isotope values in Ursilor Cave speleothems at the Apuseni Mts, NW Romania [63], also indicated decreasing moisture availability around 2.8 ka cal BP (Figure 5). This change is linked to reduced solar activity inferred at 2.8 ka from many peatlands in NW Europe [69,70,71,72]. Palaeohydrological data from a wider regional scale in Europe (Poland, Germany) show dry climate conditions during this time [71].
After 2 ka cal BP, speleothem data from Ursilor Cave [63] indicate cooling of the climate with the development of wetter conditions similar to wet surface mire conditions at Tăul Muced peatbog, NE Romania [67,73]. This increase in moisture availability must have contributed to a slight rise in the lake level at Lake Pețea, as seen in a stepwise decrease in the accumulation times to 26 year/cm (Figure 5). A parallel increase in the concentration of small carbonate concretions, a slight sand input, and a minor rise in the abundance of the thermophilous gastropod Th. prevostianus here may hint to the increased water discharge of the underground hot springs feeding the lake (Figure 5 and Figure 6).

5. Concluding Remarks

Understanding lacustrine sedimentation processes in response to past natural and human-induced environmental, hydrogeological, and climatic changes is a key focus of paleoenvironmental research. Some lacustrine systems, such as the one presented here, are especially prone to such changes due to their restricted size and shallow water levels as well as the nature of their major water sources. Fluctuations in water supply because of temporally changing spring discharge are also a key control in the evolution of spring-fed lakes. Even minor fluctuations in depth, water coverage, water temperature, chemistry, nutrient supply, and substrate conditions can have a significant impact on the biota [1,19].
To decipher temporal variations recorded in the sedimentary sequence, the establishment of a reliable chronology is essential. This is usually based on radiocarbon dating of plant and mollusk remains retrieved from the lake. Mollusk remains, especially those of aquatic mollusks, are prone to the so-called limestone effect, generally yielding older ages than those of closely associated macro-botanical remains [74,75,76,77,78,79,80,81]. Numerous studies have demonstrated that the magnitude of the 14C-age anomaly can approach ∼3000 14C years [74,75,76,77,78,79,80,81,82,83,84,85,86,87,88,89]. As seen in our example, aquatic gastropod shells from Lake Pețea are extremely 14C-depleted due to a constant supply of 14C-depleted spring water to the lake. Here, age anomalies can reach values between 5.4, 8.6, and even 25.9 kys. Bayesian modeling based on the dataset of combined gastropod 14C and associated plant remains’ ages can reduce this age discrepancy to some thousands or even a couple hundred years. Yet, this is far from being suitable for establishing a reliable high-resolution chronology. Nevertheless, it can carry information on the temporal variation of a key environmental parameter by demonstrating the constant input of 14C-depleted spring water to the lake throughout its entire history. The observed slight upward decrease in our pMC values must be attributed to potential aeration, which may hint at the gradual shallowing of the lake in line with our other palaeoecological data [39,74].
Based on our results, a three-stage sedimentary evolution occurred in Lake Pețea between 17.5 and 0.05 ka cal BP, which was mainly controlled by the major climate-driven hydrological changes also seen in regional records. These hydrological changes were mainly controlled by the varying input of thermal water into the lake due to recurring increased/decreased recharge of the underground shallow karst water system. However, the driving factor of underground thermal water discharge was different during the Late Glacial than during the Holocene. During the Late Glacial, it was the warming of the climate at 14.5 ka cal BP connected to the Bölling/Alleröd interstadial that dominantly created increased recharge of the system via melting of regional ice sheets in addition to increased precipitation. Conversely, during the Holocene, increasing/decreasing moisture availability was in control.

Supplementary Materials

The following supporting information can be downloaded at https://www.mdpi.com/article/10.3390/quat6020037/s1, Figure S1: Dendrogram for all recorded parameters; Figure S2: Dendrogram for factor scores; Table S1: Factor eigenvalues; Table S2: Factor score coefficients.

Author Contributions

S.G.: conceptualization, data analysis, age–depth modeling, visualization and interpretation, and manuscript preparation P.S.: fieldwork, stratigraphic and geological data provision, and manuscript revision. All authors have read and agreed to the published version of the manuscript.

Funding

This research enjoyed funding with the support of the Ministry of Human Capacities, Hungary, from grants NKFIH Grant 129265, Grant 20391-3/2018/FEKUSTRAT, and GINOP-2.3.2-15-2016-00009 ‘ICER’.

Data Availability Statement

Data are available upon request from the corresponding author.

Acknowledgments

This research has been carried out within the framework of University of Szeged, Interdisciplinary Excellence Centre, Institute of Geography and Earth Sciences, Long Environmental Changes Research Team. The authors wish to express their gratitude to colleagues of the Ţării Crişurilor Museum. In addition, the authors are also grateful to the two reviewers who helped to improve the quality of this publication.

Conflicts of Interest

The authors declare no conflict of interest. The funders had no role in the design of the study; in the collection, analyses, or interpretation of data; in the writing of the manuscript; or in the decision to publish the results.

References

  1. Gulyás, S.; Sümegi, P.; Müller, T.; Geary, D.H.; Magyar, I.; Nagy, B.; Benyó-Korcsmáros, R. Assessing phenotypic variation and plasticity of endemic gastropods from thermal water refugia using complex morphometric techniques: A case study of Lake Pețea melanopsids. Palaeontology, submitted.
  2. Neubauer, T.A.; Harzhauser, M.; Georgopoulou, E.; Wrozyna, C. Population bottleneck triggering millennial-scale morphospace shifts in endemic thermal-spring melanopsids. Palaeogeogr. Palaeoclimatol. Palaeoecol. 2014, 414, 116–128. [Google Scholar] [CrossRef] [PubMed] [Green Version]
  3. Sümegi, P.; Molnár, D.; Sávai, S.; Gulyás, S. Malacofauna evolution of the Lake Pețea (Püspökfürdő), Oradea region, Romania. Nymphaea Folia Nat. Bihariae 2012, 34, 5–29. [Google Scholar]
  4. Sümegi, P.; Molnár, D.; Sávai, S.; Töviskes, R.J. Preliminary radiocarbon dated paleontological and geological data for the Quaternary malacofauna at Püspökfürdő (Băile 1 Mai, Oradea region, Romania). Malakol. Táj. 2012, 30, 31–37. [Google Scholar]
  5. Sümegi, P.; Gulyás, S.; Molnár, D.; Náfrádi, K.; Törőcsik, T.; Sümegi, B.P.; Müller, T.; Szilágyi, G.; Varga, Z. Ice Age Terrestrial and Freshwater Gastropod Refugia in the Carpathian Basin, Central Europe. In Biological Resources of Water; Ray, S., Ed.; IntechOpen: London, UK, 2018. [Google Scholar] [CrossRef] [Green Version]
  6. Kormos, T. Beitrage zur kenntnis der Melanopsis-arten aus den Thermen von Püspökfürdő bei Nagyvárad. Földtani Közlöny 1903, 33, 496–503. [Google Scholar]
  7. Kormos, T. Új adatok a Püspökfürdő élő csigáinak ismeretéhez. Állatani Közlöny 1904, 3, 102–111. [Google Scholar]
  8. Kormos, T. A Melanopsis hungarica, Korm. alkalmazkodásáról. Állatani Közlöny 1905, 4, 155–156. [Google Scholar]
  9. Kormos, T. Über den ursprung der thermenfauna von Püspökfürdő. Földtani Közlöny 1905, 35, 421–450. [Google Scholar]
  10. Paucă, M. Les mollusques pléistocènes de Băile Episcopeşti. Bull. Soc. Roum. Géol. 1937, 3, 130–142. [Google Scholar]
  11. Sîrbu, I.; Gagiu, A.; Benedek, A.M. On the brink of extinction: Fate of the Pețea thermal lake (Romania) and its endemic species. Tentacle 2013, 21, 34–37. [Google Scholar]
  12. Sîrbu, I.; Sárkány-Kiss, A. Endangered freshwater mollusc species from the eastern tributaries of the Tisa river (Romanian territory). Tisc. Monogr 2002, 6, 71–80. [Google Scholar]
  13. Tóth, M. Data about Diluvial formations of Nagyvárad region. Magy. Orv. És Természetvizsgálók 25. Vándorgyűlése Munkálatai 1891, 25, 474–479. [Google Scholar]
  14. Covaciu-Marcov, S.D.; Ghira, I.; Ardeleanu, A.; Cogalniceanu, D. Studies on the influence of thermal water from Western Romania upon Amphibians. Biota 2003, 4, 9–20. [Google Scholar]
  15. Müller, T.; Várkonyi, L.; Gagiu, A.; Kovács, B.; Búza, E.; Majoros, G.; Staszny, Á.; Horváth, Á.; Bernáth, G.; Tóth, G.; et al. Attempts on ex situ conservation of Melanopsis parreyssii and Scardinius racovitzai. In II. Sustainable Development in the Carpathian Basin" International Conference—Book of Abstracts; Zimmermann, Z., Szabó, G., Eds.; GATE University: Gödöllő, Hungary, 2014; pp. 35–38. [Google Scholar]
  16. Sîrbu, I.; Benedek, A.M. Requiem for Melanopsis parreyssii or the anatomy of a new extinction in Romania. Tentacle 2016, 24, 26–28. [Google Scholar]
  17. Telcean, I.C.; Cupşa, D. Threatened and rare fishes from Upper Tisa valley and its Romanian left shore tributaries (North-Western Romania). Pisces Hung. 2012, 6, 87–94. [Google Scholar]
  18. Telcean, I.C.; Cupşa, D. The drastic decline of fish fauna in the thermal lake of “Baile 1 Mai” (Baile Episcopale, Bihor County, Romania). Pisces Hung. 2013, 7, 141–142. [Google Scholar]
  19. Mintaş, O.; Vicaş, G.; Mintaş, I. The influence of the natural factors on the evolution of the Pețea thermal hydro-geo-ecosystem in the period 2009–2012. Ann. Univ. Oradea Fasc. Prot. Med. 2012, 19, 733–738. [Google Scholar]
  20. Telcean, I.C.; Cupșa, D. Püspökfürdő endemikus hala a Racovitza kele (Scardinius racovitzai). Halászat 2006, 99, 135. [Google Scholar]
  21. Brusina, S. Eine subtropische Oasis in Ungarn. Mitt. Naturwiss. Ver. Steiermark 1903, 39, 101–121. [Google Scholar]
  22. Wolf, H. Bericht über die geologischen Verhältnisse im Körösthale in Ungarn, nach den Aufnahmen im Jahre 1860. Jahrbruh Kais. Königlich Geol. Keischsanstalt 1863, 13, 265–292. [Google Scholar]
  23. Gheorghe, A.l.; Grǎciun, P. Thermal aquifers in Romania. J. Hydrol. 1993, 145, 111–123. [Google Scholar] [CrossRef]
  24. Hertelendi, E.; Csongor, É.; Záborszky, L.; Molnár, I.; Gál, I.; Győrffy, M.; Nagy, S. Counting system for high precision C-14 dating. Radiocarbon 1989, 32, 399–408. [Google Scholar] [CrossRef] [Green Version]
  25. Hertelendi, E.; Sümegi, P.; Szöőr, G. Geochronologic and paleoclimatic characterization of Quaternary sediments in the Great Hungarian Plain. Radiocarbon 1992, 34, 833–839. [Google Scholar] [CrossRef] [Green Version]
  26. Molnár, M.; Janovics, R.; Major, I.; Orsovszki, J.; Gönczi, R.; Veres, M.; Leonard, A.G.; Castle, S.M.; Lange, T.E.; Wacker, L.; et al. Status Report of the New AMS 14C Sample Preparation Lab of the Hertelendi Laboratory of Environmental Studies (Debrecen, Hungary). Radiocarbon 2013, 55, 665–676. [Google Scholar] [CrossRef] [Green Version]
  27. Jull, A.J.T.; Burr, G.S.; Beck, J.W.; Hodgins, G.W.L.; Biddulph, D.L.; Gann, J.; Hatheway, A.L.; Lange, T.E.; Lifton, N.A. Application of accelerator mass spectrometry to environmental and paleoclimate studies at the University of Arizona. Radioact. Environ. 2006, 8, 3–23. [Google Scholar]
  28. Synal, H.A.; Stocker, M.; Suter, M. MICADAS: A new compact radiocarbon AMS system. Nucl. Instrum. Methods Phys. Res. 2007, 259, 7–13. [Google Scholar] [CrossRef]
  29. Wacker, L.; Bonani, G.; Friedrich, M.; Hajdas, I.; Kromer, B.; Némec, M.; Ruff, M.; Suter, M.; Synal, H.A.; Vockenhuber, C. MICADAS: Routine and high-precision radiocarbon dating. Radiocarbon 2010, 52, 252–262. [Google Scholar] [CrossRef] [Green Version]
  30. Blaauw, M.; Christen, J.A. Flexible paleoclimate age-depth models using an autoregressive gamma process. Bayesian Anal. 2011, 3, 457–474. [Google Scholar] [CrossRef]
  31. Reimer, P.; Austin, W.; Bard, E.; Bayliss, A.; Blackwell, P.G.; Ramsey, C.B.; Butzin, M.; Cheng, H.; Edwards, R.L.; Friedrich, M. TheIntCal20 Northern Hemisphere radiocarbon age calibration curve (0–55 cal kBP). Radiocarbon 2020, 62, 725–757. [Google Scholar] [CrossRef]
  32. Blaauw, M.; Christen, J.A.; Benett, K.D.; Reimer, P.J. Double the dates and go for Bayes-Impacts of model choice, dating density and quality of chronologies. Quat. Sci. Rev. 2018, 188, 58–66. [Google Scholar] [CrossRef] [Green Version]
  33. Dearing, J.A.; Dann, R.J.L.; Hay, K.; Lees, J.A.; Loveland, P.J.; Maher, B.A.; O’Grady, K. Frequency-dependent susceptibility measuremements of environmental materials. Geophys. J. Int. 1996, 124, 228–240. [Google Scholar] [CrossRef] [Green Version]
  34. Munsell Soil Color Charts; Munsell Color Company, Pantone LLC: Ashford, UK, 2002.
  35. Dean, W.E. Determination of carbonate and organic matter in calcareous sediments and sedimentary rocks by loss on ignition: Comparison with other methods. J. Sed. Petrol. 1974, 44, 242–248. [Google Scholar]
  36. Sokal, R.R.; Rohlf, F.J. Biometry: The Principles and Practice of Statistics in Biological Research, 3rd ed.; Freeman: New York, NY, USA, 1995; p. 887. [Google Scholar]
  37. Riggs, A.C. Major carbon-14 deficiency in modern snail shells from Southern Nevada Springs. Science 1984, 224, 58–61. [Google Scholar]
  38. McConnaughey, T.A.; Gillikin, D.P. Carbon isotopes in mollusk shell carbonates. Geo Mar. Lett. 2008, 28, 287–299. [Google Scholar] [CrossRef]
  39. Brennan, R.; Quade, J. Reliable Late-Pleistocene stratigraphic ages and shorter groundwater travel times from 14C in fossil snails from the Southern Great Basin. Quat. Res. 1997, 47, 329–335. [Google Scholar] [CrossRef]
  40. Björck, S.; Walker, M.J.C.; Cwynar, L.; Johnsen, S.J.; Knudsen, K.L.; Lowe, J.J.; Wohlfarth, B. INTIMATE Members. An event stratigraphy for the last termination in the North Atlantic region based on the Greenland Ice Core record: A proposal by the INTIMATE group. J. Quat. Sci. 1998, 13, 283–292. [Google Scholar] [CrossRef]
  41. Blockley, S.P.E.; Lane, C.S.; Turney, C.S.M.; Ramsey, C.B. The INTegration of Ice core, MArine and TErrestrial records of the last termination (INTIMATE) 60,000 to 8000 BP. Quat. Sci. Rev. 2012, 36, 1. [Google Scholar]
  42. Blockley, S.P.E.; Lane, C.S.; Hardiman, M.; Rasmussen, S.O.; Seierstad, I.K.; Steffensen, J.P.; Svensson, A.; Lotter, A.F.; Turney, C.S.M.; Ramsey, C.B. Synchronisation of palaeoenvironmental records over the last 60,000 years, and an extended INTIMATE event stratigraphy to 48,000 b2k. Quat. Sci. Rev. 2012, 36, 2–10. [Google Scholar] [CrossRef]
  43. Rasmussen, S.O.; Andersen, K.K.; Svensson, A.M.; Steffensen, J.P.; Vinther, B.M.; Clausen, H.B.; Siggaard-Andersen, M.L.; Johnsen, S.J.; Larsen, L.B.; Dahl-Jensen, D.; et al. A new Greenland ice core chronology for the last glacial termination. J. Geophys. Res. 2006, 111, D6. [Google Scholar]
  44. Walker, M.J.C.; Björck, S.; Lowe, J.J.; Cwynar, L.; Johnsen, S.; Knudsen, K.L.; Wohlfarth, B. INTIMATE group. Isotopic ‘events’ in the GRIP ice core: A stratotype for the Late Pleistocene. Quat. Sci. Rev. 1999, 18, 1143–1150. [Google Scholar]
  45. Tămaş, T.; Onac, B.P.; Bojar, A.V. Lateglacial-Middle Holocene stable isotope records in two coeval stalagmites from the Bihor Mountains, NW Romania. Geol. Q. 2005, 49, 125–136. [Google Scholar]
  46. Onac, B.P. Mineralogical studies and Uranium-series dating of speleothems from Scarisoara Glacier Cave (Bihor Mountains, Romania). Theor. Appl. Karstol. 2001, 13–14, 33–38. [Google Scholar]
  47. Feurdean, A.; Perşoiu, A.; Tanţău, I.; Stevens, T.; Magyari, E.K.; Onac, B.P.; Marković, S.; Andrič, M.; Connor, S.; Fărcaş, S.; et al. Climate variability and associated vegetation response throughout Central and Eastern Europe (CEE) between 60 and 8 ka. Quat. Sci. Rev. 2014, 106, 206–224. [Google Scholar] [CrossRef] [Green Version]
  48. Feurdean, A.; Klotz, S.; Mosbrugger, V.; Wohlfarth, B. Pollen-based quantitative reconstruction of Holocene climate variability in NW Romania. Palaeogeogr. Palaeoclimatol. Palaeoecol. 2008, 260, 494–504. [Google Scholar] [CrossRef]
  49. Tóth, M.; Magyari, E.K.; Brooks, S.J.; Braun, M.; Buczkó, K.; Bálint, M.; Heiri, O. A chironomid-based reconstruction of late glacial summer temperatures in the southern Carpathians (Romania). Quat. Res. 2012, 77, 122–131. [Google Scholar] [CrossRef]
  50. Benyó-Korcsmáros, R.; Torma, A.; Gulyás, S.; Sümegi, P. Lotus from Nagyvárad: The question of the origin of the thermal water lily from Püspökfürdő. In Magyarok a Kárpát-Medencében 4. Régmúlt és Jelen: Tudományos Nemzetközi Konferencia Szeged, Magyarország: Egyesület Közép-Európa Kutatására; Szónokyné, A.G., Ed.; Innovariant Kft: Szeged, Hungary, 2020; pp. 97–103. [Google Scholar]
  51. Benyó-Korcsmáros, R.; Gulyás, S.; Bóni, Z.; Nagy, B.; Törőcsik, T.; Sümegi, P. Identification and environmental background of Chara remains in the Holocene sequence of Lake Pețea NW Romania. Archeometriai Műhely, 2023; in press. [Google Scholar]
  52. Benyó-Korcsmáros, R.; Gulyás, S.; Sebők, D.; Benyó, D.; Cseh, P.; Sümegi, P. Methodological add-ons to the non-destructive, micro-CT-based taxonomic-morphometric analysis of Chara remains. Geologos, 2023; in press. [Google Scholar]
  53. Bóni, Z. Kagylósrákok Taxonómiai, Paleoökológiai Vizsgálata a Püspökfürdői Szent László-tó Üledékeiből (Taxonomic and Paleoecological Analysis of Ostracod Remains from Lake Pețea, Püspökfürdő). Master’s Thesis, University of Szeged, Szeged, Hungary, 2022. (Unpublished work). [Google Scholar]
  54. Björkman, L.; Feurdean, A.; Wohlfarth, B. Late Glacial and Holocene vegetation development at Steregoiu in the Gutaiului Mountains, NW Romania. Rev. Palaeobot. Palynol. 2003, 124, 79–85. [Google Scholar]
  55. Feurdean, A.; Spessa, A.; Magyari, E.K.; Willis, K.J.; Veres, D.; Hickler, T. Trends in biomass burning in the Carpathian region over the last 15,000 years. Quat. Sci. Rev. 2012, 45, 111–123. [Google Scholar] [CrossRef]
  56. Feurdean, A.; Liakka, J.; Vannière, B.; Marinova, E.; Hutchinson, S.M.; Mosburgger, V.; Hickler, T. 12,000-Years of fire regime drivers in the lowlands of Transylvania (Central-Eastern Europe): A data-model approach. Quat. Sci. Rev. 2013, 81, 48–52. [Google Scholar] [CrossRef]
  57. Feurdean, A.; Gałka, M.; Tanţău, I.; Geantă, A.; Hutchinson, S.M.; Hickler, T. Tree and timberline shifts in the northern Romanian Carpathians during the Holocene and the responses to environmental changes. Quat. Sci. Rev. 2016, 134, 206–223. [Google Scholar]
  58. Constantin, S.; Bojar, A.V.; Lauritzen, S.E.; Lundberg, J. Holocene and Late Pleistocene climate in the sub-Mediterranean continental environment: A speleothem record from Poleva Cave (Southern Carpathians, Romania). Palaeogeogr. Palaeoclimatol. Palaeoecol. 2007, 243, 322–338. [Google Scholar] [CrossRef]
  59. Magyari, E.K.; Buczkó, K.; Jakab, G.; Braun, M.; Pál, Z.; Karátson, D.; Papp, P. Palaeolimnology of the last crater lake in the Eastern Carpathian Mountains—A multiproxy study of Holocene hydrological changes. Hydrobiologia 2009, 631, 29–63. [Google Scholar] [CrossRef]
  60. Buczkó, K.; Magyari, E.; Hübener, T.; Braun, M.; Bálint, M.; Tóth, M.; Lotter, A.F. Responses of diatoms to the Younger Dryas climatic reversal in a South Carpathian Mountain lake (Romania). J. Paleolimnol. 2012, 48, 417–431. [Google Scholar] [CrossRef]
  61. Perşoiu, I. Reconstruction of Holocene Geomorphological Evolution of Somesu Mic Valley. Ph.D. Thesis, “A. I. Cuza” University, Iasi, Romania, 2010. (Unpublished work). [Google Scholar]
  62. Howard, A.J.; Macklin, M.G.; Bailey, D.W.; Mills, S.; Andreescu, R. Late glacial and Holocene river development in the Teleorman Valley on the southern Romanian Plain. J. Quat. Sci. 2004, 19, 271–280. [Google Scholar] [CrossRef]
  63. Onac, B.P.; Constantin, S.; Lundberg, J.; Lauritzen, S.E. Isotopic climate record in a Holocene stalagmite from Ursilor Cave (Romania). J. Quat. Sci. 2002, 17, 319–327. [Google Scholar] [CrossRef]
  64. Mayewski, P.A.; Rohling, E.E.; Curt Stager, J.; Karlen, W.; Maasch, K.A.; Meeker, L.D.; Eric, A.; Meyerson, E.A.; Gasse, F.; Steig, E.J. Holocene climate variability. Quat. Res. 2004, 62, 243–255. [Google Scholar] [CrossRef]
  65. Tóth, M.; Magyari, E.K.; Buczkó, K.; Braun, M.; Panagiotopoulos, K.; Heiri, O. Chironomid-inferred Holocene temperature changes in the South Carpathians (Romania). Holocene 2015, 25, 569–582. [Google Scholar] [CrossRef] [Green Version]
  66. Grindean, R.; Feurdean, A.; Hurdu, B.; Fracas, S.; Tantau, I. Lateglacial/Holocene transition to mid-Holocene: Vegetation responses to climate changes in the Apuseni Mountains (NW Romania). Quat. Int. 2015, 388, 76–86. [Google Scholar] [CrossRef]
  67. Dragusin, V.; Staubwasser, M.; Hoffmann, D.L.; Ersek, V.; Onac, B.P.; Veres, D. Constraining Holocene hydrological changes in the Carpathian–Balkan region using speleothem 18O and pollen-based temperature reconstructions. Clim. Past Discuss. 2014, 10, 381–427. [Google Scholar] [CrossRef] [Green Version]
  68. Gałka, M.; Tanţău, I.; Ersek, V.; Feurdean, A. A 9000-year record of cyclic vegetation changes identified in a montane peatland deposit located in the Eastern Carpathians (Central-Eastern Europe): Autogenic succession or regional climatic influences? Palaeogeogr. Palaeoclimatol. Palaeoecol. 2016, 449, 1325–1336. [Google Scholar]
  69. van Geel, B.; van der Plicht, J.; Kilian, M.; Klaver, E.; Kouwenberg, J.; Renssen, H.; Reynaud-Farrera, I.; Waterbolk, H. The sharp rise of Delta C-14 ca, 800 cal BC: Possible causes, related climatic teleconnections and the impact on human environments. Radiocarbon 1998, 40, 535–550. [Google Scholar]
  70. Mauquoy, D.; van Geel, B.; Blaauw, M.; Speranza, A.; van der Plicht, J. Changes in solar activity and Holocene climatic shifts derived from 14C wiggle-match dated peat deposits. Holocene 2004, 14, 45–52. [Google Scholar]
  71. Gałka, M.; Miotk-Szpiganowicz, G.; Goslar, T.; Jęśko, M.; van der Knaap, O.W.; Lamentowicz, M. Palaeohydrology, fires and vegetation succession in the southern Baltic during the last 7500 years reconstructed from a raised bog based on multi-proxy data. Palaeogeogr. Palaeoclimatol. Palaeoecol. 2013, 370, 209–221. [Google Scholar] [CrossRef]
  72. Swindles, G.T.; Plunkett, G.; Roe, H.M. A delayed climatic response to solar forcing at 2800 cal. BP: Multi-proxy evidence from three Irish peatlands. Holocene 2007, 17, 177–182. [Google Scholar] [CrossRef]
  73. Feurdean, A.; Gałka, M.; Kuske, E.; Tanţău, I.; Lamentowicz, M.; Florescu, G.; Hutchinson, S.M.; Liakka, J.; Mulch, A.; Hickler, T. Last millennium hydro-climate variability in Central Eastern Europe (Northern Carpathians, Romania). Holocene 2015, 25, 1179–1192. [Google Scholar]
  74. Yates, T. Studies of non-marine mollusks for the selection of shell samples for radiocarbon dating. Radiocarbon 1986, 28, 457–463. [Google Scholar] [CrossRef] [Green Version]
  75. Pigati, J.S.; Quade, J.; Shahanan, T.M.; Haynes, C.V. Radiocarbon dating of minute gastropods and new constraints on the timing of late Quaternary spring-discharge deposits in southern Arizona, USA. Palaeogeogr. Palaeoclimatol. Palaeoecol. 2004, 204, 33–36. [Google Scholar]
  76. Rech, J.A.; Pigati, J.S.; Lehmann, S.B.; McGimpsey, C.M.; Grimley, D.A.; Nekola, J.C. Assessing open-system behavior of 14C in terrestrial gastropod shells. Radiocarbon 2011, 53, 325–335. [Google Scholar] [CrossRef] [Green Version]
  77. Evin, J.; Marechal, J.; Lyon, C.; Puissegur, J. Conditions involved in dating terrestrial shells. Radiocarbon 1980, 22, 545–556. [Google Scholar] [CrossRef] [Green Version]
  78. Goodfriend, A.G.; Stipp, J.J. Limestone and the problem of radiocarbon dating of land-snail shell carbonate. Geology 1983, 11, 575–577. [Google Scholar] [CrossRef]
  79. Goodfriend, G.A. Radiocarbon age anomalies in shell carbonate of land snails from semi-arid areas. Radiocarbon 1987, 29, 159–167. [Google Scholar] [CrossRef] [Green Version]
  80. Goodfriend, A.G.; Ellis, G.L.; Toolin, L.J. Radiocarbon age anomalies in land snail shells from Texas; ontogenetic, individual, and geographic patterns of variation. Radiocarbon 1999, 41, 149–156. [Google Scholar]
  81. Dong, J.; Cheng, P.; Eiler, J. Implications of the apparent 14C age of cultured Achatina fulica and the spatial features of 14C ages among modern land snail shells in China. Palaeogeogr. Palaeoclimatol. Palaeoecol. 2020, 545, 109654. [Google Scholar] [CrossRef]
  82. Rubin, M.; Likins, R.C.; Berry, E.G. On the validity of radiocarbon dates from snail shells. J. Geol. 1961, 71, 84–89. [Google Scholar] [CrossRef]
  83. Tamers, M.A. Validity of radiocarbon dates on terrestrial snail shells. Am. Antiq. 1970, 35, 94–100. [Google Scholar] [CrossRef]
  84. Romaniello, L.; Quarta, G.; Mastronuzzi, G.; D’Elia, M.; Calcagnile, L. 14C age anomalies in modern land snails shell carbonate from Southern Italy. Quat. Geochronol. 2008, 3, 68–73. [Google Scholar] [CrossRef]
  85. Xu, B.; Gu, Z.; Han, J.; Liu, Z.; Pei, Y.; Lu, Y.; Wu, N.; Chen, Y. Radiocarbon and stable carbon isotope analyses of land snails from the Chinese loess plateau environmental and chronological implications. Radiocarbon 2010, 52, 149–156. [Google Scholar] [CrossRef] [Green Version]
  86. Xu, B.; Gu, Z.; Han, J.; Hao, Q.; Lu, Y.; Wang, L.; Wu, N.; Pei, Y. Radiocarbon age anomalies of land snail shells in the Chinese Loess Plateau. Quat. Geochronol. 2011, 6, 383–395. [Google Scholar] [CrossRef]
  87. Pigati, J.S.; Rech, J.A.; Nekola, J.C. Radiocarbon dating of small terrestrial gastropod shells in North America. Quat. Geochronol. 2010, 5, 519–530. [Google Scholar] [CrossRef]
  88. Pigati, J.S.; McGeehin, J.P.; Muhs, D.R.; Bettis, E.A. Radiocarbon dating late Quaternary loess deposits using small terrestrial gastropod shells. Quat. Sci. Rev. 2013, 76, 114–126. [Google Scholar] [CrossRef] [Green Version]
  89. Pigati, J.S.; McGeehin, J.P.; Muhs, D.R.; Grimley, D.A.; Nekola, J.C. Radiocarbon dating loess deposits in the Mississippi Valley using terrestrial gastropod shells (Polygyridae, Helicinidae, and Discidae). Aeolian Res. 2015, 16, 25–42. [Google Scholar] [CrossRef] [Green Version]
Figure 1. Location view (a,b) and bedrock geology (c) of the study area and the stratigraphy of the 2012 profile of Lake Pețea (d) (note: the location of the 2012 borehole and the cross-section of the lake by Wolf (1863) is also presented (b) in addition to the position of 14C dated samples (d)).
Quaternary 06 00037 g001
Figure 2. Comparison of the two age–depth models created (a. Model 1: all dates, b. Model 2: charcoal dates only).
Quaternary 06 00037 g002
Figure 3. Results of sedimentological, magnetic susceptibility, and LOI analysis and calculated sedimentation times for the studied profile (note: abundances of thermophilous gastropod Theodoxus prevostianus from Sümegi et al. [3] are also depicted).
Quaternary 06 00037 g003
Figure 4. Scatterplot of the derived factors (F1 and F2) with identified clusters of samples compared to stratigraphic and grain-size data.
Quaternary 06 00037 g004
Table 1. Results of 14C dating.
Sample No.DepthLab codeMaterial14C Ages
(BP ± 1σ)
Calibrated Ages
(cal BP ± 2σ)
pMC
(± 1σ)
Reference
140 cmDeA-19820charcoal518 ± 23534 ± 3493.8 ± 0.268This study
40 cmDeA-11793gastropod shell22,156 ± 15626,432 ± 5306.34 ± 0.122This study
380 cmDeA-11794charcoal1900 ± 251802 ± 8278.9 ± 0.245This study
4100 cmDeA-11792gastropod shell23,178 ± 9427,456 ± 2305.58 ± 0.065This study
5120 cmDeA-19819charcoal3167 ± 233397 ± 5867.4 ± 0.193This study
6300 cmDeA-21049charcoal6480 ± 297373 ± 6444.6 ± 0.161This study
440 cmDeA-21047charcoal9038 ± 3310,212 ± 5232.5 ± 0.133This study
8540 cmDeA-21045charcoal9594 ± 3410,938 ± 21830.3 ± 0.128Sümegi et al. [5]
9560 cmDeA-21046charcoal9612 ± 3410,957 ± 22830.2 ± 0.128Gulyás et al. [1]
10580 cmDeA-21041charcoal9746 ± 3611,184 ± 10229.7 ± 0.133This study
11700 cmDeA-11790gastropod shell23,899 ± 10228,030 ± 3225.1 ± 0.064This study
12840 cmDeA-11791charcoal18,624 ± 7122,553 ± 2509.84 ± 0.086This study
Table 2. Bayesian-modeled 14C ages for all (Model 1) and charcoal data only (Model 2).
Sample No.DepthLab CodeMaterialModel 1
(cal BP ± 2σ)
Model 2
(cal BP ± 2σ)
140 cmDeA-19820charcoal2397 ± 591546 ± 59
240 cmDeA-11793gastropod shell2397 ± 591546 ± 59
380 cmDeA-11794charcoal2827 ± 5141808 ± 105
4100 cmDeA-11792gastropod shell3118 ± 3612608 ± 444
5120 cmDeA-19819charcoal3419 ± 2223376 ± 108
6300 cmDeA-21049charcoal7364 ± 1007369 ± 106
7440 cmDeA-21047charcoal9821 ± 3049844 ± 306
8540 cmDeA-21045charcoal10,848 ± 13610,869 ± 149
9560 cmDeA-21046charcoal11,020 ± 12311,048 ± 142
10580 cmDeA-21041charcoal11,195 ± 9811,255 ± 226
11700 cmDeA-11790gastropod shell12,477 ± 43413,939 ± 927
12840 cmDeA-11791charcoal13,960 ± 63717,081 ± 1382
Disclaimer/Publisher’s Note: The statements, opinions and data contained in all publications are solely those of the individual author(s) and contributor(s) and not of MDPI and/or the editor(s). MDPI and/or the editor(s) disclaim responsibility for any injury to people or property resulting from any ideas, methods, instructions or products referred to in the content.

