Abstract
Crop yield prediction is one of the crucial components of agriculture that plays an important role in the decision-making process for sustainable agriculture. Remote sensing provides the most efficient and cost-effective solution for the measurement of important agricultural parameters such as soil moisture level, but retrieval of the soil moisture contents from coarse resolution datasets, especially microwave datasets, remains a challenging task. In the present work, a machine learning-based framework is proposed to generate the enhanced resolution soil moisture products, i.e., classified maps and change maps, using an optical-based moderate resolution imaging spectroradiometer (MODIS) and microwave-based scatterometer satellite (SCATSAT-1) datasets. In the proposed framework, nearest-neighbor-based image fusion (NNIF), artificial neural networks (ANN), and post-classification-based change detection (PCCD) have been integrated to generate thematic and change maps. To confirm the effectiveness of the proposed framework, random forest post-classification-based change detection (RFPCD) has also been implemented, and it is concluded that the proposed framework achieved better results (88.67–91.80%) as compared to the RFPCD (86.80–87.80%) in the computation of change maps with σ°-HH. This study is important in terms of crop yield prediction analysis via the delivery of enhanced-resolution soil moisture products under all weather conditions.
1. Introduction
In agriculture, crop yield estimation is essential to improving productivity, food security, and the decision-making process [1]. The growing population of the world is also one of the major concerns related to food security. As per the Food and Agriculture Organization (FAO) report, there will be a 60% increment in the demand for food-to-supply ration by 2050. As per the United Nations (UN) Sustainable Development Goals (SDGs), food security and the promotion of sustainable agriculture are important to end hunger [2]. Thus, there is an urgent requirement for enhancing crop yield production to meet the current as well as future requirements of the world [3,4]. There are many factors involved in crop yield prediction analysis, but it remains challenging to develop a perfect prediction model [5,6].
As an important component of crop yield prediction, soil moisture plays a vital role in energy and water exchanges at the land surface and atmosphere interface [7]. In addition to crop yield prediction, the soil moisture parameter is also utilized in many other prediction models, such as weather forecasting, soil erosion, drought warning, and flood estimation. Therefore, continuous and accurate monitoring of soil moisture at a global level is essential to be monitored for many applications. However, continuous and reliable soil moisture measurements at the global or national level are one of the most challenging tasks [8]. Some authors highlighted the challenges in soil moisture retrieval over vegetated areas, which could be improved by utilizing change detection or image fusion-based approaches [7,9].
In the past few decades, remote sensing technology has made a significant contribution to the monitoring and management of agricultural land on a larger scale [10]. Remote sensing allows the acquisition of earth surface information in multispectral bands via optical sensors and backscattered coefficients via microwave sensors. Both sensors have their features and limitations in delivering reliable information. The optical sensors are very useful in the identification of crop diseases via the visible infrared (IR) spectral band because this region of the spectrum is very sensitive to crop vigor, damage, and stress. However, the major problem associated with optical bands included the impact of clouds on satellite imagery because optical bands cannot penetrate through clouds. In such situations, microwave sensors are very useful to acquire the earth’s surface information in microwave regions with day-night capability under rainy and extreme weather conditions. To retrieve the soil moisture, various microwave sensors were reported in the literature, such as synthetic aperture radar (SAR) [11,12], Ku-band-based QuikSCAT [13,14], C-band-based advanced microwave instrument (AMI) [15,16,17,18,19], special sensor microwave imager (SSM/I) data [20,21], L-band based soil moisture and ocean salinity (SMOS) mission [22,23], advanced microwave scanning radiometer-2 (AMSR-2) [24,25,26], and soil moisture active and passive (SMAP) [27,28,29]. However, microwave sensors face the problem of coarse resolution within the range of 25–50 km, which limits the applicability of microwave imagery.
With advanced computing models, there is the possibility of developing high-resolution soil moisture products at the global level using different remote sensing datasets. Amongst the various scatterometers [30], the scatterometer satellite (SCATSAT-1) made a significant contribution to agriculture applications [31], such as high-resolution soil moisture product development [7,32], leaf area index (LAI) estimation [33,34], paddy crop estimation [8,12,35,36,37,38], and jute crop estimation [39]. A summary of state-of-the-art approaches for crop phenology and soil moisture studies using SCATSAT-1 is shown in Table 1. The SCATSAT-1 offers a variety of enhanced resolution (up to 2 km) operational products for different scientific domains such as agriculture, cryosphere, hydrology, and oceanography [33,40,41,42,43,44,45,46]. Some of the authors highlighted the technical details, preprocessing, and calibration/validation of the SCATSAT-1 dataset [47,48,49]. To compensate for the lack of high spatial resolution remote sensing images, the fusion of SCATSAT-1 with MODIS data via machine learning models allows the finer resolution of soil moisture products. The daily-based enhanced resolution products can be utilized in the identification of different crops, the assessment of crop conditions, and the estimation of crop yields. Accurate predictions of crop yields are essential to farmers’ production plans and the various policy decisions related to trading and food security.

Table 1.
A summary of state-of-the-art approaches developed for crop phenology and soil moisture studies using the SCATSAT-1 dataset.
The main focus of this article is to generate the enhanced resolution soil moisture products and also generate the change maps to analyze the variations between soil moisture classified maps. Therefore, the objectives included: (a) fusion of the optical-based MODIS dataset and microwave-based SCATSAT-1 dataset; (b) develop a framework based on NNIF and ANN to generate the soil moisture classified maps; (c) generating post-classification-based change detection (PCCD) based change maps for accurate crop yield change products for crop yield; (d) analysis the impact of the proposed framework on different SCATSAT-1 parameters, i.e., σ°-HH (sigma-naught at horizontal-transmit and horizontal-receive polarization), σ°-VV (sigma-naught at vertical-transmit and vertical-receive polarization), γ°-HH (gamma-naught at horizontal-transmit and horizontal-receive polarization), and γ°-VV (gamma-naught at vertical-transmit and vertical-receive polarization); and (e) comparing the performance of the proposed framework with random forest post-classification-based change detection (RFPCD) using various performance metrics.
2. Material and Methods
2.1. Study Location and Satellite Dataset
Punjab State, India, has been selected as the study location with geographical coordinates of 29°0′0″–33°0′0″ N and 73°0′0″–77°0′0″ E (Figure 1).
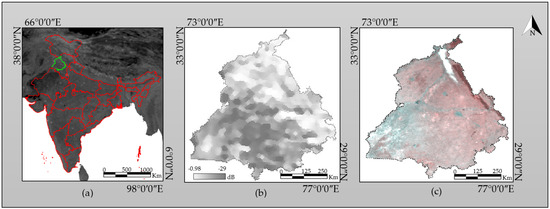
Figure 1.
Representation of study site: (a) Indian map (in red and green color boundary lines) highlighted the Punjab State, India (with green color); (b) study site acquired using SCATSAT-1 (sigma-nought-σ°); and (c) MODIS (MOD02 at RGB-621) data product on 20 November 2019.
This Indian state made a significant contribution to food grain production and agriculture development and was also the pioneer in India’s “green revolution.” The major crops of the region included barley, wheat, rice, maize, and sugarcane. As per the national statistics, Punjab state contributed 29% of rice and 38% of wheat during the year 2016–2017, making India self-reliant in food production. The satellite dataset was acquired on three different dates, i.e., 20 November 2019, 20 December 2019, and 20 January 2020, from two different satellite sensors. The optical-based NASA’s MODIS data were acquired from Level-1 and the Atmosphere Archive and Distribution System Distributed Active Archive Center (LAADS DAAC) online web portal (https://ladsweb.modaps.eosdis.nasa.gov/, accessed on 20 November 2022) (See Figure 2). Additionally, microwave ISRO’s SCATSAT-1 (Level-4) data were acquired from the Meteorological and Oceanographic Satellite Data Archival Centre (MOSDAC) online portal (https://www.mosdac.gov.in/, accessed on 20 November 2022) (See Figure 3).
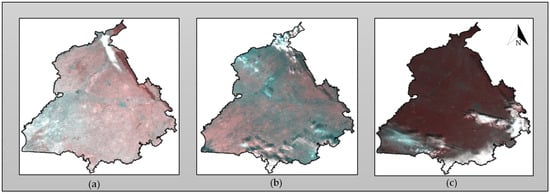
Figure 2.
Input datasets acquired from MODIS (MOD02 Product) on (a) 20 November 2019; (b) 20 December 2019; and (c) 20 January 2020.
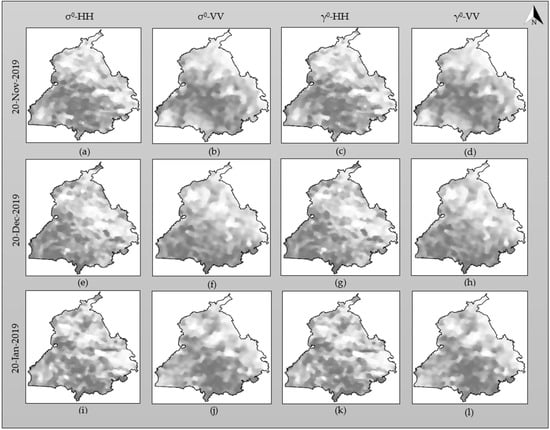
Figure 3.
Input datasets acquired from SCATSAT-1 (level-4) on (a–d) 20 November 2019; (e–h) 20 December 2019; and (i–l) 20 January 2020 using different parameters, i.e., σ°-HH, σ°-VV, γ°-HH, and γ°-VV.
2.2. Methodology
From Figure 4, the methodology of the proposed framework included: (a) preprocessing of the input dataset; (b) NNIF-based fusion of optical (MODIS) and microwave (SCATSAT-1) datasets; (c) PCCD using ANN; and (d) validation of classified and change maps using the SMAP dataset.
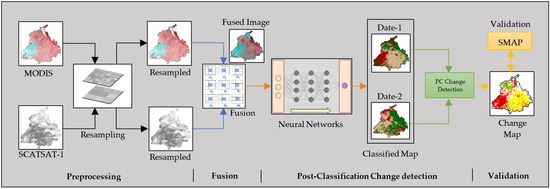
Figure 4.
A proposed flowchart of methodology for the generation and validation of enhanced-resolution soil moisture classified and change maps.
2.2.1. Preprocessing of Optical and Microwave Dataset
The SCATSAT-1 measures the Earth’s surface information in THE form of backscattered coefficients, i.e., sigma-naught (σ°) and gamma-naught (γ°). Both the backscattered coefficients offer information in two different polarization modes, i.e., HH and VV. The SCATSAT-1 level-4 India product is available at an enhanced resolution of 2 km, while MODIS data are available at a spatial resolution of 500 m (1–7 bands). Therefore, both datasets need to be resampled beforehand at the same resolution of 500 m for the fusion process. To resample the input dataset, the nearest-neighbor resampling method was utilized, in which each pixel in the resampled image acquires the same value as its nearest-neighbor pixel value in the original image. It is noteworthy that in the present work, all the backscattered coefficients along with different polarization modes have been considered to generate the soil moisture classification and change maps.
2.2.2. Nearest-Neighbor-Based Image Fusion (NNIF)
After the preprocessing of optical and microwave datasets, both images were fused using the nearest-neighbor-based image fusion (NNIF) algorithm [50]. There are two main objectives of the fusion of microwave and optical datasets. The first is to enhance the resolution of the input dataset, and the second is to integrate the features of the microwave dataset with optical datasets [51]. However, there are many challenges involved in the fusion of the microwave and optical datasets, such as spectral distortion in the optical dataset and different atmospheric conditions and periods in the acquisition processes of both datasets [52]. However, various fusion methods were reported in the literature to fuse the optical and microwave datasets, such as brovey transformation (BT) [53], Gram–Schmidt (GS) [54], principal component analysis (PCA) [55], intensity hue saturation (IHS) [56], Ehler’s transformation (ET) [57], wavelet principal component analysis (WPCA) [58], and many more [59,60,61,62,63,64,65]. As per the previous literature, the NNIF algorithm is best suited for the fusion of scatterometer and MODIS datasets as compared to well-defined fusion techniques such as BT, GS, and ET. Therefore, in the present work, we have implemented the NNIF to fuse the SCATSAT-1 and MODIS data for the retrieval of soil moisture maps. To implement the NNIF, both datasets must be accurately geo-registered and resampled at the same resolution to avoid the problem of misalignment due to the multisensory dataset. Once the prerequisites are accomplished, the difference factor of the nearest-neighbor is estimated as follows:
where parameters, i.e., , represented the region of nearest-neighbor pixels () in multispectral data, and , represented the region of the pixel in microwave data. The parameter is the number of spectral bands. Afterward, the datasets are fused using the following equation:
where the parameters represented the normalized factor; and representing the intensity smoothness and spatial smoothness factors, respectively. The parameters represented the spectrum vector of nearest neighbor pixels . The parameters and represented the similarity measure and spatial closeness measure of its neighboring pixels, respectively. The term is the spectral photometric contribution vector.
2.2.3. Post-Classification-Based Change Detection (PCCD) Using ANN
To generate the change maps, the post-classification change detection (PCCD) technique has been followed [66]. This approach has been implemented in two different steps, i.e., classification and change detection. Initially, the fused dataset was classified using an ANN-based classifier to classify the different levels of soil moisture in satellite imagery [67]. To process the ANN, the network parameters are selected as logistic activation function, training threshold (0.82 value), training rate (0.20 value), training momentum (0.70 value), RMS exit criteria (0.1), six input nodes (MODIS bands 1–4, 6 and 7; it is noted that the 5th band was removed due to strip error), three output nodes (low, mid and high values of soil moisture), and iterations (800). The ANN is one of the options for handling complex patterns and prediction problems due to its flexible approach and unique approximation potential to capture complex nonlinear behaviors. Afterward, the classified dataset of multitemporal dates is processed via post-classification comparison to generate the soil moisture change maps. The PCCD approach takes the advantages of straightforwardness and simplicity and removes the requirement of strict radiometric errors. However, this technique may face the problem the classification errors.
2.2.4. Validation and Cross-Referencing
Once the classification and change maps are generated, there is the requirement of validating the outcomes with respect to the existing data sources to understand the applicability of the generated data. Therefore, the accuracy assessment was conducted and computed for each class as well as the change map. The important parameters of the accuracy assessment included: (a) producer’s accuracy (PA); (b) user’s accuracy; (c) omission error (OE); (d) commission error (CE); (e) overall accuracy (OA); and (f) kappa coefficient [68]. In the accuracy assessment procedure, more than 250 samples have been selected for each class category using a stratified random sampling procedure [69,70,71]. To validate the outcomes, SMAP-enhanced Level-2 radiometer surface soil moisture (derived from SMAP Level-1B) data has been acquired at a resolution of 9 km from the online web portal (https://search.earthdata.nasa.gov/, accessed on 20 November 2022). The SMAP delivers the soil moisture and freeze/thaw state from space for all non-liquid water surfaces globally within the top layer of the Earth.
Moreover, the outcomes of the proposed framework have also been compared with the well-known random forest post-classification-based change detection (RFPCD). As a powerful and versatile supervised machine learning algorithm, the random forest is also known as the random decision forest. It operates by constructing a multitude of decision trees on various subsets of the given dataset and taking the average to improve the predictive accuracy. The random forest-based classified multitemporal input datasets are compared together to generate the change maps. This method is very commonly used for handling complex or big data problems. Nonetheless, the major problem associated with RFPCD is that due to a large number of trees, the algorithms become slower and less efficient in handling real-time scenarios.
3. Results and Discussion
To assess the performance of the proposed framework, the qualitative (visual) and quantitative were computed. To explore the potential of the SCATSAT-1 dataset, all the parameters of SCATSAT-1 (Level-4) have been considered i.e., σ°-HH, σ°-VV, γ°-HH, and γ°-VV. Moreover, the comparative analysis of the proposed framework has also been performed with a well-defined RFPCD algorithm with respect to various SCATSAT-1 parameters (σ°-HH, σ°-VV, γ°-HH, and γ°-VV). The NNIF allows the fusion of microwave-based SCATSAT-1 (level 4) and optical-based MODIS (MOD02) images as shown in Figure 5a–d for 20 November 2019, Figure 5e–h) for 20 December 2019, and Figure 5i–l 20 January 2020 using different parameters, i.e., σ°-HH, σ°-VV, γ°-HH, and γ°-VV. The visual interpretation of fused images allows for the potential of various parameters of the SCATSAT-1 in cloud removal. The fused datasets integrate the features of both MODIS and SCATSAT-1 in the generation of enhanced-resolution products. But some of the cloud impacts can also be visualized, which may be due to the problem of misalignment as both images were acquired from different sensors. Moreover, the acquisition parameters of different imaging sensor systems are not similar, which may raise errors in the outcomes.
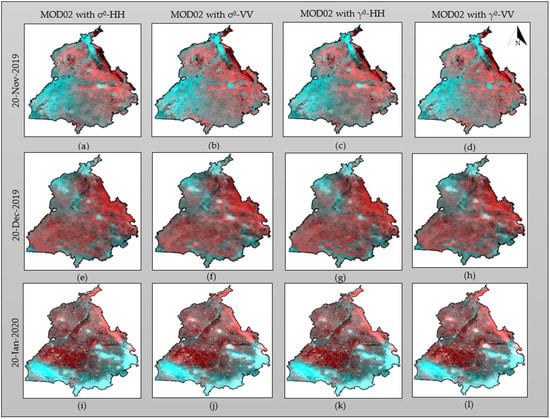
Figure 5.
Image fusion of SCATSAT-1 (level 4) and MODIS (MOD02) of images (a–d) from 20 November 2019; (e–h) from 20 December 2019; and (i–l) from 20 January 2020 using different parameters, i.e., σ°-HH, σ°-VV, γ°-HH, and γ°-VV.
To generate the change maps from PCCD, the fused datasets of multitemporal inputs are classified using ANN. ANN generally generates two types of datasets, i.e., rule maps and classified maps, as shown in Figure 6 and Figure 7, respectively. The classified maps are actual outcomes, but if the outcomes are not satisfactory, then rule maps can be used to regenerate the classified outcomes without reperforming the classification. Figure 6 represents the ANN rule maps generated from the fused dataset (SCATSAT-1 and MODIS) for (a–d) 20 November 2019; (e–h) 20 December 2019; and (i–l) 20 January 2020 using different parameters, i.e., σ°-HH, σ°-VV, γ°-HH, and γ°-VV. In the rule maps, each class category is represented in grayscale, and a multiclass image can be visualized by putting each class in different RGB (red, green, and blue) planes. In Figure 6, the RGB planes carried different information (i.e., red: high level of soil moisture, blue: mid-level of soil moisture, green: high level of soil moisture). Figure 7 represents the ANN-based classified maps generated from the fused dataset (SCATSAT-1 and MODIS) for (a–d) 20 November 2019; (e–h) 20 December 2019; and (i–l) 20 January 2020 using different parameters, i.e., σ°-HH, σ°-VV, γ°-HH, and γ°-VV.
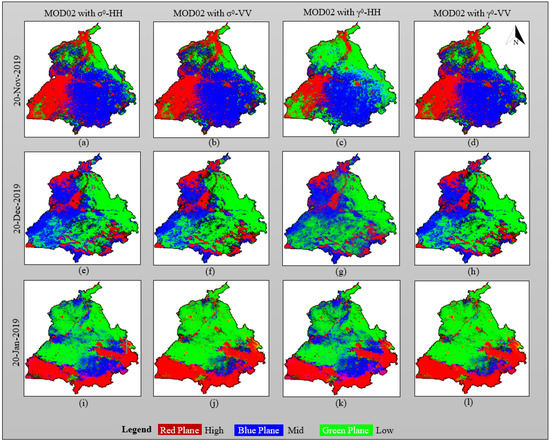
Figure 6.
ANN rule maps generated from the fused dataset (SCATSAT-1 and MODIS) for (a–d) 20 November 2019; (e–h) 20 December 2019; and (i–l) 20 January 2020 using different parameters, i.e., σ°-HH, σ°-VV, γ°-HH, and γ°-VV.
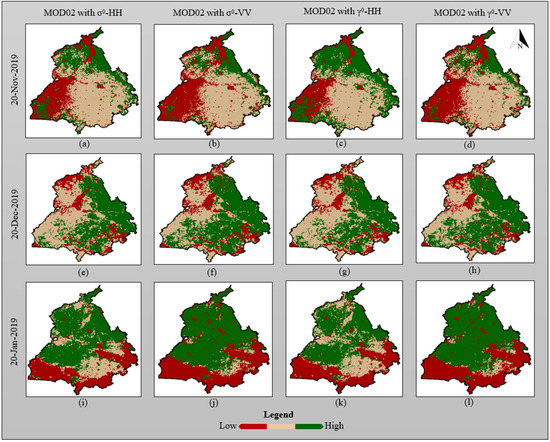
Figure 7.
ANN-based classified maps generated from the fused dataset (SCATSAT-1 and MODIS) for (a–d) 20 November 2019; (e–h) 20 December 2019; and (i–l) 20 January 2020 using different parameters, i.e., σ°-HH, σ°-VV, γ°-HH, and γ°-VV.
Afterward, multitemporal change maps have been generated from the fused classified dataset using the PCCD approach, as shown in Figure 8. The multitemporal change maps represent the variations in moisture level either in the positive direction, i.e., increment in soil moisture (represented with green color), or the negative direction, i.e., decrement in soil moisture (represented with maroon color). If the value is equal to zero, then no change has been observed between two multitemporal dates.
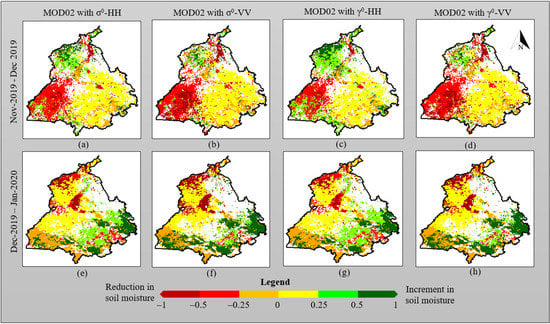
Figure 8.
PCCD change maps generated from the fused dataset (SCATSAT-1 and MODIS) for (a–d) November 2019–December 2019 and (e–h) December 2019–January 2020 using different parameters, i.e., σ°-HH, σ°-VV, γ°-HH, and γ°-VV (Note: SM: Soil Moisture).
To confirm the effectiveness of PCCD, a comparative analysis has also been performed with the RFPCD algorithm. It must be noted that the RFPCD algorithm has been implemented on the fused dataset (SCATSAT-1 and MODIS) for (a–d) 20 November 2019; (e–h) 20 December 2019; and (i–l) 20 January 2020 using different parameters, i.e., σ°-HH, σ°-VV, γ°-HH, and γ°-VV as shown in Figure 9. Afterward, multitemporal change maps have been generated from the fused classified dataset using the RFPCD approach, as shown in Figure 10.
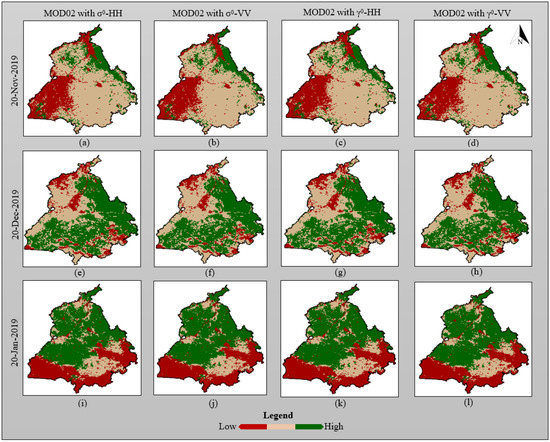
Figure 9.
Random forest-based classified maps were generated from the fused dataset (SCATSAT-1 and MODIS) for (a–d) 20 November 2019; (e–h) 20 December 2019; and (i–l) 20 January 2020 using different parameters, i.e., σ°-HH, σ°-VV, γ°-HH, and γ°-VV.
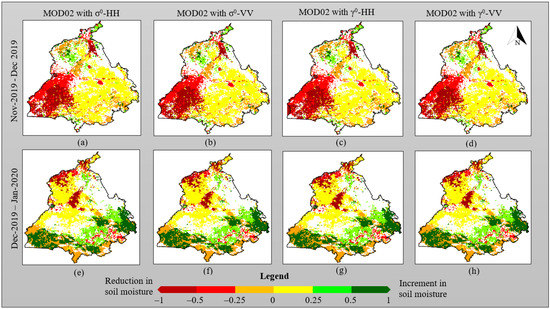
Figure 10.
RFPCD change maps generated from the fused dataset (SCATSAT-1 and MODIS) for (a–d) November 2019–December 2019 and (e–h) December 2019–January 2020 using different parameters, i.e., σ°-HH, σ°-VV, γ°-HH, and γ°-VV (Note: SM: Soil Moisture).
The quantitative analysis allows us to judge the effectiveness of our proposed technique statistically, which is better than visual interpretation. Therefore, accuracy assessments have been computed for each classified and changed map. Table 2 and Table 3 represent the accuracy assessment of classified maps and change maps, respectively, computed from ANN-PCCD. From Table 2, it has been seen that on all dates, the parameter σ°-HH achieved better accuracy (on 20 November 2019, OA = 94.92, kappa = 0.9234; on 20 December 2019, OA = 92.97, kappa = 0.8939; and on 20 January 2020, OA = 94.14, kappa = 0.9116) as compared to other SCATSAT-1 parameters (i.e., σ°-VV, γ°-HH, and γ°-VV). Moreover, it has also been apparent that for all parameters, more than 90.23% overall accuracy and less than 12.79% error have been observed. These outcomes may be satisfactory enough to generate the change maps.

Table 2.
Accuracy assessment of annotated classified maps from different parameters.

Table 3.
Accuracy assessment of change maps generated from different parameters.
From the outcomes of ANN-PCCD change maps (Table 3), it has been seen that more than 88% accuracy has been achieved in change maps computed using different SCATSAT-1 parameters, i.e., σ°-HH, σ°-VV, γ°-HH, and γ°-VV. However, the parameter σ°-HH achieved marginally better accuracy (in November 2019–December 2019, OA = 91.80%, kappa = 0.8997; and in December 2019–January 2020, OA = 88.67%, kappa = 0.8597) as compared to other SCATSAT-1 parameters (i.e., σ°-VV, γ°-HH, and γ°-VV).
For the comparative analysis, the accuracy assessment has also been computed for RFPCD classified and change maps, as shown in Table 4 and Table 5, respectively. From the classified outcomes of classified maps (Table 4), more than 90% accuracy has been achieved with the SCATSAT-1 σ°-HH parameter as compared to other SCATSAT-1 parameters, i.e., σ°-VV, γ°-HH, and γ°-VV. From the change map outcomes of classified maps (Table 4), marginally better accuracy (86.80–87.60%) has been achieved with the SCATSAT-1 σ°-HH parameter as compared to other SCATSAT-1 parameters, i.e., σ°-VV, γ°-HH, and γ°-VV.

Table 4.
Accuracy assessment of random forest classified maps from different parameters.

Table 5.
Accuracy assessment of RFPCD change maps generated from different parameters.
The variability in climate is continuously reducing soil moisture and decreasing crop yield. As an essential part of and an indicator of crop yield, the soil moisture level is essential to be monitored continuously and accurately at the global level for planned food production. The proposed framework allows the production of enhanced-resolution soil moisture products using a multisensory remote sensing dataset. Due to the potential of the microwave dataset for penetration through the clouds and its sensitivity towards the water contents within the soil, active microwave-based SCATSAT-1 is very useful in the real-time estimation of soil moisture. From the comparative analysis (Table 2, Table 3, Table 4 and Table 5), it is apparent that ANN-PCCD performed well enough not only in classifying outcomes but also in generating change maps as compared to the RFPCD algorithm.
Moreover, the ANN-PCCD has also controlled the error rate (OE and CE) to a great extent as compared to the RFPCD algorithm. However, it still needs to be improved with the incorporation of advanced methods or the fusion of high spatial resolution on a larger scale. As far as the different parameters of SCATSAT-1 are concerned, the γ° as a normalized form of the radar backscattered coefficient (σ°) may overcome the range-dependency issues in SCATSAT-1. Nevertheless, in the present work, better outcomes have been received with σ°. As a major characteristic of an electromagnetic (EM) signal, polarization (HH or VV) highlights the different features of the Earth’s surface and is highly dependent on structural variation or surface roughness [72]. In the present work, the soil moisture products were generated marginally better with HH polarization as compared to VV polarization.
With the proposed framework, an enhanced resolution of SCATSAT-1 soil moisture products can be achieved through the fusion of MODIS and SCATSAT-1 datasets. The major advantages of both datasets included: (a) free accessibility; (b) daily data delivery; and (c) global-level coverage [53]. Therefore, this combination of multisensory fusion enhances the applicability of the proposed framework for the effective measurement of soil moisture contents. Further, it also helps in delivering essential information on the growing crops and their environment, allowing the farmers to understand the adequate requirement of irrigation in the crop yield. The PCCD is straightforward in processing the fused dataset and also avoids radiometric errors. However, multisensory fusion creates many problems, such as spatial/spectral distortion, multiplicative speckle noise, and improper registration [52]. Therefore, future work may include the incorporation of deep learning, data mining, and big data processing.
4. Conclusions
This work presents a framework based on the integration of NNIF and ANN-PCCD for crop yield estimation using optical-based MODIS and microwave-based SCATSAT-1. In this study, various parameters of SCATSAT-1, i.e., σ°-HH, σ°-VV, γ°-HH, and γ°-VV, have been demonstrated for the effective retrieval of soil moisture. Moreover, the outcomes of the proposed framework have also been compared with those of a well-defined RFPCD. The experimental outcomes confirm the effectiveness of the proposed framework in the production of enhanced-resolution soil moisture operational classified maps (more than 90% overall accuracy) as well as change maps (more than 88% overall accuracy). However, the commission and omission errors are still high in the change map production, which may need to be addressed via more advanced models in the feature extraction and data representation. However, the incorporation of deep neural networks with high spatial resolution datasets may allow an improvement in the commission and omission errors. The daily-based enhanced-resolution soil moisture products allow farmers to address the emerging challenges in food security, particularly in crop yield prediction. This study also highlights the crucial role of multisensory remote sensing datasets for crop monitoring and yield prediction.
Author Contributions
R.K.: Conceptualization methodology, Algorithm formulation, Investigation, Original draft preparation, and Validations; R.K.T.: Supervision and Visualization; R.M.: Supervision and Visualization; S.S.: Reviewing, Editing, and Revision. All authors have read and agreed to the published version of the manuscript.
Funding
This research work is financially supported by the Teachers Associateship for Research Excellence (TARE) Project (Grant no. TAR/2019/000354) by the Science and Engineering Research Board (SERB), Govt. of India.
Institutional Review Board Statement
Not applicable.
Informed Consent Statement
Not applicable.
Data Availability Statement
The optical-based NASA’s (National Aeronautics and Space Administration) Moderate Resolution Imaging Spectroradiometer (MODIS) data were acquired from Level-1 and the Atmosphere Archive and Distribution System Distributed Active Archive Center (LAADS DAAC) online web portal (https://ladsweb.modaps.eosdis.nasa.gov/ (accessed on 20 November 2022)) and microwave data from ISRO’s (Indian Space Research Organisation) SCATSAT-1 (Level-4) were acquired from the Meteorological and Oceanographic Satellite Data Archival Centre (MOSDAC) online portal (https://www.mosdac.gov.in/ (accessed on 5 January 2022)).
Acknowledgments
The authors would like to thank the Meteorological and Oceanographic Satellite Data Archival Centre (MOSDAC), and the Indian Space Research Organization (ISRO) for providing the Scatterometer Satellite (SCATSAT-1) data. We would also like to thank the Land Processes Distributed Active Archive Center (LP-DAAC), the National Aeronautics and Space Administration (NASA) for providing the Moderate Resolution Imaging Spectroradiometer (MODIS) data, the Alaska Satellite Facility (ASF), and the National Snow and Ice Data Center (NSIDC) for providing the soil moisture active and passive (SMAP) data for validation purposes. Thanks are due to the anonymous reviewers for their constructive comments and suggestions to improve the earlier version of the manuscript.
Conflicts of Interest
We wish to confirm that there are no known conflict of interest associated with this publication, and there has been no significant financial support for this work that could have influenced its outcome.
References
- Anbananthen, K.S.M.; Subbiah, S.; Chelliah, D.; Sivakumar, P.; Somasundaram, V.; Velshankar, K.H.; Khan, M.K.A.A. An Intelligent Decision Support System for Crop Yield Prediction Using Hybrid Machine Learning Algorithms. F1000Research 2021, 10, 1143. [Google Scholar] [CrossRef] [PubMed]
- Singh, G.; Singh, S.; Sethi, G.; Sood, V. Deep Learning in the Mapping of Agricultural Land Use Using Sentinel-2 Satellite Data. Geographies 2022, 2, 691–700. [Google Scholar] [CrossRef]
- Muruganantham, P.; Wibowo, S.; Grandhi, S.; Samrat, N.H.; Islam, N. A Systematic Literature Review on Crop Yield Prediction with Deep Learning and Remote Sensing. Remote Sens. 2022, 14, 1990. [Google Scholar] [CrossRef]
- Kheir, A.M.S.; Alkharabsheh, H.M.; Seleiman, M.F.; Al-Saif, A.M.; Ammar, K.A.; Attia, A.; Zoghdan, M.G.; Shabana, M.M.A.; Aboelsoud, H.; Schillaci, C. Calibration and Validation of AQUACROP and APSIM Models to Optimize Wheat Yield and Water Saving in Arid Regions. Land 2021, 10, 1375. [Google Scholar] [CrossRef]
- Sishodia, R.P.; Ray, R.L.; Singh, S.K. Applications of Remote Sensing in Precision Agriculture: A Review. Remote Sens. 2020, 12, 3136. [Google Scholar] [CrossRef]
- Chlingaryan, A.; Sukkarieh, S.; Whelan, B. Machine Learning Approaches for Crop Yield Prediction and Nitrogen Status Estimation in Precision Agriculture: A Review. Comput. Electron. Agric. 2018, 151, 61–69. [Google Scholar] [CrossRef]
- Murugan, D.; Maurya, A.K.; Garg, A.; Singh, D. A Framework for High-Resolution Soil Moisture Extraction Using SCATSAT-1 Scatterometer Data. IETE Tech. Rev. (Inst. Electron. Telecommun. Eng. India) 2020, 37, 147–156. [Google Scholar] [CrossRef]
- Chaube, N.R.; Chaurasia, S.; Tripathy, R.; Pandey, D.K.; Misra, A.; Bhattacharya, B.K.; Chauhan, P.; Yarakulla, K.; Bairagi, G.D.; Srivastava, P.K.; et al. Crop Phenology and Soil Moisture Applications of SCATSAT-1. Curr. Sci. 2019, 117, 1022–1031. [Google Scholar] [CrossRef]
- Sun, C.; Bian, Y.; Zhou, T.; Pan, J. Using of Multi-Source and Multi-Temporal Remote Sensing Data Improves Crop-Type Mapping in the Subtropical Agriculture Region. Sensors 2019, 19, 2401. [Google Scholar] [CrossRef]
- Mazzia, V.; Khaliq, A.; Chiaberge, M. Improvement in Land Cover and Crop Classification Based on Temporal Features Learning from Sentinel-2 Data Using Recurrent-Convolutional Neural Network (R-CNN). Appl. Sci. 2020, 10, 238. [Google Scholar] [CrossRef]
- Li, K.; Yang, Z.; Shao, Y.; Liu, L.; Zhang, F. Rice Phenology Retrieval Automatically Using Polarimetric SAR. In Proceedings of the 2016 IEEE International Geoscience and Remote Sensing Symposium (IGARSS), Beijing, China, 10–15 July 2016; pp. 5674–5677. [Google Scholar]
- Tripathy, R.; Bhattacharya, B.K.; Tahlani, P.; Gaur, P.; Ray, S.S. Rice Grain Yield Estimation over Some Asian Countries Using ISRO’s SCATSAT-1 Ku-Band Scatterometer Data. Int. Arch. Photogramm. Remote Sens. Spat. Inf. Sci. ISPRS Arch. 2019, 42, 257–262. [Google Scholar] [CrossRef]
- Oveisgharan, S.; Haddad, Z.; Turk, J.; Rodriguez, E.; Li, L. Soil Moisture and Vegetation Water Content Retrieval Using QuikSCAT Data. Remote Sens. 2018, 10, 636. [Google Scholar] [CrossRef]
- Mladenova, I.; Lakshmi, V.; Walker, J.P.; Long, D.G.; De Jeu, R. An Assessment of QuikSCAT Ku-Band Scatterometer Data for Soil Moisture Sensitivity. IEEE Geosci. Remote Sens. Lett. 2009, 6, 640–643. [Google Scholar] [CrossRef]
- Wagner, W.; Lemoine, G.; Rott, H. A Method for Estimating Soil Moisture from ERS Scatterometer and Soil Data. Remote Sens. Environ. 1999, 70, 191–207. [Google Scholar] [CrossRef]
- Kumar, P.; Gairola, R.M. Fostering the Need of L-Band Radiometer for Extreme Oceanic Wind Research. IEEE Trans. Geosci. Remote Sens. 2022, 60, 4103906. [Google Scholar] [CrossRef]
- Hasenauer, S.; Wagner, W.; Scipal, K.; Naeimi, V.; Bartalis, Z. Implementation of near Real-Time Soil Moisture Products in the SAF Network Based on MetOp ASCAT Data. In Proceedings of the Eumetsat Meteorological Satellite Conference 2006, Helsinki, Finland, 12–16 June 2006. [Google Scholar]
- Wagner, W.; Hahn, S.; Kidd, R.; Melzer, T.; Bartalis, Z.; Hasenauer, S.; Figa-Saldaña, J.; de Rosnay, P.; Jann, A.; Schneider, S.; et al. The ASCAT Soil Moisture Product: A Review of Its Specifications, Validation Results, and Emerging Applications. Meteorol. Z. 2013, 22, 5–33. [Google Scholar] [CrossRef]
- Vreugdenhil, M.; Dorigo, W.A.; Wagner, W.; de Jeu, R.A.M.; Hahn, S.; van Marle, M.J.E. Analyzing the Vegetation Parameterization in the TU-Wien ASCAT Soil Moisture Retrieval. IEEE Trans. Geosci. Remote Sens. 2016, 54, 3513–3531. [Google Scholar] [CrossRef]
- Oza, S.R.; Parihar, J.S. Evaluation of Ku-Band QuikSCAT Scatterometer Data for Rice Crop Growth Stage Assessment. Int. J. Remote Sens. 2007, 28, 3447–3456. [Google Scholar] [CrossRef]
- Macelloni, G.; Paloscia, S.; Pampaloni, P.; Santi, E. Global Scale Monitoring of Soil and Vegetation Using SSM/I and ERS Wind Scatterometer. Int. J. Remote Sens. 2003, 24, 2409–2425. [Google Scholar] [CrossRef]
- Kerr, Y.H.; Waldteufel, P.; Richaume, P.; Wigneron, J.P.; Ferrazzoli, P.; Mahmoodi, A.; Al Bitar, A.; Cabot, F.; Gruhier, C.; Juglea, S.E.; et al. The SMOS Soil Moisture Retrieval Algorithm. IEEE Trans. Geosci. Remote Sens. 2012, 50, 1384–1403. [Google Scholar] [CrossRef]
- Mishra, M.K.; Mathew, N.; Renju, R. SCATSAT-1 Backscattering Coefficient over Distinct Land Surfaces and Its Dependence on Soil Moisture and Vegetation Dynamics. Int. J. Remote Sens. 2021, 42, 6481–6501. [Google Scholar] [CrossRef]
- Landmann, T.; Schramm, M.; Huettich, C.; Dech, S. MODIS-Based Change Vector Analysis for Assessing Wetland Dynamics in Southern Africa. Remote Sens. Lett. 2013, 4, 104–113. [Google Scholar] [CrossRef]
- Chaurasia, S.; Thapliyal, P.K.; Pal, P.K. Application of a Time-Series-Based Methodology for Soil Moisture Estimation From AMSR-E Observations Over India. IEEE Geosci. Remote Sens. Lett. 2012, 9, 818–821. [Google Scholar] [CrossRef]
- Du, J.; Kimball, J.S.; Jones, L.A. Passive Microwave Remote Sensing of Soil Moisture Based on Dynamic Vegetation Scattering Properties for AMSR-E. IEEE Trans. Geosci. Remote Sens. 2016, 54, 597–608. [Google Scholar] [CrossRef]
- Maurya, A.K.; Murugan, D.; Singh, D.; Singh, K.P. A Step for Digital Agriculture by Estimating Near Real Time Soil Moisture with Scatsat-1 Data. In Proceedings of the International Geoscience and Remote Sensing Symposium (IGARSS), Yokohama, Japan, 28 July–2 August 2019; pp. 5698–5701. [Google Scholar]
- Moran, M.S.; Doorn, B.; Escobar, V.; Brown, M.E. Connecting NASA Science and Engineering with Earth Science Applications. J. Hydrometeorol. 2015, 16, 473–483. [Google Scholar] [CrossRef]
- Soisuvarn, S.; Jelenak, Z.; Chang, P. Tropical Cyclone Wind Radii Composite from the Remotely Sensed Satellite Winds. In Proceedings of the 39th Asian Conference on Remote Sensing: Remote Sensing Enabling Prosperity, ACRS 2018, Kuala Lumpur, Malaysia, 15–19 October 2018; Volume 3, pp. 1732–1737. [Google Scholar]
- Singh, S.; Tiwari, R.K.; Sood, V.; Kaur, R.; Prashar, S. The Legacy of Scatterometers: Review of Applications and Perspective. IEEE Geosci. Remote Sens. Mag. 2022, 10, 39–65. [Google Scholar] [CrossRef]
- Kaur, R.; Tiwari, R.K.; Maini, R.; Singh, S.; Sood, V. The Study of Indian Space Research Organization’s Ku-Band Based Scatterometer Satellite (SCATSAT-1) in Agriculture. In Radar Remote Sensing; Elsevier: Amsterdam, The Netherlands, 2022; pp. 389–404. [Google Scholar]
- Maurya, A.K.; Murugan, D.; Singh, D. An Approach for Soil Moisture Estimation Using Urban and Vegetation Fraction Cover from Coarse Resolution Scatsat-1 Data. Adv. Sp. Res. 2021, 68, 1329–1340. [Google Scholar] [CrossRef]
- Singh, U.; Srivastava, P.K.; Pandey, D.K.; Chaurasia, S.; Gupta, D.K.; Chaudhary, S.K.; Prasad, R.; Raghubanshi, A.S. ScatSat-1 Leaf Area Index Product: Models Comparison, Development, and Validation over Cropland. IEEE Geosci. Remote Sens. Lett. 2020, 17, 563–567. [Google Scholar] [CrossRef]
- Singh, U.; Srivastava, P.K.; Pandey, D.K.; Chaurasia, S. Assessment of SCATSAT-1 Backscattering by Using the State-of-the-Art Water Cloud Model. Appl. Geomat. Civ. Eng. 2020, 33, 511–516. [Google Scholar]
- Gaur, P.; Tahlani, P.; Tripathy, R.; Bhattacharya, B.K.; Ray, S.S. Identification of Rice Crop Phenology Using Scatsat-1 Ku-Band Scatterometer in Punjab and Haryana. Int. Arch. Photogramm. Remote Sens. Spat. Inf. Sci. 2019, 42, 549–555. [Google Scholar] [CrossRef]
- Palakuru, M.; Yarrakula, K.; Chaube, N.R.; Sk, K.B.; Satyaji Rao, Y.R. Identification of Paddy Crop Phenological Parameters Using Dual Polarized SCATSAT-1 (ISRO, India) Scatterometer Data. Environ. Sci. Pollut. Res. 2019, 26, 1565–1575. [Google Scholar] [CrossRef]
- Palakurua, M.; Yarrakula, K. A Comparison Study of Space Borne Dual Polarization Difference Index (Sea Wind SCATSAT-1 Scatterometer) and NDVI (MODIS) on Paddy Crop Growth. Indian J. Geo-Mar. Sci. 2020, 49, 1580–1586. [Google Scholar]
- Palakuru, M.; Adamala, S.; Bachina, H.B. Modeling Yield and Backscatter Using Satellite Derived Biophysical Variables of Rice Crop Based on Artificial Neural Networks. J. Agrometeorol. 2020, 22, 41–47. [Google Scholar] [CrossRef]
- Tripathy, R.; Bhattacharya, B.K. Exploring Use of KU-Band Scatterometer Data from SCATSAT-1 for Crop Monitoring in India, a Case Study for Jute Crop. In Proceedings of the 2021 IEEE International Geoscience and Remote Sensing Symposium IGARSS, Brussels, Belgium, 11–16 July 2021; pp. 431–434. [Google Scholar]
- Singh, S.; Tiwari, R.K.; Gusain, H.S.; Sood, V. Potential Applications of SCATSAT-1 Satellite Sensor: A Systematic Review. IEEE Sens. J. 2020, 20, 12459–12471. [Google Scholar] [CrossRef]
- Sharma, R.; Agarwal, N.; Chakraborty, A.; Mallick, S.; Kumar, R. Assessing the Ocean Surface Current Impact on Scatterometer (C- And Ku-Bands) and Altimeter (Ka-Band) Derived Winds in the Bay of Bengal. IEEE Geosci. Remote Sens. Lett. 2022, 19, 1500605. [Google Scholar] [CrossRef]
- Mishra, P.; Alok, S.; Rajak, D.R.; Beg, J.M.; Bahuguna, I.M.; Talati, I. Investigating Optimum Ship Route in the Antarctic in Presence of Sea Ice and Wind Resistances—A Case Study between Bharati and Maitri. Polar Sci. 2021, 30, 100696. [Google Scholar] [CrossRef]
- Singh, S.; Tiwari, R.K. Detection of Cryospheric Parameters with Artificial Neural Network over Antarctic Region Using Ku-Band Based ISRO’s SCATSAT-1 Data. In Proceedings of the International Geoscience and Remote Sensing Symposium (IGARSS), Brussels, Belgium, 11–16 July 2021; pp. 435–438. [Google Scholar]
- Team, S.D. SCATSAT-1 Level 4 Data Products Format Document; Space Application Centre (ISRO): Ahmedabad, India, 2017.
- Singh, K.N.; Singh, R.K.; Maisnam, M.; Pallipad, J.; Maity, S.; Putrevu, D.; Misra, A. Detection of two recent calving events IN antarctica from SCATSAT-1. In Proceedings of the International Geoscience and Remote Sensing Symposium (IGARSS), Brussels, Belgium, 11–16 July 2021; pp. 439–442. [Google Scholar]
- Nikam, B.R.; Garg, V.; Gupta, P.K.; Thakur, P.K.; Senthil Kumar, A.; Chouksey, A.; Aggarwal, S.P.; Dhote, P.; Purohit, S. Satellite-Based Mapping and Monitoring of Heavy Snowfall in North Western Himalaya and Its Hydrologic Consequences. Curr. Sci. 2017, 113, 2328–2334. [Google Scholar] [CrossRef]
- Kumar, R.; Bhowmick, S.A.; Chakraborty, A.; Sharma, A.; Sharma, S.; Seemanth, M.; Gupta, M.; Chakraborty, P.; Modi, J.; Misra, T. Post-Launch Calibration-Validation and Data Quality Evaluation of SCATSAT-1. Curr. Sci. 2019, 117, 973–982. [Google Scholar] [CrossRef]
- Misra, T.; Chakraborty, P.; Lad, C.; Gupta, P.; Rao, J.; Upadhyay, G.; Vinay Kumar, S.; Saravana Kumar, B.; Gangele, S.; Sinha, S.; et al. SCATSAT-1 Scatterometer: An Improved Successor of OSCAT. Curr. Sci. 2019, 117, 941–949. [Google Scholar] [CrossRef]
- Singh, S.; Tiwari, R.K.; Sood, V.; Prashar, S. Current Status of the ISRO’s SCATSAT-1 Mission, Products, Utilisation and Future Enhancements. AIP Conf. Proc. 2022, 2451, 020062. [Google Scholar]
- Sun, W.; Chen, B.; Messinger, D.W. Nearest-Neighbor Diffusion-Based Pan-Sharpening Algorithm for Spectral Images. Opt. Eng. 2014, 53, 013107. [Google Scholar] [CrossRef]
- Singh, S.; Tiwari, R.K.; Sood, V.; Prashar, S. Fusion of SCATSAT-1 and Optical Data for Cloud-Free Imaging and Its Applications in Classification. Arab. J. Geosci. 2021, 14, 1978. [Google Scholar] [CrossRef]
- Kulkarni, S.C.; Rege, P.P. Pixel Level Fusion Techniques for SAR and Optical Images: A Review. Inf. Fusion 2020, 59, 13–29. [Google Scholar] [CrossRef]
- Singh, S.; Tiwari, R.K.; Sood, V.; Gusain, H.S.; Prashar, S. Image Fusion of Ku-Band-Based SCATSAT-1 and MODIS Data for Cloud-Free Change Detection over Western Himalayas. IEEE Trans. Geosci. Remote Sens. 2022, 60, 4302514. [Google Scholar] [CrossRef]
- Bektas Balcik, F.; Goksel, C. Determination of magnitude and direction of land use/land cover changes in terkos water basin, istanbul. Int. Arch. Photogramm. Remote Sens. Spat. Inf. Sci. 2012, XXXIX-B7, 275–279. [Google Scholar] [CrossRef]
- Shah, E.; Jayaprasad, P.; James, M.E. Image Fusion of SAR and Optical Images for Identifying Antarctic Ice Features. J. Indian Soc. Remote Sens. 2019, 47, 2113–2127. [Google Scholar] [CrossRef]
- Rahman, M.M.; Sumantyo, J.T.S.; Sadek, M.F. Microwave and Optical Image Fusion for Surface and Sub-Surface Feature Mapping in Eastern Sahara. Int. J. Remote Sens. 2010, 31, 5465–5480. [Google Scholar] [CrossRef]
- Amarsaikhana, D.; Blotevogel, H.H.; van Genderenc, J.L.; Ganzorig, M.; Gantuya, R.; Nergui, B. Fusing High-Resolution SAR and Optical Imagery for Improved Urban Land Cover Study and Classification. Int. J. Image Data Fusion 2010, 1, 83–97. [Google Scholar] [CrossRef]
- Abdikan, S.; Sanli, F.B. Comparison of Different Fusion Algorithms in Urban and Agricultural Areas Using Sar (Palsar and Radarsat) and Optical (Spot) Images. Bol. Ciênc. Geod. 2012, 18, 509–531. [Google Scholar] [CrossRef]
- Du, P.; Liu, S.; Xia, J.; Zhao, Y. Information Fusion Techniques for Change Detection from Multi-Temporal Remote Sensing Images. Inf. Fusion 2013, 14, 19–27. [Google Scholar] [CrossRef]
- Snehmani; Gore, A.; Ganju, A.; Kumar, S.; Srivastava, P.K.; Hari Ram, R.P. A Comparative Analysis of Pansharpening Techniques on Quickbird and WorldView-3 Images. Geocarto Int. 2017, 32, 1268–1284. [Google Scholar] [CrossRef]
- Al-Najjar, H.A.H.; Kalantar, B.; Pradhan, B.; Saeidi, V.; Halin, A.A.; Ueda, N.; Mansor, S. Land Cover Classification from Fused DSM and UAV Images Using Convolutional Neural Networks. Remote Sens. 2019, 11, 1461. [Google Scholar] [CrossRef]
- Mitchell, H.B. Pan-Sharpening. In Image Fusion; Springer: Berlin/Heidelberg, Germany, 2010; pp. 219–227. [Google Scholar] [CrossRef]
- Gungor, O.; Akar, O. Multi Sensor Data Fusion for Change Detection. Sci. Res. Essays 2010, 5, 2823–2831. [Google Scholar]
- Mhangara, P.; Mapurisa, W.; Mudau, N. Comparison of Image Fusion Techniques Using Satellite Pour l’Observation de La Terre (SPOT) 6 Satellite Imagery. Appl. Sci. 2020, 10, 1881. [Google Scholar] [CrossRef]
- Mishra, B.; Susaki, J. SAR and Optical Data Fusion for Land Use and Cover Change Detection. In Proceedings of the 2014 IEEE Geoscience and Remote Sensing Symposium, Quebec City, QC, Canada, 13–18 July 2014; pp. 4691–4694. [Google Scholar] [CrossRef]
- Singh, S.; Tiwari, R.K.; Sood, V.; Kaur, R.; Singh, S.; Prashar, S. Estimation and Validation of Standalone SCATSAT-1 Derived Snow Cover Area Using Different MODIS Products. Geocarto Int. 2022, 37, 18474–18490. [Google Scholar] [CrossRef]
- Canty, M.J. Image Analysis, Classification and Change Detection in Remote Sensing: With Algorithms for ENVI/IDL and Python; CRC Press: Boca Raton, FL, USA, 2014. [Google Scholar]
- Sood, V.; Gusain, H.S.; Gupta, S.; Singh, S.; Kaur, S. Evaluation of SCATSAT-1 Data for Snow Cover Area Mapping over a Part of Western Himalayas. Adv. Sp. Res. 2020, 66, 2556–2567. [Google Scholar] [CrossRef]
- Abdi, A.M. Land Cover and Land Use Classification Performance of Machine Learning Algorithms in a Boreal Landscape Using Sentinel-2 Data. GISci. Remote Sens. 2020, 57, 1–20. [Google Scholar] [CrossRef]
- Stehman, S. V Estimating Area and Map Accuracy for Stratified Random Sampling When the Strata Are Different from the Map Classes. Int. J. Remote Sens. 2014, 35, 4923–4939. [Google Scholar] [CrossRef]
- Ramezan, C.A.; Warner, T.A.; Maxwell, A.E. Evaluation of Sampling and Cross-Validation Tuning Strategies for Regional-Scale Machine Learning Classification. Remote Sens. 2019, 11, 185. [Google Scholar] [CrossRef]
- Gupta, D.K.; Prashar, S.; Singh, S.; Srivastava, P.K.; Prasad, R. Introduction to RADAR Remote Sensing. In Radar Remote Sensing; Elsevier: Amsterdam, The Netherlands, 2022; pp. 3–27. [Google Scholar]
Disclaimer/Publisher’s Note: The statements, opinions and data contained in all publications are solely those of the individual author(s) and contributor(s) and not of MDPI and/or the editor(s). MDPI and/or the editor(s) disclaim responsibility for any injury to people or property resulting from any ideas, methods, instructions or products referred to in the content. |
© 2023 by the authors. Licensee MDPI, Basel, Switzerland. This article is an open access article distributed under the terms and conditions of the Creative Commons Attribution (CC BY) license (https://creativecommons.org/licenses/by/4.0/).