Article

Middle Holocene Environment on the Ozark Margin in Southeast Missouri: Deciphering a Testudine Testament

by
James J. Krakker
1,* and
Linda A. Krakker
2
1
National Museum of Natural History, Smithsonian Institution, Museum Support Center, 4210 Silver Hill Rd., Suitland, MD 20746, USA
2
Independent Researcher, Arlington, VA 22202, USA
*
Author to whom correspondence should be addressed.
Quaternary 2022, 5(3), 29; https://doi.org/10.3390/quat5030029
Submission received: 24 August 2021 / Revised: 6 April 2022 / Accepted: 7 April 2022 / Published: 29 June 2022

Abstract

:
Turtle taxa represented at Lepold site 23RI59 in southeastern Missouri, USA provide a record of environmental conditions spanning the Middle Holocene. Identified turtle taxa show that open water was present between 7500 and 4000 radiocarbon years ago. Aquatic resources seem to be more intensively exploited beginning about 6300 years ago, about 1200 years after intensive occupation of the site had begun. The observed turtle taxon composition is consistent with the presence of a floodplain with shallow, seasonal, overflow ponds, but with riverine and upland habitats also being represented.

1. Introduction

Archaeological interpretations of Middle Holocene adaptations in the midcontinent have embraced at least two broad environmental factors: the emergence of a Midwest prairie wedge and the development of floodplain wetlands along the major rivers in the central Mississippi valley. A major distinctive biome of the Midwest is the eastern extension of a tall grass prairie protruding east from Iowa and northern Missouri across the Mississippi into northern Illinois and Indiana. It was called the Prairie Peninsula by Transeau [1], building on Gleason’s [2] ideas. Defining features of the midcontinental grassland climate determined by Borchert [3] using modern meteorological data were further refined [4,5]. Long-term environmental proxy records provided by pollen profiles preserved in wetlands established that grass-dominated vegetation was established in the Midwest early in the Holocene [6] and persisted to historic times, although modified by climatic shifts through time. Moreover, mounting evidence shows spatially variable climatic and vegetational shifts during the Early and Middle Holocene [7,8,9]. Understanding the climatic causes, development, and chronology of the Prairie Peninsula of the midcontinent continues to progress, and whatever may be concluded here could certainly be superseded by more detailed assessments.
The development of the Prairie Peninsula, and its perceived waxing and waning margins through time have influenced archaeological interpretations in the Midwest, Ozarks, and central Mississippi valley at least since the mid-1970s. Early studies of Holocene environmental changes in Missouri used data from excavations conducted at Rodgers Shelter and Graham Cave [10,11].
The impact of the evolution of major river floodplains during the Holocene in the Midwest in the Mississippi River valley itself and its major tributaries has long been implicit in reviews of eastern North American prehistory [12] (pp. 128, 135), [13] (pp. 34–37), [14] (p. 22), [15]. Butzer [16,17] and Hajic [18] reviewed geological evidence for the changing environmental context of the Koster site in the lower Illinois valley. Several archaeological research projects were conducted considering landscape evolution or environment change in the Midwest, and are summarized in a compendium edited by Phillips and Brown [19]. From these studies, Munson [20] suggested that increasingly sedentary settlements first emerged in the major river valleys, where there is evidence that floodplains with extensive wetlands containing permanent slack-water or seasonal ponds first emerged about 8000 to 7000 years ago. At about that time, upland grassland was becoming established in the Midwest. More sedentary communities apparently emerged slightly later in smaller tributary valleys, such as the Green River of Kentucky and Saline River in southern Illinois. More recent research tends to support that view [15,21,22,23]. However, as is shown on the southeastern Ozark margin, dense shell midden deposition begins at about 6000 BP, following midden deposition beginning at 7500 BP.
Beyond the margins of the Prairie Peninsula itself, climatic and vegetation shifts are evident during the Holocene. On the southern margin of the Prairie Peninsula, dryer Middle Holocene conditions are expressed, but not limited to the northern or western Ozark flanks [11]. Increased grass and more xeric adapted trees widely dominated the vegetation in the Ozarks during the Middle Holocene [24,25].
The interface of the Mississippi valley and the Ozark upland is a locality where the impact of shifting intensity of upland xeric conditions and the emergence of lowland slack-water resources can be assessed though time. A case study is provided by the faunal elements recovered from the Lepold site located on the Ozark escarpment bordering the Western Lowland of the central Mississippi valley in southeastern Missouri (Figure 1). Because the modern floodplain of Little Black River borders the Ozark escarpment there, approximately half of the surrounding catchment is upland, and the other half is lowland. Within 1 km of the site, 53% of the area is lowland and 47% upland. Most of the lowland is floodplain, whereas only about 9% of the upland is stream bottom.
Although archaeofauna is often analyzed to study prehistoric diet or subsistence activities, a major objective here is to elucidate prehistoric environmental conditions [26] (pp. 200–202), [27] (p. 13), [28] (p. 335), [29,30]. Turtle remains are chosen as a monitor of past environmental conditions because they first form a large component of the Lepold site archaeofauna. Second, individual turtle species have specific habitat preferences rendering them sensitive environmental monitors. In the region, herpetologists studied the relationship of individual turtle species and communities to environmental variables [31,32,33,34].
Ample precedent exists for ecological interpretations of faunal remains, including herpetofauna recovered from natural traps and archaeological deposits in the midcontinent [11,27,35,36,37,38,39,40,41]. Among sites studied from an ecological perspective is Modoc Shelter, located about 170 km north of the site discussed here [42].

2. Materials and Methods

2.1. Excavation Methods

The site was sampled by an excavated area totaling 18.6 m2 (200 ft2). The excavation consisted of a central excavated block of 7 m2 (75 ft2), a unit of 4.6 m2 (50 ft2) to the south, and three individual units five feet on a side, 2.3 m2 (25 ft2), to the east and south of these two larger blocks (Figure 2). The top of the midden is a plow zone (PZ) approximately 21 cm thick (0.7 ft). Below the PZ, all units were excavated in 12 cm (0.4 ft) levels to the base of the midden deposit 1.2 m (3.9 ft) to 1.3 m (4.3 ft) below the surface. Although the total extent of the midden is unclear, it must minimally extend over an area of 500 m2.
All midden soil was passed through a 6.35 mm (0.25 in) mesh screen, and all observed bone fragments were retained. Approximately 30,300 bone fragments were recovered.
Even though bone preservation is very good, most fragments are small and frequently burned, hindering species identification. The few larger bone fragments often show tooth marks from scavenging. Assessment of the possible introduced bias was left for future analysis.

2.2. Faunal Sample

Turtles (Testudines) are common among the represented faunal taxa. Of the 30,300 bone fragments recovered, 8152 are turtle, about 27% of the total. The relative importance of turtles is probably somewhat inflated because even small turtle carapaces and plastron fragments can be distinguished among the bone fragments. Species-level taxonomic identification is more difficult. Of the total turtle bone, about 74% is identified simply as turtle.
Turtles are the only herpetofauna considered here. Any microfauna in screened water samples taken during excavation were unstudied [40] (p. 7), [41] (p. 9), [43]. However, both Colubridae and Crotalidae snakes are notably present.

2.3. Occupation History

Projectile point types show that site occupation began in Dalton and Early Archaic times, but if any midden had accumulated then, it was extensively mixed during the Middle Archaic occupation. Seven radiocarbon dates establish the midden deposition chronology, as shown in Table 1. In the central block, a date of 7450 ± 60 BP (Beta-104977) from unit 100/70 level 7 (3.1–3.5 ft) near the base of the midden is supported by two other dates, 7230 ± 95 BP (Beta-65936) from unit 75/75 level 8 (3.5–3.9 ft) and 7260 ± 60 BP (Beta-104975) from unit 75/80 level 7 (3.1–3.5 ft), associated with early midden deposition. A feature extending into the top of the midden yielded a radiocarbon date of approximately 4000 BP [44]. In other words, the top of the midden truncated by the PZ was deposited before 4000 BP. The beginning of dense shell deposition by about 6000 BP is supported by three dates, 6110 ± 60, 5630 ± 50, and 6300 ± 80 BP. These dates show that initial shell deposition lagged about 1200 years after initial midden deposition.
In sum, although occupation of the site began in Dalton and Early Archaic times, increased occupation intensity, as indicated by midden accumulation, began by about 7500 BP. Dense mollusk shell deposition beginning in levels 4 or 5 indicates the increased use of at least one aquatic resource about 6000 BP. It is unclear how to interpret this shift. Did a local habitat change render riverine mollusks more accessible or did a wider climatic change occur? That this is not a local phenomenon is shown by shell middens in Green River of western–central Kentucky appearing about the same time [21,22,23].

2.4. Evidence of Local Environmental Conditions

The relation of the local environment to wider climatic events is briefly reviewed. On the basis of data mainly from the Upper Midwest, Nelson et al. [7] concluded that aridity increased between 10,000 and 8500 cal BP, but declined somewhat between 8500 and 6200 cal BP. After 6200 cal BP, aridity was no more severe than before, suggesting that wildfire had a role in the establishment and maintenance of the prairie. They indicated that the onset and progression of dryer conditions within the Midwest showed regional variation. Turning to the Ozarks, speleothem isotopic analysis indicates increasing aridity between 9500 and 8200 cal BP; by 7500 cal BP, grassland was established in the Ozarks [25].
Within the Ozark uplands, about 48 km from the Lepold site at Cupola Pond, a pollen profile indicates Holocene vegetation generally dominated by oak and hickory with a substantial grass component [45]. Since about 8000 calendar years ago, Poaceae pollen has generally been declining, suggesting a general increase in effective moisture during the period when the Lepold midden accumulated.
Archaeological investigations of two sites on the Prairie Peninsula border show evidence of drier Middle Holocene conditions. Eolian deposits suggest that maximal aridity occurred at Graham Cave between 8000 and 7600 BP [11] (p. 237). Similarly, on the western Ozark margin at Rodgers Shelter, maximal steppe conditions occurred between 8000 and 6500 BP, with dry conditions persisting later [11] (pp. 231, 238).
Alluvial processes respond to climatic shifts [16,17,46]. Furthermore, Ozark streams were modified by some 300 years of human activity [47]. The geoarchaeological record of the Little Black River watershed may not be completely consistent with Midwest climatic events or the geoarchaeological record evident at locations in much larger river valleys such as those of the Illinois, Mississippi, and Missouri. Little Black River and neighboring Cane Creek watersheds are flanked by much larger watersheds of Black and Current Rivers. In comparison to Black or Current River, the watershed of Little Black River extends for a far shorter distance into the Ozark upland to the northwest. The Little Black River floodplain of about 1 km width is small compared to that of the Mississippi River or its major tributaries. This geographic situation presents a fundamental geoarchaeological issue of scale to consider. In small watersheds, alluvial deposits record more localized and shorter-term climatic events in comparison to the broader regional record that large watersheds provide [48].
The flow of Mississippi River through the Western Lowlands ended during the Pleistocene. Among other Ozark streams entering the lowland, Little Black aggraded and established a meandering flow, creating cut-off ponds in its floodplain [49] (p. 271), [50] (p. 602). As Little Black is a small river, these ponds would be inherently small and shallow, but presumably at least some would be permanent.
Pollen and sediment analyses are available to monitor past Holocene environmental conditions in the site vicinity [51]. The core was taken from a small pond, Powers Fort Slough, which is only a little more than 2 km from the site. Most of the Lepold occupation was during the later part of the drier interval between 9500 and 4500 BP, defined as the Quercus-Fraxinus pollen assemblage zone, characterized by ash, oak, and hickory pollen. Grass pollen is also common and may represent cane thickets in this lowland location.
Within the Quercus-Fraxinus zone, a shift in sediment deposition and decrease in tree pollen suggest the maximal dry conditions at about 6600 BP [51] (p. 165). Subsequently, the pollen core showed a rapid shift represented by increased tree pollen, but a decrease in oak, apparently associated with more mesic conditions. Willow, Salix, and buttonbush Cephalanthus occidentalis pollen began to increase before 4500 BP, which is consistent with more flow through the slough [51] (p. 165). During the Middle Holocene, pollen evidence from the Powers Fort Slough core is interpreted as showing seasonal water level fluctuation, exposing areas colonized by annuals [52] (p. 120). After 4500 BP, the pollen spectrum resembles the modern species composition. Forest composition during the last few thousand years was not completely stable or unchanging because of local hydrological shifts and short-term climatic variation. Evidence of drier Late Holocene intervals exists on the Prairie Peninsula margin of the Ozarks [53].

3. Results

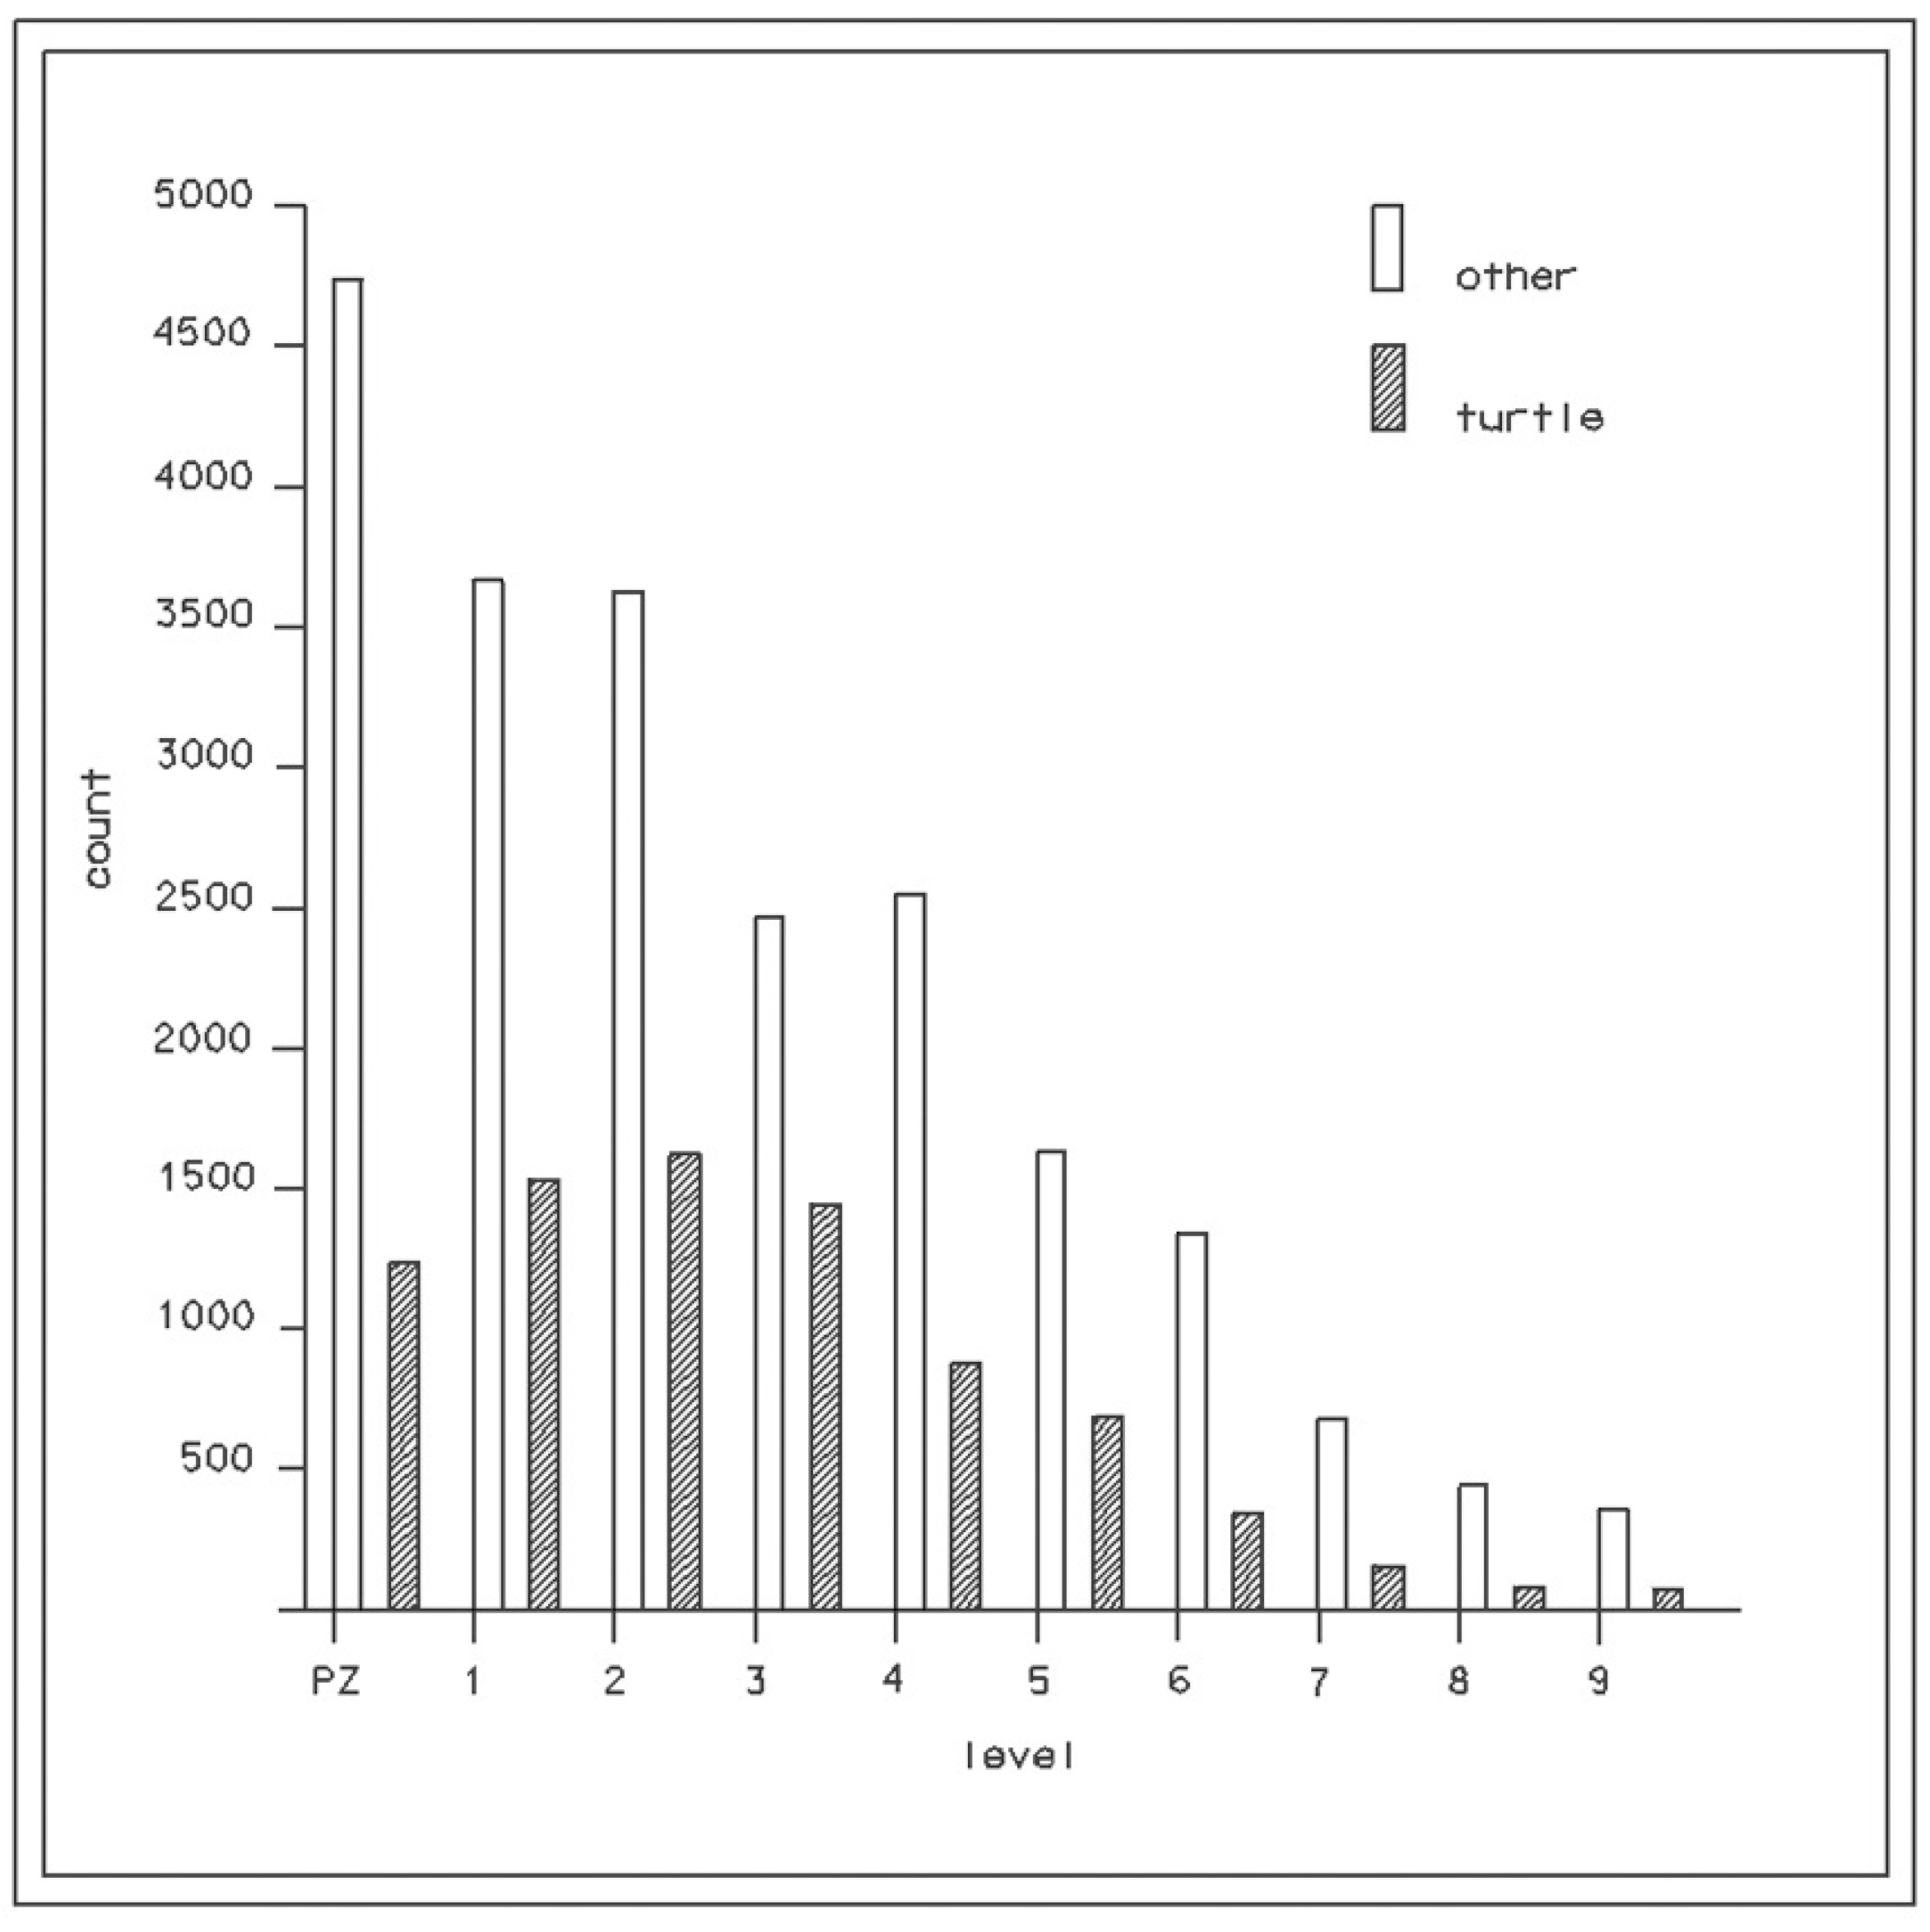
3.1. Turtle Bone Distribution

Although a substantial number of fragments were identified to the species level, variation among level totals hinders observations about species distribution through time, Table 2. Much less bone is present and identified from the lowest two levels. Shifts in frequency or diversity are difficult to evaluate if sample sizes are very different [54] (p. 116). As sample size increases, more uncommon taxa appear, and the percentage of common taxa thereby decreases, and diversity appears to increase; small samples seem less diverse and dominated by a few common taxa.
Figure 3 shows that turtle bone occurs throughout the midden depth. Total bone other than turtle generally decreases with depth, while turtle bone is at a maximum in levels 1 to 3, with slightly less in the PZ. Turtle bone ranges as a percentage of total bone fragment count from a maximum of 36.3% in level 3 to a minimum of 18.3% in level 8. Levels 1 to 6 are all over 20%. In the three lowest levels, percentages are less than 20%, although the total quantity of bone in these levels is much less than those above. In chronological terms, the maximal amount of turtle bone occurred between 6000 and 4000 BP. The quantity of turtle bone seems slightly less in the Woodland and Late Archaic than during the Middle Archaic occupation, both relative to quantity per level and relative to other animal bone.

3.2. Taxa Represented in the Collection

The total collection contains nine taxa, as shown in Table 3. All of these are found widely in the eastern woodlands [33]. Basic ecological principles suggest that individual species would not be expected to occupy exactly the same niche [55] (pp. 230–266), [56] (pp. 16–21); therefore, the number of observed taxa alone suggests habitat diversity in the immediate site vicinity. As turtle species have specific habitat preferences [33], turtle taxa should thus be sensitive indicators of environmental conditions in the site vicinity. Table 3 summarizes the general habitats for each taxon. Individual species may have seasonal and ontogenetic habitat preferences. Additional environmental factors and behavioral characteristics are mentioned when relevant in the following discussion, as are some taxonomic issues impacting taxon identifications used here.

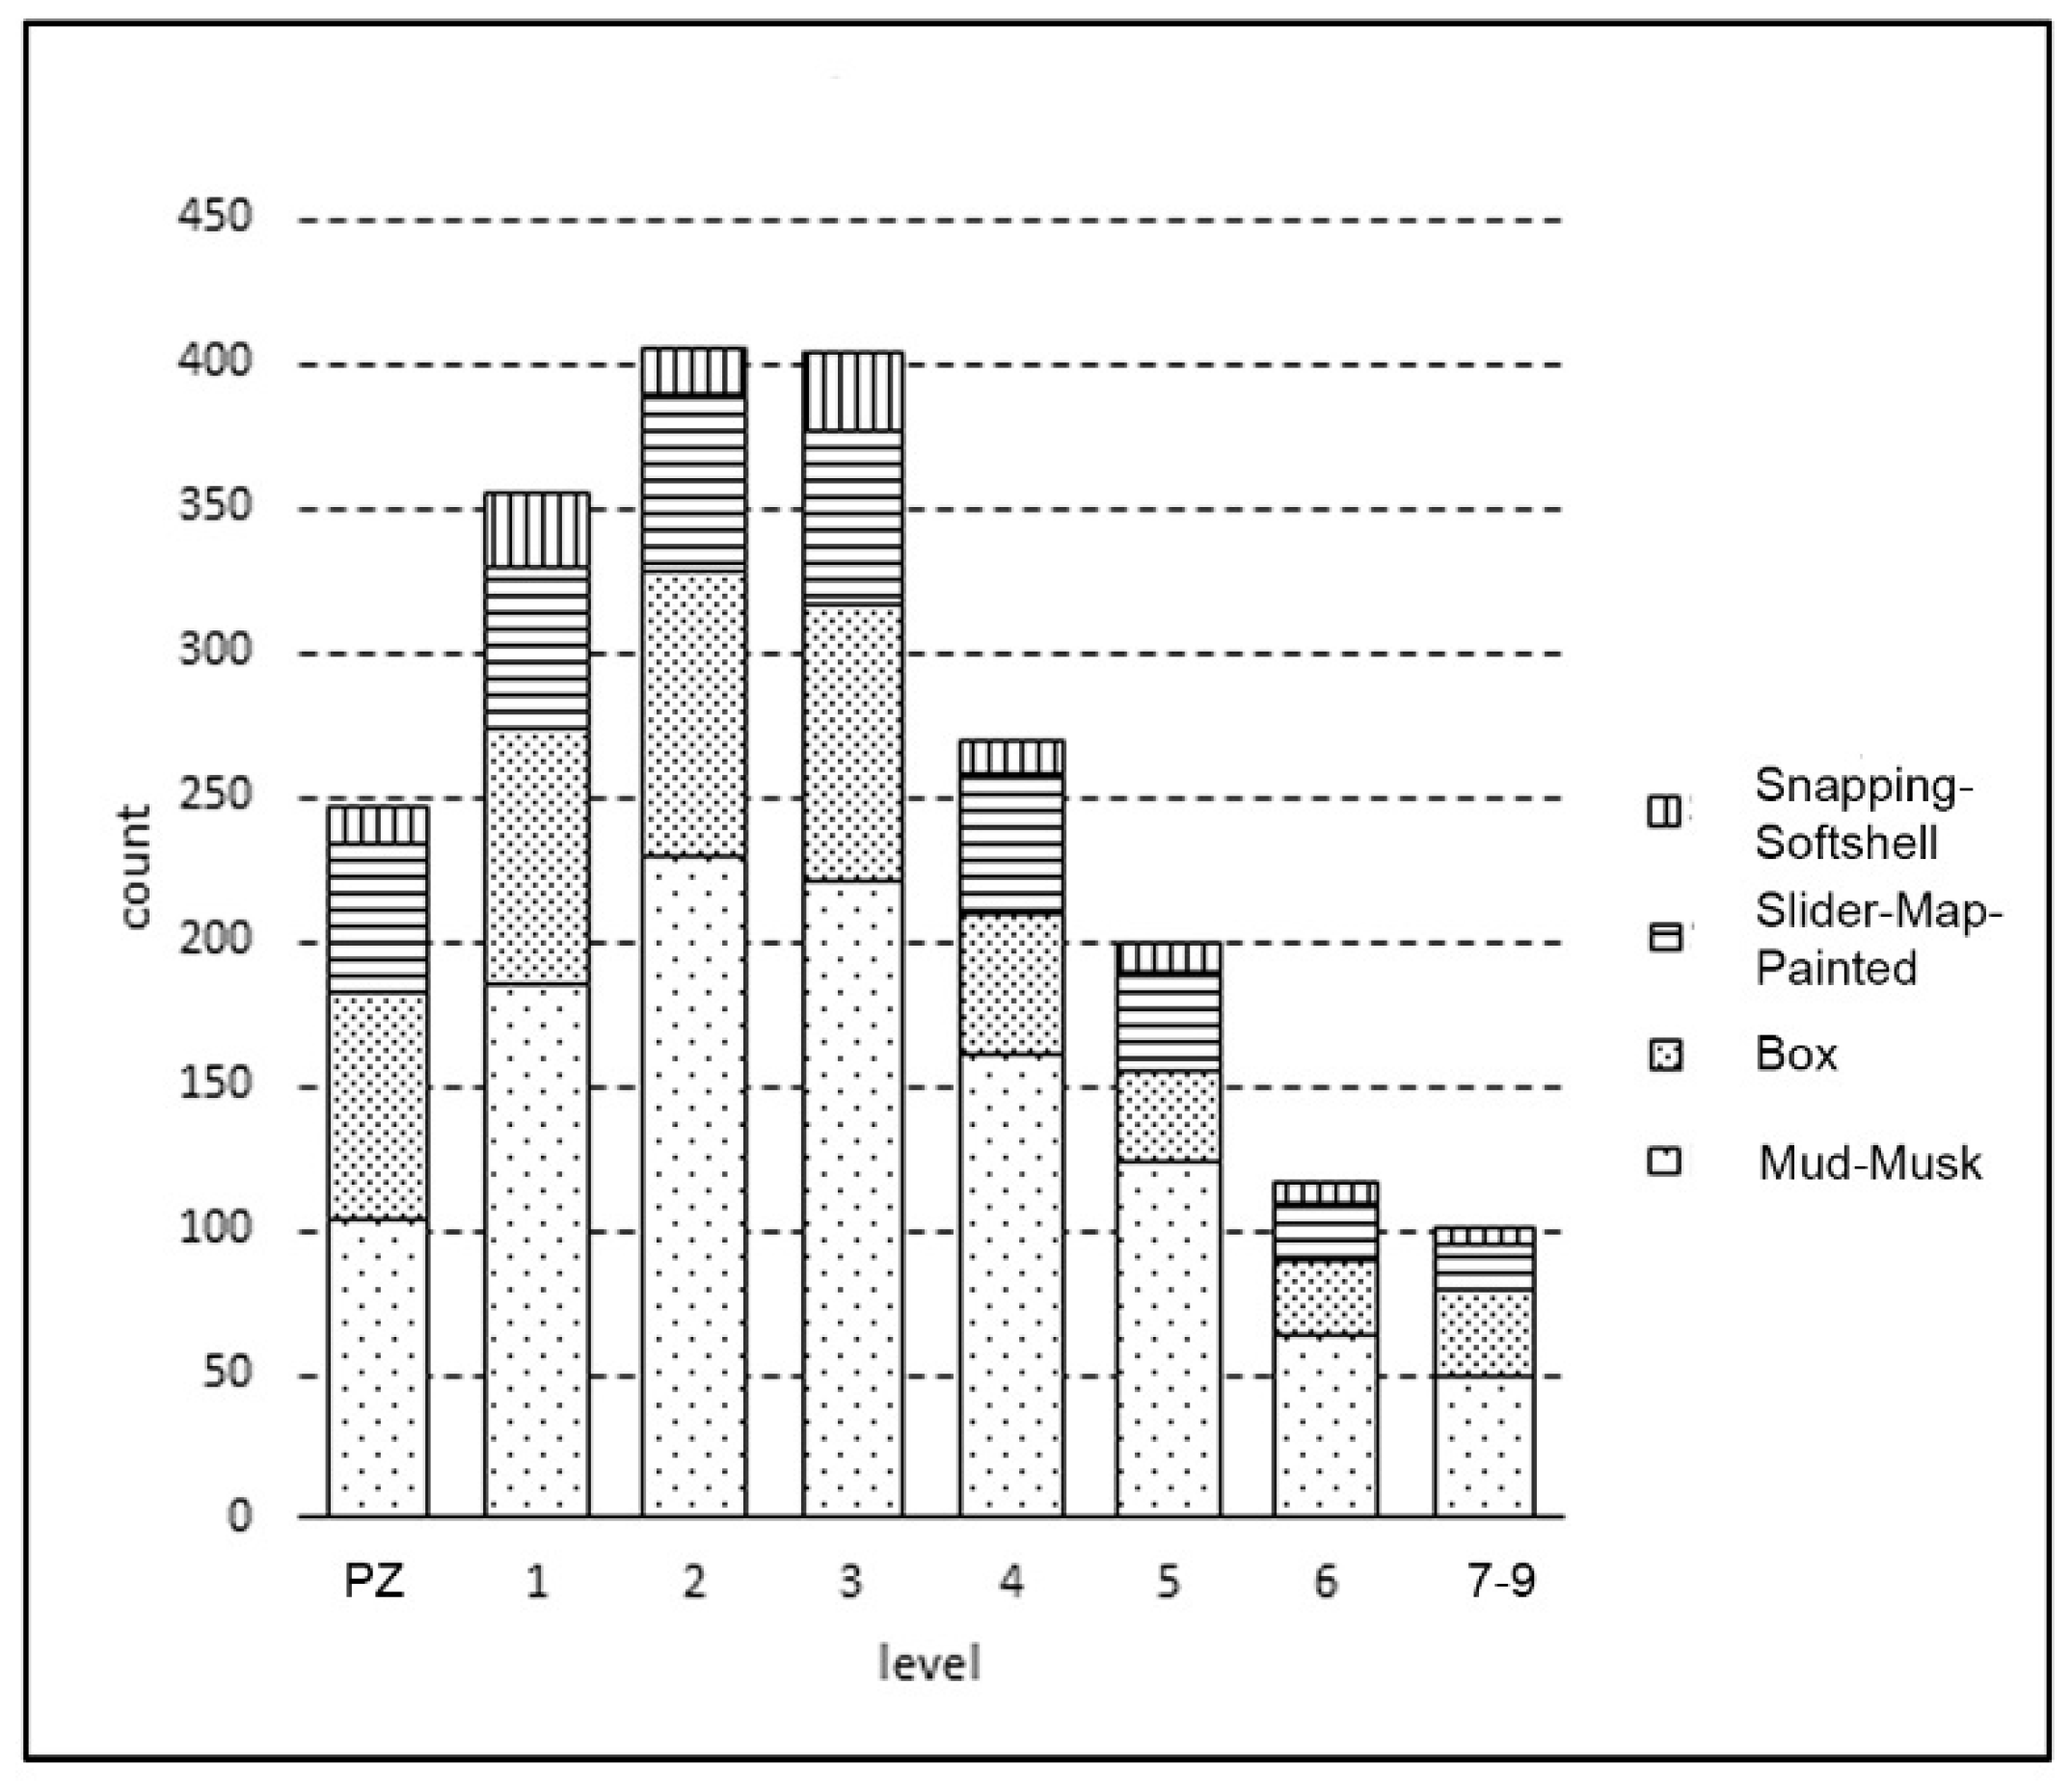
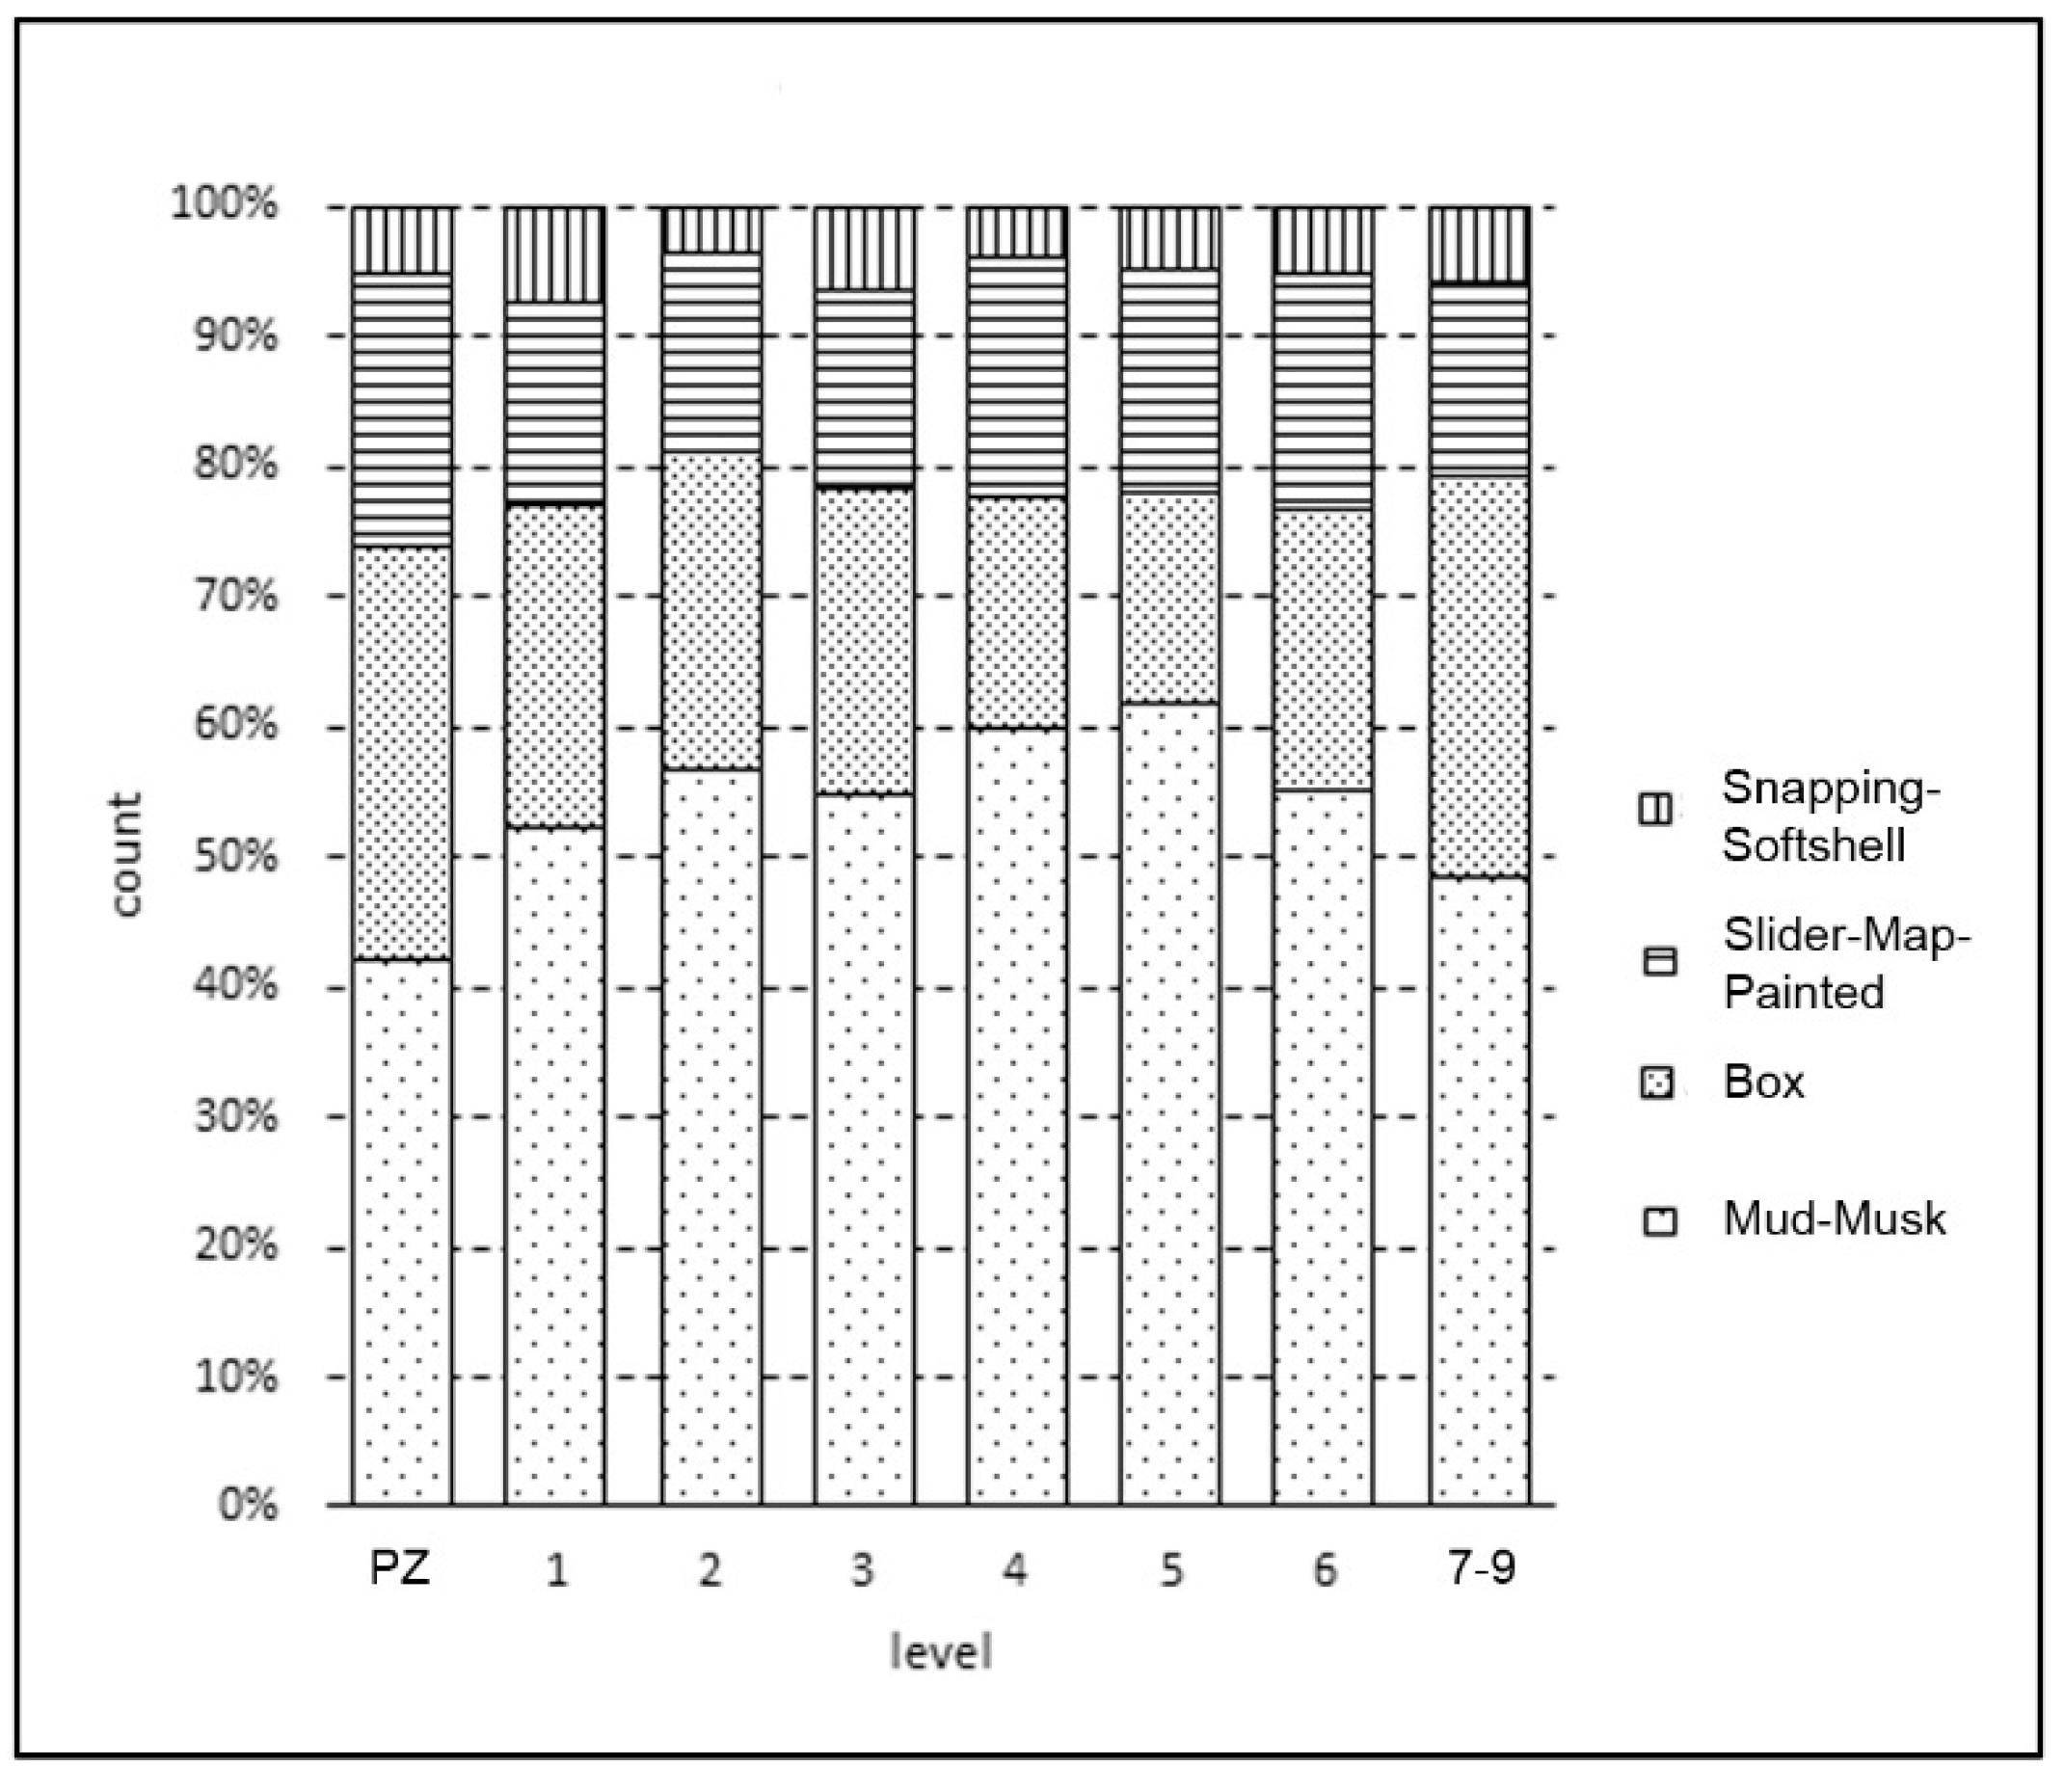
3.3. Taxa Composition through Time

Of primary interest as an indication of environmental shifts are taxon frequency distributions through time. The basic question is whether taxon composition is the same in all levels, and if not, if differences are related to environmental changes.
Varying total counts among levels obscures trends and differences for individual taxa. To simplify, some taxa were combined in Table 4 and Figure 4. Kinosternidae are one group. For Emydidae, those other than box turtles were combined as slider, map, and painted (Trachemys, Chrysemys, and Graptemys). Snapping and softshell turtles were combined for reasons other than taxonomy as discussed below. Levels 7–9 were combined because of low counts. Table 5 is the resulting matrix collapsed into four taxa and eight levels. Figure 5 shows these four taxa by cumulative percentage by level.
Figure 5 shows that, in all levels, mud/musk family Kinosternidae is the most common recognized taxon. Admittedly, grouping mud Kinosternon subrubrum and musk Sternotherus odoratus turtles together may obscure some environmental conditions because their habitats differ. Musk turtles S. odoratus are rarely found away from permanent water, and mud turtles K. subrubrum favor temporary pools formed during flood times [57,58].
The distribution of mud K. subrubrum and musk S. odoratus is more closely examined later. Overall, mud is more common, the taxon adapted to temporary pools, whereas musk turtles stuck to permanent pools. C. picta and T. scripta require permanent water too. These aquatic turtles may be seen traveling overland looking for water if unusually dry conditions eliminate their normal pools [58] (p. 248), [59] (p. 52).
Turning to the slider, map, painted group, painted Chrysemys picta is the most common species in the group. Included in the slider, map, painted group is red-eared slider Trachemys scripta. At the time of analysis, T. scripta was included in the Pseudemys genus [34] (p. 188). Within the Graptemys genus, the Mississippi map turtle, either as species Graptemys kohnii [34] (p. 174) or subspecies of Graptemys pseudogeographica [33] (p. 327) is not distinguished. It cannot be concluded that it is absent.
As a possible indication of relatively dry conditions, the frequency of box turtle Terrapene carolina is examined by depth. Even though it showed a substantial percentage of identified turtle taxa in all levels, box turtle had its lowest representation of around 20% in levels 4 and 5. This would be just as the dense mollusk shell zone begins, in other words, about 5500 to 6000 BP. Box turtle is slightly more common in the combined three lowest levels compared to levels 4 and 5 at the base of the shell zone. The box turtle percentage in the three lowest levels was similar to that of the PZ, but far from dominant vouching for open water both early and late.
Both snapping turtle Chelydra serpentina and softshell turtle Trionychidae (Apalone) are minority taxa that are also associated with aquatic environments. The two species of softshell, A. nutica and A. spinifera, are not distinguished here, although their habitats slightly differ. Snapping turtle elements are about twice as frequent as softshell. Even though both of these taxa are far less common than others, their distribution is of interest. As is discussed later, snapping and softshell turtles are likely to play an important subsistence role. They are present throughout the midden ranging from a maximum of 7.3% in level 1 to a minimum of 3.7% in level 2.
For more formal quantitative analysis and in order to avoid low cell counts, some taxa in Table 6 were combined as in Table 4. In Table 6, observed counts are compared to the expected values calculated from marginal totals. Testing the levels, as samples were drawn from a single population, provides support for significant differences in midden composition. The χ2 total of 40 for the table exceeds the 1% probability level of 39 for 21 degrees of freedom. Individual cells contributing to the χ2 total are of interest as these support some previous subjective observations from examining Table 4.
PZ stands out from the other levels, contributing a substantial part of the χ2 total. The highest χ2 values for individual cells are in the PZ for box, T. carolina, and Kinosternidae. Observed counts are too high for T. carolina and too low for Kinosternidae. This inverse relationship makes sense. However, the observed slider, map, painted count is high as well for these clearly aquatic species. The PZ is composed of a considerable Woodland and emergent Mississippian component, so the observation that it is distinct from the Middle Archaic levels is ambiguous, as subsistence shifts or environmental changes could be the cause.
In fact, ignoring the PZ χ2 value reduces the overall value below the 5% probability level. Nevertheless, other high χ2 cell values highlight some differences among levels. Notable are high χ2 values in levels 4 and 5. These levels are at the base of the shell zone. In these levels, T. carolina is under-represented and Kinosternidae slightly over-represented. This would be consistent with a shift to aquatic resources associated with initial shell deposition about 5500 to 6000 BP.
The lowest level shows a high χ2 value for T. carolina. High counts for T. carolina could be interpreted as indicating relatively dry conditions, but it could simply be a result of a rather small samples in levels 7 to 9. Lastly, high χ2 values for C. serpentina and Trionychidae in levels 1 and 2 are puzzling if not contradictory. In the shell zone, an abundance of snapping and softshell turtles might be expected as in level 1, but in level 2, the observed count is lower than expected. Perhaps this is simply a result of low overall counts for snapping and softshell turtles.
A simple way to summarize is to compare T. carolina and Kinosternidae alone. These two taxa account for 77% of elements identified by taxa. Table 7 shows that the ratios of T. carolina to Kinosternidae increase from the lowest level to a maximum in levels 4 and 5, the base of the shell zone, and then decrease in the PZ. The ratio is nearly equal to 1 in the PZ and the two lowest levels. Otherwise, Kinosternidae outnumber T. carolina elements by at least 2 to 1, with a maximal ratio over 3 in levels 4 and 5. There are three evident zones: PZ, occupation after 4000 BP; shell zone, from 6000 to 4000 BP; and the lowest levels containing the initial midden deposition beginning about 7500 BP.

4. Discussion

4.1. Environment and Subsistence

Box turtles T. carolina might simply be casually collected while engaging in other upland subsistence activities. If so, their frequency may be a general indication of upland as opposed to lowland subsistence activity. The shifts of box turtle percentage relative to everything else suggest that, during the middle of the occupation, span activities were slightly more lowland-focused compared to the initial occupation in the three lowest levels and the PZ.
Box turtles are common in the Ozark uplands, but what habitat is optimal for them? They seasonally use both oak–hickory forest and grassland [60]. Grassland is frequented in late spring and early fall, when conditions are less dry and temperature mild. Woodland habitats are preferred in the early spring, summer, and late fall, where organic litter and moister conditions provide shelter from extreme temperatures.
These seasonal habitat preferences have implications for longer-term vegetation shifts and related climatic shifts. Contrary to intuitive inference, the expansion of upland grassland and more open woodland logically associated with more xeric conditions may be detrimental to box turtle populations. Associated with more xeric conditions, the increased frequency of wildfires would reduce ground-level herbaceous vegetation and organic litter needed for shelter during seasons of temperature extremes. Fires during warmer months when box turtles are active have a direct adverse impact [61]. Interestingly enough, Ozark wildfires in historic times were largely anthropogenic and likely so in prehistory [62].
Turtles have a large biomass in freshwater habitats, which may have rendered them attractive to exploitation by prehistoric people [32,63,64,65,66]. Desirability as a food source may have varied among species. Snapping turtle C. serpentina and softshell Apalone may have been preferentially sought for food, as they are captured even today by market hunters [34] (p. 189), [67]. Because of the unossified carapace of softshell turtles Apalone [68] (p. 175), they may be under-represented in bone samples relative to other turtles. The subsistence importance of snapping turtle C. serpentina because of its relatively large size may be under-represented by simple bone count. Adult snapping turtle carapace length ranges from 200 to 300 mm, and weight ranges from 4.5 to 16 kg [34] (p. 147). About half the live weight is edible [67] (pp. 8–9), [68] (p. 45).
Other turtles Graptemys, T. scripta, and rather small C. picta are perfectly edible [68] (pp. 113, 121, 138, 169), although T. carolina perhaps less desirable [68] (p. 95). In comparison, for edibility, Kinosternidae are held in low esteem and are small [34] (pp. 157, 160), [68] (pp. 55, 67). Adult mud turtle K. subrubrum carapace length is 75 to 121 mm [34] (p. 157) and adult musk turtle S. odoratus carapace length is 80 to 115 mm [34] (p. 161). A study of turtles captured in a pond in Jersey County, Illinois showed a mean living weight for S. odoratus of 256 g compared to a mean of 3274 g for C. serpentina [69]. Moreover, when handled, musk turtle S. odoratus, commonly called stinkpot, can release a foul-smelling glandular secretion [33] (pp. 333–334), [68] (p. 53).
Although cut marks or abrasion evident on the interior of some turtle shell fragments may have been the result of cutting meat away from the carapace, close inspection suggests purposeful modification at times (Figure 6). Turtle shells sometimes supplied small bowls or dippers used for food preparation and serving. Therefore, it is likely that the capture of small turtles may have been enhanced by their value as containers in addition to whatever their food value or yield was [70].
As ectothermic (cold-blooded) animals, ambient temperature restricts the seasonal activity of turtles, although this may not necessarily prevent human exploitation. Even though the annual active season varies somewhat among species, turtles would generally be active during the frost-free period of the year, April through October. It cannot be assumed that turtles were only captured during the warmer months. They might have also been retrieved from their overwinter hiding places. In fact, in the early 20th century, market hunters captured snapping turtles C. serpentina in late fall and winter in places where they congregated to hibernate [67] (p. 5). Aquatic turtles hibernating on bottom mud in shallow water could be collected, although that would require wading around in cold water in the winter. Mud turtle K. subrubrum activity is further limited by the existence of temporary pools. They hide in burrows when seasonal ponds dry out [58] (p. 248). Burrowing renders them less visible to exploit on the surface in midsummer, but they could still be extracted from underground.
As shown here, turtles throughout the Holocene were subject to human predation. The impact of human predation on the turtle population structure and community composition cannot be assumed to have been trivial in prehistory. Even with high biomass, overexploitation is possible because predation may disproportionately impact these long-lived animals. Turtle populations may be slow to recover from unsustainable levels of predation [71,72].
Beyond direct human predation, within the Holocene, midcontinental ecosystem humans were part of multiple and complex systemic interactions [73]. Vegetation composition is partly a response to human activities [74] (p. 347), [75] (p. 1125), [76]. Anthropogenic fires could enhance climatic shifts promoting more xeric vegetation conditions, thus both directly and indirectly impacting the box turtle population.

4.2. Comparison to Other Archaeological Sites

As archaeological collection methods among sites may not be consistent, multiple site comparisons are deferred. Nevertheless, a couple of examples have clear environmental relationships that are worth considering here. The faunal assemblage of Tick Creek Cave in Phelps County is an instructive contrast [70]. Tick Creek is a tributary of Gasconade River, joining it about 75 km upstream, that is, south of Missouri valley, so it is well within the Ozark upland. Tick Creek is not a large watershed, draining about 51 km2 (20 mi2). The cave is located toward the headwaters of the stream, about 9 km upstream from its confluence with the Gasconade River [77] (p. 3). At the cave, the watershed area including tributaries joining immediately downstream is about 19 km2. As springs exist in the watershed, area alone is not a totally accurate indicator of stream size, yet the creek at the cave is not large. Near the cave, the creek valley is about 200 m wide but widens just downstream to about 300 m. In spite of its small upland stream location, bone fishhooks were found at Tick Creek Cave.
Turtle bone accounts for about 6% of total fauna in Archaic levels, certainly a lower proportion than that at Lepold. Of the turtle bone, box T. carolina accounts for about 90%, a much higher proportion than that observed at Lepold. The difference seems consistent with the more limited local riverine and pond habitats in the upland terrain surrounding Tick Creek Cave compared to those in the vicinity of the Lepold site.
The bluegrass site is in a small upland watershed about 350 km to the northeast in Warrick County, Indiana. There, turtle is a prominent component of the archaeofauna, dominated by box turtle T. carolina, and with Kinosternidae also present [78] (pp. 326–328). Stafford et al. [78] (p. 331) recognized extensive small-animal use, including turtle, at some Archaic middens in the Midwest. They attributed this pattern to tht exploitation of smaller watersheds where aquatic resources especially large fish would be less inherently abundant. The Lepold site bordering a small stream flood plain about 1 km wide also seems to fit such a pattern.

4.3. Comparison to Taxon Composition of Living Communities

How does the taxon composition observed in this excavated sample compare to the taxa represented in modern living habitats? Comparison is subject to biases of both the archaeological sample and methods used to sample modern turtle communities. Researchers taking a census of turtles recognize the significant impact of collecting method and season, and explicitly describe thw capture method and sampled habitats [69,79].
Direct analogy from modern study areas to prehistory is difficult. Researchers studying turtles recognize that the small remnants of the original ecosystem available for study were modified by past human activity and are not isolated from surrounding extensively modified areas [64,66,80]. In fact, some turtle studies used ponds constructed for stock watering or recreation [32,65,81]. Such studies elucidate the habitat preferences for individual species and communities.
Reviewing 20 Midwestern turtle communities, Dreslik and Phillips [79] (p. 151) found collections to be dominated most often by sliders T. scripta and to a lesser extent painted C. picta. The Lepold turtle assemblage shows an interesting contrast. Even though painted C. picta is fairly common in the Lepold turtle fauna, slider T. scripta far from dominates the collection. In the excavated Lepold sample, even if those only identified as slider, map, or painted are all assumed to be T. scripta, the range among levels is from 5.5% in level 6 to 12.8% in levels 7 to 9 (Table 8). Instead, mud and musk Kinosternidae dominate the Lepold turtle fauna, even more than painted C. picta.
Because painted turtle C. picta outnumbers T. scripta in the Lepold collection, a habitat difference is likely related. C. picta favors permanent, small shallow ponds [32] (p. 161), whereas T. scripta is associated with deeper, a meter or more, and larger bodies of water [32] (p. 162). An instructive study by Cagle [32] (pp. 157, 161) of Elkville Lake in southern Illinois yielded a high percentage of both and C. picta and S. odoratus, and a relatively low percentage of T. scripta. The lake is shallow and vegetated with a mud bottom. During a time of low water, turtles were collected simply by wading around and catching them. Here, the low representation of T. scripta probably derives from a preference for deeper water.
T. scripta is the most common species in the aquatic turtle communities of Allred Lake and Big Oak Lake in southeast Missouri, 18 and 114 km from the Lepold site [65,66]. Modern anthropogenic habitat disturbances impact these locations. Even though one is an artificial pond within a small remnant of lowland forest [65], this may be comparable to the formation of a new cut-off lake in prehistoric times.
Musk turtle S. odoratus, even though commonly observed in modern living samples, is only captured in high frequency in shallow vegetated ponds [32] (p. 161). In contrast, mud turtle K. subrubrum favors temporary ponds [57,58]. In the Lepold collection, mud is overall much more common with 145 compared to 85 musk. However, as Table 9 shows, the ratio varies among levels. In levels 1, 2, and 5, they are nearly or equally frequent, but otherwise mud clearly outnumbers musk. No trend is evident through time. The presence of both mud and musk turtles indicates that both seasonal overflow ponds and permanent ponds existed throughout the sequence.
In sum, the high frequency of musk S. odorous and painted C. picta indicates the presence of shallow ponds. Some of these ponds are seasonal, as indicated by the high frequency of mud turtle K. subrubrum. Other taxa indicate that riverine habitat was also present throughout the Middle Holocene. No uniform directional shift of the taxon composition through time is evident, but this is not to say climatic conditions were stable for the whole interval.

5. Conclusions

Turtles are both diverse and frequent within the fauna represented at this location on the Ozark margin. The common occurrence of aquatic turtles in all levels indicates that permanent water was always in the vicinity between 7500 and 4000 BP. However, aquatic turtle taxon frequencies vary through time. Two clearly edible taxa, C. serpentina and Apalone, even though present only in low frequencies, occur throughout the midden. The aquatic taxa present suggest that, both permanent and seasonal floodplain overflow ponds were in the vicinity, although those of riverine (softshell) and upland (box) habitats are also represented.
For the turtles, three zones are evident in the midden. These are most clearly expressed by contrasting frequencies of box, T. carolina, and, Kinosternidae, mud and musk turtles. The ratios of T. carolina to Kinosternidae increase from the lowest level to a maximum at the base of the shell zone, and then decreases in the PZ. The lowest levels, represent occupation early in the Middle Archaic and initial midden deposition about 7500 BP. The shell zone from about 6000 to 4000 BP has the maximal aquatic or lowland orientation represented by the higher frequency of Kinosternidae compared to T. carolina. The PZ after 4000 BP contains mixed occupation debris of the Woodland, emergent Mississippian and Late Archaic periods.
The most common taxa, mud and musk Kinosternidae, could only be collected in the lowland in contrast to T. carolina probably is the main if not sole upland species. If exploitation of both taxa is interpreted to be incidental and expedient, then the relative proportion may generally represent aquatic or generally lowland as opposed to upland resource use intensity. The further question is whether the observed shifts in resource use are related to environmental shifts. More intensive use of aquatic resources represented by the shell zone began about 6000 BP long after initial occupation of the site in Dalton times, and when more intensive occupation indicated by midden deposition began about 7500 BP.
Within a wider climatic context, the midden deposition apparently occurred during an interval generally dryer than that of today, but of declining severity through time. Perhaps the period of maximum aridity predated the initial midden deposition. Occupation intensity increased at the site and a shift to the use of more lowland resources occurred as conditions ameliorated and generally shifted to more resemble those of today by about 4500 BP.

Author Contributions

J.J.K. and L.A.K. contributed to writing, review and editing. All authors have read and agreed to the published version of the manuscript.

Funding

Excavation was supported by National Science Foundation grant GS 3215 administered by James B. Griffin, under the field direction of James E. Price, University of Michigan Museum of Anthropology. The Smithson Institution National Museum of Natural History Small Grants Program funded six radiocarbon dates.

Institutional Review Board Statement

No animal or human subjects.

Informed Consent Statement

No human subjects.

Data Availability Statement

All data in report.

Acknowledgments

The University of Missouri provided equipment and facilities. We gratefully thank the landowners for allowing the excavation.

Conflicts of Interest

The authors declare no conflict of interest.

References

  1. Transeau, E.N. The Prairie Peninsula. Ecology 1935, 16, 427–469. [Google Scholar] [CrossRef]
  2. Gleason, H.A. The Vegetation History of the Middle West. Ann. Assoc. Am. Geogr. 1922, 12, 39–85. [Google Scholar] [CrossRef]
  3. Borchert, J.R. Climate of the Central North American Grasslands. Ann. Am. Assoc. Geogr. 1950, 40, 1–39. [Google Scholar] [CrossRef]
  4. Changnon, S.A.; Kunkel, K.E.; Winstanley, D. Quantification of Climatic Conditions Important to the Tall Grass Prairie. Trans. Ill. Acad. Sci. 2003, 96, 41–54. [Google Scholar]
  5. Kunkel, K.; Changnon, S.A. Climate-Years in the True Prairie: Temporal Fluctuations of Ecologically Critical Climate Conditions. Clim. Chang. 2003, 61, 101–122. [Google Scholar] [CrossRef]
  6. King, J.E. Late Quaternary Vegetational History of Illinois. Ecol. Monogr. 1981, 51, 43–62. [Google Scholar] [CrossRef]
  7. Nelson, D.M.; Hu, F.S.; Grimm, E.C.; Curry, B.B.; Slate, J.E. The Influence of Aridity and Fire on Holocene Prairie Communities in the Eastern Prairie Peninsula. Ecology 2006, 87, 2523–2536. [Google Scholar] [CrossRef]
  8. Williams, J.W.; Shuman, B.; Bartlein, P.J.; Diffenbaugh, N.S.; Webb, T. III Rapid, Time-Transgressive, and Variable Responses to Early Holocene Midcontinental Drying in North America. Geology 2010, 38, 135–138. [Google Scholar] [CrossRef]
  9. Wright, H.E., Jr. Climate and Biota of Eastern North America. In Environment, Origins, and Population, Handbook of North American Indians; Ubelaker, D., Ed.; Smithsonian Institution Press: Washington, DC, USA, 2006; Volume 3, pp. 99–109. [Google Scholar]
  10. Wood, W.R.; McMillan, B.R. Prehistoric Man and His Environments: A Case Study in the Ozark Highlands; Academic Press: New York, NY, USA, 1976. [Google Scholar]
  11. McMillan, R.B.; Klippel, W.E. Post-Glacial Environmental Change and Hunting-Gathering Societies of the Southern Prairie Peninsula. J. Archaeol. Sci. 1981, 8, 215–245. [Google Scholar] [CrossRef]
  12. Jefferies, R.W. The Status of Archaic Period Research in the Midwestern United States. Archaeol. East. N. Am. 1995, 23, 119–144. [Google Scholar]
  13. Milner, G.R. The Moundbuilders: Ancient Peoples of Eastern North America; Thames and Hudson: London, UK, 2004. [Google Scholar]
  14. Smith, B.D. The Archaeology of the Southeastern United States: From Dalton to de Soto, 10,500-500 B.P. Adv. World Archaeol. 1986, 5, 1–92. [Google Scholar]
  15. Stafford, C.R. Structural Changes in Archaic Landscape Use in the Dissected Uplands of Southwestern Indiana. Am. Antiq. 1994, 59, 219–237. [Google Scholar] [CrossRef]
  16. Butzer, K.W. Geomorphology of the Lower Illinois Valley as a Spatial-Temporal Context for the Koster Archaic Site; Reports of Investigations No. 34; Illinois State Museum: Springfield, IL, USA, 1977. [Google Scholar]
  17. Butzer, K.W. Changing Holocene Environments at the Koster Site: A Geo-Archaeological Perspective. Am. Antiq. 1978, 43, 408–413. [Google Scholar] [CrossRef] [Green Version]
  18. Hajic, E.R. Koster Site Archaeology I: Stratigraphy and Landscape Evolution; Research Series Volume 8; Center for American Archaeology: Kampsville, IL, USA, 1990. [Google Scholar]
  19. Phillips, J.; Brown, J. (Eds.) Archaic Hunters and Gatherers in the American Midwest; Academic Press: New York, NY, USA, 1983. [Google Scholar]
  20. Munson, P.J. What Happened in the Archaic in the Midwestern United States? Rev. Anthropol. 1986, 13, 276–282. [Google Scholar] [CrossRef]
  21. Jefferies, R.W.; Thompson, V.D.; Milner, G.R. Archaic Hunter-Gatherer Landscape Use in West-Central Kentucky. J. Field Archaeol. 2005, 30, 2–23. [Google Scholar] [CrossRef]
  22. Milner, G.R.; Jefferies, R.W. The Read Archaic Shell Midden in Kentucky. Southeast. Archaeol. 1998, 17, 119–132. [Google Scholar]
  23. Morey, D.F.; Crothers, G.M.; Stein, J.K.; Fenton, J.P.; Herrmann, N.P. The Fluvial and Geomorphologic Context of Indian Knoll, an Archaic Shell Midden in West-Central Kentucky. Geoarchaeology 2002, 17, 521–553. [Google Scholar] [CrossRef]
  24. Denniston, R.F.; Gonzalez, L.; Semken, H.A., Jr.; Asmeron, Y.; Baker, R.G.; Recelli-Snyder, H.; Reagan, M.K.; Bettis, E.A., III. Integrating Stalagmite, Vertebrate, and Pollen Sequences to Investigate Holocene Vegetation and Climate Change in the Southern Midwestern United States. Quat. Res. 1999, 52, 381–387. [Google Scholar] [CrossRef]
  25. Denniston, R.F.; Gonzalez, L.A.; Asmeron, Y.; Reagan, M.K.; Recelli-Snyder, H. Speleothem Carbon Isotopic Records of Holocene Environments in the Ozark Highlands, USA. Quat. Int. 2000, 67, 21–27. [Google Scholar] [CrossRef]
  26. Brewer, D.J. Zooarchaeology: Method, Theory, Goals. Archaeol. Method Theory 1992, 4, 95–244. [Google Scholar]
  27. Cleland, C.E. The Prehistoric Animal Ecology and Ethnozoology of the Upper Great Lakes Region; Anthropological Papers No. 29; Museum of Anthropology, University of Michigan: Ann Arbor, Michigan, 1966. [Google Scholar]
  28. Lyman, R.L. Archaeofaunas and Subsistence Studies. Adv. Archaeol. Method Theory 1982, 5, 331–393. [Google Scholar]
  29. Lyman, R.L. Applied Zooarchaeology: An Archaeological Perspective from the Americas. World Archaeol. 1996, 28, 110–125. [Google Scholar] [CrossRef]
  30. Lyman, R.L. Paleozoology in the Service of Conservation Biology. Evol. Anthropol. 2006, 15, 11–19. [Google Scholar] [CrossRef]
  31. Bodie, J.R.; Semlitsch, R.D.; Renken, R.B. Diversity and Structure of Turtle Assemblages: Associations with Wetland Characters Across a Floodplain Landscape. Ecography 2000, 23, 444–456. [Google Scholar] [CrossRef]
  32. Cagle, F.R. Herpetological Fauna of Jackson and Union Counties, Illinois. Am. Midl. Nat. 1942, 10, 164–204. [Google Scholar] [CrossRef]
  33. Ernst, C.H.; Lovich, J.E. Turtles of the United States and Canada, 2nd ed.; The Johns Hopkins University Press: Baltimore, MD, USA, 2009. [Google Scholar]
  34. Johnson, T.R. The Amphibians and Reptiles of Missouri; Missouri Department of Conservation: Jefferson City, MO, USA, 1987. [Google Scholar]
  35. Adler, K. Turtles from Archeological Sites in the Great Lakes Region. Mich. Archaeol. 1968, 14, 147–163. [Google Scholar]
  36. Holman, J.A. The Status of Michigan Pleistocene Herpetofauna. Mich. Acad. 1988, 20, 125–132. [Google Scholar]
  37. Holman, J.A. North American Pleistocene Herpetofauna Stability and Its Impact on the Interpretation of Modern Herpetofaunas: An Overview. In Beamers, Bobwhites, and Blue-Points, Tributes to the Career of Paul W. Parmalee; James, R., Purdue, J.R., Walter, E., Klippel, W.E., Bonnie, W., Styles, B.W., Eds.; Reports of Investigations No. 23; Illinois State Museum: Springfield, IL, USA, 1991; pp. 227–235. [Google Scholar]
  38. Holman, J.A.; Richards, R.L. 1993 Herpetofauna of the Prairie Creek Site, Daviess County, Indiana. Proc. Indiana Acad. Sci. 1993, 102, 115–131. [Google Scholar]
  39. Parmalee, P.W. A Recent Cave Bone Deposit in Southwestern Illinois. Bull. Natl. Speleol. Soc. 1967, 29, 119–147. [Google Scholar]
  40. Parmalee, P.W.; Oesch, R.D.; Guildey, J. Pleistocene and Recent Vertebrate Fauna from Crankshaft Cave, Missouri; Reports of Investigations No. 14; Illinois State Museum: Springfield, IL, USA, 1969. [Google Scholar]
  41. Parmalee, P.W.; Ronald, D.; Oesch, R.D. Pleistocene and Recent Faunas from the Brynjulfson Caves, Missouri; Reports of Investigations No. 25; Illinois State Museum: Springfield, IL, USA, 1972. [Google Scholar]
  42. Fowler, M.L.; Parmalee, P.W. Ecological Interpretation of Data on Archaeological Sites: The Modoc Rock Shelter. Trans. Ill. State Acad. Sci. 1959, 52, 109–119. [Google Scholar]
  43. Dye, D.H.; Moore, K.H. Recovery Systems for Subsistence Data: Water Screening and Water Flotation. Tenn. Anthropol. 1978, 3, 59–69. [Google Scholar]
  44. Lynott, M.J.; Monk, S.M. The Lepold Site, 23RI59. Mo. Archaeol. Soc. Q. 1987, 4, 8–11. [Google Scholar]
  45. Jones, R.A.; Williams, J.W.; Jackson, S.T. Vegetation History Since the Last Glacial Maximum in the Ozark Highlands (USA): A New Record from Cupola Pond, Missouri. Quat. Sci. Rev. 2015, 170, 146–187. [Google Scholar] [CrossRef]
  46. Bettis, E.A. III Patterns in Holocene Colluvium and Alluvial Fans Across the Prairie-Forest Transition in the Midcontinent USA. Geoarchaeology 2003, 8, 779–797. [Google Scholar] [CrossRef]
  47. Jacobson, R.B.; Primm, A.T. Historical Land-Use Changes and Potential Effects on Stream Disturbance in the Ozark Plateaus, Missouri; Water Supply Paper No. 2484; US Department of the Interior, US Geological Survey: Reston, VA, USA, 1994. [Google Scholar]
  48. Kidder, T.R.; Adelsberger, K.A.; Arco, L.J.; Schilling, T.M. Basin-Scale Reconstruction of Geologi`cal Context of Human Settlement: An Example from the Lower Mississippi Valley, USA. Quat. Sci. Rev. 2008, 27, 1255–1270. [Google Scholar] [CrossRef]
  49. Van Arsdale, R.B.; Cupples, W.B.; Csontos, R.M. Pleistocene-Holocene Transition in the Central Mississippi River Valley. Geomorphology 2014, 214, 270–282. [Google Scholar] [CrossRef]
  50. Rittenour, T.M.; Blum, M.B.; Goble, R.J. Fluvial Evolution of the Lower Mississippi River Valley During the Last 100 K.Y. Glacial Cycle: Response to Glaciation and Sea-Level Change. Geol. Soc. Am. Bull. 2007, 119, 586–608. [Google Scholar] [CrossRef]
  51. Royall, P.D.; Delcourt, P.A.; Delcourt, H.R. Late-Quaternary Paleoecology and Paleoenvironments of the Central Mississippi Valley. Geol. Soc. Am. Bull. 1991, 103, 157–170. [Google Scholar] [CrossRef]
  52. Delcourt, H.R.; Delcourt, P.A.; Royall, P.D. Late Quaternary Vegetational History of the Western Lowlands. In Sloan, A Paleoindian Dalton Cemetery in Arkansas; Morse, D.F., Ed.; Smithsonian Institution Press: Washington, DC, USA, 1997; pp. 103–122. [Google Scholar]
  53. Denniston, R.F.; DuPree, M.; Dorale, J.A.; Asmerom, Y.; Polyak, V.J.; Carpenter, S.J. Episodes of Late Holocene Aridity Recorded by Stalagmites from Devil’s Ice Box Cave, Central Missouri, USA. Quat. Res. 2007, 68, 45–52. [Google Scholar] [CrossRef]
  54. Grayson, D.K. Quantitative Zooarchaeology: Topics in the Analysis of Archaeological Faunas; Academic Press: Orlando, FL, USA, 1984. [Google Scholar]
  55. Krebs, C.J. Ecology: The Experimental Analysis of Distribution and Abundance; Harper and Row: New York, NY, USA, 1972. [Google Scholar]
  56. Whitaker, R.H. Communities and Ecosystems; Macmillan: New York, NY, USA, 1970. [Google Scholar]
  57. Risley, P.L. Observations on the Natural History of the Common Musk Turtle, Sternotherus odoratus (Latreille). Pap. Mich. Acad. Sci. Arts Lett. 1932, 17, 685–711. [Google Scholar]
  58. Skorepa, A.C.; Ozment, J. Habitat, Habits, and Variation of Kinosternon subrubrum in Southern Illinois. Trans. Ill. Acad. Sci. 1968, 61, 247–251. [Google Scholar]
  59. Cagle, F.R. The Life History of the Slider Turtle, Pseudemys scripta troostii (Holbrook). Ecol. Monogr. 1950, 20, 31–54. [Google Scholar] [CrossRef]
  60. Reagan, D.P. Habitat Selection in the Three-toed Box Turtle, Terrapene carolina triungus. Copeia 1974, 1974, 512–527. [Google Scholar] [CrossRef]
  61. Harris, K.A.; Clark, J.D.; Elmore, R.D.; Harper, C.A. Direct and Indirect Effects of Fire on Eastern Box Turtles. J. Wildl. Manag. 2020, 84, 1384–1395. [Google Scholar] [CrossRef]
  62. Guyette, R.P.; Muzika, R.M.; Dey, D.C. Dynamics of an Anthropogenic Fire Regime. Ecosystems 2002, 5, 472–486. [Google Scholar]
  63. Congdon, J.D.; Green, J.L.; Gibbons, J.W. Biomass of Freshwater Turtles: A Geographical Comparison. Am. Midl. Nat. 1986, 115, 165–173. [Google Scholar] [CrossRef]
  64. Dreslik, M.J.; Kuhns, A.R.; Phillips, C.A. Structure and Composition of a Southern Illinois Freshwater Turtle Assemblage. Northeast. Nat. 2005, 12, 173–186. [Google Scholar] [CrossRef]
  65. Glorioso, B.M.; Vaughn, A.J.; Waddle, J.H. The Aquatic Turtle Assemblage Inhabiting a Highly Altered Landscape in Southeast Missouri. J. Fish Wildl. Manag. 2010, 1, 161–168. [Google Scholar] [CrossRef]
  66. Nickerson, M.A.; Mitchell, J.C.; Glorioso, B.M. The Importance of Turtle Populations to Wetland Restoration in the Upper Mississippi Embayment of the Mississippi Alluvial Valley. Wetl. Ecol. Manag. 2019, 27, 683–692. [Google Scholar] [CrossRef]
  67. Clark, H.W.; Southall, J.R. Fresh-Water Turtles: A Source of Meat Supply; Document 889; Bureau of Fisheries, U.S. Department of Commerce: Washington, DC, USA, 1920. [Google Scholar]
  68. Cahn, A.R. The Turtles of Illinois; Illinois Biological Monographs, University of Illinois: Urbana, IL, USA, 1937; Volume 16. [Google Scholar]
  69. Reehl, M.; Thompson, J.; Tucker, J.K. A Three Year Survey of Aquatic Turtles in a Riverside Pond. Trans. Ill. State Acad. Sci. 2006, 99, 145–152. [Google Scholar]
  70. Parmalee, P.W. The Food Economy of Archaic and Woodland Peoples at the Tick Creek Cave Site, Missouri. Mo. Archaeol. 1965, 27, 1–34. [Google Scholar]
  71. Adler, K. The Influence of Prehistoric Man on the Distribution of the Box Turtle. Ann. Carnegie Mus. 1969, 41, 263–280. [Google Scholar]
  72. Congdon, J.D.; Dunham, A.E.; van Loben Sels, R.C. Demographics of Common Snapping Turtles (Chelydra serpentina): Implications and Management of Long-Lived Organisms. Am. Zool. 1994, 34, 397–408. [Google Scholar] [CrossRef] [Green Version]
  73. Hunter, M., Jr. Benchmarks for Managing Ecosystems: Are Human Activities Natural? Conserv. Biol. 1996, 10, 695–697. [Google Scholar] [CrossRef] [Green Version]
  74. Abrams, M.D. Fire and the Development of Oak Forests. Bioscience 1992, 42, 346–353. [Google Scholar] [CrossRef]
  75. Abrams, M.D.; Nowacki, G.J. Native Americans as Active and Passive Promoters of Mast and Fruit Trees in the Eastern USA. Holocene 2008, 18, 1123–1137. [Google Scholar] [CrossRef]
  76. Delcourt, P.A.; Delcourt, H.R.; Cridebaugh, P.A.; Chapman, J. Holocene Ethnobotanical and Paleoecological Record of Human Impact on Vegetation in the Little Tennessee Valley, Tennessee. Quat. Res. 1986, 25, 330–349. [Google Scholar] [CrossRef]
  77. Roberts, R.G. Tick Creek Cave an Archaic Site in the Gasconade River Valley of Missouri. Mo. Archaeol. 1965, 27, 1–52. [Google Scholar]
  78. Stafford, C.R.; Richards, R.L.; Anslinger, C.M. The Bluegrass Fauna and Changes in Middle Holocene Hunter-Gatherer Foraging in the Southern Midwest. Am. Antiq. 2000, 65, 317–336. [Google Scholar] [CrossRef]
  79. Dreslik, M.J.; Phillips, C.A. Turtle Communities in the Upper Midwest, USA. J. Freshw. Ecol. 2005, 20, 149–164. [Google Scholar] [CrossRef]
  80. Broadman, R.; Cortwright, S.; Resetar, A. Historical Changes of Reptiles and Amphibians of Northwest Indiana Fish and Wildlife Properties. Am. Midl. Nat 2002, 147, 135–144. [Google Scholar] [CrossRef]
  81. Stone, P.A.; Hauge, J.B.; Scott, A.F.; Guyer, C.; Donie, J.L. Temporal Changes in Two Turtle Assemblages. J. Herpetol. 1993, 27, 13–23. [Google Scholar] [CrossRef]
Figure 1. Location of Lepold site and others in central Mississippi valley.
Quaternary 05 00029 g001
Figure 2. Excavation plan of Lepold site.
Quaternary 05 00029 g002
Figure 3. Distribution of bone fragments by level.
Quaternary 05 00029 g003
Figure 4. Turtle taxon counts by level.
Quaternary 05 00029 g004
Figure 5. Turtle taxon percentage of counts by level.
Quaternary 05 00029 g005
Figure 6. Cut turtle bone, south units (75/80), level 3.
Quaternary 05 00029 g006
Table 1. Radiocarbon dates.
Unit and LevelDepth (cm)Lab No.MaterialRCY BP13C/12C
1981test20–40 B-5601bone3900 ± 110−21.7
105/75346–58B-104976nut shell6110 ± 60−25.2
100/70570–82B-66800bone5630 ± 50−23.3
75/80682–95B-66801bone6300 ± 80−23.5
75/80795–107B-10975nut shell7260 ± 60−26.9
100/70795–107B-10977nut shell7450 ± 60−27.4
75/758107–119B-65936bone7235 ± 95−24.6
Table 2. Total bone fragments and turtle by level.
LevelTotalTurtlePercent Turtle
PZ5965121920.4
15186152429.4
25236161130.8
34311141832.9
4333088626.6
5247569728.2
6192246023.9
781315819.4
85239618.3
95408315.4
Total30301815226.9
Table 3. Summary of turtle species and habitats.
Common NameScientific NameCharacteristic Habitat
Snapping Chelydra serpentinaSlow-moving shallow water, soft bottom with aquatic vegetation [33] (p. 115)
Eastern BoxTerrapene carolinaOpen mesic woodland [33] (p. 411)
Common Musk Sternotherus odoratusSlow-moving shallow rivers and ponds with soft bottom [33] (p. 526)
Eastern MudKinosternon subrubrumSlow moving, shallow water, soft bottom with aquatic vegetation [33] (p. 501)
Smooth SoftshellApalone nuticaMedium and large rivers [33] (pp. 614–615)
Spiny SoftshellApalone spiniferaRivers, side channels, and ponds [33] (p. 624)
Northern MapGraptemys geographicaLarge bodies of water, rivers and lakes, with basking sites [33] (p. 295)
False MapGraptemys pseudographicaLarge bodies of water, rivers and lakes, with basking sites and vegetation [33] (p. 327)
Pond SliderTrachemys scriptaPonds and slow rivers, 1 to 2 m deep, with aquatic vegetation [33] (p. 447)
PaintedChrysemys pictaSlow-moving shallow water, soft bottom, with vegetation [33] (p. 188)
Table 4. Turtle taxon counts by level.
Level
TaxaPZ123456789
T. carolina7888999548322512127
T. scripta111185783601
G. geographica3122130100
C. picta28303038261812111
G. psedographica58114614200
Slider/Map/Painted561112942002
C. serpentina619913885051
K. subrubrum1915293415198510
S. odoratus71522131492210
Kinosternidae78155178174132955418148
Apalone77613321000
Unknown9721168120610156174983441116263
Table 5. Combined taxon counts and percentage by level.
T. carolinaSlider/Map/PaintedChelydra/Trionychidae Kinosternidae
Levelct %ct%ct%ct%
PZ7832522113510442
18825561626718552
29924621515422956
39523611526622155
44818491811416160
53216341710512362
625222118656455
7–931311515664949
Table 6. Combined taxon frrequency by level.
observed
TaxonPZ1234567–9
T. carolina7888999548322531
Slider/Map/Painted5256626149342115
Chelydra/Apalone13261526111066
Kinosternidae1041852292211611236449
expected
T. carolina58.5849695.463.747.127.523.9
Slider/Map/Painted4159.367.767.344.933.219.416.9
Chelydra/Apalone1319.121.821.714.510.76.35.4
Kinosternidae133.9192.5219.6218.5145.8107.962.954.8
χ2 cell values
T. carolina6.50.190.09034.80.322.1
Slider/Map/Painted2.90.180.480.590.370.020.130.21
Chelydra/Apalone02.492.120.850.840.040.010.07
Kinosternidae6.670.030.40.031.582.10.020.61
Totalχ2 = 40.54; p 0.05 = 32.67; p. 0.01 = 38.93
Table 7. T. carolina and Kinosternidae counts by level.
TaxaPZ123456789Total
T. carolina7888999548322512127496
Kinosternidae10418522922116112364251681136
Kino/T. c.1.332.12.312.333.353.842.562.081.331.142.29
Table 8. Maximal T. scripta and percentage of total excluding T. carolina by level.
TaxaPZ1234567–9
Max. poss.16171917161259
Percent9.56.46.25.57.28.75.512.8
Total count1692673063082211379170
Table 9. Distribution comparison of mud and musk turtles.
TaxaPZ1234567–9
K. subrubrum19152934151986
S. odoratus715221314923
Ratio K/S2.711.32.61.12.142
Publisher’s Note: MDPI stays neutral with regard to jurisdictional claims in published maps and institutional affiliations.

