Introduction
In recent years, several techniques have been developed for the early diagnosis and the ongoing follow up of several fatal diseases. The main prerequisites are: to be minimally invasive, to make use of biodevices based on nanosized materials, to show high biocompatibility and longterm stability. Aptamers are small fragments of ssDNA or RNA, entitled to play a primary role in this challenge. They are artificially assembled for achieving high binding affinity to their targets (from proteins to simple ions). Furthermore, low dimension, short half-time, low immunogenicity and production costs make them formidable competitors of antibodies in both diagnosis and therapy.
Nevertheless, it has to be pointed out that acceptance and use of aptamers in industry and by (bio)pharmaceutical companies is still rare (
Famulok & Mayer, 2014). The reason is primarily linked to the lack of information concerning the binding mechanism with target, intrinsically interesting, since a single referencing model does not exist and different possible scenarios have been drawn to explain the formation of aptamer-receptor complex, including conformational shift, induced fit, lock and key (
Koshland, 1995;
Kinghorn et al., 2017). Furthermore, the in vivo exploration (
Tuerk & Gold, 1990) is quite difficult and can be extremely time-consuming. Public data, such as the European Bioinformatics Institute (EMBLEBI
https://www.ebi.ac.uk), provide free and open access to a range of bioinformatics applications for sequence analysis, but, mainly for aptamers, crystallographic characterization is still in its infancy.
In parallel with the in vitro techniques, many computational procedures have been developed for predicting 3D structure from sequence information. In general, aptamer-protein complexes are obtained passing through two main steps: first, aptamers have to be folded, thus the folded (3D) sequences have to be docked with the protein. Docking tools provide a ranking for the obtained configurations, taking into account many parameters, such as the interaction energies between the two molecules, the desolvation and solvation energies associated with the interacting molecules and the entropic factors that occur upon binding (
Trott & Olson, 2010).
However, the ranking assignment continues to be an open question (
Kaufmann et al., 2017;
Cataldo et al., 2018). In a recent investigation (
Cataldo et al., 2019), a new estimate was proposed to complement the computational ranking outcomes, based on maximum likelihood criteria of the topological and electrical properties of aptamer-protein complexes. It was applied on a set of anti-angiopoietin(Ang2) aptamers, whose performances are known from the experiments (
Hu et al., 2015). From the analysis, two principal types of conformers were identified and a deep discussion of the possible scenarios linked to those results was performed. The present paper aims to formulate a novel and simplified procedure to analyse all those different conformers, looking at topological characteristics of the networks representing the biomolecules. We show that important features can be extracted, another type of arrangement aptamer-Ang2 is observed, and finally, we suggest on which flaws and imperfection research has to focus its attention.
Background
Angiopoietins are part of a family that have a prominent role in vascular disease (
Fagiani & Christofori, 2013) and vasculature upregulation of many types of tumours (
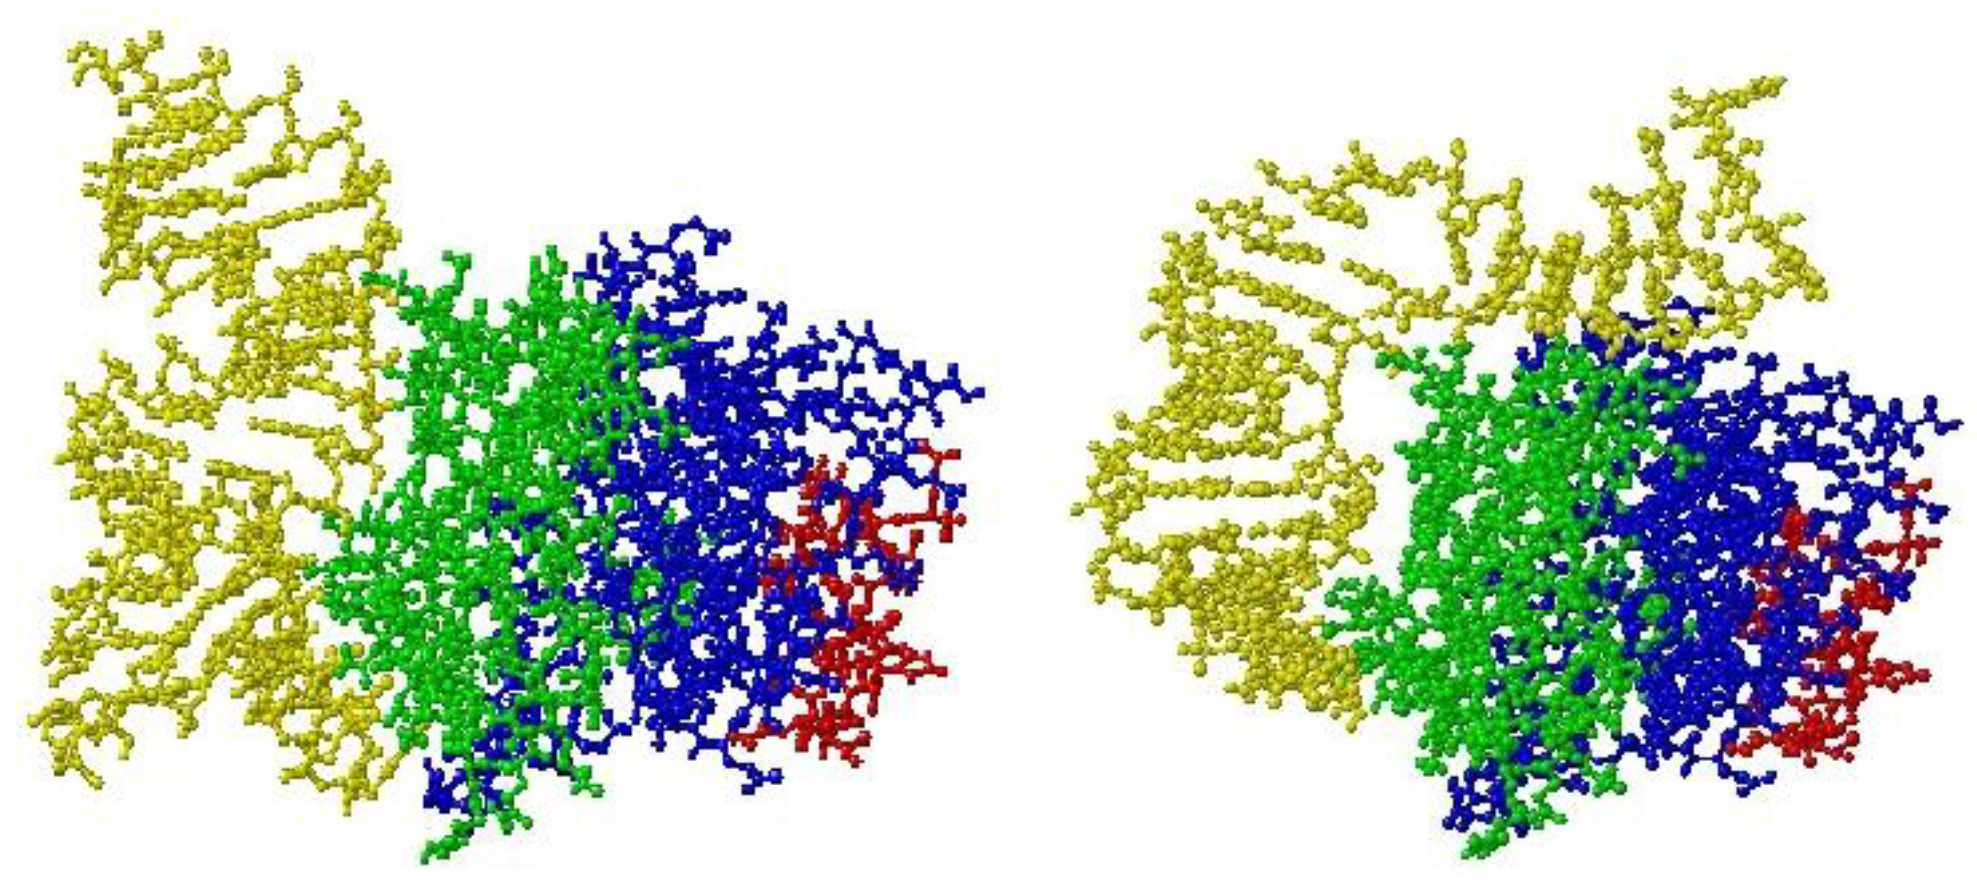
White et al., 2003). The most extensively studied angiopoietins are Ang1 and Ang2, especially for their involvement in cancer therapy. Ang2 is a compact protein with three domains, named A, B, and P. The P domain is the most divergent (
Figure 1), both in sequence and in structure, among the fibrinogen homologs, and it is the site of ligand binding for most fibrinogen domain-containing proteins (
Barton et al., 2005).
Hu et al. (
2015) selected and studied the affinity properties of a set of five sequences: two of them were natural anti-Ang2 and anti-Ang1 aptamers, while the other three were mutated sequences; the affinity for the target was evaluated by means of measurements with a surface plasmon resonance (SPR) biosensor. Conflicting results concerning the performances of the sequences were observed; in particular, the sequence with the best computational rank among the five considered (named Seq2_12_35) was one of the worst performing in experiments.
In (
Cataldo et al., 2018) a procedure to cope with the problem of docking of ligands characterized by a large number of flexible freedom degrees was presented, by using as case-study the five aptamers proposed in (
Hu et al., 2015). The 3D structure of the aptamers was obtained by using the free SimRNA software (
Boniecki et al., 2015), docking was performed by means of rigid or flexible roto-translations in the free AutoDock Vina tool (
Trott & Olson, 2010). For scoring the complexes, a single and energetic quantity called “effective affinity” (EA) was proposed, putting together the docking energy provided by AutoDock Vina and the SimRNA energies.
In (
Cataldo et al., 2019) a novel kind of scoring was addressed, starting from the same aptamers in (
Hu et al., 2015). The study revealed a different type and abundance of conformers, which would best represent each aptamer-protein complex. The one, named Hair, mimics the binding with its natural protein target (Tie2), the other, named Belt, hangs the protein also far from the original binding domain (
Figure 1). The results highlighted that: a. the effective affinity (
Cataldo et al., 2018) seems not to be able to discriminate between these two types of conformers, because their values are quite similar; b. the Ang2-specific aptamer prefers Hair conformers; c. the Ang1-specific aptamer prefers Belt conformers; d. mutated sequences do not show a distinct preference. In other terms, it seems that the Hair conformer characterizes the high affinity complexes, while the Belt conformer characterizes the low affinity complexes.
Graph analysis
Starting from some seminal papers (
Watts & Strogatz, 1999;
Albert & Barabási, 2000), graph analysis has received increasing attention with applications to several fields of research, from physics to psychology. In fact, graph analysis is able to capture part of the complexity, which is inherent in most of natural phenomena. The inner idea is to explain multiscale-multiphasemany body phenomena by using interactions, thus in terms of networks.
Network has a topological structure given by the associated graph
G(N,L), with
N the node set and
L the link set (
Van Mieghem et al., 2014). In proteins, the C
α atom of each amino acid is considered as a node, and two amino acids are considered nearest neighbors if the distance between their C
α atoms is less than an assigned threshold value. This distance or cut-off radius R
C is a free parameter; whose tuning produces a graph more or less connected (
Alfinito et al., 2017). Once all the Euclidean distances between the couples of C
α atoms are calculated, a distance matrix is obtained; from the distance matrix, the graph description of the network is represented through its adjacency matrix
A of size
N x N, with element:
ai,j = 1 (there is a link), if the distance between node i and j is less than the assigned RC;
ai,j = 0 (there is no link), if the distance between node i and j is greater than the assigned RC.
We assume that no self-loops (hence
ai,i = 0) and no overlapping links exist, i.e. there cannot be more than one link between
ai,j , therefore, we deal with a
simple graph (
Albert & Barabási, 2000).
Among the various parameters that measure the graph characteristics, we point out on the following, giving a short definition.
Degree: the degree
k is defined as the total number of network connections. The average of
ki over all
i nodes is called the average degree
[k] of the network. The spread in node degree is characterized by a distribution function
P(k), which gives the probability that a randomly selected node has exactly
k links (
Wang, 2002).
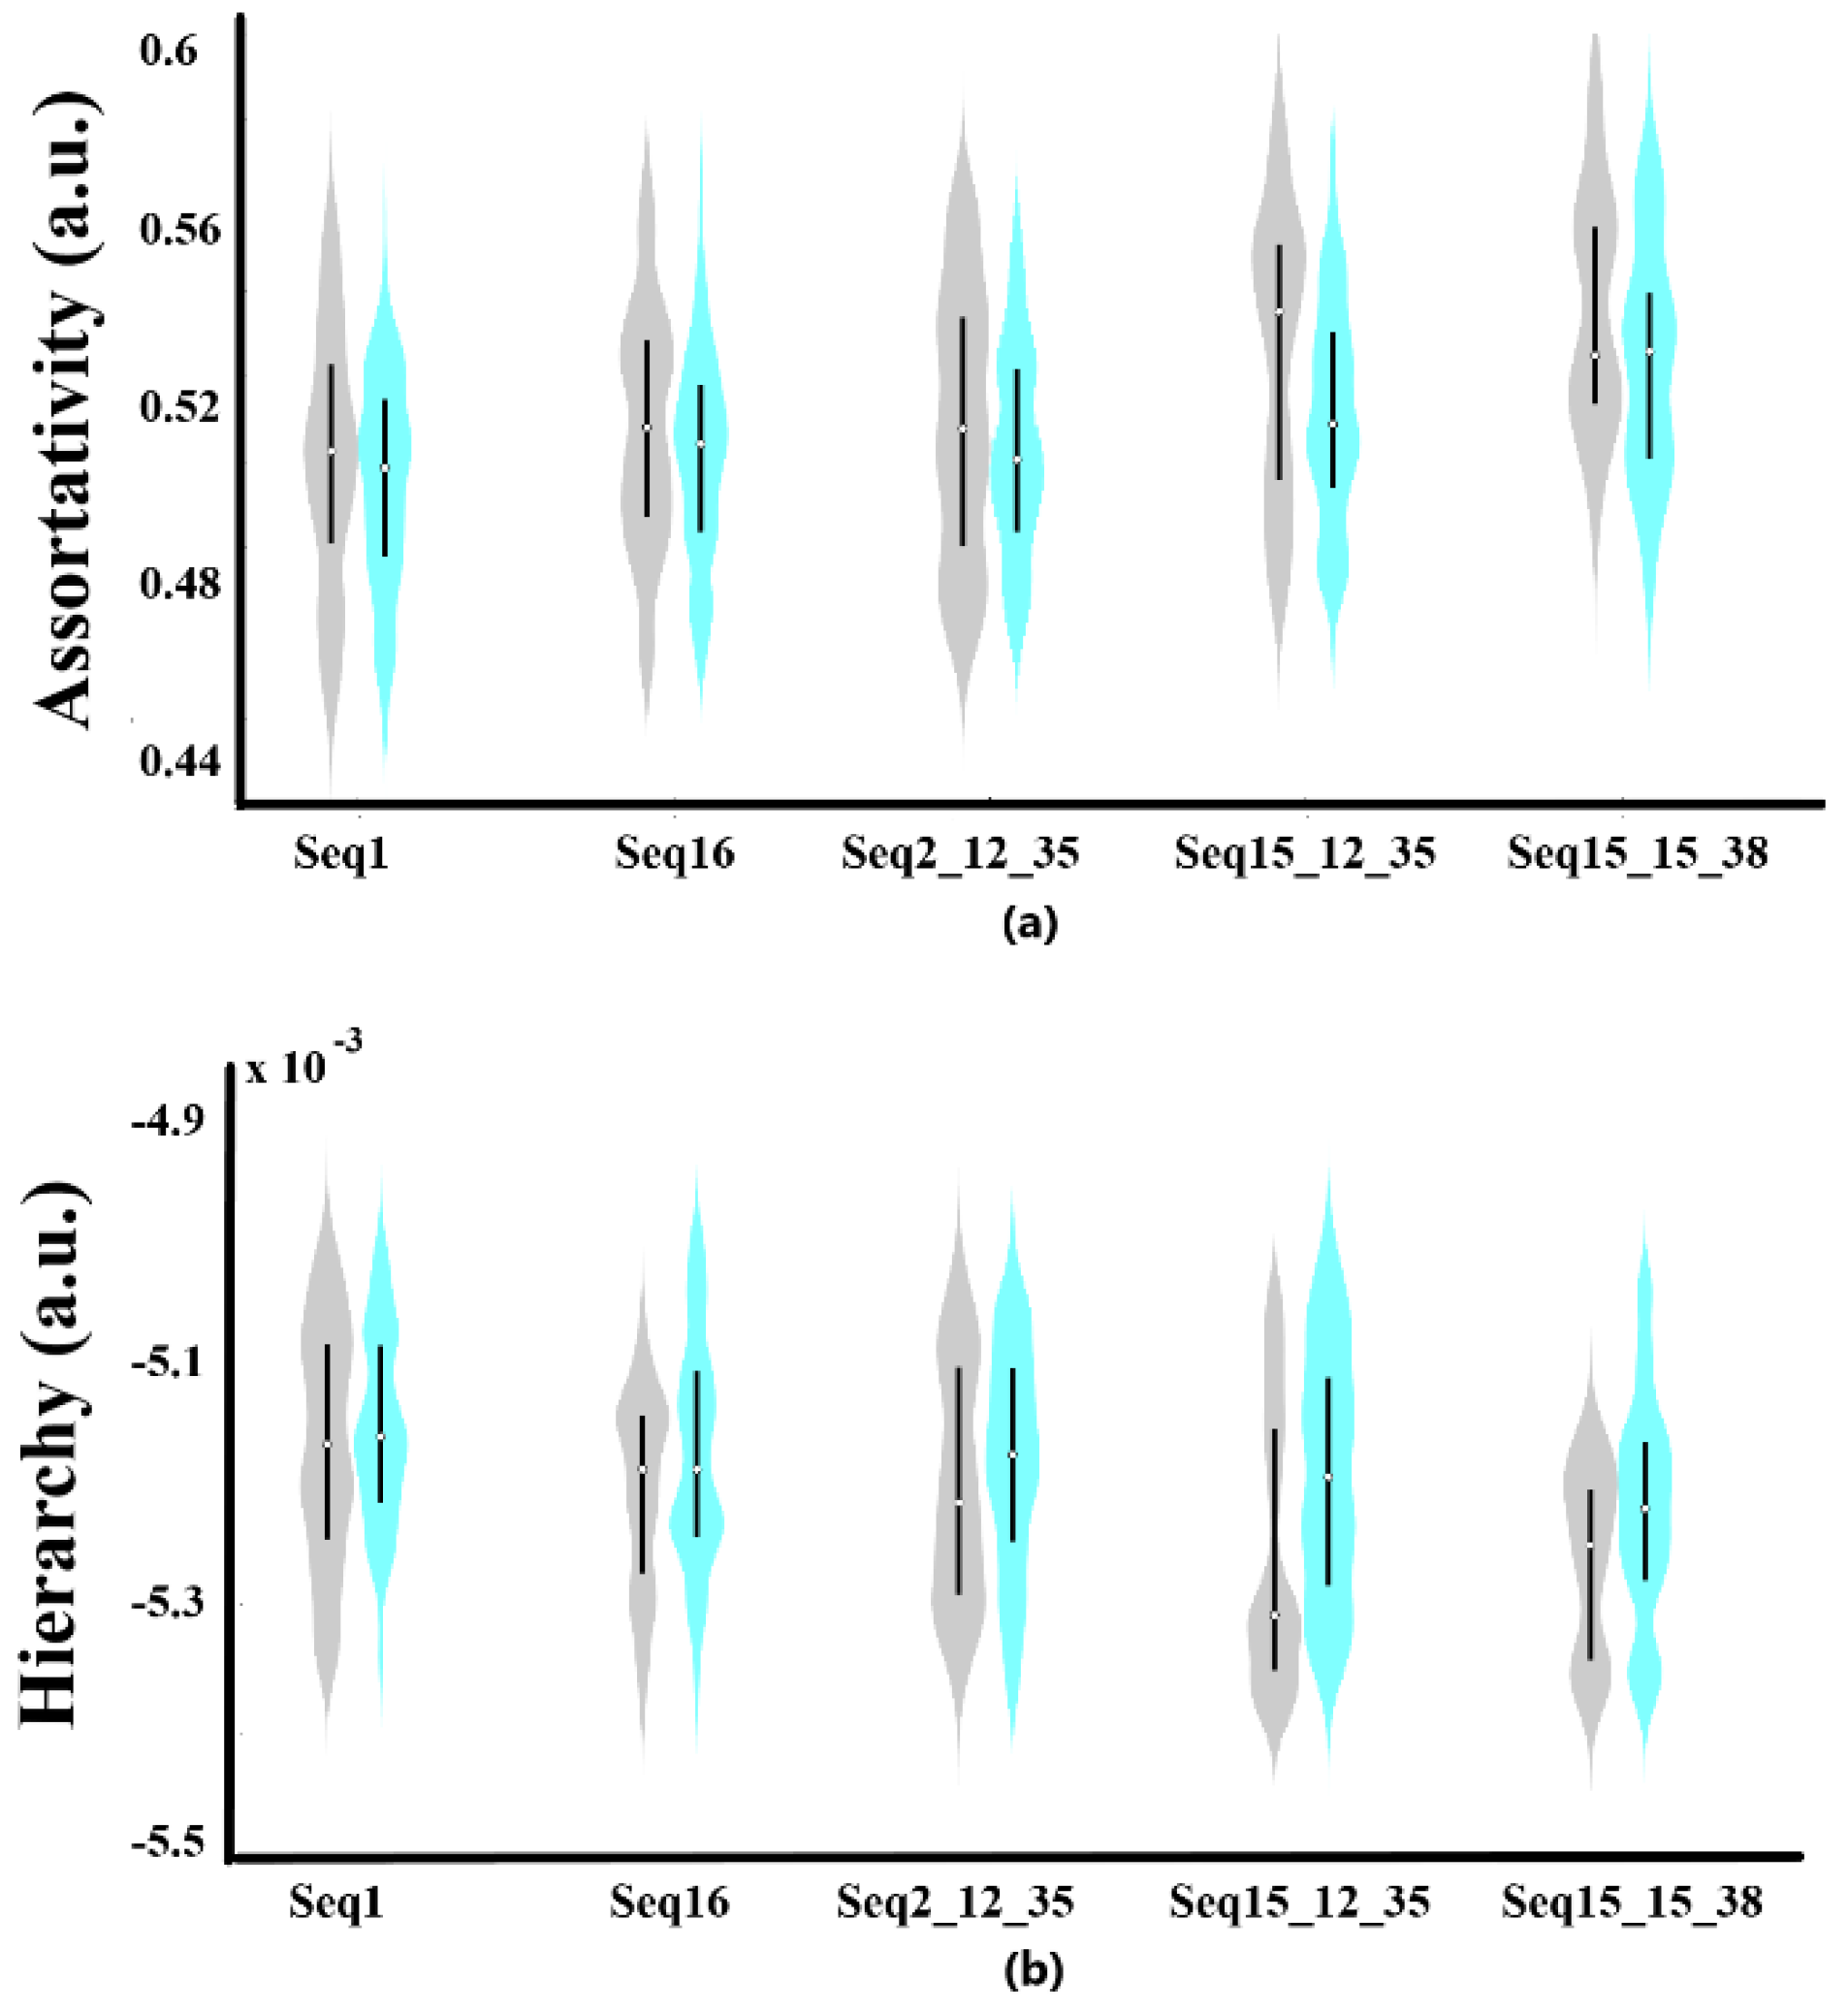
Assortative mixing and coefficient of assortativity (r): a network is said to show ‘assortative mixing’, if the high-degree nodes tend to be connected with other high-degree nodes, and ‘disassortative’ when the high-degree nodes tend to connect with low-degree nodes. It is the Pearson correlation coefficient of the degrees at either ends of a link and lies in the range −1≤r≤1; r = 1 means perfect assortativity, r = −1 means perfect disassortativity, r = 0 means no assortativity (random linking). If a network has perfect assortativity (r = 1), then all nodes connect only with nodes with the same degree.
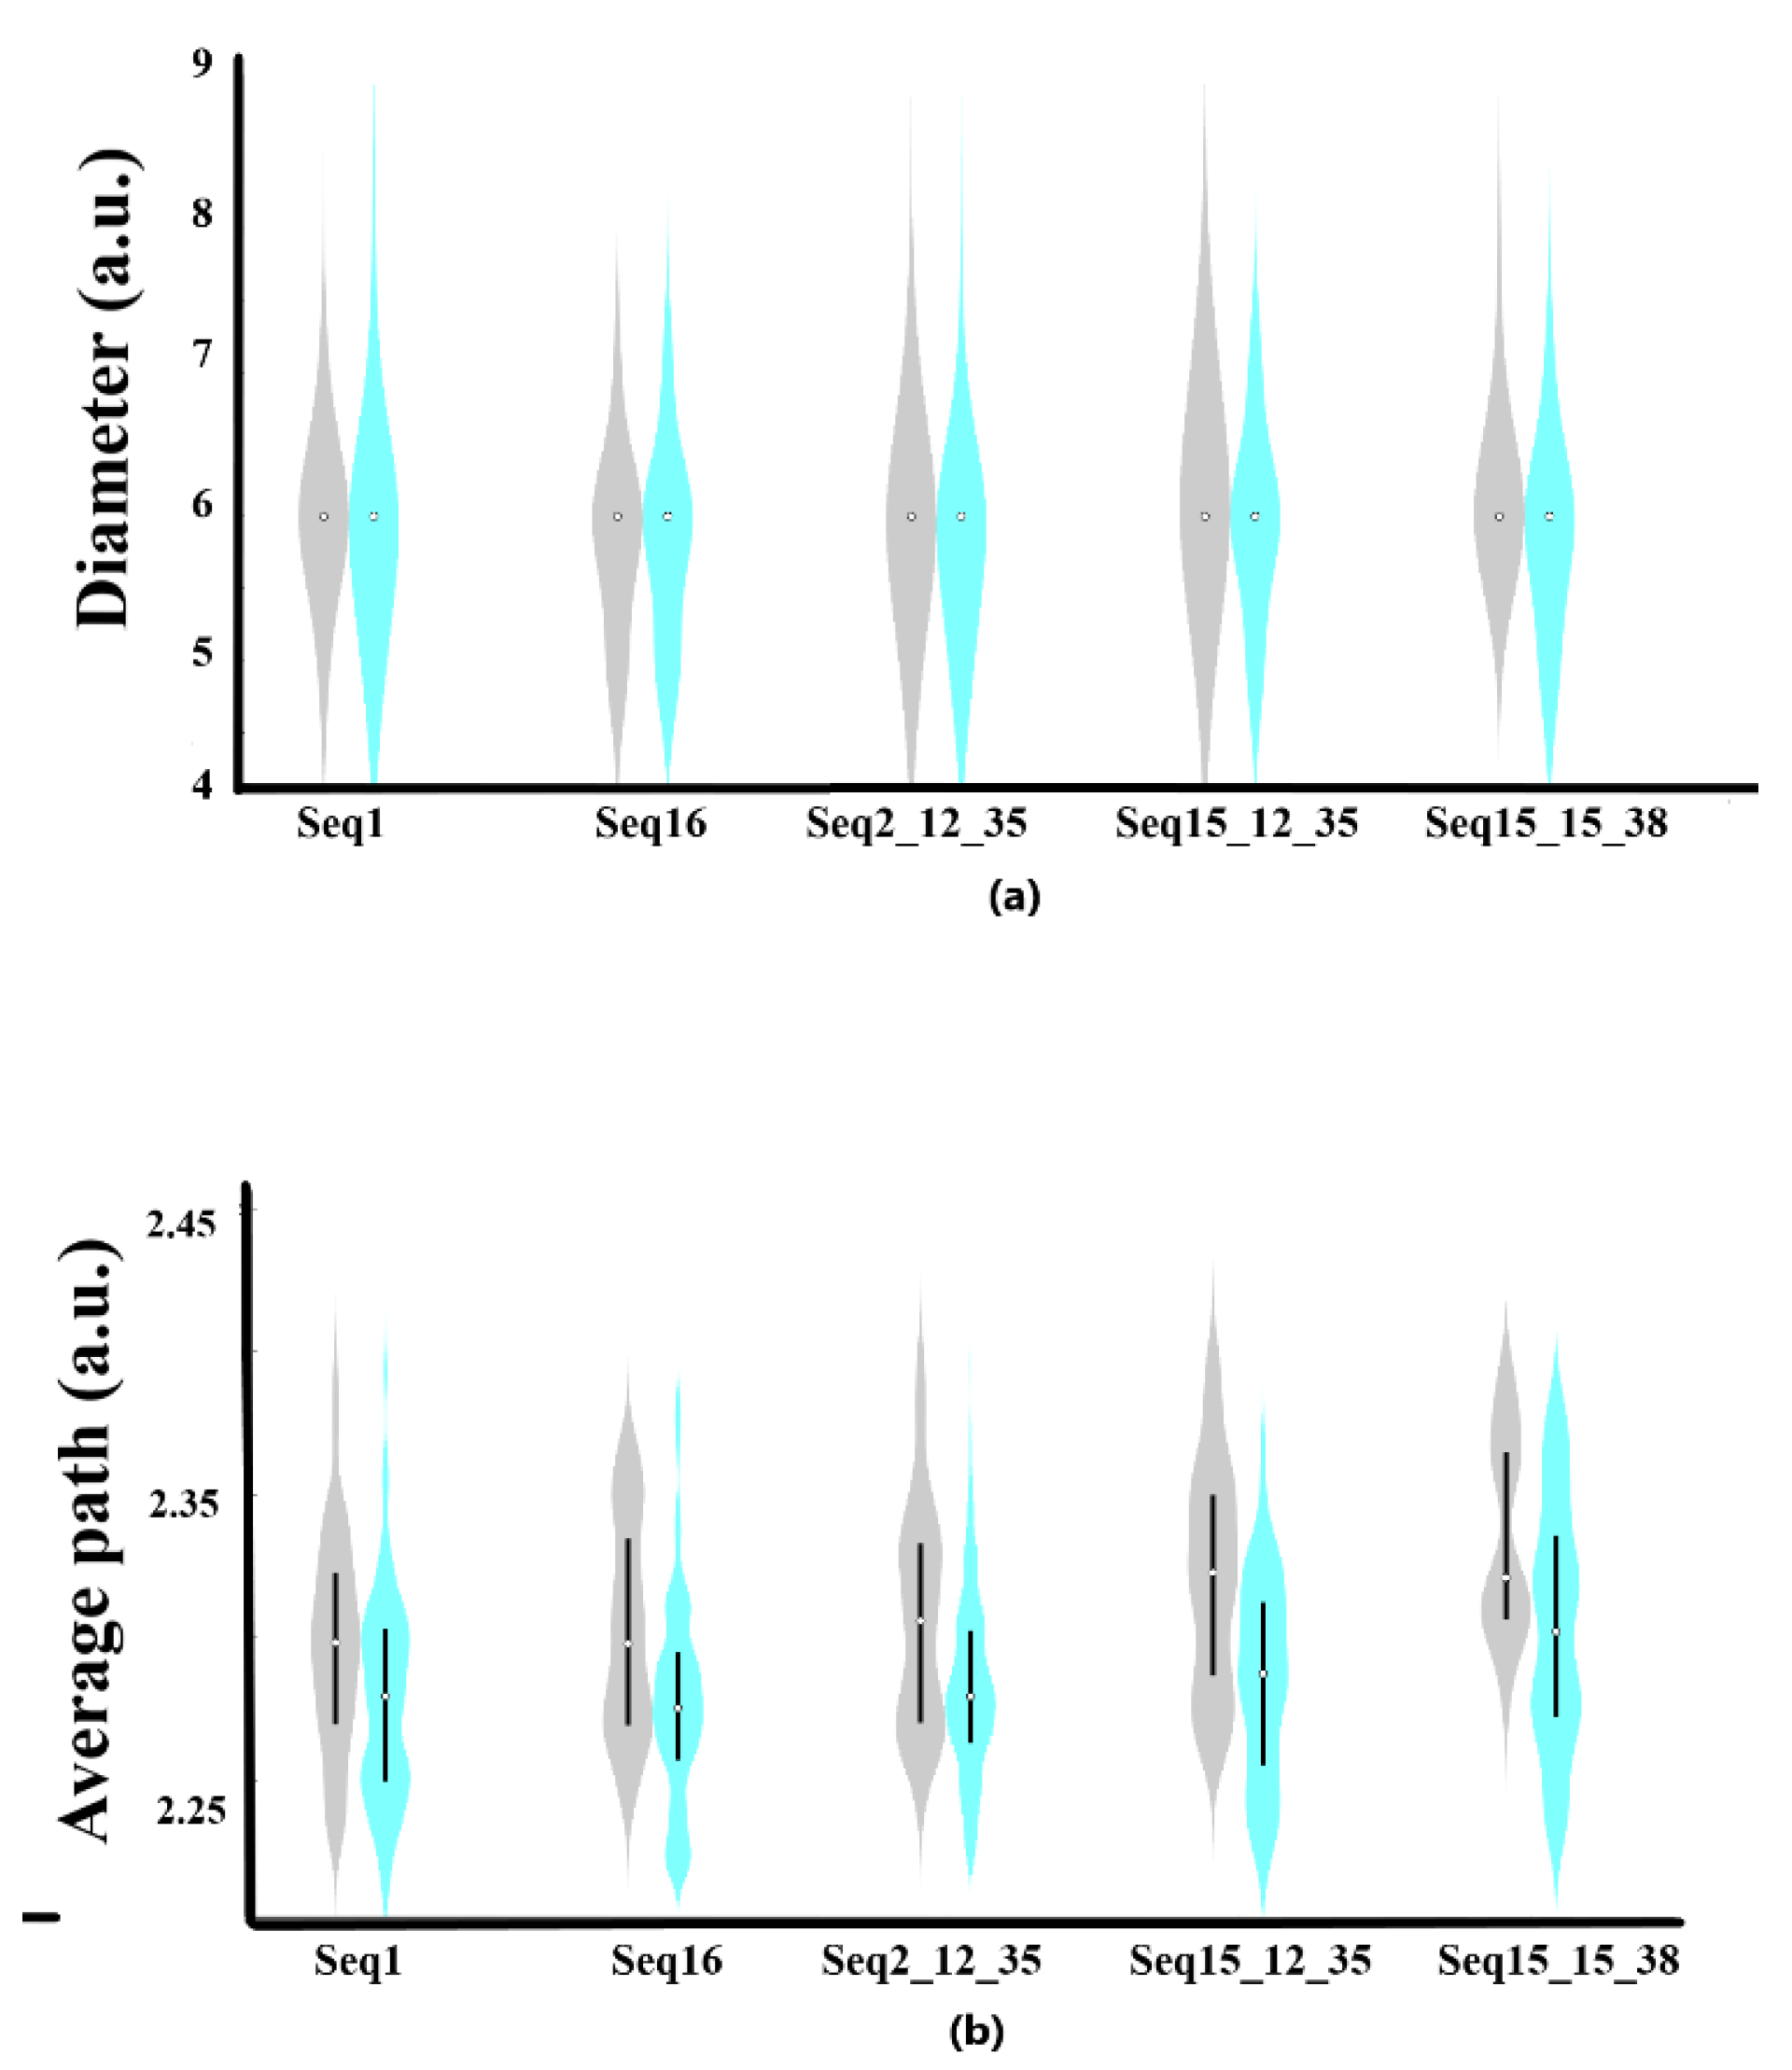
Diameter and Shortest path length and average path length: the diameter
D of a network is the maximal distance between any pair of its nodes. The distance L
ij between two nodes
i and
j is defined as the number of links along the shortest path connecting them. Then, the average path length L of the network is defined as the distance between two nodes, averaged over all pairs of nodes. L determines the effective size of a network, i.e. the typical separation of pairs of nodes (
Wang, 2002).
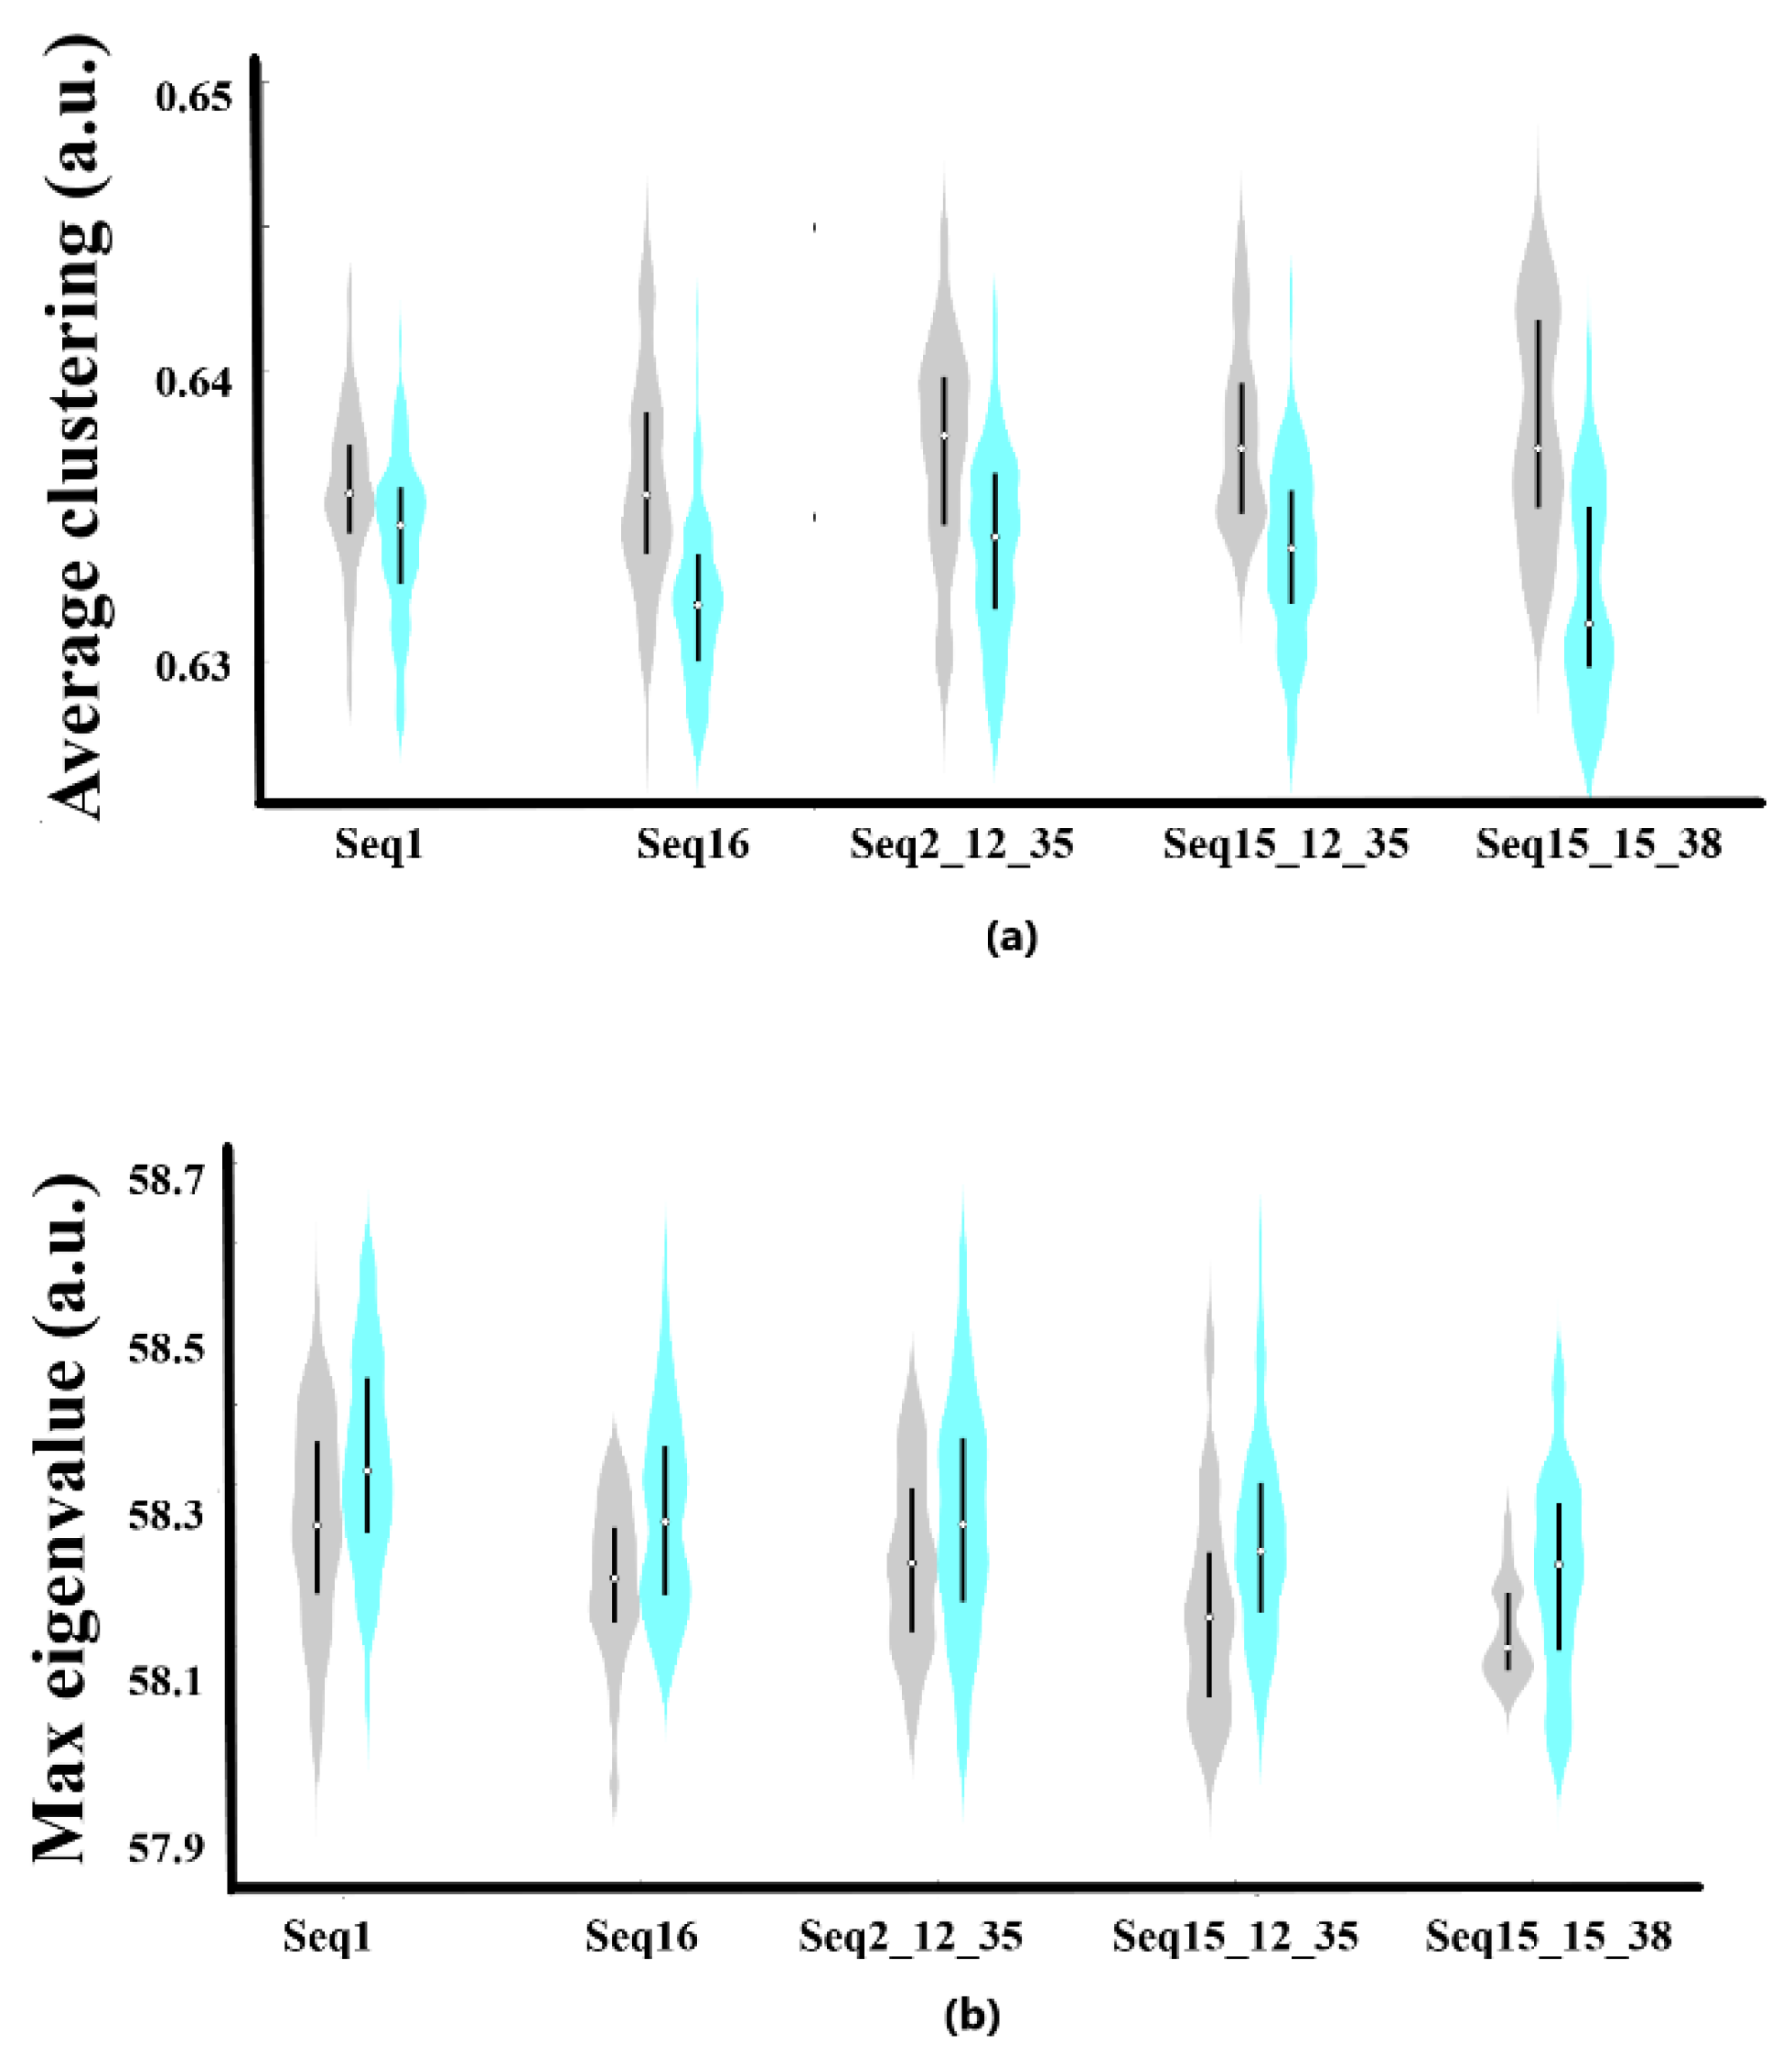
Clustering coefficient: clustering coefficient
C can be defined as the average fraction of pairs of neighbors of a node, which are also neighbors of each other. Suppose that a node
i in the network has
ki links, which connect it to
ki other nodes. These nodes are the neighbors of node
i. Clearly, at most
ki(ki −1)
/2 links can exist between them, and this occurs when every neighbour of node
i is connected to every other neighbour of node
i. The clustering coefficient
Ci of node
i is defined as the ratio between the number
Ei of links that actually exist between these
ki nodes and the total number
ki(ki−1)
/2, namely
The clustering coefficient
C of the whole network is the average of
Ci over all
i (
Wang, 2002).
Largest eigenvalue (lev) depends on the highest degree in the graph. For any
k regular graph
G (a graph with
k degree on all the vertices), the eigenvalue with the largest absolute value is
k. Generally,
lev increases if the graph contains vertices of high degree, and decreases gradually from the graph with highest degree 6 to the one with highest degree 2 (
Vishveshwara, 2002).
Conclusions
Graph theory has been extensively applied in several fields of research, but applications to aptamer-protein complexes are still pioneering. The reasons reside in the fact that few structures are experimentally resolved, the results obtained by the application of the theory cannot be compared with a general, well-established model.
In (
Cataldo et al., 2019) it has been observed that in silico aptamer-Angiopoietin complexes were arranged in two main conformers: Hair and Belt. Here, we study the same structures by using the concepts of graph theory with the aim to assess if the interpretation of networks could anticipate some characteristics, typical of those configurations.
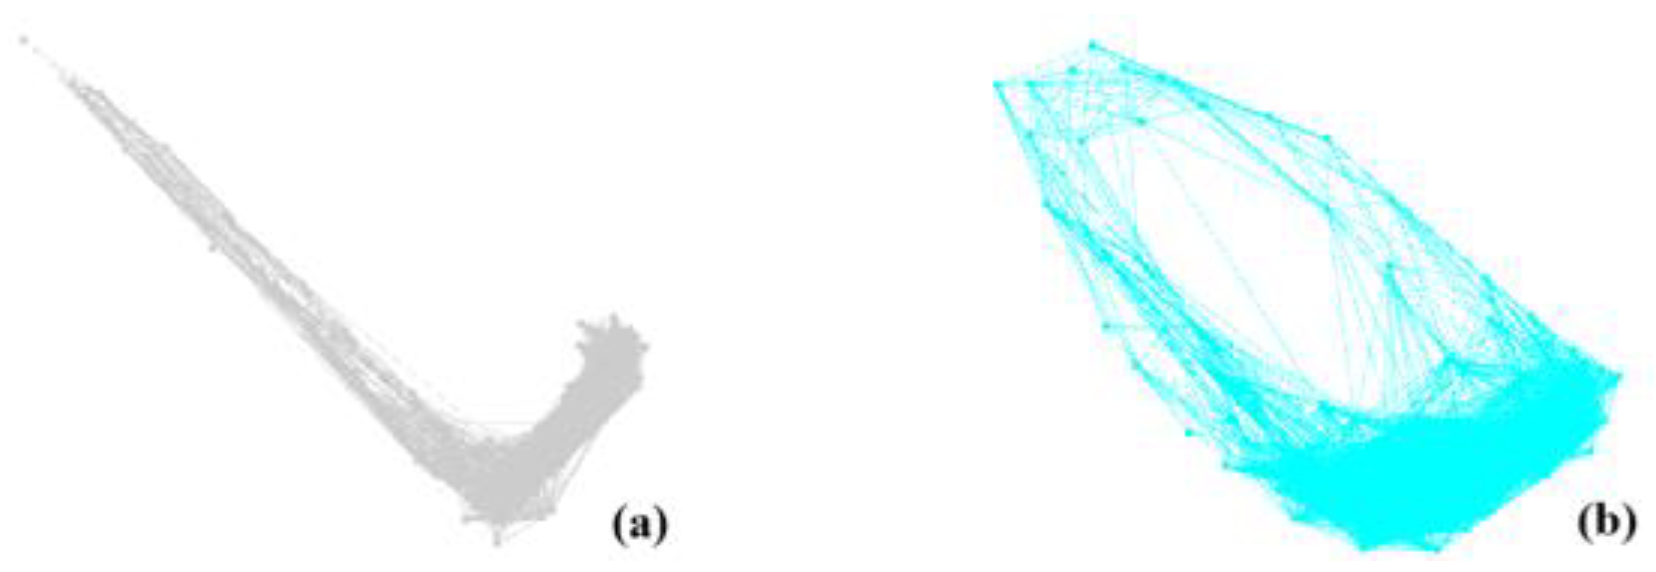
From the graphs, differences between the two types of conformers are very clearly deduced, starting from the visual representations.
As for other topological parameters, the assortativity and hierarchy coefficients did not highlight a clear difference, but the shape of the distribution clearly reflects two different behaviours, able in appreciably discriminating the conformations. Discrimination becomes more evident in the average length of the path, the clustering coefficient and the maximum value of the eigenvalues of the adjacency matrix. In general, consistent differences are highlighted in the shape of the distribution for all the parameters, this is particularly true in the aptamer-Angiopoietin complexes derived from natural sequences (Seq1 and Seq16), compared to the mutated ones.
For the sake of completeness, another type of conformer (
Figure 6) has been noted during the analysis of the networks. It is different from Hair or Belt and further investigations are needed in this regard.
The achievement of these results can be considered a merit of the application of graph theory and, conversely, a precise indication of the fact that other efforts are required to perfect molecular simulation software, so that a description as close as possible to the real structure of the complexes can be reached.
We consider the proposed procedure effective in the screening process of the outcomes of different computational software, thus, it can be applied as a useful tool for increasing chances of success in designing high-specificity biosensors.