


Abstract
Early-life stress (ELS) is associated with persistent oxytocinergic alterations, yet peripheral oxytocin (OT) changes in ELS-exposed adults remain inconsistent. To our knowledge, this translational systematic review and meta-analysis is the first to jointly synthesize human and rodent evidence on adult basal peripheral OT following ELS, with sex and biofluid type as moderators. A systematic search identified 12 human articles (k = 14; n = 1176) and four rodent articles (k = 6; n = 123). Random-effects meta-analyses revealed negative trends across humans (COR −0.18, 95% CI [−0.36, 0.02]; p = 0.0732) and rodents (SMD −0.53, 95% CI [−1.24, 0.18]; p = 0.1409), with a notable directional consistency across species. Biofluid type was the strongest moderator in human ELS–OT associations (χ24 = 19.18, p = 0.0007), with effects varying between sexes. Plasma was the only subgroup with a significant negative association (COR −0.28, 95% CI [−0.51, −0.03]) and a homogeneous signal in male cohorts (COR −0.34, 95% CI [−0.46, −0.21]; I2 = 0%). In rodents, sex was the significant moderator (χ22 = 13.17, p = 0.0014). GRADE certainty was very low across outcomes, reflecting the nascent state of this literature and the need for further research exploring sex differences and plasma-based quantification, among others.
Keywords:
early-life stress; oxytocin; stress; sex differences; peripheral oxytocin; plasma; humans; mice; rats; rodents 1. Introduction
Adverse childhood experiences, including abuse, neglect, and disrupted caregiving during sensitive developmental periods, constitute early-life stress (ELS) [1]. ELS is associated with long-term disruptions in the stress response and brain structure and is a well-established risk factor for depression, anxiety disorders, and post-traumatic stress disorder in adulthood [1,2,3,4].
Oxytocin (OT) is a hypothalamic neuropeptide with established roles in social behavior, stress regulation, and HPA axis modulation [5]. Central OT attenuates HPA axis reactivity, contributing to stress buffering and emotional regulation [6] and is measurable peripherally across multiple biofluid compartments [7]. Studies on human populations have reported lower peripheral OT in adults with childhood maltreatment histories [8,9,10,11], though findings are not uniform. Competing hypotheses have been proposed to explain this pattern, including sustained oxytocinergic downregulation and compensatory upregulation as an adaptive stress response [12,13]. This inconsistency may further reflect heterogeneity driven by sex, biofluid type, and ELS severity, yet no prior meta-analysis has formally evaluated these moderators within the ELS–OT literature. Parallel evidence from studies on rodents [14,15,16,17] similarly reported inconsistent outcomes across ELS paradigms, with cross-species comparisons constrained by variability in paradigm, species, and sampling methodology.
Sex remains an understudied source of heterogeneity in ELS–OT research. Although sex as a biological variable has been increasingly recognized in stress research [18,19,20], most ELS–OT studies have used single-sex designs, preventing direct within-study moderation testing.
This translational systematic review and meta-analysis had the following aims: (1) to quantify the pooled association between ELS and basal peripheral OT in adult humans and rodents; (2) to evaluate moderators of this association (e.g., sex and biofluid type); and (3) to provide a cross-species synthesis to inform the translational relevance of peripheral OT as a candidate ELS biomarker.
2. Materials and Methods
2.1. Literature Search and Study Selection
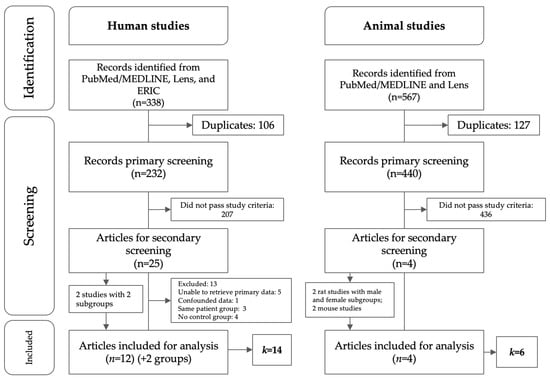
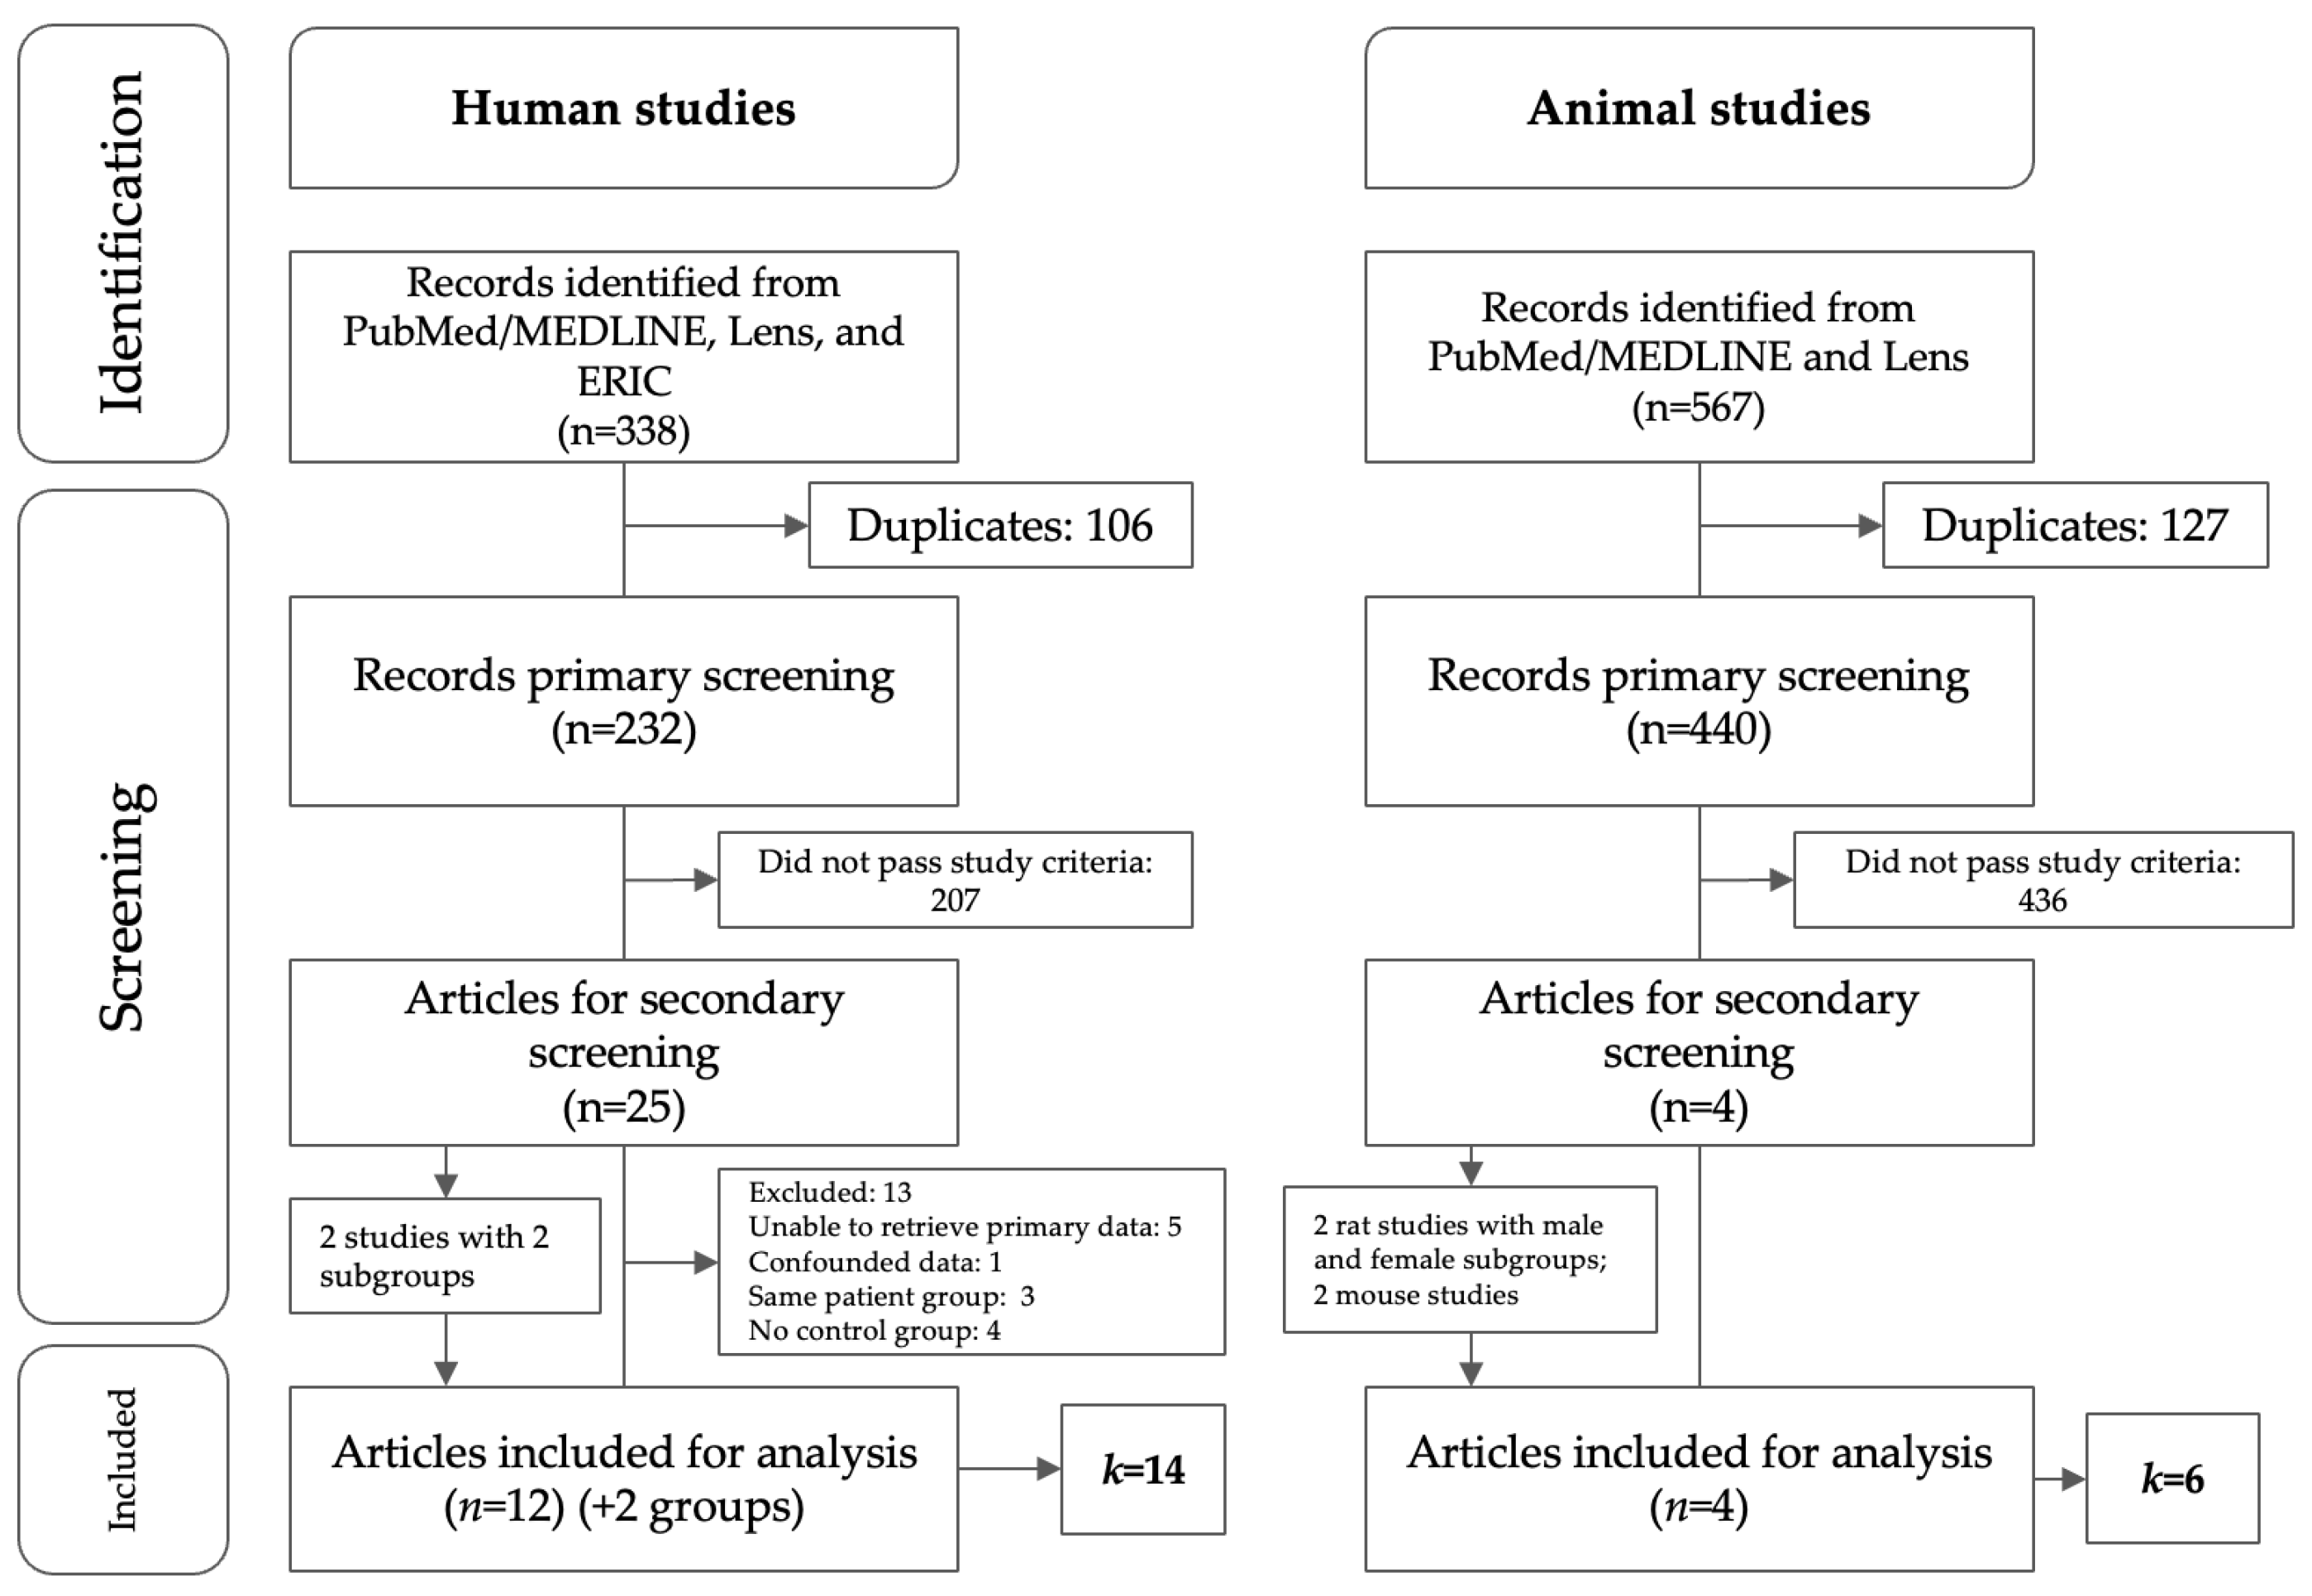
A comprehensive systematic search of published literature using PubMed/MEDLINE, Lens.org, and ERIC was done. The search strategy utilized a combination of keywords related to “early life stress”, “early life adversity”, “oxytocin”, and “sex differences”. No restrictions on publication date or language were applied. This systematic review and meta-analysis protocol was registered in PROSPERO on 29 January 2026: CRD420261296129 (human studies) and CRD420261296379 (rodent studies). Full search strategies are available in the PROSPERO registry. Title, abstract, and full-text screening were carried out independently by two reviewers and verified by a third. Discrepancies were resolved by consensus. The study selection is summarized in the Preferred Reporting Items for Systematic Reviews and Meta-Analyses (PRISMA) flow diagram (Figure 1).
Figure 1.
PRISMA flow diagram for study selection in the systematic review/meta-analysis of peripheral oxytocin following ELS exposure in humans and rodents. Initial database searches identified 338 human studies and 567 animal studies. Following a two-stage screening process, 12 human studies and four animal studies met the inclusion criteria and were ultimately included in the analysis. n, number of articles; k, number of groups for analysis.
2.2. Eligibility Criteria
Studies were eligible for inclusion if they met the following criteria: (1) enrolled adult participants (≥18 years) with a history of adverse childhood experiences (e.g., physical, or emotional abuse; neglect) occurring before the age of 18, verified via validated self-report questionnaires or official records; (2) compared this population to adult controls with no or low history of childhood maltreatment; and (3) featured an observational or correlational study design reporting associations between adversity scores and peripheral OT levels. Eligible research settings included community, university, or outpatient clinical environments. Exclusion criteria included experience of acute adult-onset trauma, congenital neuroendocrine disorders, current pregnancy, or lactation. Additionally, studies conducted in acute emergency settings, inpatient units, or during active intervention trials were excluded to prevent confounding by acute state-anxiety or medication effects, unless baseline pre-treatment data were reported. Rodent studies were screened and included if the following criteria were met: (1) experimental studies comparing adult mice (Mus musculus) or rats (Rattus norvegicus); (2) exposed to validated ELS models; and (3) are compared to non-stressed controls. Exclusion criteria for rodent studies included qualitative studies, interventional studies without baseline data, use of genetic knockout models, pharmacologically induced models not related to environmental stress, or models with congenital or induced confounding neuroendocrine or metabolic comorbidities.
2.3. Data Extraction
Data extraction was done independently by two reviewers and verified by a third senior reviewer. Discrepancies were resolved through consensus or consultation with the senior reviewer. Authors were contacted for clarifications and missing or unreported data. Study-level demographics and basal peripheral OT concentrations were extracted. Peripheral OT data were extracted from graphs using WebPlotDigitizer v5 (https://automeris.io, accessed on 15 February 2026) whenever necessary and verified for accuracy by a second reviewer. Acceptable biofluid matrices were plasma, serum, saliva, urine, and cerebrospinal fluid (CSF), with measurements standardized to pg/mL using standard conversion factors. Acceptable quantification methods were radioimmunoassay (RIA), enzyme-linked immunosorbent assay (ELISA), and mass spectrometry. Standardized mean differences or correlation coefficients were extracted or calculated for outcomes.
2.4. Methodological Quality Assessment of Included Studies
To assess the risk of bias in the selected studies, we used SYstematic Review Center for Laboratory animal Experimentation (SYRCLE) and Newcastle–Ottawa Scale Assessment (NOS) tools. SYRCLE was used to assess risk of bias in the four rodent studies while NOS was applied to the twelve human studies, separately for case-control and cross-sectional designs, with quality rated as good (≥7 stars), fair (5–6 stars), or poor (≤4 stars) following the Agency for Healthcare Research and Quality (AHRQ)-adapted thresholds. These assessments were performed by two reviewers and confirmed by a third independent reviewer. Where necessary, additional information was sought directly from study authors to clarify specific methodological protocols or to address missing information critical to the quality assessment.
2.5. Certainty of Evidence Assessment
The certainty of evidence for the outcomes was assessed separately for rodent and human evidence using the Grading of Recommendations, Assessment, Development, and Evaluation (GRADE) framework. For human studies, risk of bias downgrading was applied only when the majority of studies within a subgroup had average NOS scores below 5 or failed to adjust for primary confounders. Inconsistency was flagged when I2 exceeded 50% and was unexplained by subgroup analysis. Imprecision was evaluated against the optimal information size (OIS): N = 128 for human studies (d = 0.5, 80% power) and N = 52 for rodent studies (d = 0.8, 80% power, 1:1 allocation). Subgroups below OIS or with a single study were downgraded one or two levels based on sample limitation severity and confidence interval width. Certainty of evidence is dependent on the mentioned domains, with a starting total of four points which may be downgraded or upgraded; the net score is bound to a ceiling of four points (●●●●, high certainty) and a floor threshold of one point (●---, very low certainty).
2.6. Statistical Analyses
Meta-analyses were performed using the meta package (v8.2-1) in R (v4.5.0) within RStudio (v2025.05.1). Two effect size metrics were used given the translational design: for human studies, the correlation coefficient (r) was used and transformed to Fisher’s z (ZCOR) for variance stabilization, while for rodent studies, Hedges’ g was calculated for basal OT comparisons between ELS-exposed and control groups, with small-sample bias correction applied. Pooled estimates were calculated using DerSimonian and Laird random-effects models. Between-study heterogeneity was quantified using I2 (<25% low, 25–50% moderate, 50–75% substantial, >75% high) and Cochran’s Q (p < 0.10). Human data were stratified by biological sex and biofluid type, and rodent data by sex, biofluid type, and ELS model. Subgroup analyses were then done for the mentioned stratifications. Where quantitative subgroup analysis was not feasible, we provided a narrative description of the findings instead. Meta-regression was conducted for mean participant age as a continuous moderator in human studies. We then carried out a leave-one-out sensitivity analysis to identify influential studies and assess the impact on pooled estimates. Publication bias was assessed via funnel plot asymmetry and Egger’s test for analyses with at least 10 studies. All tests were two-tailed with significance set at p < 0.05.
3. Results
3.1. Study Selection and Characteristics
3.1.1. Literature Search Results
The systematic search yielded 338 human study records from PubMed/MEDLINE, Lens, and ERIC, and 567 animal study records from PubMed/MEDLINE and Lens. After duplicate removal (human: n = 106; animal: n = 127), 232 and 440 records underwent primary screening, respectively. The records that did not meet the study criteria were excluded (human: n = 207. animal: n = 436), leaving 25 human and four animal articles for secondary screening. Of the 25 human articles, 13 were subsequently excluded: five due to inability to retrieve primary data, four due to absence of a control group, three due to use of the same patient group, and one due to confounding substance use disorder in the patient group. The remaining 12 articles were included for analysis. Two of these studies reported data from two subgroups each, contributing two additional effect sizes, for a total of k = 14 effect sizes in the human meta-analysis.
All four animal articles that proceeded to secondary screening were included for analysis. Two rat studies reported male and female subgroups separately, and two were mouse studies, yielding k = 6 effect sizes for the rodent meta-analysis. The full study selection process is illustrated in Figure 1.
3.1.2. Human Cohort Profile
Characteristics of the 14 included human studies are summarized in Table 1. Studies were published between 2009 and 2024, with adult samples (mean age range: 19.9 to 42.4 years) and a combined enrollment of 1176 participants across 14 independent datasets from 12 unique publications; two publications each contributed two independent cohorts [21,22]. Study designs comprised case-control (CC; n = 7) and cross-sectional (XS; n = 7) designs, with sample sizes ranging from 22 to 325. Samples were drawn from Central and Western European, American, East Asian, Southern European, and Turkish populations. Meanwhile, studies from the United States and United Kingdom enrolled multiethnic samples including White/Caucasian, African American, Asian, and other minority participants [8,23,24,25]. An exploratory nationality/race subgroup analysis (Figure S1) indicated that East Asian cohorts showed the most consistent negative ELS–OT association (COR −0.53, 95% CI [−0.75, −0.20]), with significant subgroup differences overall (χ26 = 15.45, p = 0.0170). However, the findings should be interpreted with caution given unequal study numbers across subgroups and inconsistent ethnicity reporting. ELS was operationalized using retrospective self-report instruments across all studies, most commonly the Childhood Trauma Questionnaire (CTQ) or Childhood Trauma Questionnaire-Short Form (CTQ-SF). Peripheral OT was quantified across four biofluid compartments: plasma, serum, saliva, urine, and CSF, with ELISA as the predominant testing method.
Table 1.
Characteristics of included human studies.
3.1.3. Rodent Model Profile
The characteristics of the four included rodent studies are summarized in Table 2. Studies were published between 2016 and 2025, contributing six independent datasets from four unique publications; two publications each contributed two independent cohorts stratified by sex [14,16]. A total of 123 animals were included across datasets, with sample sizes ranging from 13 to 40 per cohort. Species comprised Sprague–Dawley rats [14], Wistar rats [16], and C57BL/6J mice [15,17] with postnatal day (PND) ranging from 1–77. Three distinct ELS paradigms were represented: social isolation rearing (SIR; PND 21–77), repeated cross-fostering (RCF; PND 1–4), and maternal separation (MS; PND 2–21 and PND 6–16). Peripheral OT was quantified from plasma (k = 4) and serum (k = 2), with ELISA used across all studies. Sex composition was predominantly female or male within individual cohorts, with one dataset stating sex as unreported [17]. Subgroup meta-analyses were conducted where feasible across four moderators: species, sex, ELS paradigm, and biofluid type.
Table 2.
Characteristics of the included rodent studies.
3.2. Quality Assessment and Certainty of Evidence
3.2.1. Risk of Bias in Human Studies
The risk of bias across the 12 included human studies was assessed using the Newcastle–Ottawa Scale (NOS) and is summarized in Table 3. Among the five case-control studies, three were rated good [9,21,27], one fair [22], and one poor [28]. Representativeness of cases (S2) and non-response rate (E8) were the most commonly unmet criteria, with controls selection (S3) and control definition (S4) additionally unmet in the fair- and poor-rated studies. Among the seven cross-sectional studies, five were rated fair [10,11,24,25,26] and two poor [8,23]. Non-respondent characterization (S3) was the most consistently unmet criterion across all seven studies. Representativeness (S1), comparability (C5), and ascertainment of exposure (S4) were additionally unmet in the poor-rated studies.
Table 3.
Newcastle–Ottawa Scale (NOS) Risk of Bias Assessment summary table.
In summary, case-control studies were of predominantly good methodological quality, while cross-sectional studies were predominantly fair to poor, with selection-related criteria as the most common source of limitation across both design types.
3.2.2. Risk of Bias in Rodent Studies
Across the four included rodent studies, risk of bias was assessed using the SYRCLE Risk of Bias tool and is summarized in Table 4. Sequence generation, baseline characteristics, allocation concealment, random housing, random outcome assessment, and blinding of outcome assessors were rated unclear across all four studies. Blinding of caregivers and investigators was rated high risk in all studies, since investigator awareness of ELS condition assignment is inherent to the experimental paradigm. Incomplete outcome data was low risk in three studies [14,16,17] and unclear in one [15]. Selective outcome reporting was low risk in one study [16] and unclear in the rest of the studies while other sources of bias were high risk in one study [14] and low risk in the remaining three.
Table 4.
SYRCLE (SYstematic Review Center for Laboratory animal Experimentation) Risk of Bias Assessment summary table.
Overall, the risk of bias was predominantly moderate [15,16,17], with one study rated moderate-to-high [14].
3.2.3. GRADE Assessment in Human Studies
The certainty of evidence across human study outcomes was assessed using the GRADE framework and is summarized in Table 5. For the primary outcome of peripheral OT following ELS (k = 14, n = 1176), certainty was very low. The pooled correlation was negative but non-significant (COR −0.18, 95% CI [−0.36, 0.02]); evidence was downgraded for serious risk of bias, high inconsistency (I2 = 91.0%), and imprecision. For sex as a moderator (n = 888), certainty was similarly very low. No included study directly compared ELS-associated OT changes between sexes; cross-study patterns showed non-significant negative trends in both females (COR −0.07, 95% CI [−0.27, 0.14]) and males (COR −0.18, 95% CI [−0.51, 0.19]), and evidence was downgraded for very serious indirectness and imprecision. For biofluid type, while all remaining subgroups were rated very low certainty, plasma was the only subgroup to achieve low certainty (k = 8, n = 835), supported by a significant negative pooled correlation (COR −0.28, 95% CI [−0.51, −0.03]) and consistent directionality across studies.
Table 5.
GRADE summary of evidence in human studies.
3.2.4. GRADE Assessment in Rodent Studies
For rodent studies, certainty of evidence was assessed using the adapted GRADE framework for preclinical studies (Table 6). All outcomes were rated very low certainty. Peripheral OT trended lower following ELS across the six included datasets (k = 6, n = 123) but did not reach significance (SMD −0.53, 95% CI [−1.24, 0.18]), downgraded for serious risk of bias, very serious inconsistency (I2 = 68.5%), very serious indirectness, and serious imprecision. Cross-study patterns for sex as a moderator (k = 5, n = 91) showed non-significant negative trends in both females (SMD −0.07, 95% CI [−0.66, 0.52]) and males (SMD −0.45, 95% CI [−1.07, 0.17]), with males showing a larger effect. Evidence was downgraded for very serious risk of bias, indirectness, imprecision, and potential publication bias from likely non-reporting of null sex-specific findings. For biofluid type, both plasma (k = 4, n = 85; SMD −0.77, 95% CI [−1.77, 0.24]) and serum (k = 2, n = 38; SMD −0.07, 95% CI [−0.82, 0.68]) yielded non-significant pooled estimates. Both were downgraded for risk of bias, inconsistency, and imprecision, with serum additionally downgraded for very serious imprecision due to small sample size. For species, rats (k = 4, n = 86; SMD −0.30, 95% CI [−0.73, 0.13]) and mice (k = 2, n = 37; SMD −1.07, 95% CI [−3.54, 1.41]) were both rated very low certainty, with mice showing markedly higher heterogeneity (I2 = 90.4% vs. 0%). Lastly, in assessing ELS paradigm as a moderator, SIR (k = 2, n = 48), RCF (k = 1, n = 13), and MS (k = 3, n = 62) were all rated very low certainty. SIR and RCF were downgraded primarily for very serious indirectness and imprecision; MS was additionally downgraded for very serious inconsistency (I2 = 85.6%).
Table 6.
GRADE summary of evidence in rodent studies.
3.3. Systematic Review and Meta-Analysis of Human Peripheral OT in ELS
3.3.1. Primary Pooled Effect of Human Studies
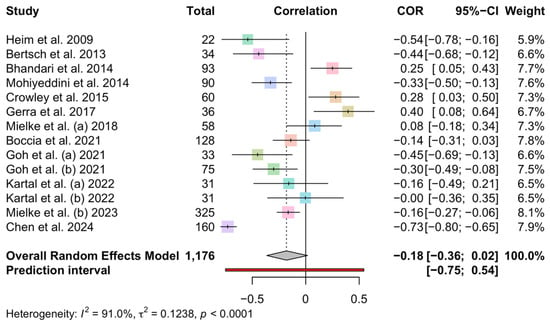
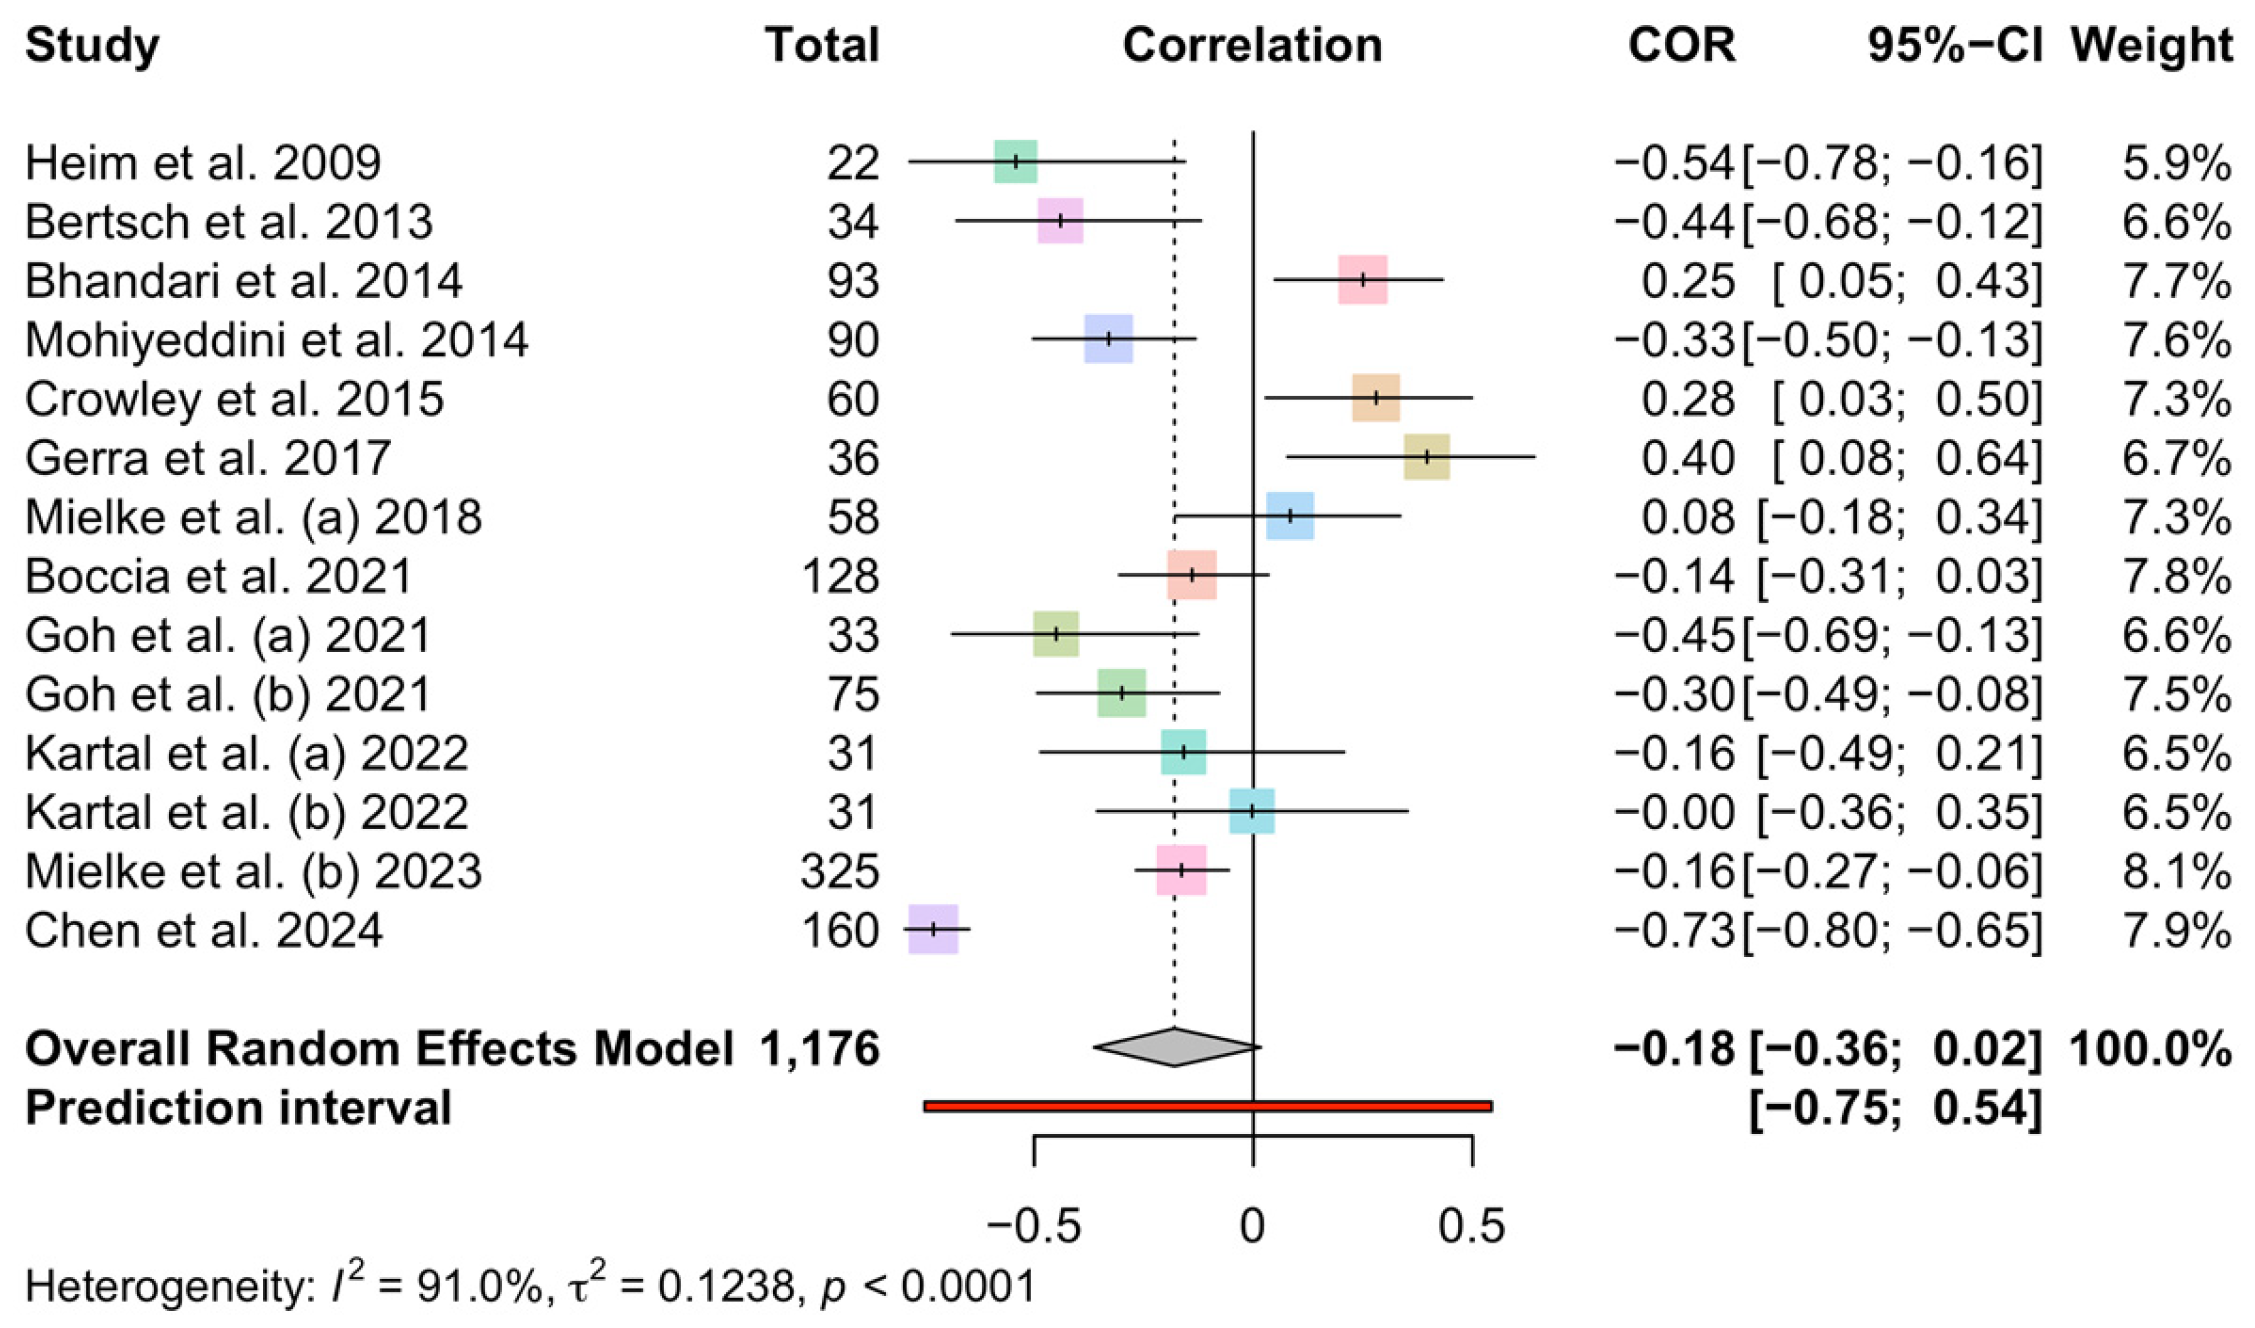
A negative pooled correlation between ELS and peripheral OT was observed across 14 human datasets (k = 14, n = 1176; COR −0.18, 95% CI [−0.36, 0.02], p = 0.0732), approaching but not reaching statistical significance, with high heterogeneity (I2 = 91.0%, τ2 = 0.1238, p < 0.0001) (Figure 2). The 95% prediction interval ranged from −0.75 to 0.54. Of the 14 datasets, nine reported lower peripheral OT in ELS-exposed individuals, four reported higher levels, and one reported a null effect. Meta-regression did not identify mean participant age (19.9 to 42.4 years) as a significant moderator of the ELS–OT association (QM(df = 1) = 1.34, p = 0.247), accounting for only 4.55% of residual heterogeneity (Figure S2).
Figure 2.
Forest plot of the pooled association between ELS and peripheral OT levels in human studies [8,9,10,11,21,22,23,24,25,26,27,28]. A negatively trending pooled correlation was observed between ELS and peripheral OT across 14 human datasets (COR −0.18, 95% CI [−0.36, 0.02], p = 0.0732). Each square represents the correlation coefficient (COR) of an individual study, with size proportional to study weight. Horizontal lines indicate 95% CI. The diamond represents the pooled random effects estimate; the red bar indicates the 95% prediction interval. Heterogeneity: I2 = 91.0%, τ2 = 0.1238, p < 0.0001. COR, correlation coefficient; CI, confidence interval.
3.3.2. Subgroup Analyses of Human Studies
Sex and Human Peripheral OT
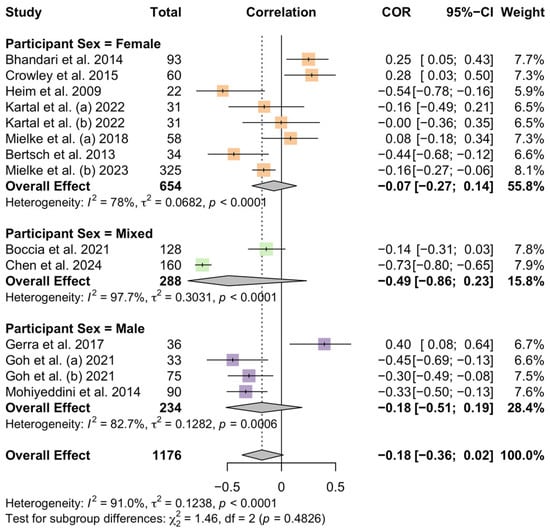
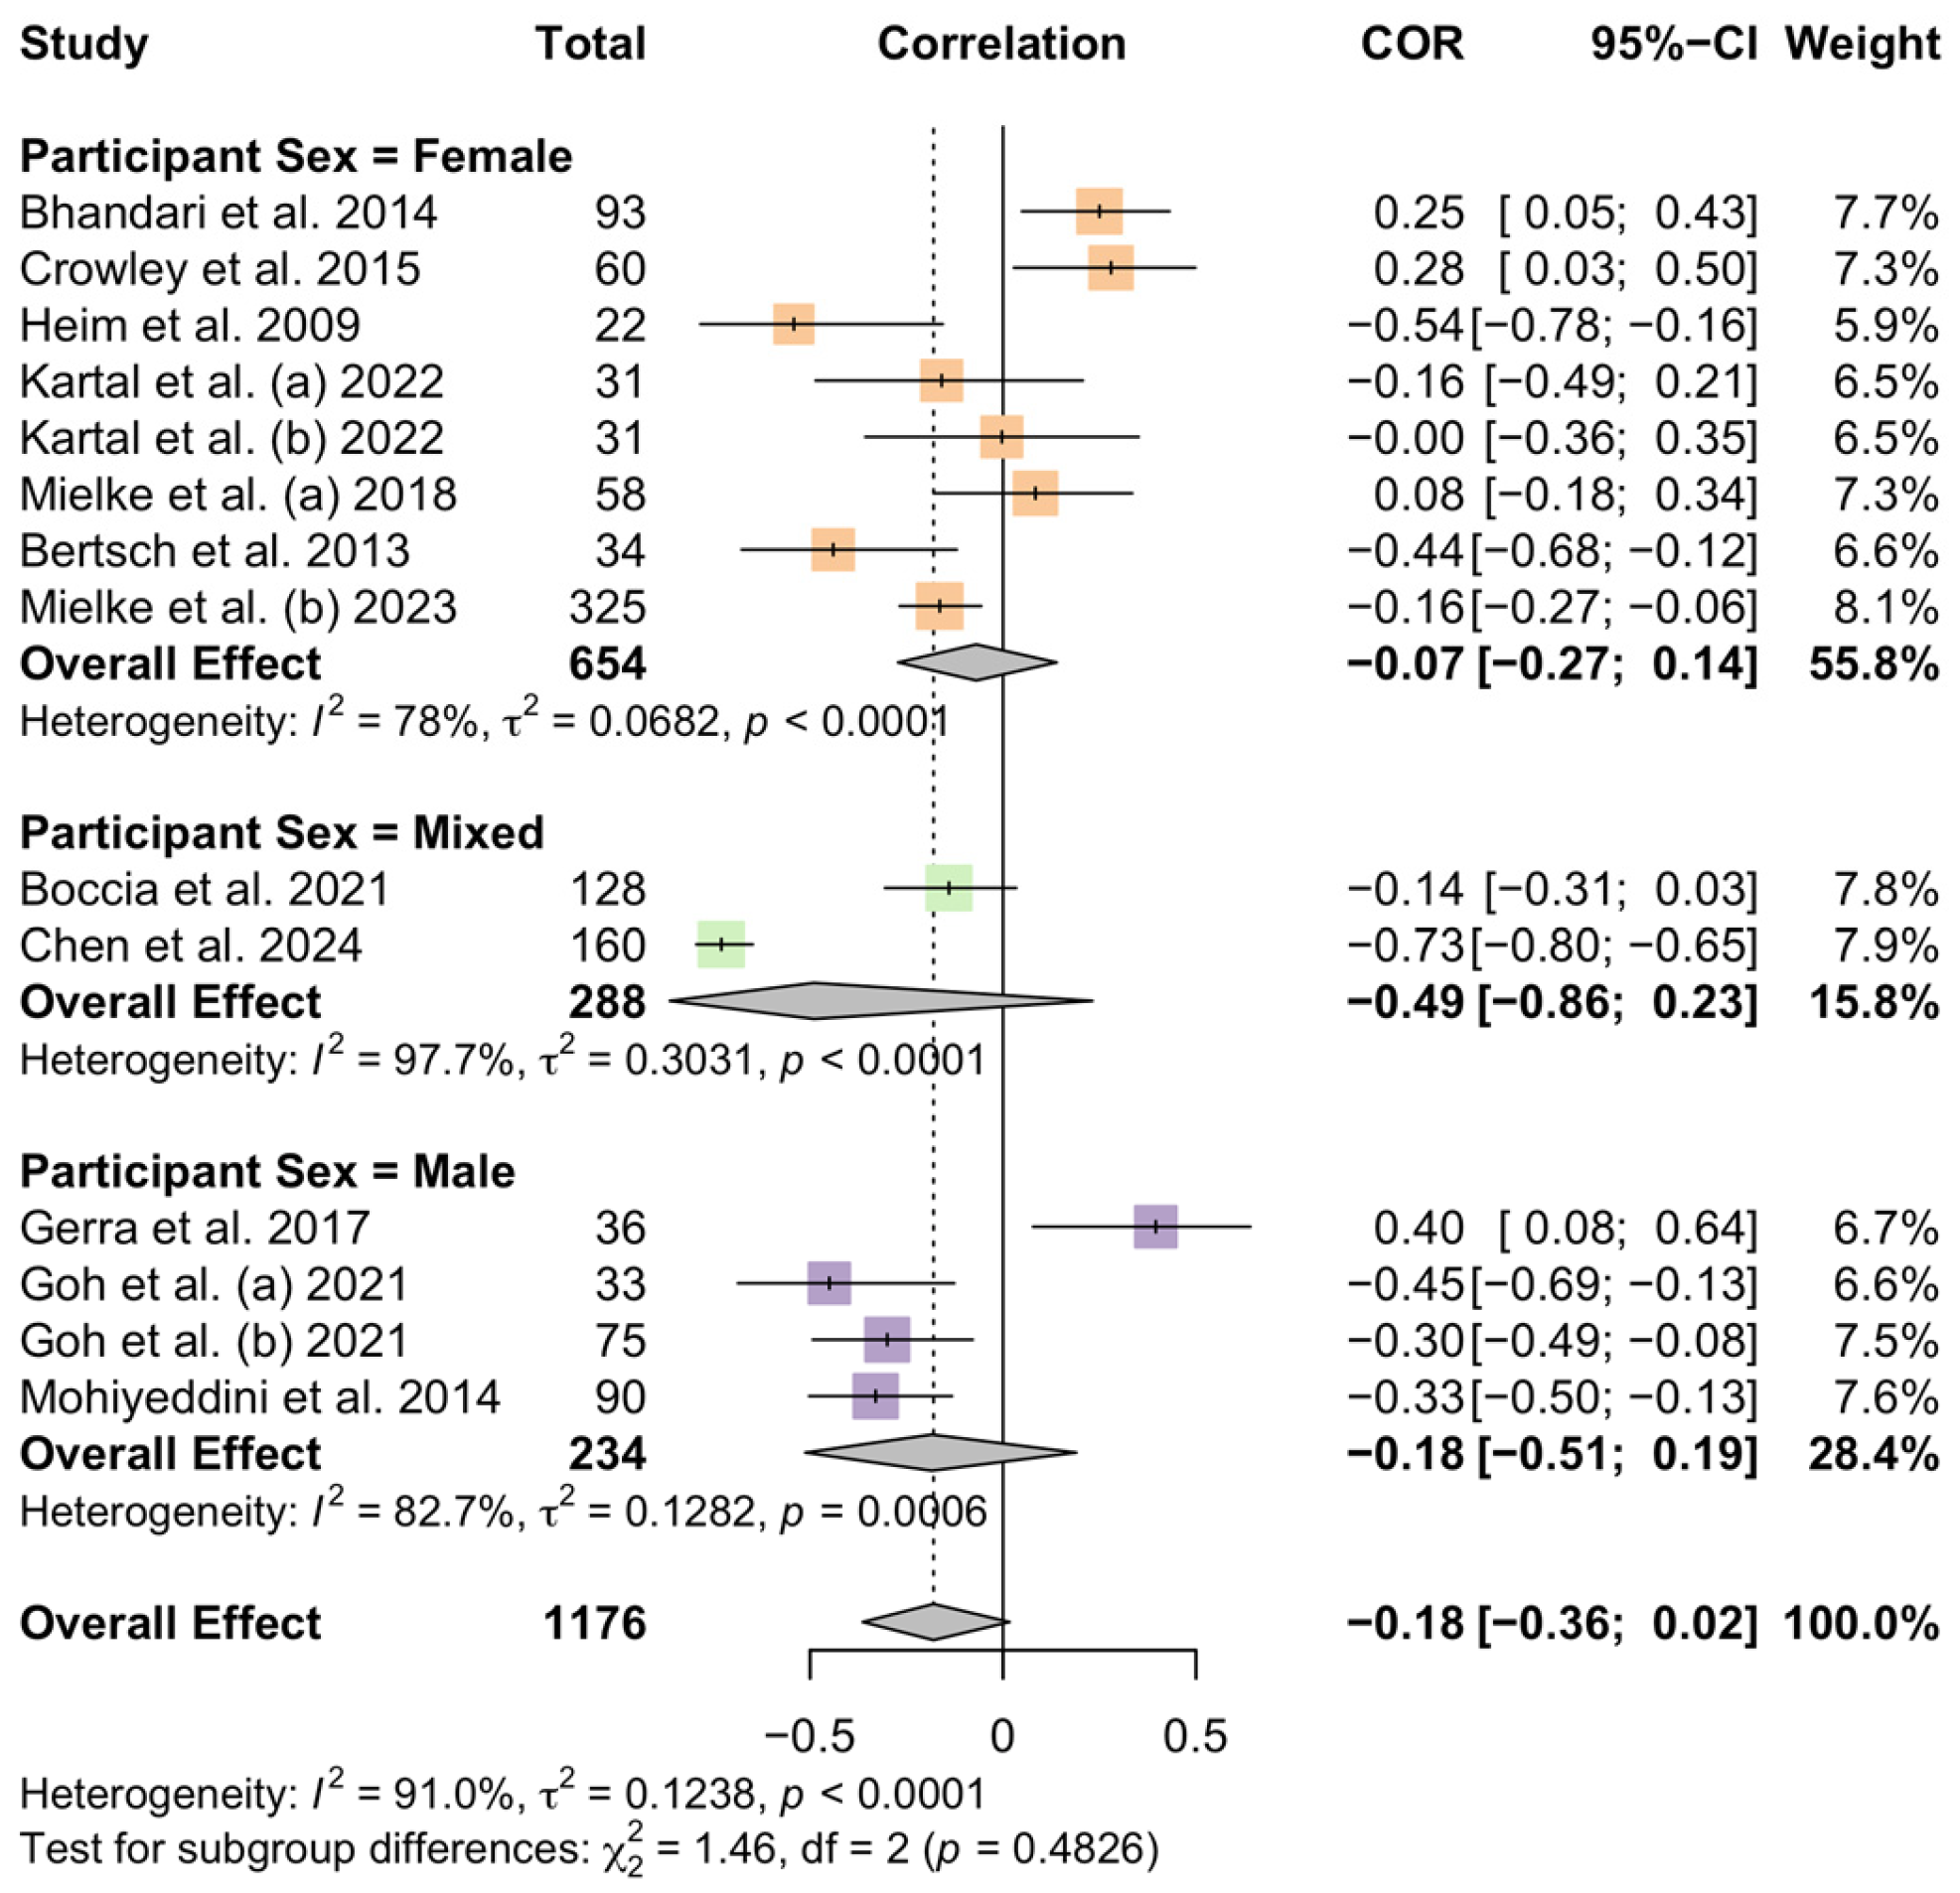
Male studies showed a more consistently negative directional trend (3 of 4 studies), whereas female studies showed greater variability in effect direction (5 of 8 negative). Pooled correlations trended negative across all three sex subgroups: males (k = 4, n = 234; COR −0.18, 95% CI [−0.51, 0.19]), mixed-sex samples (k = 2, n = 288; COR −0.49, 95% CI [−0.86, 0.23]), and females (k = 8, n = 654; COR −0.07, 95% CI [−0.27, 0.14]), though none reached statistical significance (Figure 3). Heterogeneity was high across all three subgroups (females: I2 = 78.0%; males: I2 = 82.7%; mixed: I2 = 97.7%), and subgroup differences were not statistically significant (χ22 = 1.46, p = 0.4826).
Figure 3.
Forest plot of the pooled association between ELS and peripheral oxytocin levels in human studies [8,9,10,11,21,22,23,24,25,26,27,28], stratified by participant sex. A more clustered negative trend was seen in males relative to the female cohort. Each square represents the COR of an individual study, with size proportional to study weight. Horizontal lines indicate 95% CIs. Diamonds represent subgroup and overall pooled random-effects estimates. Subgroup differences were not statistically significant (χ22 = 1.46, p = 0.4826).
Biofluid Type and Human Peripheral OT
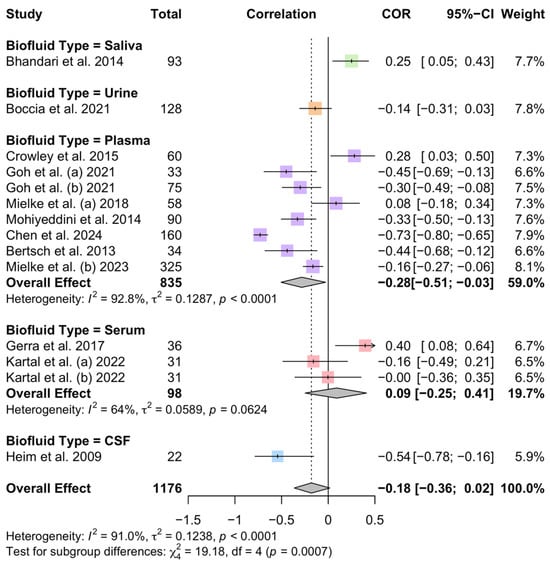
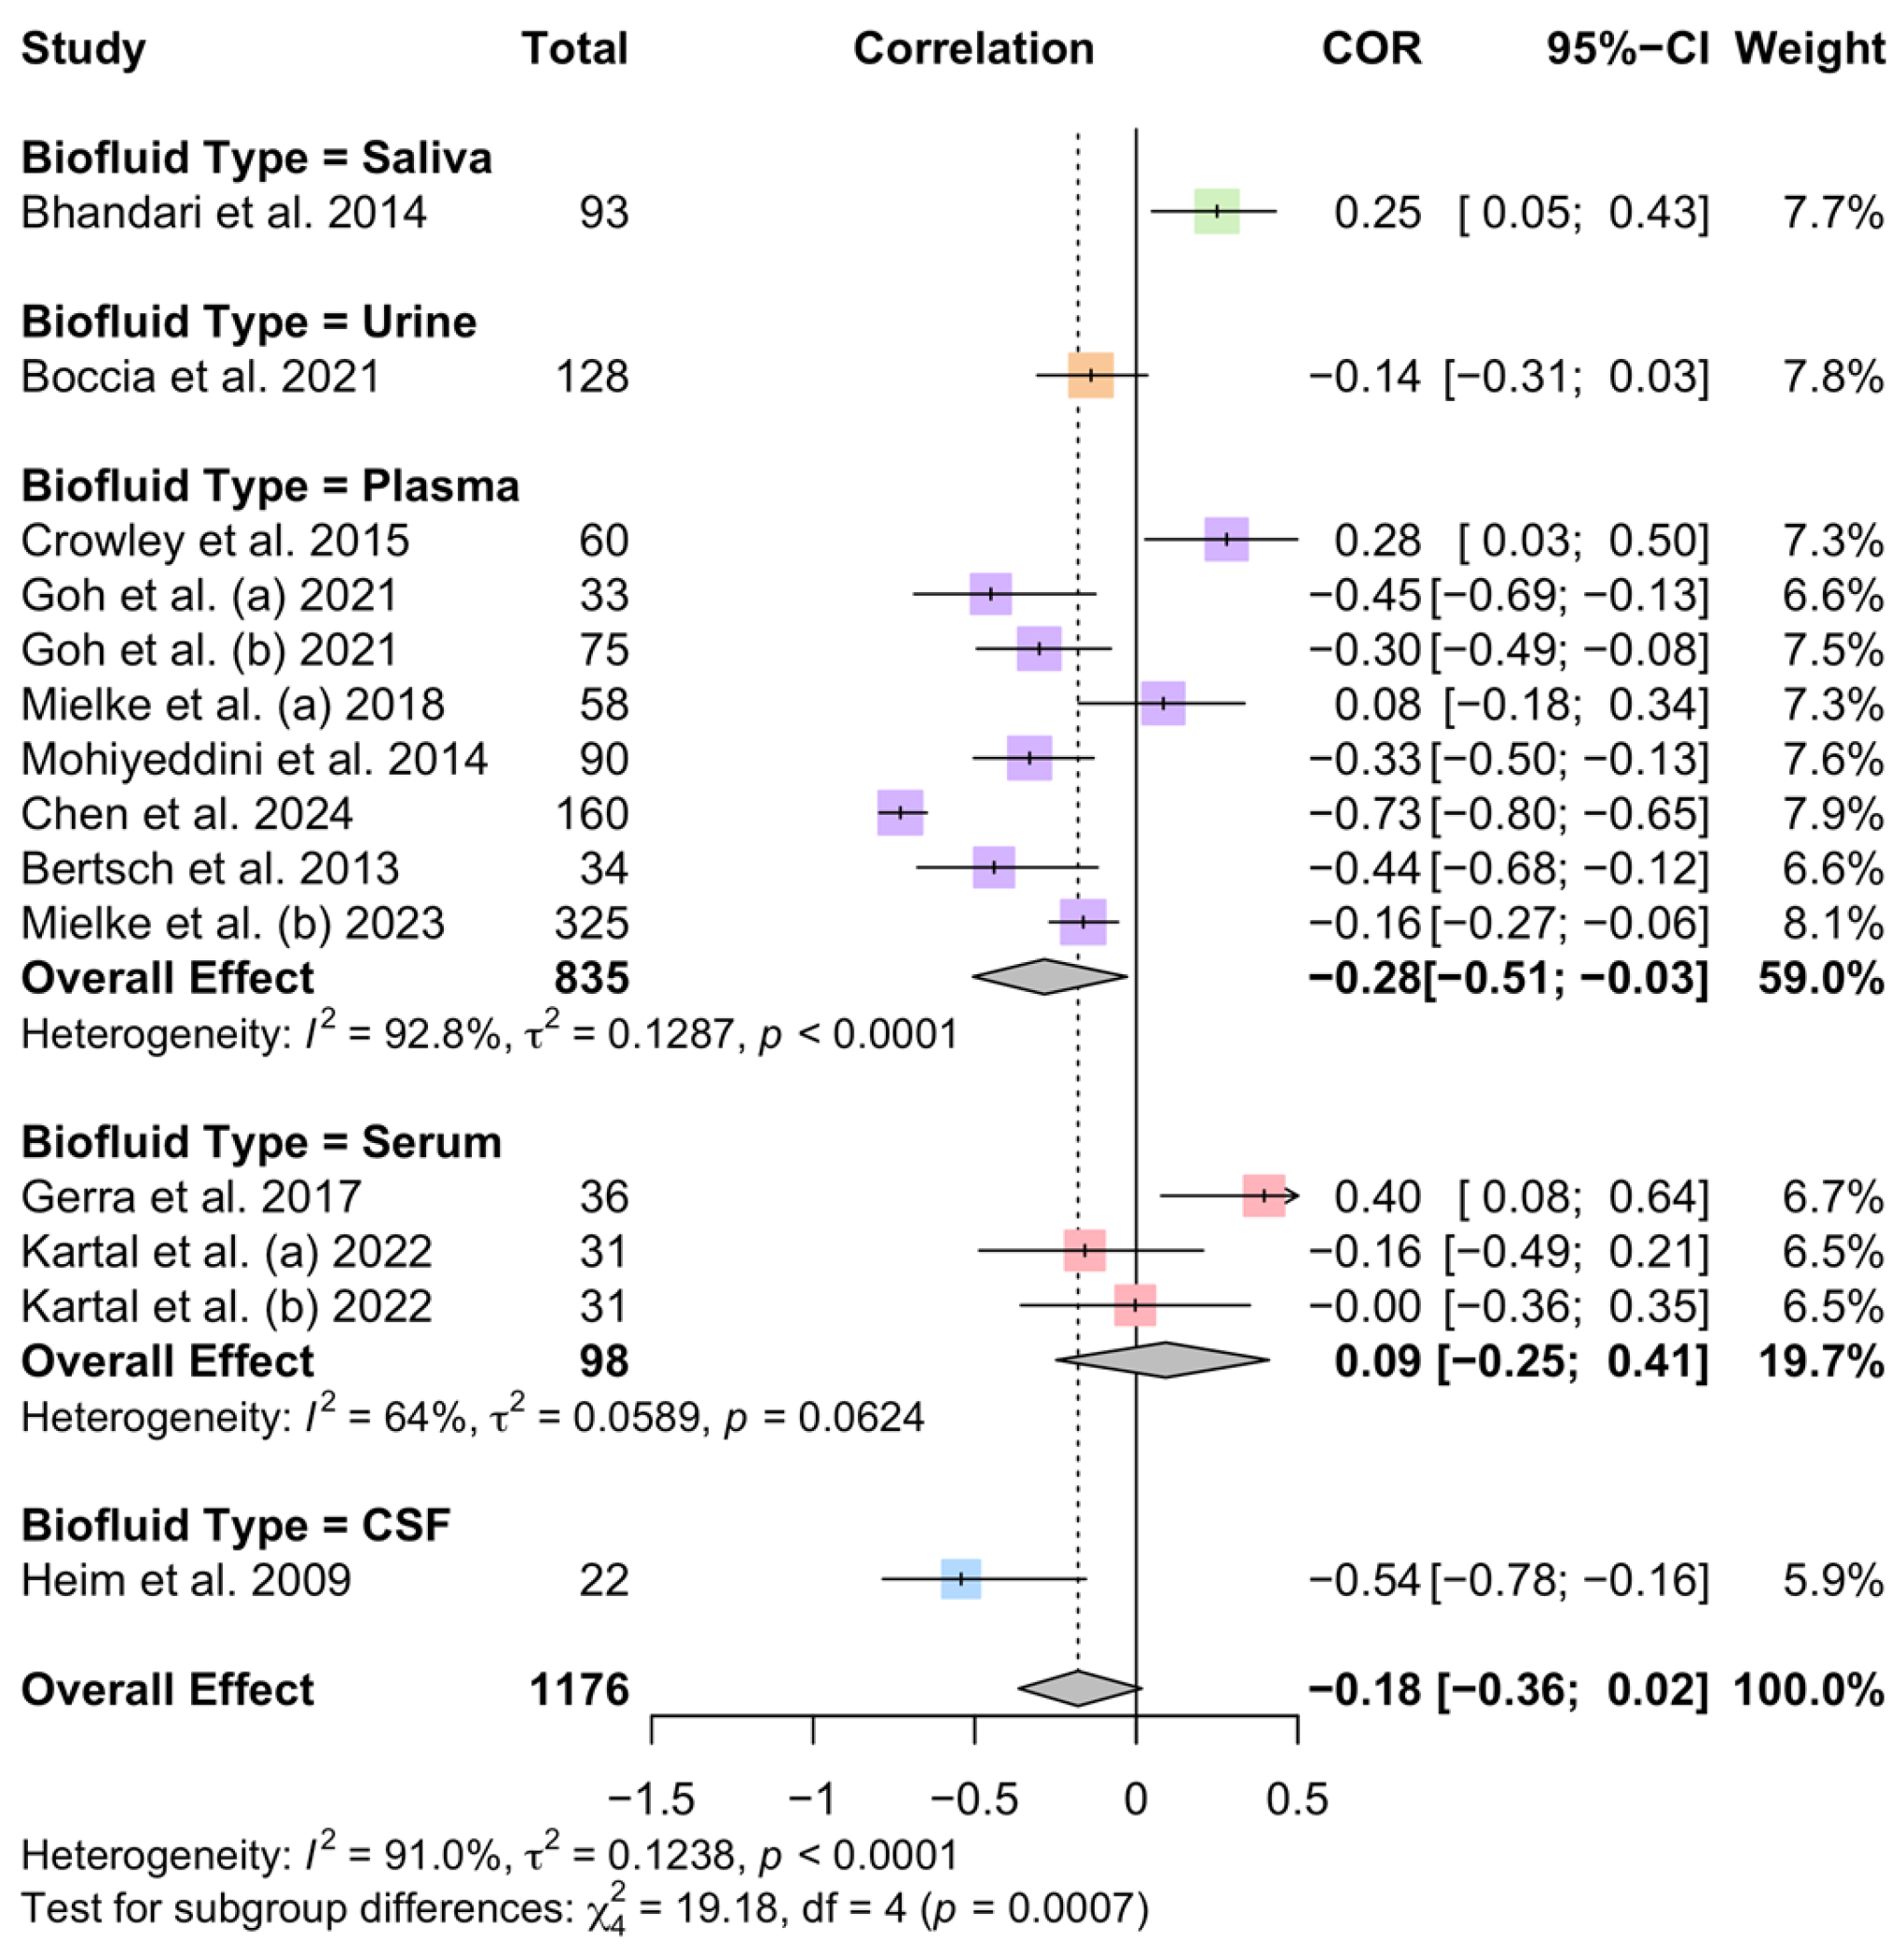
The association between ELS and peripheral OT differed significantly across biofluid compartments (χ24 = 19.18, p = 0.0007), indicating that biofluid type partially accounts for the heterogeneity observed in the primary analysis (Figure 4). Plasma was the only subgroup with a significant negative pooled correlation (k = 8, n = 835; COR −0.28, 95% CI [−0.51, −0.03]; I2 = 92.8%). CSF yielded the largest negative point estimate (k = 1, n = 22; COR −0.54, 95% CI [−0.78, −0.16]), while serum (k = 3, n = 98; COR 0.09, 95% CI [−0.25, 0.41]; I2 = 64%) and saliva (k = 1, n = 93; COR 0.25, 95% CI [0.05, 0.43]) showed positive, non-significant associations. Urine showed a negative but non-significant association (k = 1, n = 128; COR −0.14, 95% CI [−0.31, 0.03]). Saliva, urine, and CSF were each represented by a single study and were not formally pooled.
Figure 4.
Forest plot of the pooled association between ELS and peripheral OT levels in human studies [8,9,10,11,21,22,23,24,25,26,27,28], stratified by biofluid type. The relationship between ELS and peripheral OT varied across different biofluid types, partly explaining the heterogeneity observed in the primary analysis. Studies are grouped by biofluid compartment. Square size reflects study weight; horizontal lines indicate 95% CIs; diamonds represent subgroup and overall pooled random-effects estimates. Biofluid type significantly moderated the ELS–OT association (χ24 = 19.18, p = 0.0007).
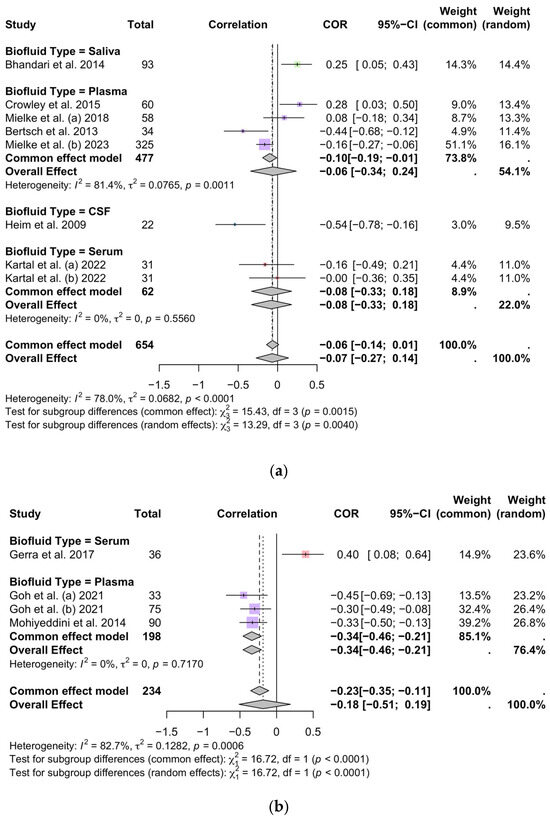
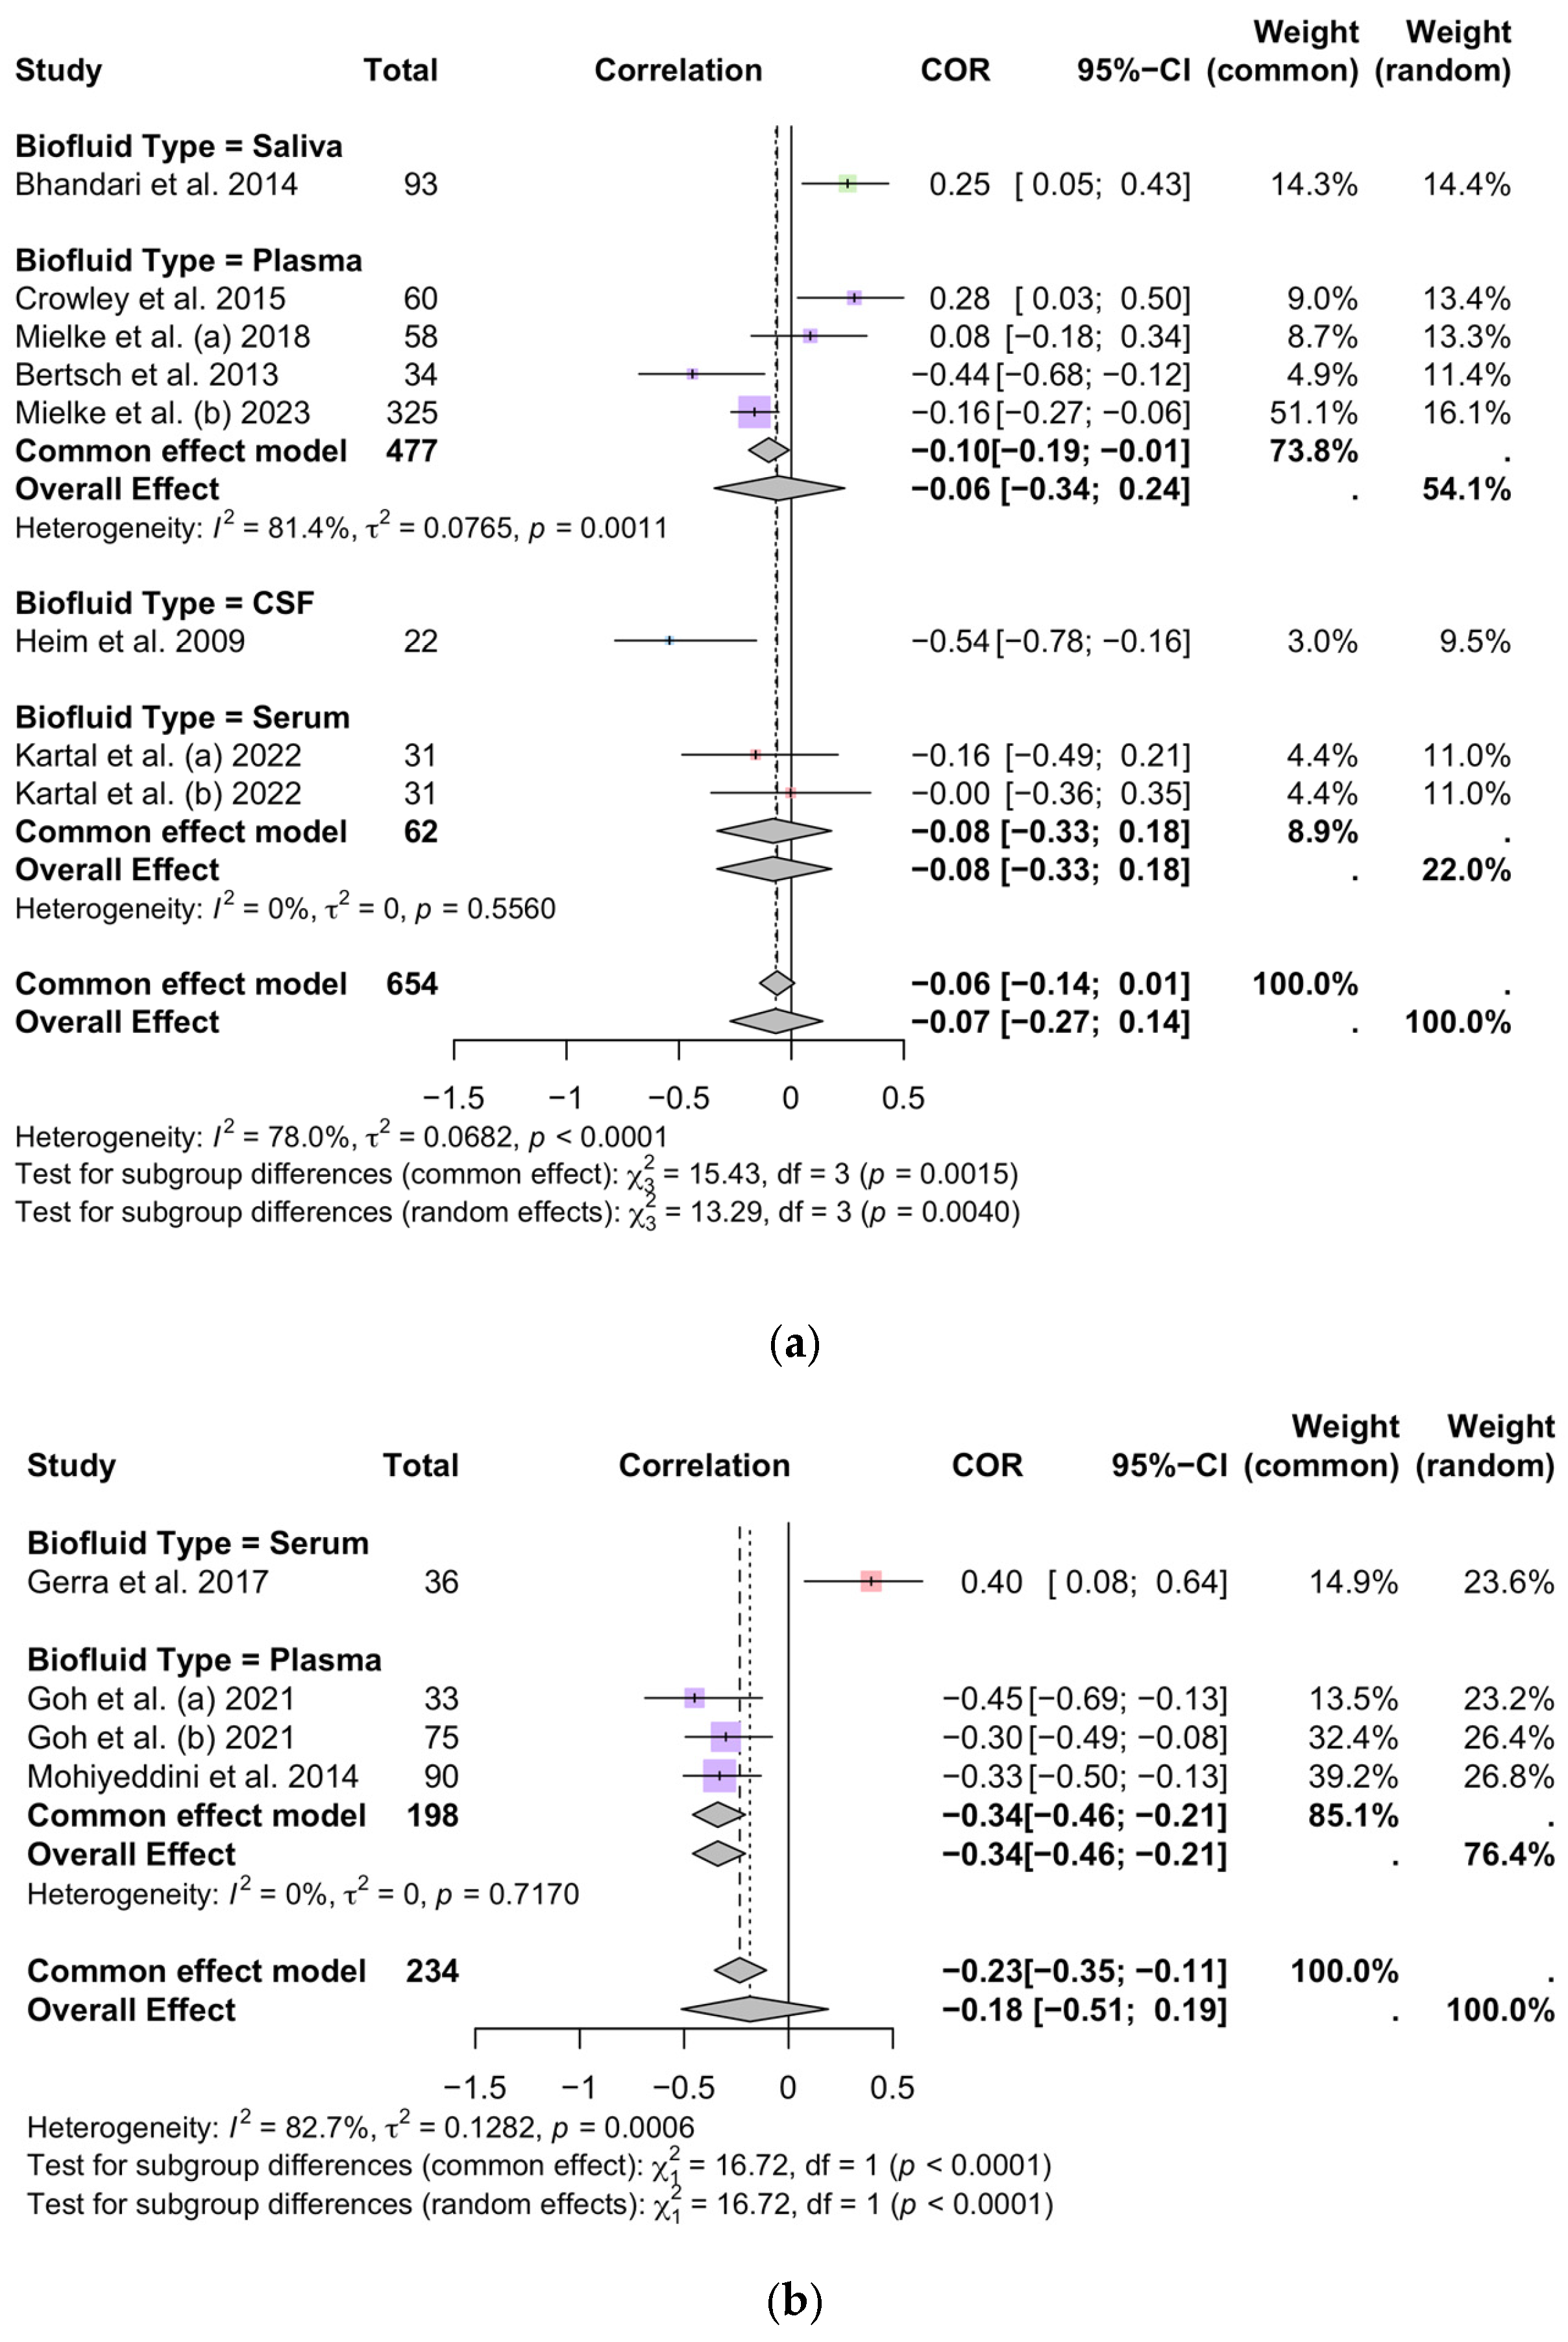
Sex-stratified biofluid analysis revealed divergent patterns between females and males (Figure 5). In males, plasma yielded a significant and consistent negative correlation (k = 3, n = 198; COR −0.34, 95% CI [−0.46, −0.21]; I2 = 0%), in contrast to the single serum study showing a positive association (COR 0.40, 95% CI [0.08, 0.64]) [28]; subgroup differences were significant (χ21 = 16.72, p < 0.0001). In females, biofluid type also significantly moderated the association (χ23 = 13.29, p = 0.0040); plasma showed a non-significant negative correlation (k = 4, n = 477; COR −0.06, 95% CI [−0.34, 0.24]; I2 = 81.4%), while serum showed no effect (k = 2, n = 62; COR −0.08, 95% CI [−0.33, 0.18]; I2 = 0%).
Figure 5.
Forest plot of the pooled association between ELS and peripheral OT levels in human studies [8,9,10,11,21,22,24,25,26,28], stratified by sex and sub-grouped by biofluid type. Studies are separated into female-only (a) and male-only (b) cohorts, with further grouping by biofluid compartment. Biofluid effects on the ELS–OT association differed by sex: plasma OT yielded a significant and homogeneous negative correlation (COR −0.34, 95% CI [−0.46, −0.21]; I2 = 0%) in males, while in females plasma trended negative but did not reach significance. Subgroup differences by biofluid type were statistically significant in both females (χ23 = 13.29, p = 0.0040) and males (χ21 = 16.72, p < 0.0001). Square size reflects study weight; horizontal lines indicate 95% CIs; diamonds represent subgroup and overall pooled random-effects estimates.
3.4. Systematic Review and Meta-Analysis of Rodent Peripheral OT in ELS Models
3.4.1. Primary Pooled Effect of Rodent Studies
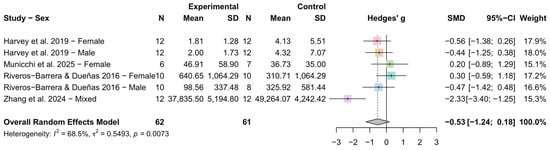
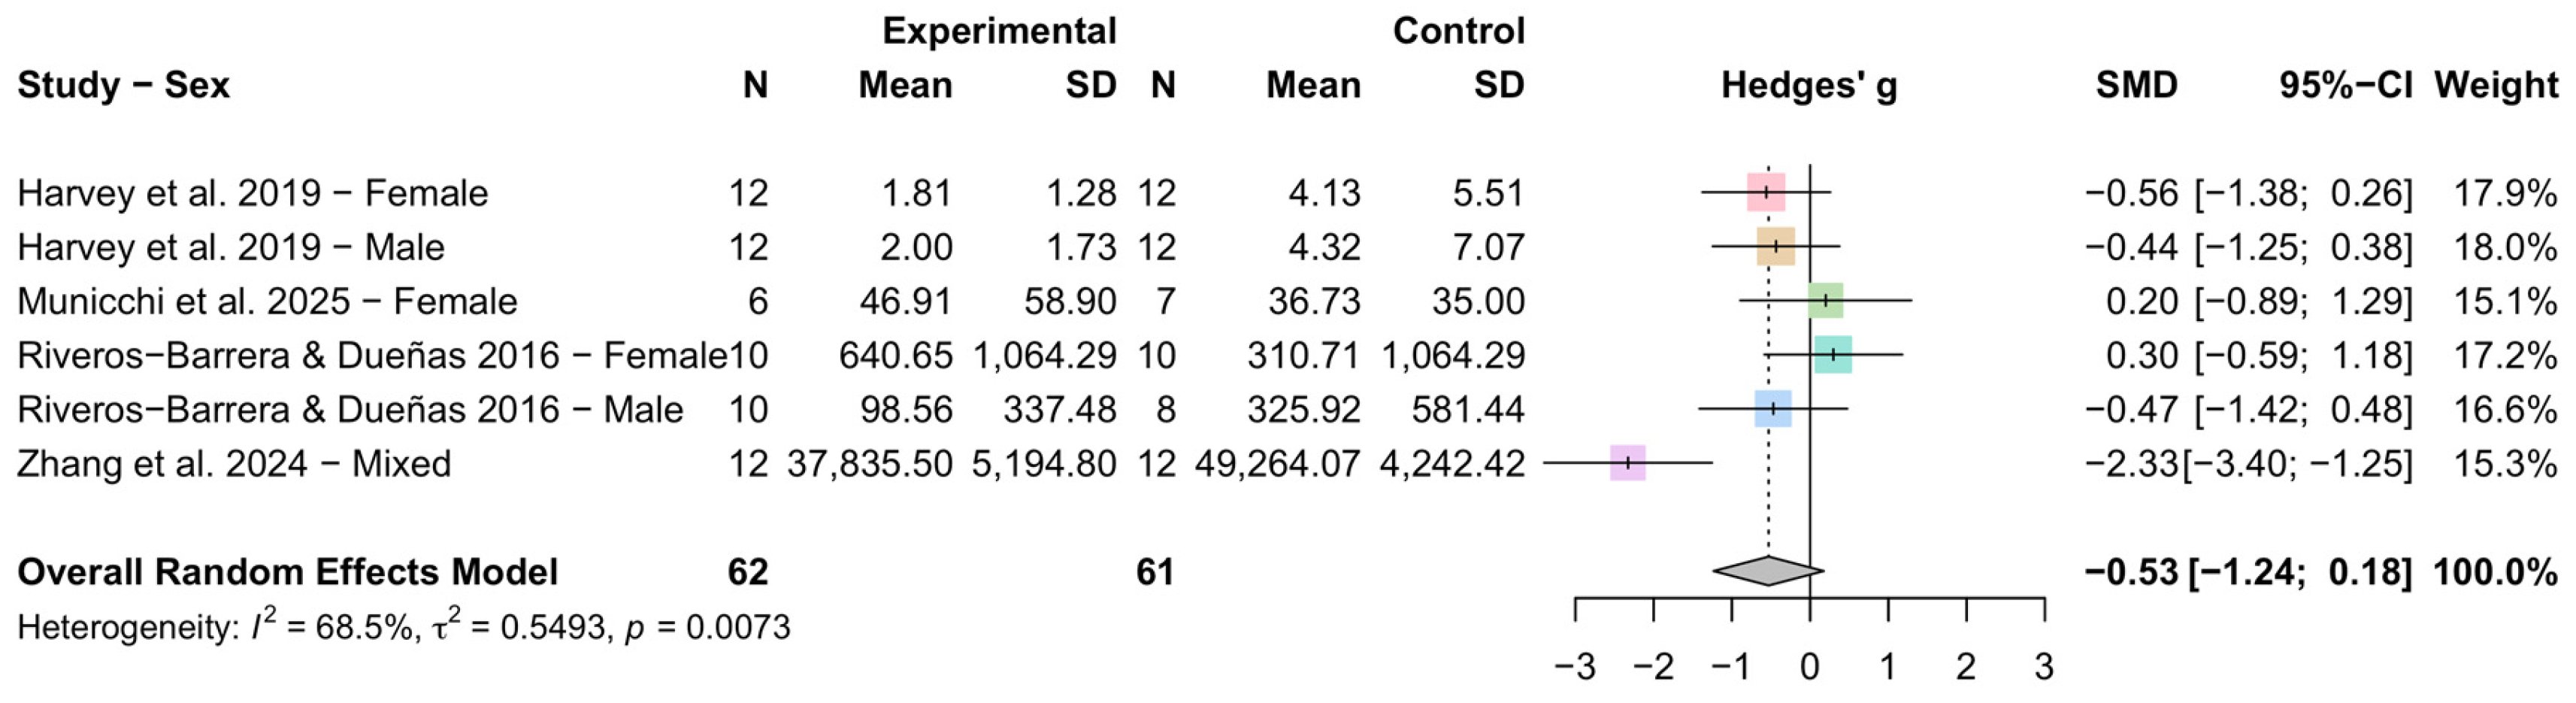
The pooled association between ELS and peripheral OT across six rodent datasets (k = 6, n = 123) trended negative but did not reach significance (SMD −0.53, 95% CI [−1.24, 0.18], p = 0.1409), with high heterogeneity (I2 = 68.5%, τ2 = 0.5493, p = 0.0073) (Figure 6). Four of six datasets reported lower peripheral OT in ELS-exposed animals and two reported higher levels, with the largest negative effect observed in Zhang et al., 2024 [17] (SMD −2.33, 95% CI [−3.40, −1.25]).
Figure 6.
Forest plot of the pooled association between ELS and peripheral OT levels in rodent studies [14,15,16,17]. The pooled rodent estimate was negative, however, non-significant (SMD −0.53, 95% CI [−1.24, 0.18], p = 0.1409), with lower peripheral OT reported in 4 of 6 ELS-exposed datasets. Each square represents the standardized mean difference (Hedges’ g) of an individual dataset, with size proportional to study weight. Horizontal lines indicate 95% CIs. The diamond represents the overall pooled random-effects estimate. Heterogeneity: I2 = 68.5%, τ2 = 0.5493, p = 0.0073. SMD, standardized mean difference; CI, confidence interval; N, sample size; SD, standard deviation.
3.4.2. Subgroup Analyses of Rodent Studies
Sex and Rodent Peripheral OT
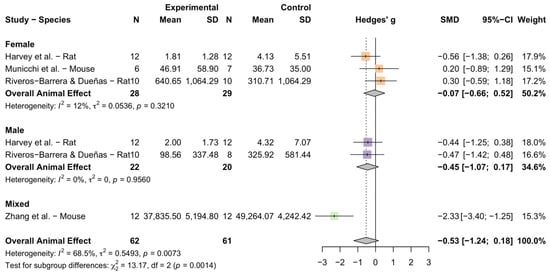
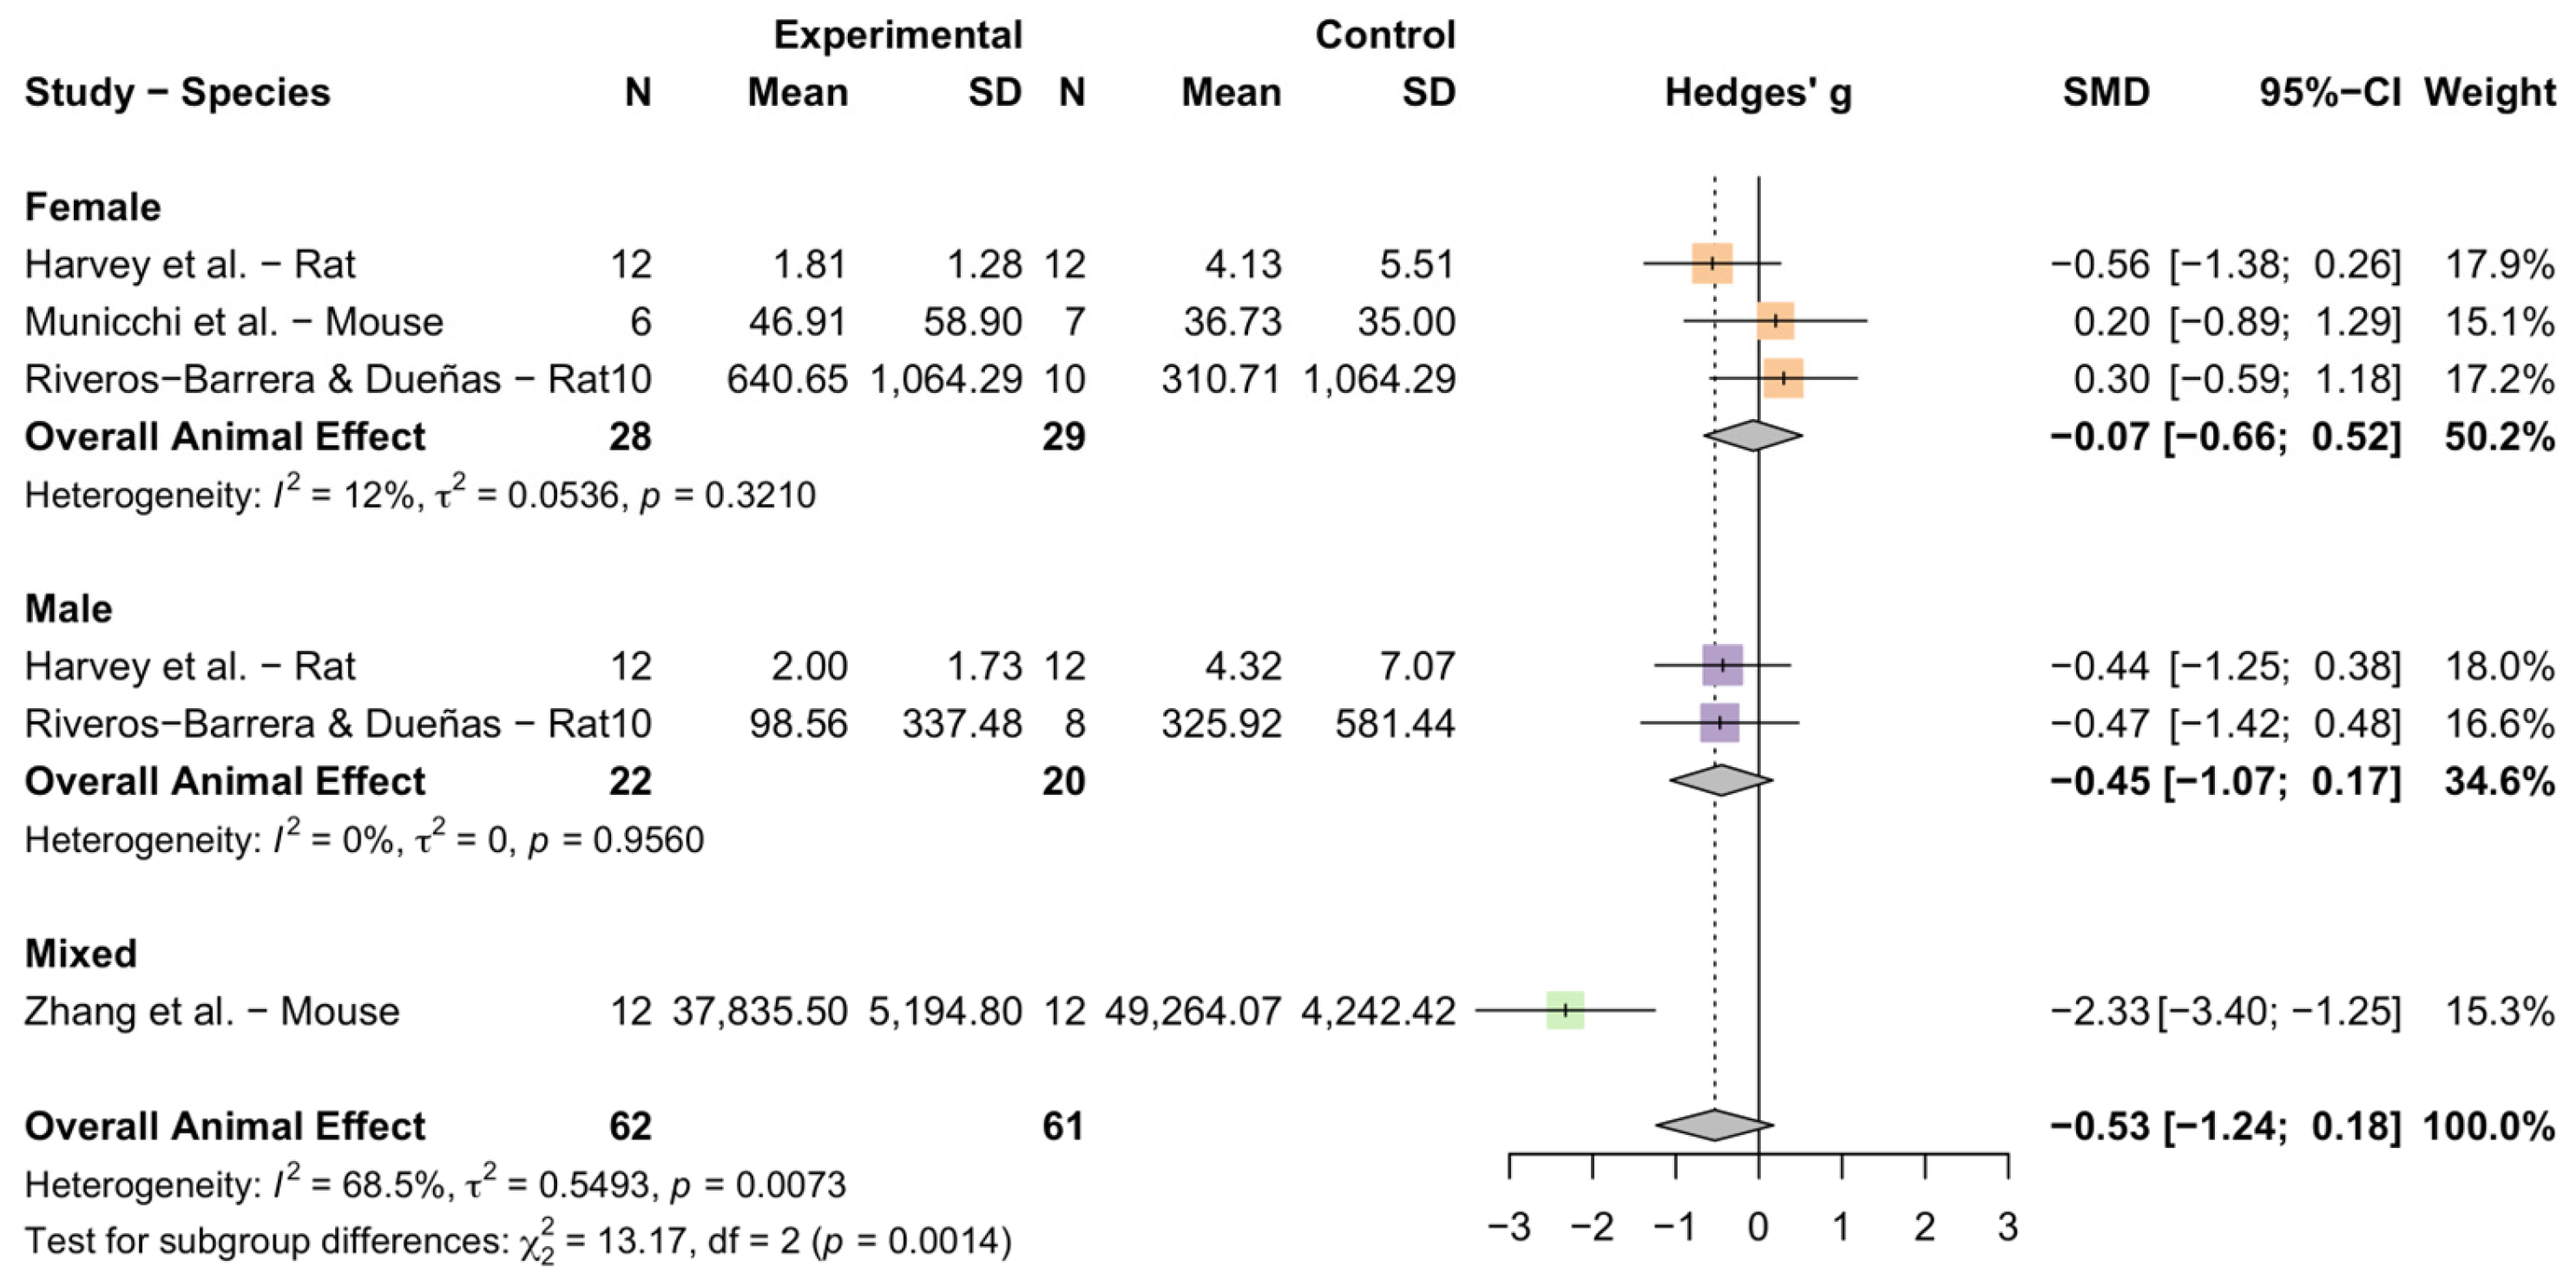
Subgroup analysis for sex in rodent studies revealed significant subgroup differences (χ22 = 13.17, p = 0.0014) (Figure 7). Male studies showed a more consistently negative trend (SMD −0.45, 95% CI [−1.07, 0.17]; I2 = 0%) compared to females (SMD −0.07, 95% CI [−0.66, 0.52]; I2 = 12%), though neither reached significance. The mixed-sex subgroup comprised a single study [17] with the largest negative effect across all rodent datasets (SMD −2.33, 95% CI [−3.40, −1.25]), which drove considerably the overall pooled estimate.
Figure 7.
Forest plot of the pooled association between ELS and peripheral OT levels in rodent studies, stratified by sex [14,15,16,17]. Studies are grouped into female, male, and mixed-sex cohorts. Rodent sex subgroups differed significantly (χ22 = 13.17, p = 0.0014), with males showing a more consistent negative trend than females, in both cases non-significant. Square size reflects study weight; horizontal lines indicate 95% CIs; diamonds represent subgroup and overall pooled random-effects estimates. Subgroup differences were statistically significant (χ22 = 13.17, p = 0.0014). SMD, standardized mean difference; CI, confidence interval; N, sample size; SD, standard deviation.
Biofluid Type and Rodent Peripheral OT
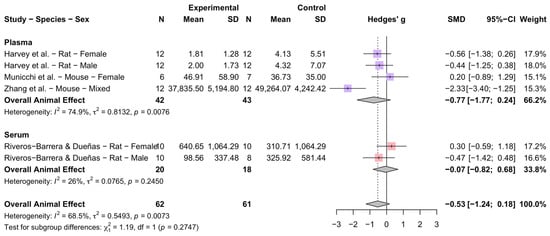
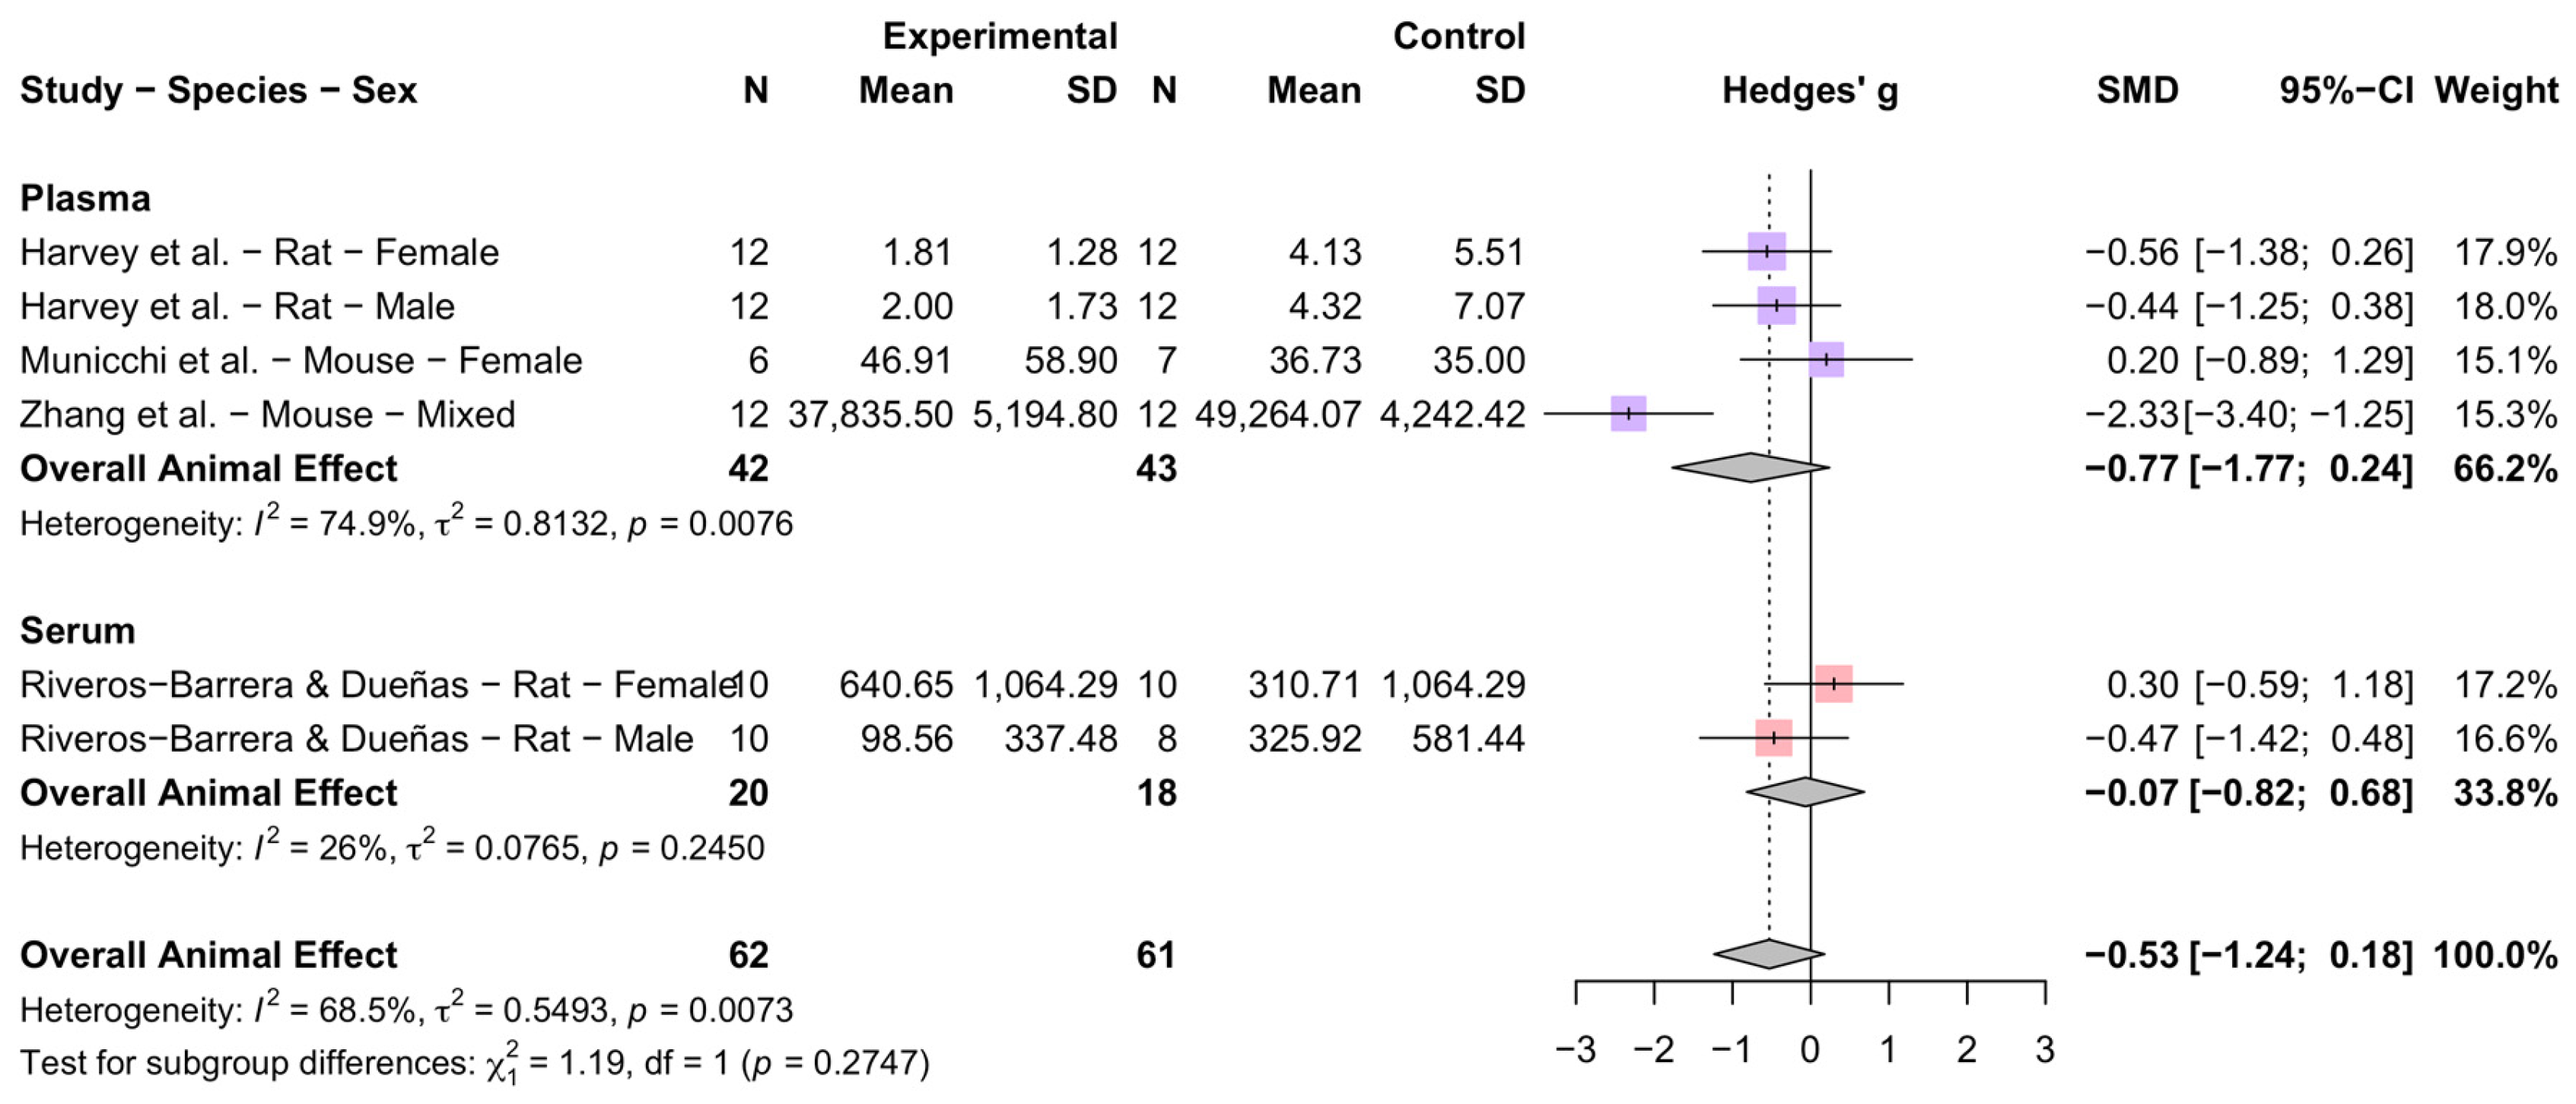
Biofluid type did not significantly moderate the ELS–OT association in rodent studies (χ21 = 1.19, p = 0.2747) (Figure 8). Plasma studies showed a larger negative but non-significant pooled effect (k = 4, n = 85; SMD −0.77, 95% CI [−1.77, 0.24]; I2 = 74.9%) compared to serum (k = 2, n = 38; SMD −0.07, 95% CI [−0.82, 0.68]; I2 = 26%), with both subgroups showing non-significant associations and divergent individual study directions within each compartment.
Figure 8.
Forest plot of the pooled association between ELS and peripheral OT levels in rodent studies [14,15,16,17], stratified by biofluid type. Studies are separated by biofluid compartment (plasma and serum). Biofluid type did not significantly moderate the ELS–OT association in rodent studies (χ21 = 1.19, p = 0.2747); plasma showed a larger negative pooled effect than serum, though both were non-significant. Each square represents an individual dataset, with size proportional to study weight; horizontal lines indicate 95% CIs; diamonds represent subgroup and overall pooled random-effects estimates. Biofluid type did not significantly moderate the association (χ21 = 1.19, p = 0.2747). SMD, standardized mean difference; CI, confidence interval; N, sample size; SD, standard deviation.
Rodent Species and Peripheral OT
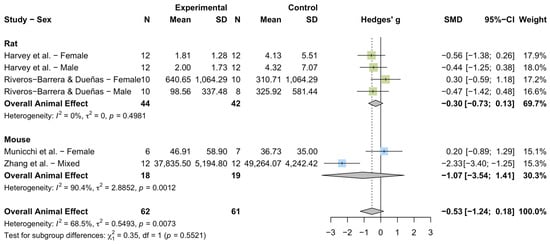
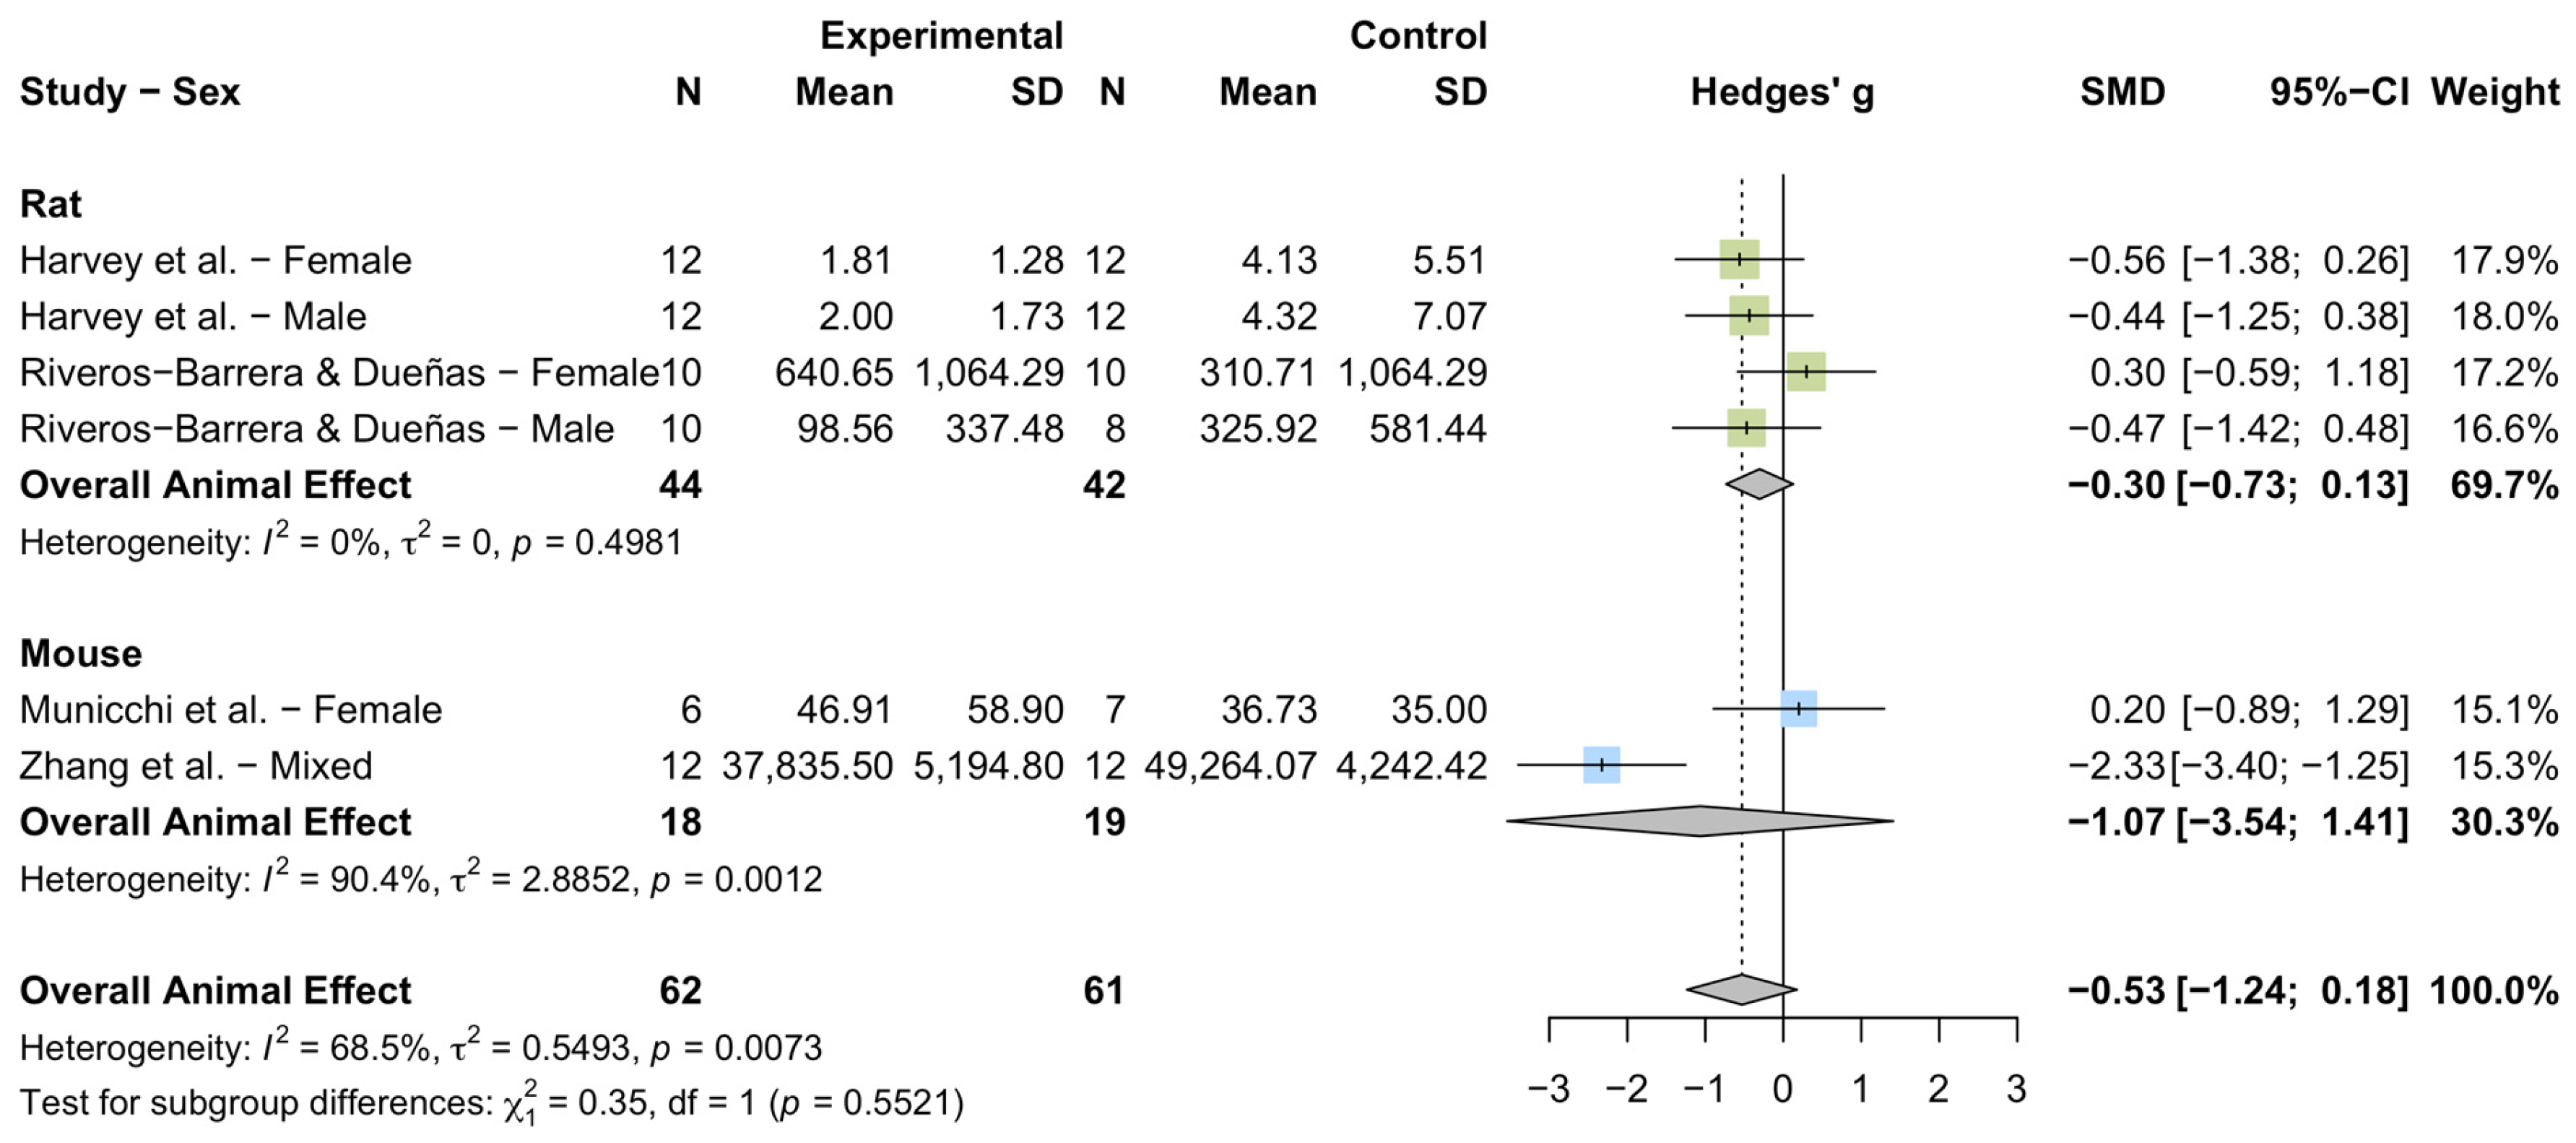
Species was not an apparent moderator of the ELS–OT association (χ21 = 0.35, p = 0.5521), though the small number of datasets per species limits the interpretability of this comparison (Figure 9). Rat studies yielded a consistent negative trend across all four datasets with low heterogeneity (k = 4, n = 86; SMD −0.30, 95% CI [−0.73, 0.13]; I2 = 0%), whereas mouse studies showed divergent effects and substantially higher heterogeneity (k = 2, n = 37; SMD −1.07, 95% CI [−3.54, 1.41]; I2 = 90.4%), largely attributable to the strongly negative effect observed in Zhang et al., 2024 [17] (SMD −2.33, 95% CI [−3.40, −1.25]).
Figure 9.
Forest plot of the pooled association between ELS and peripheral OT levels in rodent studies [14,15,16,17], stratified by species. Studies are separated by species (rat and mouse). Species did not significantly moderate the ELS–OT association (χ21 = 0.35, p = 0.5521). Rats showed a consistent negative trend (I2 = 0%) while mice showed contrasting effects. Each square represents an individual dataset, with size proportional to study weight; horizontal lines indicate 95% CIs; diamonds represent subgroup and overall pooled random-effects estimates. Species did not significantly moderate the association (χ21 = 0.35, p = 0.5521). SMD, standardized mean difference; CI, confidence interval; N, sample size; SD, standard deviation.
ELS Paradigm and Rodent Peripheral OT
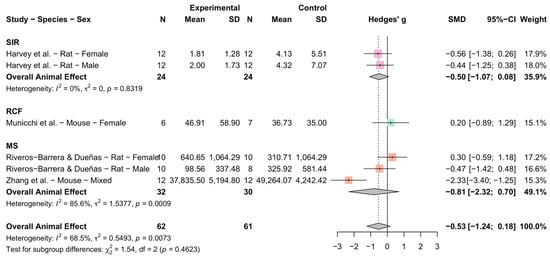
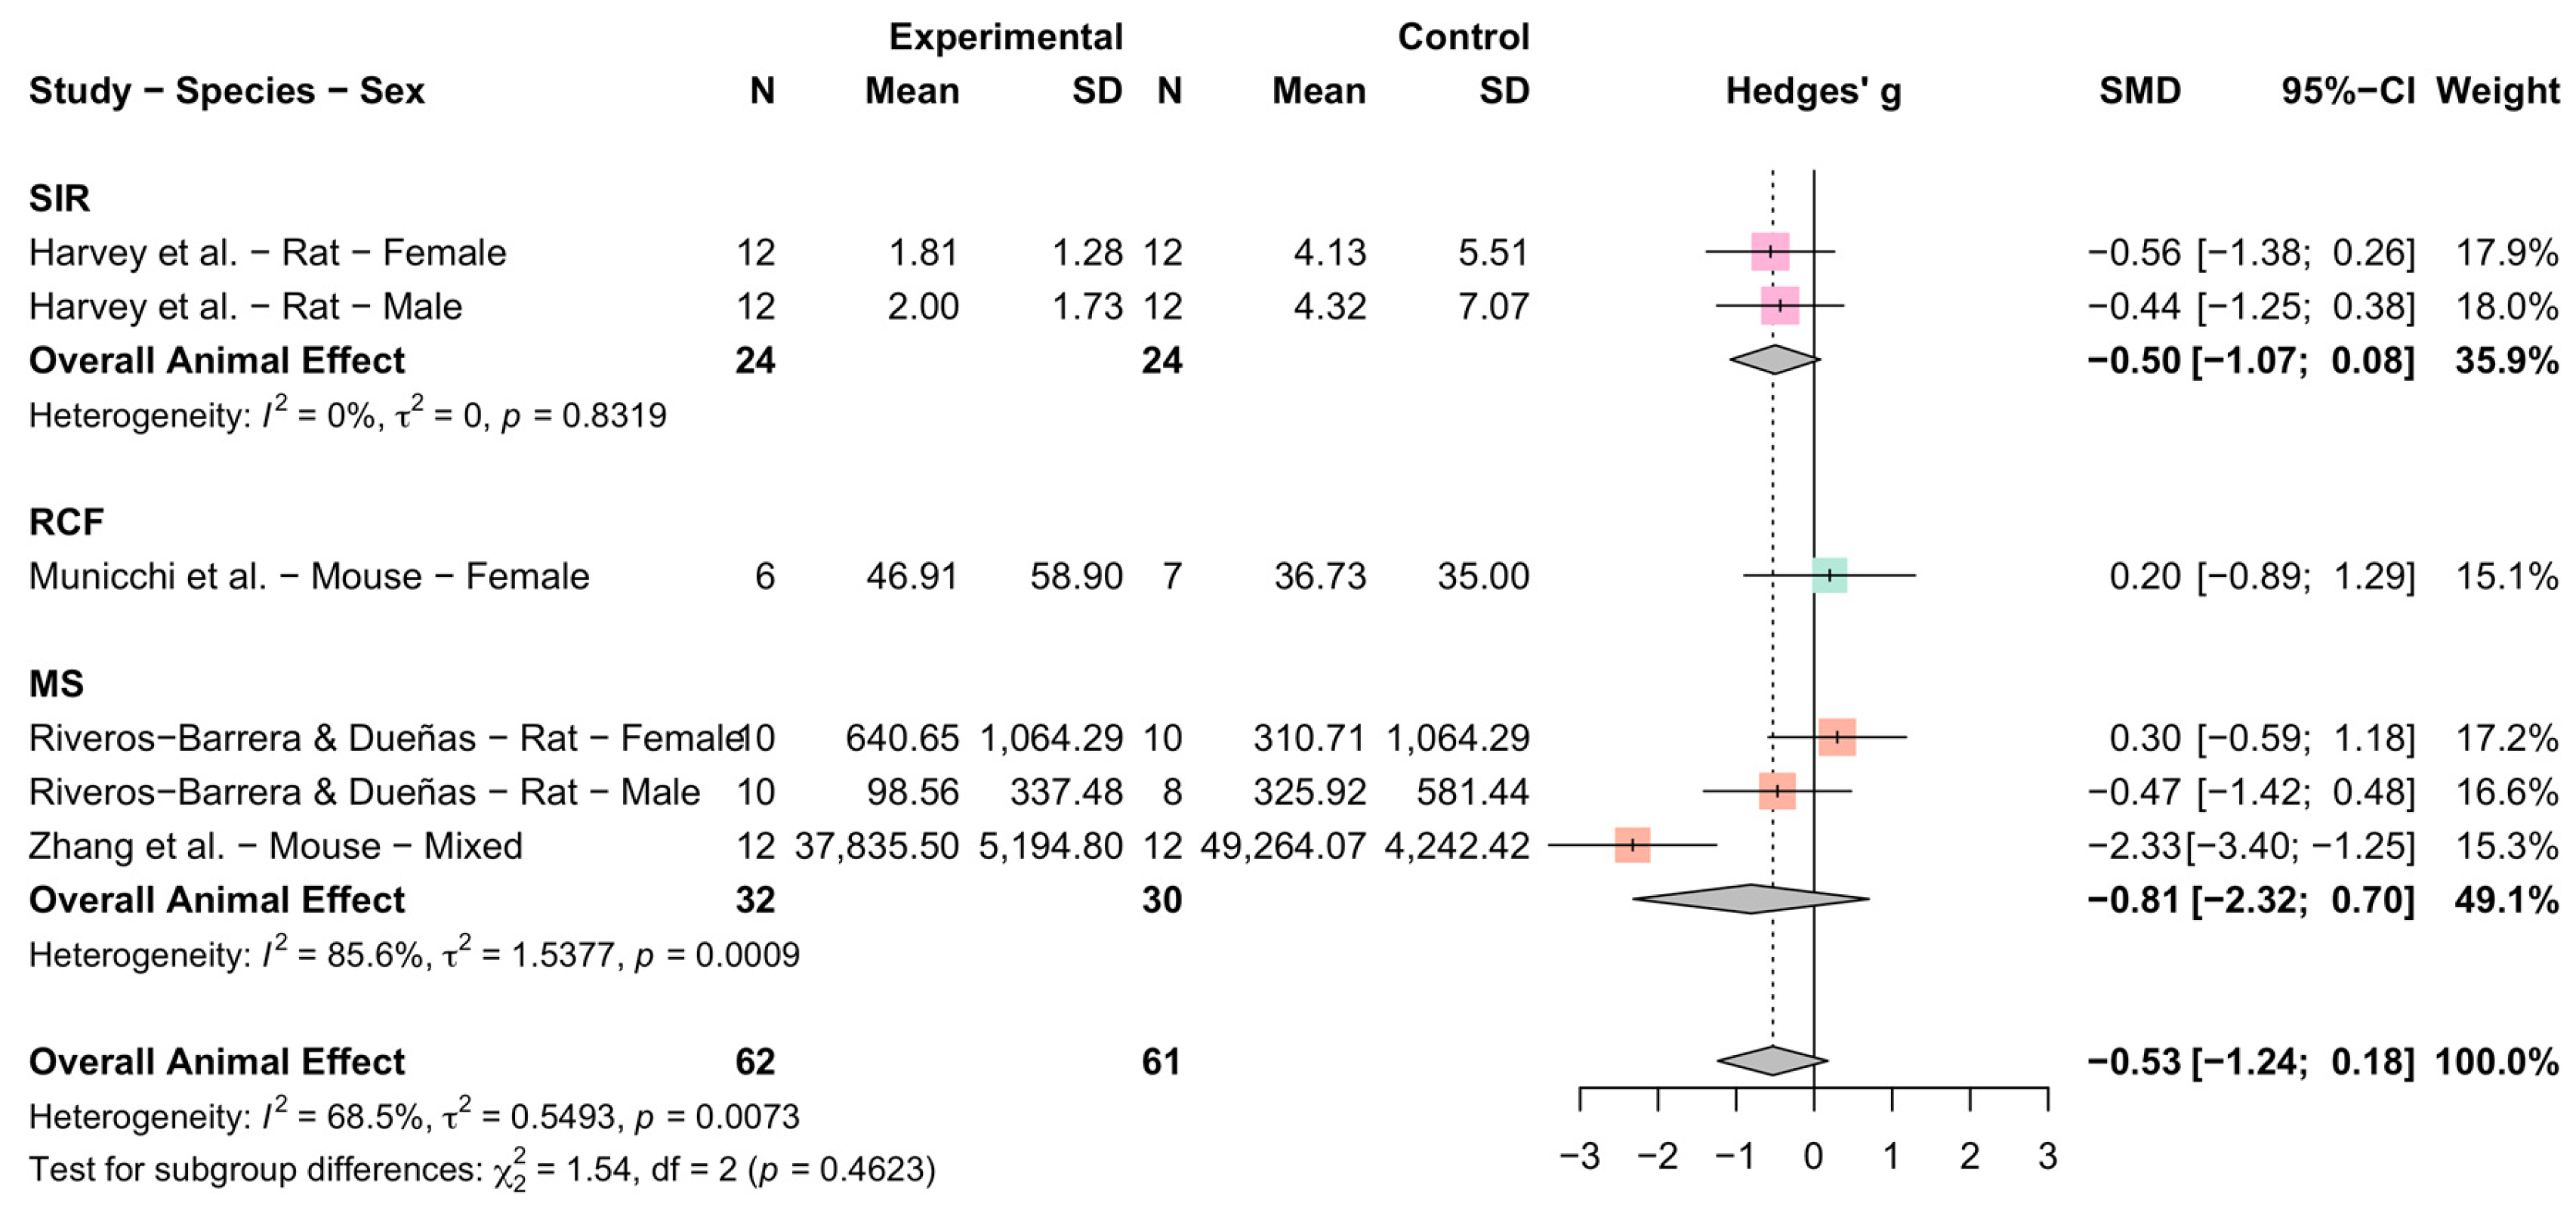
Across the three ELS paradigms, subgroup differences were not significant (χ22 = 1.54, p = 0.4623) (Figure 10). As previously cautioned, the limited number of datasets per paradigm constrains interpretation. SIR produced the most directionally consistent negative effect (k = 2, n = 48; SMD −0.50, 95% CI [−1.07, 0.08]; I2 = 0%), while RCF showed a non-significant positive effect in the single available study [15] (SMD 0.20, 95% CI [−0.89, 1.29]). MS yielded the largest pooled negative effect (k = 3, n = 62; SMD −0.81, 95% CI [−2.32, 0.70]) but with substantial heterogeneity (I2 = 85.6%) and a CI encompassing the null, reflecting divergent individual study effects within this paradigm.
Figure 10.
Forest plot of the pooled association between ELS and peripheral OT levels in rodent studies [14,15,16,17], stratified by ELS paradigm. Studies are grouped by ELS model: social isolation rearing (SIR), repeated cross-fostering (RCF), and maternal separation (MS). Each square represents an individual dataset, with size proportional to study weight; horizontal lines indicate 95% CIs; diamonds represent subgroup and overall pooled random-effects estimates. ELS paradigm did not significantly moderate the association (χ22 = 1.54, p = 0.4623). SMD, standardized mean difference; CI, confidence interval; N, sample size; SD, standard deviation.
3.5. Robustness and Publication Bias
Using the Leave-One-Out analysis, we assessed the robustness of the pooled estimates to the effect of individual studies in the analysis. Sequential omission of individual human studies did not considerably alter the direction or magnitude of the pooled correlation, which remained negative across all iterations (range: r = −0.11 to −0.22). A notable influence of omitting Chen et al. (2024) [27] produced the largest reduction in heterogeneity ( = 77.9%, = 0.070), suggesting this study contributed disproportionately to between-study variance (Figure S3a). For the rodent studies, the pooled Hedges’ g remained negative and non-significant across the iterations (range: g = −0.24 to −0.70). An apparent shift was observed in omitting Zhang et al. (2024) [17] where heterogeneity was reduced to = 0% ( = 0), suggesting a disproportionate contribution to between-study variance (Figure S3b). For both human and rodent studies, the pooled estimates were robust to the influence of any single study.
Publication bias was assessed in the human studies (k = 14) using Egger’s regression and funnel plot inspection (Figure S4). No statistically significant funnel plot asymmetry was detected (t = 0.583, df = 12, p = 0.571), and the small bias estimate (1.343, SE = 2.303) further indicated no significant evidence of publication bias. For the rodent studies (k = 6), formal testing was not performed, as the number of included studies was insufficient for reliable funnel plot asymmetry testing.
4. Discussion
4.1. Persisting Signal: ELS and Peripheral OT
The primary finding of this meta-analysis is a negatively trending association between ELS and peripheral OT in adult humans (COR −0.18, 95% CI [−0.36, 0.02]), with 9 of 14 datasets reporting lower OT in ELS-exposed individuals. The 95% prediction interval, which ranged from −0.75 to 0.54, indicates that the pooled estimate may not reflect a single underlying effect and that future studies may observe effects in either direction. A parallel negative trend was observed in rodents (SMD −0.53, 95% CI [−1.24, 0.18]), with four of six datasets reporting lower peripheral OT in ELS-exposed animals. The directional consistency across both species suggests a persisting negative directional trend in peripheral OT following ELS; given the non-significant pooled effects and very low GRADE certainty; however, this should be interpreted as a signal warranting further investigation rather than a robust biological conclusion. This negative direction is consistent with Ellis et al. (2021) [29], who reported a negative association between early adversity and endogenous OT in various age groups (children: r = 0.12; adults: r = 0.09). The stronger negative association in the present meta-analysis likely reflects the narrower, more severe ELS exposure in the included studies, which focused on clinical childhood maltreatment populations, compared to the broader range of adversity included in Ellis et al. (2021) [29]. The coexistence of studies reporting elevated and reduced peripheral OT across the evidence base points to sex and biofluid type or extraction as critical moderating variables [7,30]. Regardless of direction, ELS-associated oxytocinergic alterations carry implications for how the system responds to subsequent acute stress, as a blunted system may show attenuated OT release under acute challenge while an upregulated system may show exaggerated reactivity, both with links to ELS-associated psychopathology [12,13,31]. Studies comparing peripheral OT responses to acute stress in ELS-exposed versus non-ELS-exposed individuals and in rodents with and without a superimposed acute stressor are needed to address this gap.
4.2. Consistency in the Face of “Adversity”: Convergence of Human and Rodent Responses
The similar directionality across human and rodent studies is consistent with the possibility of evolutionary conservation of ELS-associated oxytocinergic suppression, biologically plausible given the high conservation of the oxytocinergic system and its players and HPA-OT regulatory circuits across mammalian species [6,32]. SIR showed the most consistent negative effect (SMD −0.50; I2 = 0%), while MS and RCF showed divergent within-paradigm trends, and the overall rodent estimate was sensitive to Zhang et al. (2024) [17]. It should be noted, however, that the human and rodent meta-analyses employed different effect size metrics (COR and Hedges’ g, respectively) and are derived from fundamentally different study designs: observational and correlational human studies versus experimental rodent models. Directional similarity across these designs does not constitute sufficient evidence of cross-species conservation and should be regarded as hypothesis-generating. Dedicated ELS–OT rodent studies using standardized paradigms, biofluid sampling matched to human protocols, and sex-stratified designs may be necessary before cross-species inference can move beyond directional consistency.
4.3. Catching Both Sides: Sex-Divergent Responses to ELS
Male studies showed a more consistent negative trend across both species (humans: COR −0.18; rodents: SMD −0.45; I2 = 0%), while female cohorts showed greater directional variability. The rodent sex subgroup difference reached significance (χ22 = 13.17, p = 0.0014). Prior studies noted the lack of sex-stratified analyses as a key gap in the health and ELS literature [3,4,18,19]. The present analysis, to our knowledge, is the first to quantify the cross-study directional divergence between male and female cohorts. While female variability is biologically plausible, it should not be read as a weaker signal [4,19]. No included human study directly tested sex as a within-study moderator of the ELS–OT association; all sex-stratified conclusions in the human analysis are derived from between-study comparisons and should be regarded as exploratory, pending confirmation from within-study sex-stratified designs. Mixed-sex designs with results interpreted separately for each sex are necessary to resolve this gap.
4.4. Mind the Fluid: The Case for Plasma
Biofluid type was the strongest moderator (χ24 = 19.18, p = 0.0007), with each biofluid capturing a different aspect of peripheral OT dynamics [7]. Plasma was the only subgroup with a significant negative pooled correlation (COR −0.28, 95% CI [−0.51, −0.03]; low GRADE certainty). Although plasma has been widely used, serum was also noted to be a potential proxy [7]. We argue, based on our findings, that plasma and serum may not be crudely interchangeable, given the more uniform trends in plasma. With the limited number of studies, we cannot rule out the potential utility of serum and other body fluids in measuring peripheral OT. Additionally, while we identify plasma as the most promising biofluid in the available evidence for studying peripheral OT in ELS, sex as a moderator has challenged its uniform application to both sexes. In males, plasma OT was significant and homogeneous (COR −0.34, 95% CI [−0.46, −0.21]; I2 = 0%); in females it was attenuated and heterogeneous (COR −0.06; I2 = 81.4%). However, we caution that the homogeneity in males should be interpreted in an exploratory rather than definitive context with only k = 3 studies available. We identify plasma as the most notable biofluid in the current evidence base for ELS–OT research, while acknowledging equivalence uncertainty across matrices and the need for further validation with larger study numbers. To our knowledge, no prior meta-analysis of the ELS–OT association has formally evaluated biofluids as a moderator while highlighting the sex differences.
4.5. Path to an ELS Biomarker
Plasma OT in male cohorts shows a consistent negative association with ELS that is directionally replicated across species. However, peripheral and central OT pools are regulated by partially independent mechanisms, and the correspondence between plasma OT and hypothalamic OT synthesis or receptor expression remains without a consensus [5,6,32]. Peripheral OT is a distal readout of molecular changes associated with early-life adversity and can hence be influenced along the processes from central expression to peripheral release. For example, alterations in the expression of the OT receptor (Oxtr) and the receptor for advanced glycation end-products (RAGE) across different cell types in regions such as the nucleus accumbens and prefrontal cortex coincided with opposing trends in central and peripheral OT levels in female mice exposed to ELS [15]. Reduced RAGE expression across glial and immune cell populations of the prefrontal cortex likely impairs peripheral-to-central OT transport, while increased Oxtr expression in the medial shell of the nucleus accumbens may reflect a compensatory response to locally reduced OT availability [15].
Future studies should therefore integrate peripheral OT assessments with central molecular readouts, including OT gene expression, receptor gene expression and capacity, and epigenetic modifications. Currently, peripheral OT alone is insufficient as a standalone ELS biomarker, but the convergent findings here provide a basis for more targeted investigation. Mixed-sex designs, with sex-stratified analyses interpreted separately for each sex, are strongly recommended, as single-sex cohort designs prevent direct within-study moderation testing and limit inference to between-study comparisons. Plasma-based OT quantification should be prioritized as the most promising matrix in the available evidence, pending validation of other biofluids with larger study samples. Additionally, study designs comparing basal and acute stress-reactive peripheral OT in ELS-exposed versus non-ELS-exposed individuals and animals are additionally needed to move beyond the current reliance on basal sampling. In addition, the standardization of assay methodology and sample collection protocols across laboratories is necessary to reduce the technical heterogeneity that likely contributes to the high residual I2 observed in the present evidence base.
4.6. Limitations
All human studies relied on retrospective self-report instruments for ELS operationalization, introducing recall bias, and the cross-sectional and case-control designs across included studies restrict causal inference. High residual heterogeneity (I2 = 91.0%) indicates substantial between-study variance that the subgroup analyses only partially explained. Beyond the moderators formally examined, this heterogeneity may reflect variability in assay methodology, given known differences in antibody specificity between RIA and ELISA platforms. It may also reflect variability in the timing of peripheral OT sampling, the characteristics of the experienced early-life adversity (e.g., type of stress, severity, and frequency of exposure), participant characteristics including race/nationality, comorbidities and concomitant medication use, or complex interactions among these factors. Sex moderation was assessed entirely through indirect cross-study comparisons, as no included study provided within-study sex-stratified ELS–OT data. The rodent evidence base is severely limited (k = 6) and sensitive to individual studies; formal publication bias testing was not performed for rodent studies due to the insufficient number of available datasets, and the possibility of publication bias cannot be excluded. Inconsistent ethnicity documentation limits the interpretability of the exploratory nationality/race subgroup analysis.
5. Conclusions
This translational meta-analysis identified a negative directional trend in peripheral OT following ELS across human and rodent studies, with neither the human (COR −0.18, 95% CI [−0.36, 0.02]; p = 0.0732) nor rodent (SMD −0.53, 95% CI [−1.24, 0.18]; p = 0.1409) pooled effects reaching statistical significance. Plasma OT, particularly in male cohorts, showed the most consistent signal within this non-significant overall trend. The limited evidence base and very low GRADE certainty reflect the early state of this literature, but the directional similarity across species and the biofluid-specific findings provide a meaningful starting point for more targeted investigation. Peripheral OT may represent a distal correlate of central oxytocinergic function, and future studies should integrate it with molecular readouts to more fully characterize the biological embedding of ELS. Sex differences in the ELS–OT association are biologically plausible but empirically unresolved, a direct consequence of the dominance of single-sex cohort designs that prevent within-study moderation testing. We recommend for future research to further explore the ELS–OT association and prioritize mixed-sex designs with sex-stratified analyses interpreted separately for each sex, plasma-based quantification, molecular integration including OXT receptor expression and epigenetic profiling, and studies comparing peripheral OT under basal and acute stress conditions across both humans and rodents.
Supplementary Materials
The following supporting information can be downloaded at: https://www.mdpi.com/article/10.3390/ctn10030018/s1, Figure S1. Exploratory nationality/race subgroup analysis of the association between early-life stress and peripheral OT levels in human studies [8,9,10,11,21,22,23,24,25,26,27,28]. Pooled correlation coefficients (COR) and 95% confidence intervals (CI) were estimated using a random-effects model. Subgroup differences were statistically significant (χ26 = 15.45, p = 0.0170). Findings should be interpreted with caution given unequal study numbers across subgroups and inconsistent ethnicity reporting. Figure S2. Scatter plot of the meta-regression examining the association between mean participant age and the correlation between early-life stress and peripheral OT levels (Fisher’s z). Each point represents individual studies [8,9,10,11,21,22,23,24,25,26,27,28], with the line indicating the fitted regression slope showing a negative albeit a non-significant relationship between age and peripheral oxytocin levels (QM(df = 1) = 1.34, p = 0.247). Figure S3. Leave-one-out sensitivity analysis of the pooled association between early-life stress and peripheral OT levels in human (a) and rodent (b) studies. Each row represents the pooled estimate obtained upon sequential omission of one study. In human studies [8,9,10,11,21,22,23,24,25,26,27,28] (a), pooled correlation coefficients (COR) are presented with 95% confidence intervals (CI). In rodent studies [14,15,16,17] (b), standardized mean differences (Hedges’ g) are presented with 95% CI. The original overall effect including all studies is shown at the bottom of each panel. Figure S4. Funnel plot of the pooled ELS-OT association in human studies [8,9,10,11,21,22,23,24,25,26,27,28]. Each dot represents an individual study plotted by its Fisher’s z-transformed correlation coefficient against its standard error. Dashed lines indicate significance thresholds at p < 0.10, p < 0.05, and p < 0.01. The plot shows broad symmetry around the pooled effect, and no significant publication bias was detected (Egger’s test p = 0.571). PRISMA 2020 Main Checklist [33].
Author Contributions
Conceptualization, M.V.M. and L.M.M.D.; methodology, M.V.M., D.K.M.B., and L.M.M.D.; validation, M.V.M., D.K.M.B., and L.M.M.D.; formal analysis, M.V.M.; investigation, M.V.M., D.K.M.B., and L.M.M.D.; writing—original draft preparation, M.V.M.; writing—review and editing, M.V.M., D.K.M.B., and L.M.M.D.; visualization, M.V.M.; supervision, L.M.M.D. All authors have read and agreed to the published version of the manuscript.
Funding
This research received no external funding. The APC was funded by the University of the Philippines Manila College of Medicine and the Department of Science and Technology—Philippine Council for Health Research Development (DOST—PCHRD).
Institutional Review Board Statement
Not applicable.
Informed Consent Statement
Not applicable.
Data Availability Statement
The data presented in this study are available on request from the corresponding author.
Acknowledgments
The researchers acknowledge the support of the University of the Philippines Office of International Linkages (UP OIL) through the Continuous Operational Outcomes-based Partnership for Excellence in Research and Academic Training Enhancement (COOPERATE) program grant.
Conflicts of Interest
The authors declare no conflicts of interest.
Abbreviations
The following abbreviations are used in this manuscript:
| AHRQ | Agency for Healthcare Research and Quality |
| CC | Case-control |
| CECA | Childhood Experience of Care and Abuse |
| CI | Confidence interval |
| COR | Correlation coefficient |
| CSF | Cerebrospinal fluid |
| CTQ/-SF | Childhood Trauma Questionnaire—Short Form |
| EE | Effect estimate |
| ELS | Early-life stress |
| ELISA | Enzyme-linked immunosorbent assay |
| ELSI | Early-Life Stress Inventory |
| ERIC | Education Resources Information Center |
| GRADE | Grading of Recommendations, Assessment, Development, and Evaluations |
| IMP | Imprecision |
| INC | Inconsistency |
| IND | Indirectness |
| MS | Maternal separation |
| NOS | Newcastle–Ottawa Scale |
| OT | Oxytocin |
| PB | Publication bias |
| PND | Postnatal day |
| PRISMA | Preferred Reporting Items for Systematic Reviews and Meta-Analyses |
| PROSPERO | International Prospective Register of Systematic Reviews |
| RAGE | Receptor for Advanced Glycation End-products |
| RCF | Repeated cross-fostering |
| RIA | Radioimmunoassay |
| RoB | Risk of bias |
| SAI | Structured Abuse Interview |
| SD | Standard deviation |
| SIR | Social isolation rearing |
| SMD | Standardized mean difference |
| SYRCLE | SYstematic Review Center for Laboratory animal Experimentation |
| XS | Cross-sectional |
| ZCOR | Fisher’s z-transformed correlation coefficient |
References
- Syed, S.A.; Nemeroff, C.B. Early Life Stress, Mood, and Anxiety Disorders. Chronic Stress 2017, 1, 2470547017694461. [Google Scholar] [CrossRef] [Scilit] [PubMed]
- Smith, K.E.; Pollak, S.D. Early Life Stress and Development: Potential Mechanisms for Adverse Outcomes. J. Neurodev. Disord. 2020, 12, 34. [Google Scholar] [CrossRef] [Scilit] [PubMed]
- Reemst, K.; Ruigrok, S.R.; Bleker, L.; Naninck, E.F.G.; Ernst, T.; Kotah, J.M.; Lucassen, P.J.; Roseboom, T.J.; Pollux, B.J.A.; de Rooij, S.R.; et al. Sex-Dependence and Comorbidities of the Early-Life Adversity Induced Mental and Metabolic Disease Risks: Where Are We At? Neurosci. Biobehav. Rev. 2022, 138, 104627. [Google Scholar] [CrossRef] [Scilit] [PubMed]
- Goodwill, H.L.; Manzano-Nieves, G.; Gallo, M.; Lee, H.-I.; Oyerinde, E.; Serre, T.; Bath, K.G. Early Life Stress Leads to Sex Differences in Development of Depressive-like Outcomes in a Mouse Model. Neuropsychopharmacology 2019, 44, 711–720. [Google Scholar] [CrossRef] [Scilit] [PubMed]
- Valstad, M.; Alvares, G.A.; Egknud, M.; Matziorinis, A.M.; Andreassen, O.A.; Westlye, L.T.; Quintana, D.S. The Correlation between Central and Peripheral Oxytocin Concentrations: A Systematic Review and Meta-Analysis. Neurosci. Biobehav. Rev. 2017, 78, 117–124. [Google Scholar] [CrossRef] [Scilit] [PubMed]
- Gimpl, G.; Fahrenholz, F. The Oxytocin Receptor System: Structure, Function, and Regulation. Physiol. Rev. 2001, 81, 629–683. [Google Scholar] [CrossRef] [Scilit] [PubMed]
- Tabak, B.A.; Leng, G.; Szeto, A.; Parker, K.J.; Verbalis, J.G.; Ziegler, T.E.; Lee, M.R.; Neumann, I.D.; Mendez, A.J. Advances in Human Oxytocin Measurement: Challenges and Proposed Solutions. Mol. Psychiatry 2023, 28, 127–140. [Google Scholar] [CrossRef] [Scilit] [PubMed]
- Heim, C.; Young, L.J.; Newport, D.J.; Mletzko, T.; Miller, A.H.; Nemeroff, C.B. Lower CSF Oxytocin Concentrations in Women with a History of Childhood Abuse. Mol. Psychiatry 2009, 14, 954–958. [Google Scholar] [CrossRef] [Scilit] [PubMed]
- Bertsch, K.; Schmidinger, I.; Neumann, I.D.; Herpertz, S.C. Reduced Plasma Oxytocin Levels in Female Patients with Borderline Personality Disorder. Horm. Behav. 2013, 63, 424–429. [Google Scholar] [CrossRef] [Scilit] [PubMed]
- Mielke, E.L.; Neukel, C.; Bertsch, K.; Reck, C.; Möhler, E.; Herpertz, S.C. Alterations of Brain Volumes in Women with Early Life Maltreatment and Their Associations with Oxytocin. Horm. Behav. 2018, 97, 128–136. [Google Scholar] [CrossRef] [Scilit] [PubMed]
- Mielke, E.L.; Koenig, J.; Herpertz, S.C.; Steinmann, S.; Neukel, C.; Kilavuz, P.; van der Venne, P.; Bertsch, K.; Kaess, M. Adverse Childhood Experiences Mediate the Negative Association between Borderline Personality Disorder Symptoms and Plasma Oxytocin. Prog. Neuro-Psychopharmacol. Biol. Psychiatry 2023, 125, 110749. [Google Scholar] [CrossRef] [Scilit] [PubMed]
- Quintana, D.S.; Guastella, A.J. An Allostatic Theory of Oxytocin. Trends Cogn. Sci. 2020, 24, 515–528. [Google Scholar] [CrossRef] [Scilit] [PubMed]
- Jin, Y.; Song, D.; Yan, Y.; Quan, Z.; Qing, H. The Role of Oxytocin in Early-Life-Stress-Related Neuropsychiatric Disorders. Int. J. Mol. Sci. 2023, 24, 10430. [Google Scholar] [CrossRef] [Scilit] [PubMed]
- Harvey, B.H.; Regenass, W.; Dreyer, W.; Möller, M. Social Isolation Rearing-Induced Anxiety and Response to Agomelatine in Male and Female Rats: Role of Corticosterone, Oxytocin, and Vasopressin. J. Psychopharmacol. 2019, 33, 640–646. [Google Scholar] [CrossRef] [Scilit] [PubMed]
- Municchi, D.; Mancini, C.; Nutarelli, S.; Tiberi, M.; D’Addario, S.L.; Chilà, G.; Passeri, A.; Massa, G.; Segni, M.D.; Babicola, L.; et al. The Oxytocin System Mediates Behavioral and Neurobiological Alterations Associated with Early Adversity. Mol. Psychiatry 2025, 31, 3070–3083. [Google Scholar] [CrossRef] [Scilit] [PubMed]
- Riveros-Barrera, I.; Dueñas, Z. Maternal Separation during Nursing Alters Basal Neuroendocrine Levels in Juvenile and Adult Rats. Biomed. Rev. Inst. Nac. Salud 2016, 36, 67–77. [Google Scholar] [CrossRef] [Scilit] [PubMed]
- Zhang, Y.; Chen, H.; Cao, J.; Gao, L.; Jing, Y. Maternal Separation Alters Peripheral Immune Responses Associated with IFN-γ and OT in Mice. Peptides 2024, 182, 171318. [Google Scholar] [CrossRef] [Scilit] [PubMed]
- Gualtierotti, R. Bridging the Gap: Time to Integrate Sex and Gender Differences into Research and Clinical Practice for Improved Health Outcomes. Eur. J. Intern. Med. 2025, 134, 9–16. [Google Scholar] [CrossRef] [Scilit] [PubMed]
- Farrukh, F.; Becker, R.C. Sex as a Biological Variable: A Contemporary Perspective. Am. Heart J. 2025, 287, 10–15. [Google Scholar] [CrossRef] [Scilit] [PubMed]
- Dalla, C.; Jaric, I.; Pavlidi, P.; Hodes, G.E.; Kokras, N.; Bespalov, A.; Kas, M.J.; Steckler, T.; Kabbaj, M.; Würbel, H.; et al. Practical Solutions for Including Sex As a Biological Variable (SABV) in Preclinical Neuropsychopharmacological Research. J. Neurosci. Methods 2024, 401, 110003. [Google Scholar] [CrossRef] [Scilit] [PubMed]
- Goh, K.K.; Lu, M.L.; Jou, S. Childhood Trauma and Aggression in Persons Convicted for Homicide: An Exploratory Study Examines the Role of Plasma Oxytocin. Front. Psychiatry 2021, 12, 719282. [Google Scholar] [CrossRef] [Scilit] [PubMed]
- Kartal, F.; Uğur, K.; Mete, B.; Demirkol, M.E.; Tamam, L. The Relationship Between the Oxytocin Level and Rejection Sensitivity, Childhood Traumas, and Attachment Styles in Borderline Personality Disorder. Psychiatry Investig. 2022, 19, 239–246. [Google Scholar] [CrossRef] [Scilit] [PubMed]
- Boccia, M.L.; Cook, C.; Marson, L.; Pedersen, C. Parental Divorce in Childhood Is Related to Lower Urinary Oxytocin Concentrations in Adulthood. J. Comp. Psychol. 2021, 135, 74–81. [Google Scholar] [CrossRef] [Scilit] [PubMed]
- Crowley, S.K.; Pedersen, C.A.; Leserman, J.; Girdler, S.S. The Influence of Early Life Sexual Abuse on Oxytocin Concentrations and Premenstrual Symptomatology in Women with a Menstrually Related Mood Disorder. Biol. Psychol. 2015, 109, 1–9. [Google Scholar] [CrossRef] [Scilit] [PubMed]
- Mohiyeddini, C.; Opacka-Juffry, J.; Gross, J.J. Emotional Suppression Explains the Link between Early Life Stress and Plasma Oxytocin. Anxiety Stress Coping 2014, 27, 466–475. [Google Scholar] [CrossRef] [Scilit] [PubMed]
- Bhandari, R.; Bakermans-Kranenburg, M.J.; van der Veen, R.; Parsons, C.E.; Young, K.S.; Grewen, K.M.; Stein, A.; Kringelbach, M.L.; van IJzendoorn, M.H. Salivary Oxytocin Mediates the Association between Emotional Maltreatment and Responses to Emotional Infant Faces. Physiol. Behav. 2014, 131, 123–128. [Google Scholar] [CrossRef] [Scilit] [PubMed]
- Chen, Y.-J.; Lu, M.-L.; Chiu, Y.-H.; Chen, C.; Santos, V.H.J.; Goh, K.K. Linking Childhood Trauma to the Psychopathology of Schizophrenia: The Role of Oxytocin. Schizophr 2024, 10, 24. [Google Scholar] [CrossRef] [Scilit] [PubMed]
- Gerra, L.M.; Gerra, G.; Mercolini, L.; Manfredini, M.; Somaini, L.; Pieri, C.M.; Antonioni, M.; Protti, M.; Ossola, P.; Marchesi, C. Increased Oxytocin Levels among Abstinent Heroin Addicts: Association with Aggressiveness, Psychiatric Symptoms and Perceived Childhood Neglect. Prog. Neuro-Psychopharmacol. Biol. Psychiatry 2017, 75, 70–76. [Google Scholar] [CrossRef] [Scilit] [PubMed]
- Ellis, B.J.; Horn, A.J.; Carter, C.S.; van IJzendoorn, M.H.; Bakermans-Kranenburg, M.J. Developmental Programming of Oxytocin through Variation in Early-Life Stress: Four Meta-Analyses and a Theoretical Reinterpretation. Clin. Psychol. Rev. 2021, 86, 101985. [Google Scholar] [CrossRef] [Scilit] [PubMed]
- Marazziti, D.; Baroni, S.; Mucci, F.; Piccinni, A.; Moroni, I.; Giannaccini, G.; Carmassi, C.; Massimetti, E.; Dell’Osso, L. Sex-Related Differences in Plasma Oxytocin Levels in Humans. Clin. Pract. Epidemiol. Ment. Health CP EMH 2019, 15, 58–63. [Google Scholar] [CrossRef] [Scilit] [PubMed]
- Kuppusamy, T.; Ramaswamy, P.; Perumal, M.; Silambanan, S.; Prabu Kumar, A. A Short Note on Oxytocin and Stress Attenuation. Bioinformation 2021, 17, 921–923. [Google Scholar] [CrossRef] [Scilit] [PubMed]
- Althammer, F.; Jirikowski, G.; Grinevich, V. The Oxytocin System of Mice and Men-Similarities and Discrepancies of Oxytocinergic Modulation in Rodents and Primates. Peptides 2018, 109, 1–8. [Google Scholar] [CrossRef] [Scilit] [PubMed]
- Page, M.J.; McKenzie, J.E.; Bossuyt, P.M.; Boutron, I.; Hoffmann, T.C.; Mulrow, C.D.; Shamseer, L.; Tetzlaff, J.M.; Akl, E.A.; Brennan, S.E.; et al. The PRISMA 2020 Statement: An Updated Guideline for Reporting Systematic Reviews. MetaArXiv 2020. [Google Scholar] [CrossRef] [Scilit]

Disclaimer/Publisher’s Note: The statements, opinions and data contained in all publications are solely those of the individual author(s) and contributor(s) and not of MDPI and/or the editor(s). MDPI and/or the editor(s) disclaim responsibility for any injury to people or property resulting from any ideas, methods, instructions or products referred to in the content. |
© 2026 by the authors. Published by MDPI on behalf of the Swiss Federation of Clinical Neuro-Societies. Licensee MDPI, Basel, Switzerland. This article is an open access article distributed under the terms and conditions of the Creative Commons Attribution (CC BY) license.