
Article

Neuroimaging Correlates of the NIH Toolbox Cognition and Trail Making Tests: Normative Benchmarks in Healthy Aging

1
Department of Radiology, Affiliated Hospital of Nanjing University of Chinese Medicine, Jiangsu Province Hospital of Chinese Medicine, Nanjing 210029, China
2
Department of Radiology and Biomedical Imaging, Yale School of Medicine, New Haven, CT 06520, USA
3
Developing Brain Institute, Children’s National, Washington, DC 20010, USA
4
Social Neuroscience Laboratory, Department of Psychiatry and Psychotherapy, University of Lübeck, 23562 Lübeck, Germany
5
Department of Radiology, NewYork-Presbyterian Hospital at Columbia University Irving Medical Center, Columbia University, New York, NY 10032, USA
*
Author to whom correspondence should be addressed.
Clin. Transl. Neurosci. 2026, 10(1), 5; https://doi.org/10.3390/ctn10010005
Submission received: 11 December 2025 / Revised: 27 January 2026 / Accepted: 28 January 2026 / Published: 3 February 2026

Abstract

The National Institutes of Health (NIH) Toolbox cognition battery and Trail Making Tests (TMT) are widely used to quantify cognitive aging and to detect early cognitive vulnerability in Alzheimer’s disease and related conditions. However, these tests are often treated as interchangeable markers of global cognition, despite likely differences in their dependence on specific brain systems, limiting interpretability across studies and clinical contexts. To address this gap, we examined associations between four commonly used cognitive measures—fluid cognition, crystallized cognition, TMT-A, and TMT-B—and multimodal MRI metrics in 725 healthy volunteers aged 36 to 100 years from the Human Connectome Project–Aging. Voxel-wise diffusion MRI and vertex-wise cortical thickness and volume analyses were adjusted for age, sex, and years of education. Higher crystallized and fluid cognition scores and faster TMT-A/B completion times were generally associated with greater white matter integrity. TMT-B showed the most extensive diffusion and cortical associations, involving major projection, commissural, and association pathways and frontoparietal and temporo-occipital cortices. TMT-A and crystallized cognition demonstrated intermediate, overlapping patterns, whereas fluid cognition showed only focal brainstem and limited cortical correlates. These findings demonstrate systematic differences in the neuroanatomical substrates underlying commonly used cognitive tests and provide normative structure–cognition reference maps that can improve test selection, mechanistic interpretation, and sensitivity to brain health in studies of aging, vascular risk, and preclinical neurodegenerative disease.

1. Introduction

Cognitive performance in adulthood and aging reflects the integrity of distributed neural systems [1,2], yet different cognitive domains vary markedly in how strongly they depend on the underlying brain structure [3]. This variability has important implications for aging research, where subtle declines in processing speed, executive function, and cognitive flexibility often precede memory impairment and can signal early neurocognitive vulnerability [4]. Identifying which cognitive tests most closely track brain morphology and microstructural integrity is therefore essential for interpreting cognition-MRI relationships in healthy adults and for selecting sensitive measures in studies of aging and preclinical neurodegenerative disease.
The National Institutes of Health (NIH) Toolbox provides harmonized cognitive assessments widely used across large cohort studies and clinical research [5]. Its two primary composite scores are fluid and crystallized cognition. These scores capture distinct cognitive constructs with different developmental and aging trajectories. Fluid cognition reflects novel problem solving, working memory, and processing efficiency, typically peaking in early adulthood before declining with age [6]. In contrast, crystallized cognition reflects accumulated knowledge, vocabulary, and semantic memory, and remains relatively stable or increases across the lifespan [7]. Although these composites are increasingly used in aging and Alzheimer’s disease research [8,9], their precise correlations with underlying structural brain integrity in healthy adult remains poorly defined.
In addition, executive measures such as the Trail Making Test (TMT) A and B offer complementary information that may be more sensitive to morphological and microstructural changes. TMT-A primarily assesses processing speed and visual attention [10], whereas TMT-B additionally requires cognitive flexibility and task-switching [11], functions heavily dependent on long range white matter pathways and frontoparietal cortical networks [12,13]. Importantly, TMT-B performance is a robust predictor of cognitive decline and is frequently used in studies of mild cognitive impairment and Alzheimer’s disease [14,15]. However, despite their widespread use in aging and neurodegenerative research, the normative structural brain characteristics and neuronal pathways supporting NIH Toolbox cognition and TMT performance across healthy adulthood have not been comprehensively characterized.
Because these cognitive measures are widely used in aging and Alzheimer’s disease research [14,15], establishing their normative structural correlates in healthy adults is essential for interpreting deviations observed in clinical and preclinical neurodegenerative cohorts. Yet, prior work has not directly compared the structural brain correlates of fluid cognition, crystallized cognition, TMT-A, and TMT-B using whole-brain voxel-wise diffusion imaging and cortical morphometry within a single large, demographically representative cohort.
In this study, we investigated how four widely used cognitive measures: fluid cognition, crystallized cognition, TMT-A, and TMT-B map onto white matter microstructure and cortical morphology in 725 healthy adults aged 36 to 100 years from the Human Connectome Project Aging. We hypothesized that cognitive tests differ substantially in their dependence on underlying structural integrity, with more complex executive functions requiring broader and more integrated neural networks. By establishing a multimodal structural baseline of cognition across adulthood, our goal was to provide normative benchmarks that can guide the selection and interpretation of cognitive measures in aging research and in studies investigating early neurodegenerative change.

2. Materials and Methods

2.1. Participants

In our study, we used the Human Connectome Project (HCP) dataset release, previously described by Bookheimer et al. (2019) [16] and accessible through the following link (https://www.humanconnectome.org/ accessed on 27 January 2026). HCP participants were recruited from four representative US sites: Washington University at St. Louis, the University of Minnesota, Massachusetts General Hospital, and the University of California, Los Angeles. The dataset included 725 individuals aged 36–100 years old from the HCP database. The research team excluded any individual with a neurodevelopmental, neuropsychiatric, or neurological disorder history. We focused our analysis on subjects who underwent neuroradiologic examination and neuropsychological tests, including the NIH Toolbox composite scores and the TMT-A and -B. Any subjects who had corrupted metadata, any missing imaging information, or those who failed the imaging processing pipeline were also excluded from our analysis. Demographic variables such as age, sex, and years of education were included as covariates in our models. The analysis included these variables to adjust for potential confounding effects on white matter microstructure and morphological changes. All participants analyzed provided informed consent before participation in this study. In addition, all experimental procedures were approved by the institutional review board.

2.2. Neurocognitive Tests

The NIH Toolbox Composite scores assess multiple cognitive domains, including executive function, episodic memory, language, processing speed, working memory, and attention, providing a comprehensive measure of overall cognition across the lifespan [17]. Our analysis utilized the unadjusted fluid cognition (FC) Composite score, with a focus on executive function, and the unadjusted crystallized cognition (CC) Composite score, with an emphasis on language function [18]. We also analyzed the Trail Making Test [19,20], which measures multiple executive functions, such as processing speed and working memory. TMT-A primarily represents processing speed and visual attention [10], whereas TMT-B specifically assesses aspects of cognitive set-shifting [21]. Generally, higher scores on the NIH Toolbox Cognition Battery represent better cognitive performance. On the other hand, higher scores on the TMT-A and -B indicate a longer completion time, reflecting poorer performance [18]. All these scores have demonstrated strong test–retest and interrater reliabilities [22,23].

2.3. Neuroimaging Protocol

Structural and diffusion-weighted images of subjects were acquired on a Siemens 3T scanner using a 32-channel head coil (https://www.humanconnectome.org/hcp-protocols-ya-3t-imaging, accessed on 27 January 2026). For structural imaging, T1W acquisitions were achieved with magnetization-prepared rapid gradient-echo (MPRAGE) sequence in sagittal orientation (repetition time = 2400 ms, echo time = 2.14 ms, TI = 1000 ms, flip angle = 8°, field of view = 224 × 224 mm2, in-plane matrix = 320 × 320, slice thickness = 0.7 mm, number of slices = 256, voxel size = 0.7 × 0.7 × 0.7 mm3). The acquisition time was 7 min and 40 s.
The diffusion-weighted images covering the whole brain were obtained using a spin echo-based echo planar imaging sequence. A full diffusion MRI session included 4 runs, including 2 runs for 98 diffusion weighting directions (gradient table: dir98) and 2 runs for 99 diffusion weighting directions (gradient table: dir99), and each run was acquired once using either anterior-to-posterior (AP) or posterior-to-anterior (PA) phase encoding polarity. Each gradient table includes 6 b = 0 acquisitions interspersed throughout each run. Diffusion weighting consisted of 3 shells of b = 1000, 2000, and 3000 s/mm2 interspersed with an approximately equal number of acquisitions on each shell within each run (repetition time = 5520 ms, echo time = 89.5 ms, flip angle = 78°, field of view = 210 × 180 mm2, in-plane matrix = 168 × 144, slice thickness = 1.25 mm, number of slices = 111, voxel size = 1.25 × 1.25 × 1.25 mm3). Each run needs approximately 9 min and 50 s.

2.4. Neuroimaging—Diffusion Metrics

All diffusion-MRI (dMRI) scans were preprocessed using the FSL package version 6.0.5 (FMRIB, Oxford, UK). For each subject, diffusion-weighted images with 98 gradient directions were acquired in two phase-encode directions (AP and PA) with opposite polarities. These were then merged to retain SNR benefits and to reduce susceptibility distortions. Non-diffusion-weighted b0 images (b = 0 s/mm2) were extracted in a single file and corrected for susceptibility distortions by FSL-topup. FSL-BET [24] was used to remove non-brain tissue and to create a binary mask. Then all the diffusion data was corrected for eddy current distortions using FSL-eddy [25]. This allowed for slice-wise outlier detection and replacement, as well as slice-to-volume registration. FSL-DTIFIT was used to fit a diffusion tensor model at each voxel, reconstructing diffusion tensors and calculating traditional DTI metric maps, including Fractional Anisotropy (FA) and Mean Diffusivity (MD), for subsequent microstructural analysis.
We applied Neurite Orientation Dispersion and Density Imaging (NODDI) multi-compartment models [26], on multi-shell diffusion MRIs to determine the intra-neurite, extra-neurite and free water components. We used accelerated microstructure imaging via a convex optimization tool (dmri-amico 2.0.1) based on Python 3.10.8 with b0_thr = 100 to derive three key NODDI indices of neural tissue at each voxel. The three indices derived were the neurite density (ND) index, reflecting the density of axons or dendrites, the orientation dispersion (OD) index, which establishes the orientation coherence of neurites, and the free water fraction (FWF), which measures the extent of CSF contamination. Excluding those cases of raw data corruption, five DTI indices, FA, MD, ND, OD, and FWF were calculated for a total of 624 subjects.

2.5. Neuroimaging—Structural Metrics

All the T1-weighted images were preprocessed in the FreeSurfer v6.0.0 package. Using recon-all, for each participant, a two-dimensional cortical surface from a three-dimensional volume was reconstructed in vertex-wise level, and the volume of the cortex was parcellated according to the Destrieux atlas and calculated in Region-of-Interest (ROI)-based level. Besides 74 left and 74 right ROI-based cortical surfaces, the volumes of 45 sub-cortical structures and 70 white matters were collected from the stats file for each participant after parcellation and segmentation by FreeSurfer as well.

2.6. Tract-Based Spatial Statistics (TBSS)

TBSS was used to improve the sensitivity, objectivity and interpretability of our multi-subject diffusion imaging studies analysis. First, all participants’ FA data was nonlinearly aligned to a standard template space (FMRIB58_FA) to create the mean FA skeleton at a threshold value of > 0.2. Afterwards, each participant’s FA data was projected onto the mean FA skeleton, which represented the centers of all tracts common to the group. Similarly, TBSS was also performed for all other diffusion-derived data, including MD, ND, OD and FWF. Finally, a general linear model was built with each cognition index as the independent factor, and with age, gender and years of education as covariates. Voxel-wise statistical analysis of white matter skeleton was conducted with permutation-based nonparametric inference using Randomize (https://fsl.fmrib.ox.ac.uk/fsl/fslwiki/Randomise/UserGuide, accessed on 27 January 2026) to assess the association between 4 cognitive performance tests (including CC, FC, TMTA and TMTB) and our 5 diffusion indices (including FA, MD, ND, OD and FWF). Threshold Free Cluster Enhancement (TFCE) [27] was used to correct for multiple comparisons across the whole brain (p < 0.05).

2.7. Morphological Measurement Analysis

Linear regression analysis of vertex-wise cortical surfaces for each cognitive performance was performed in FreeSurfer, using age, sex and years of education as covariates. Cluster correction was conducted at a threshold of p < 0.05 in both positive and negative directions. Furthermore, we ran a simple linear regression, with age, sex, years of education and total intracranial volume as covariates to observe the correlation between volume ROIs of different brain structures and different cognitive performances. Those ROIs of volume with a p < 0.05 after correction by False Discovery Rate (FDR) were retained.

2.8. Correlation Analysis Between Morphological Measurement and Diffusion Indices

To explore the associations between fiber pathways microstructure and morphological metrics related to cognitive tests, we determined the correlation between diffusion metrics of white matter tracts and the volumes of different cortical and subcortical gray matter regions, applying FDR correction for multiple comparisons. For DTI metrics, we overlaid 50 tracts from the Johns Hopkins University’s white matter atlas (“JHU-ICBM-DTI-81”) onto each subject’s native diffusion maps in FSL and extracted the mean signal intensity. Morphological measures were obtained using FreeSurfer to calculate the volumes of cortical and subcortical regions. Afterwards, we determined the Pearson’s correlation between these average diffusion metrics from white matter tracts and volumes of cortical and subcortical regions, correcting the p values for multiple comparisons by FDR. In addition, we performed multivariable regression to identify the tract-based diffusion metrics and regional volumes independently associated with each cognitive metric, adjusting for age, sex, and years of education.

3. Results

3.1. Demographic Characteristics

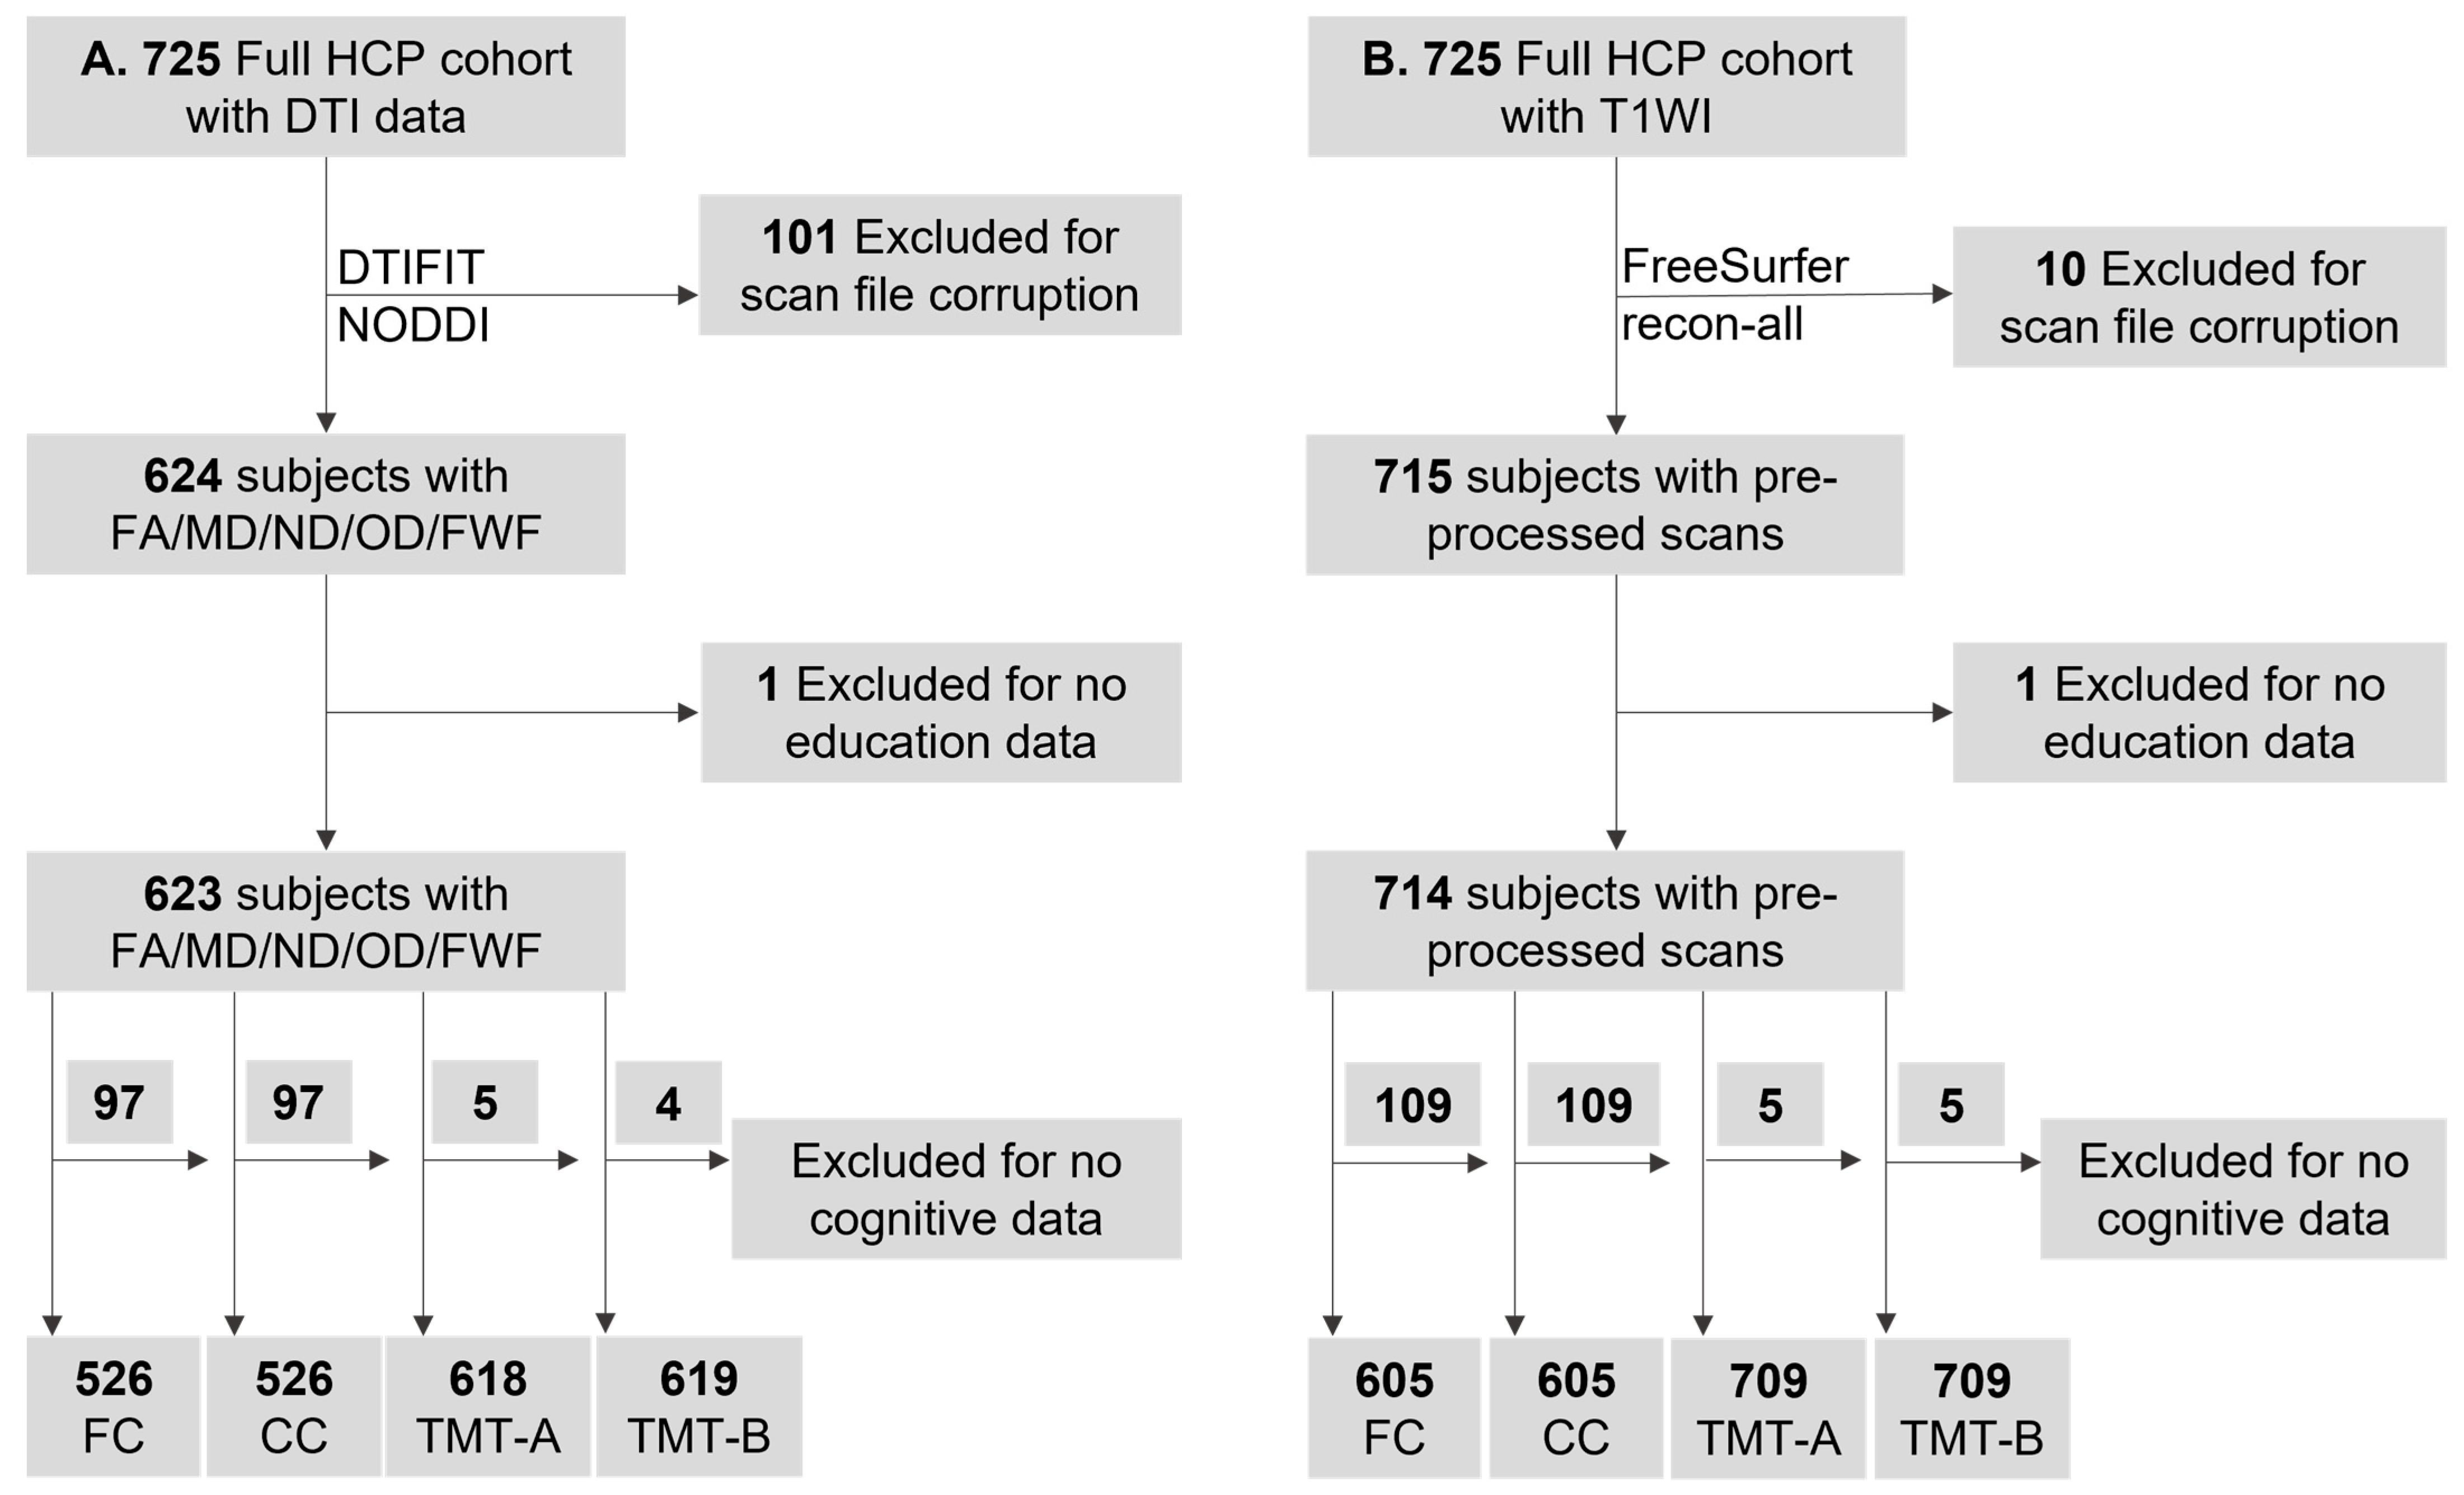
Table 1 summarizes the demographic characteristics of all 725 subjects in HCP. From HCP study participants, 526 to 709 subjects were included in our analyses. Figure 1 shows the flowcharts for the inclusion of subjects in the analysis of diffusion and morphological neuroimaging metrics. Each participant in the dataset underwent two diffusion MRI acquisitions (dir_98 with 98 diffusion directions and dir_99 with 99 diffusion directions). We initially processed both sets of scans using DTIFIT and NODDI pipelines. Due to corrupted or incomplete files, diffusion processing was successful in 624 participants for the dir_98 acquisition and in 578 participants for the dir_99 acquisition. To maximize sample size and ensure consistency across analyses, all diffusion MRI analyses were therefore performed using the dir_98 dataset, yielding a final diffusion MRI sample of 624 participants for our analysis. Supplementary Table S1 provides details of demographics in subgroups used in each imaging modality analysis.

3.2. White Matter Microstructural Correlates of Cognitive Metrics

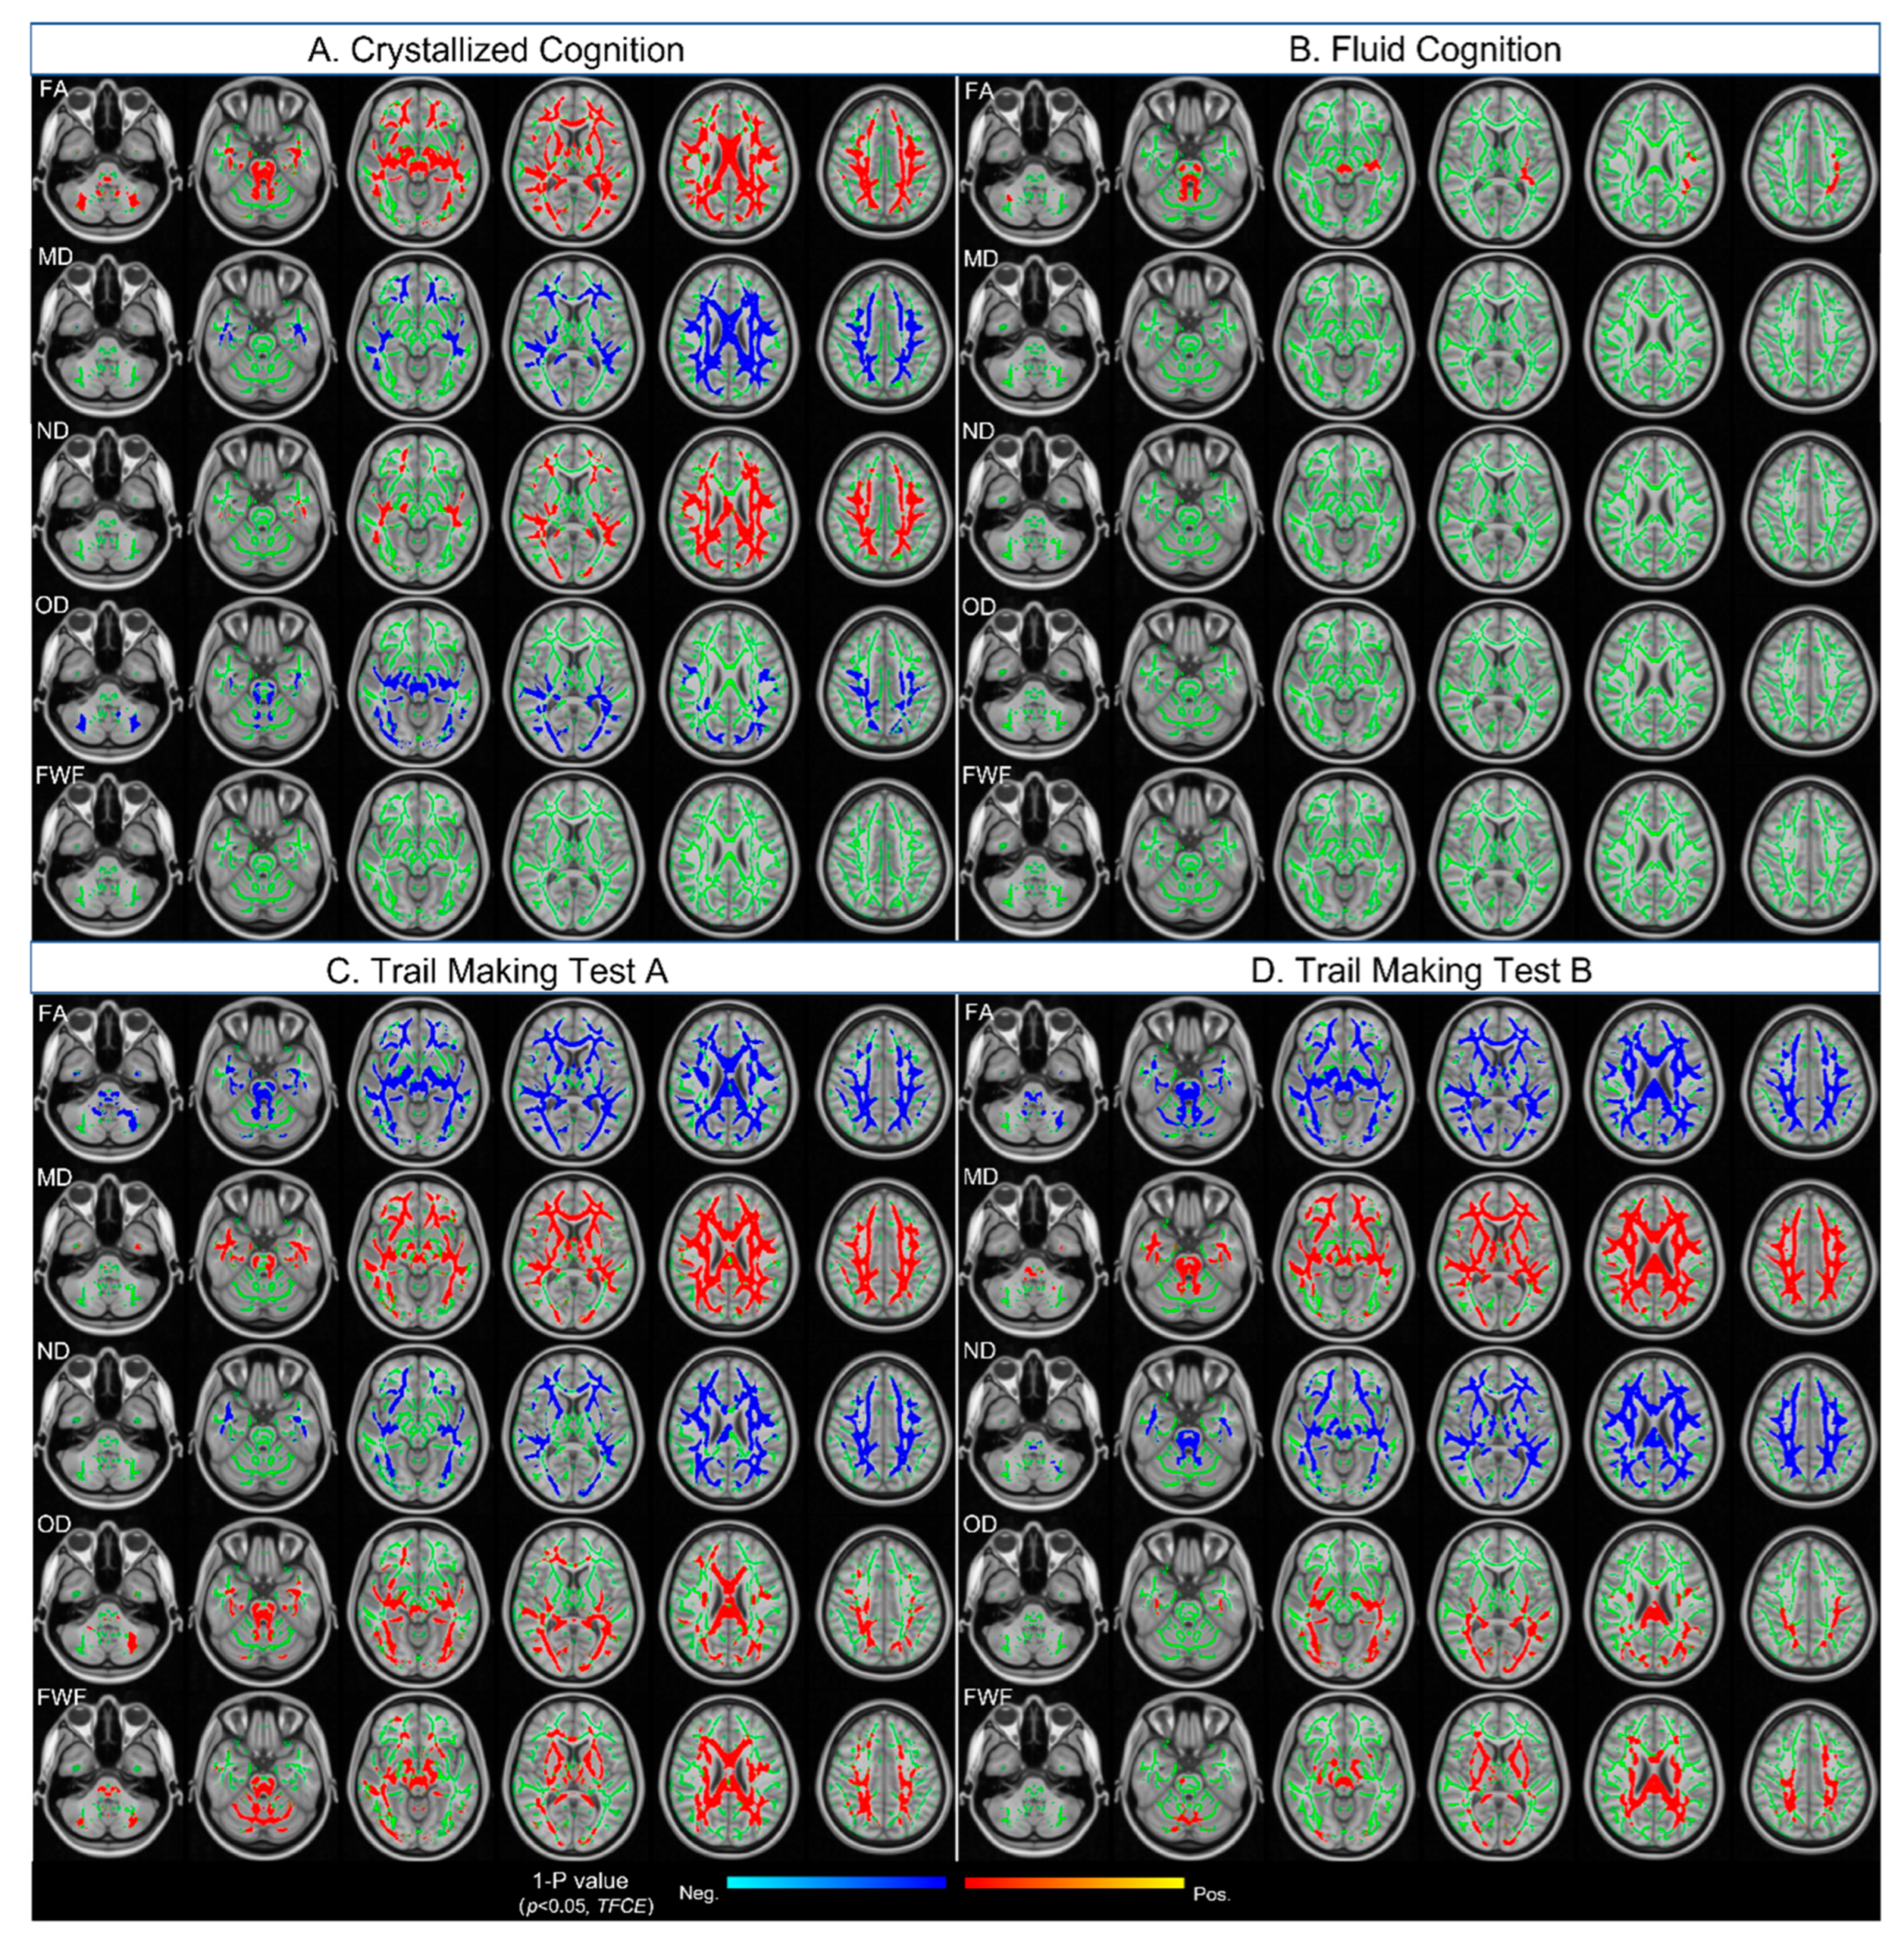
As shown in Figure 2, overall higher scores in crystallized and fluid cognition and lower scores in TMT-A and -B were associated with higher FA and ND but lower MD, FWF and OD, representing greater white matter microstructural integrity. Table 2 lists the top 14 white matter tracts and related diffusion metrics that were significantly associated with the four cognitive tests, after adjusting for age, sex and years of education as covariates.
Crystallized cognition was associated with microstructural integrity of projection tracts in the (anterior, superior, and posterior) corona radiata, posterior thalamic radiation, and middle cerebellar peduncle. There was also an association with microstructural integrity of commissural tracts in the (genu, body, and splenium of) corpus callosum and association tracts in the superior longitudinal fasciculus (Figure 2A, Table 2a).
Fluid cognition was associated with higher FA in projection tracts of the cerebral peduncles, medial lemniscus, and superior cerebellar peduncle, as well as association tracts of the left superior longitudinal fasciculus (Figure 2B, Table 2b).
TMT-A test was associated with the microstructural integrity of projection tracts in the (anterior, superior, and posterior) corona radiata, the posterior thalamic radiation, and the middle cerebellar peduncle. There was also an association with microstructural integrity of commissural tracts in the (genu, body, and splenium of) the corpus callosum, as well as association tracts in the superior longitudinal fasciculus. Compared to crystallized cognition, a higher number of diffusion metrics per white matter tracts showed a significant relationship with the TMT-A test (Figure 2C, Table 2c).
TMT-B test was associated with microstructural integrity of projection tracts in the (anterior, superior, and posterior) corona radiata, (anterior and posterior) limbs of internal capsule, external capsule, and middle cerebellar peduncle. There was also an association with microstructural integrity of commissural tracts in the (genu, body, and splenium of) the corpus callosum as well as association tracts in the superior longitudinal fasciculus (Figure 2D, Table 2d).

3.3. Morphological Correlates of Cognitive Metrics

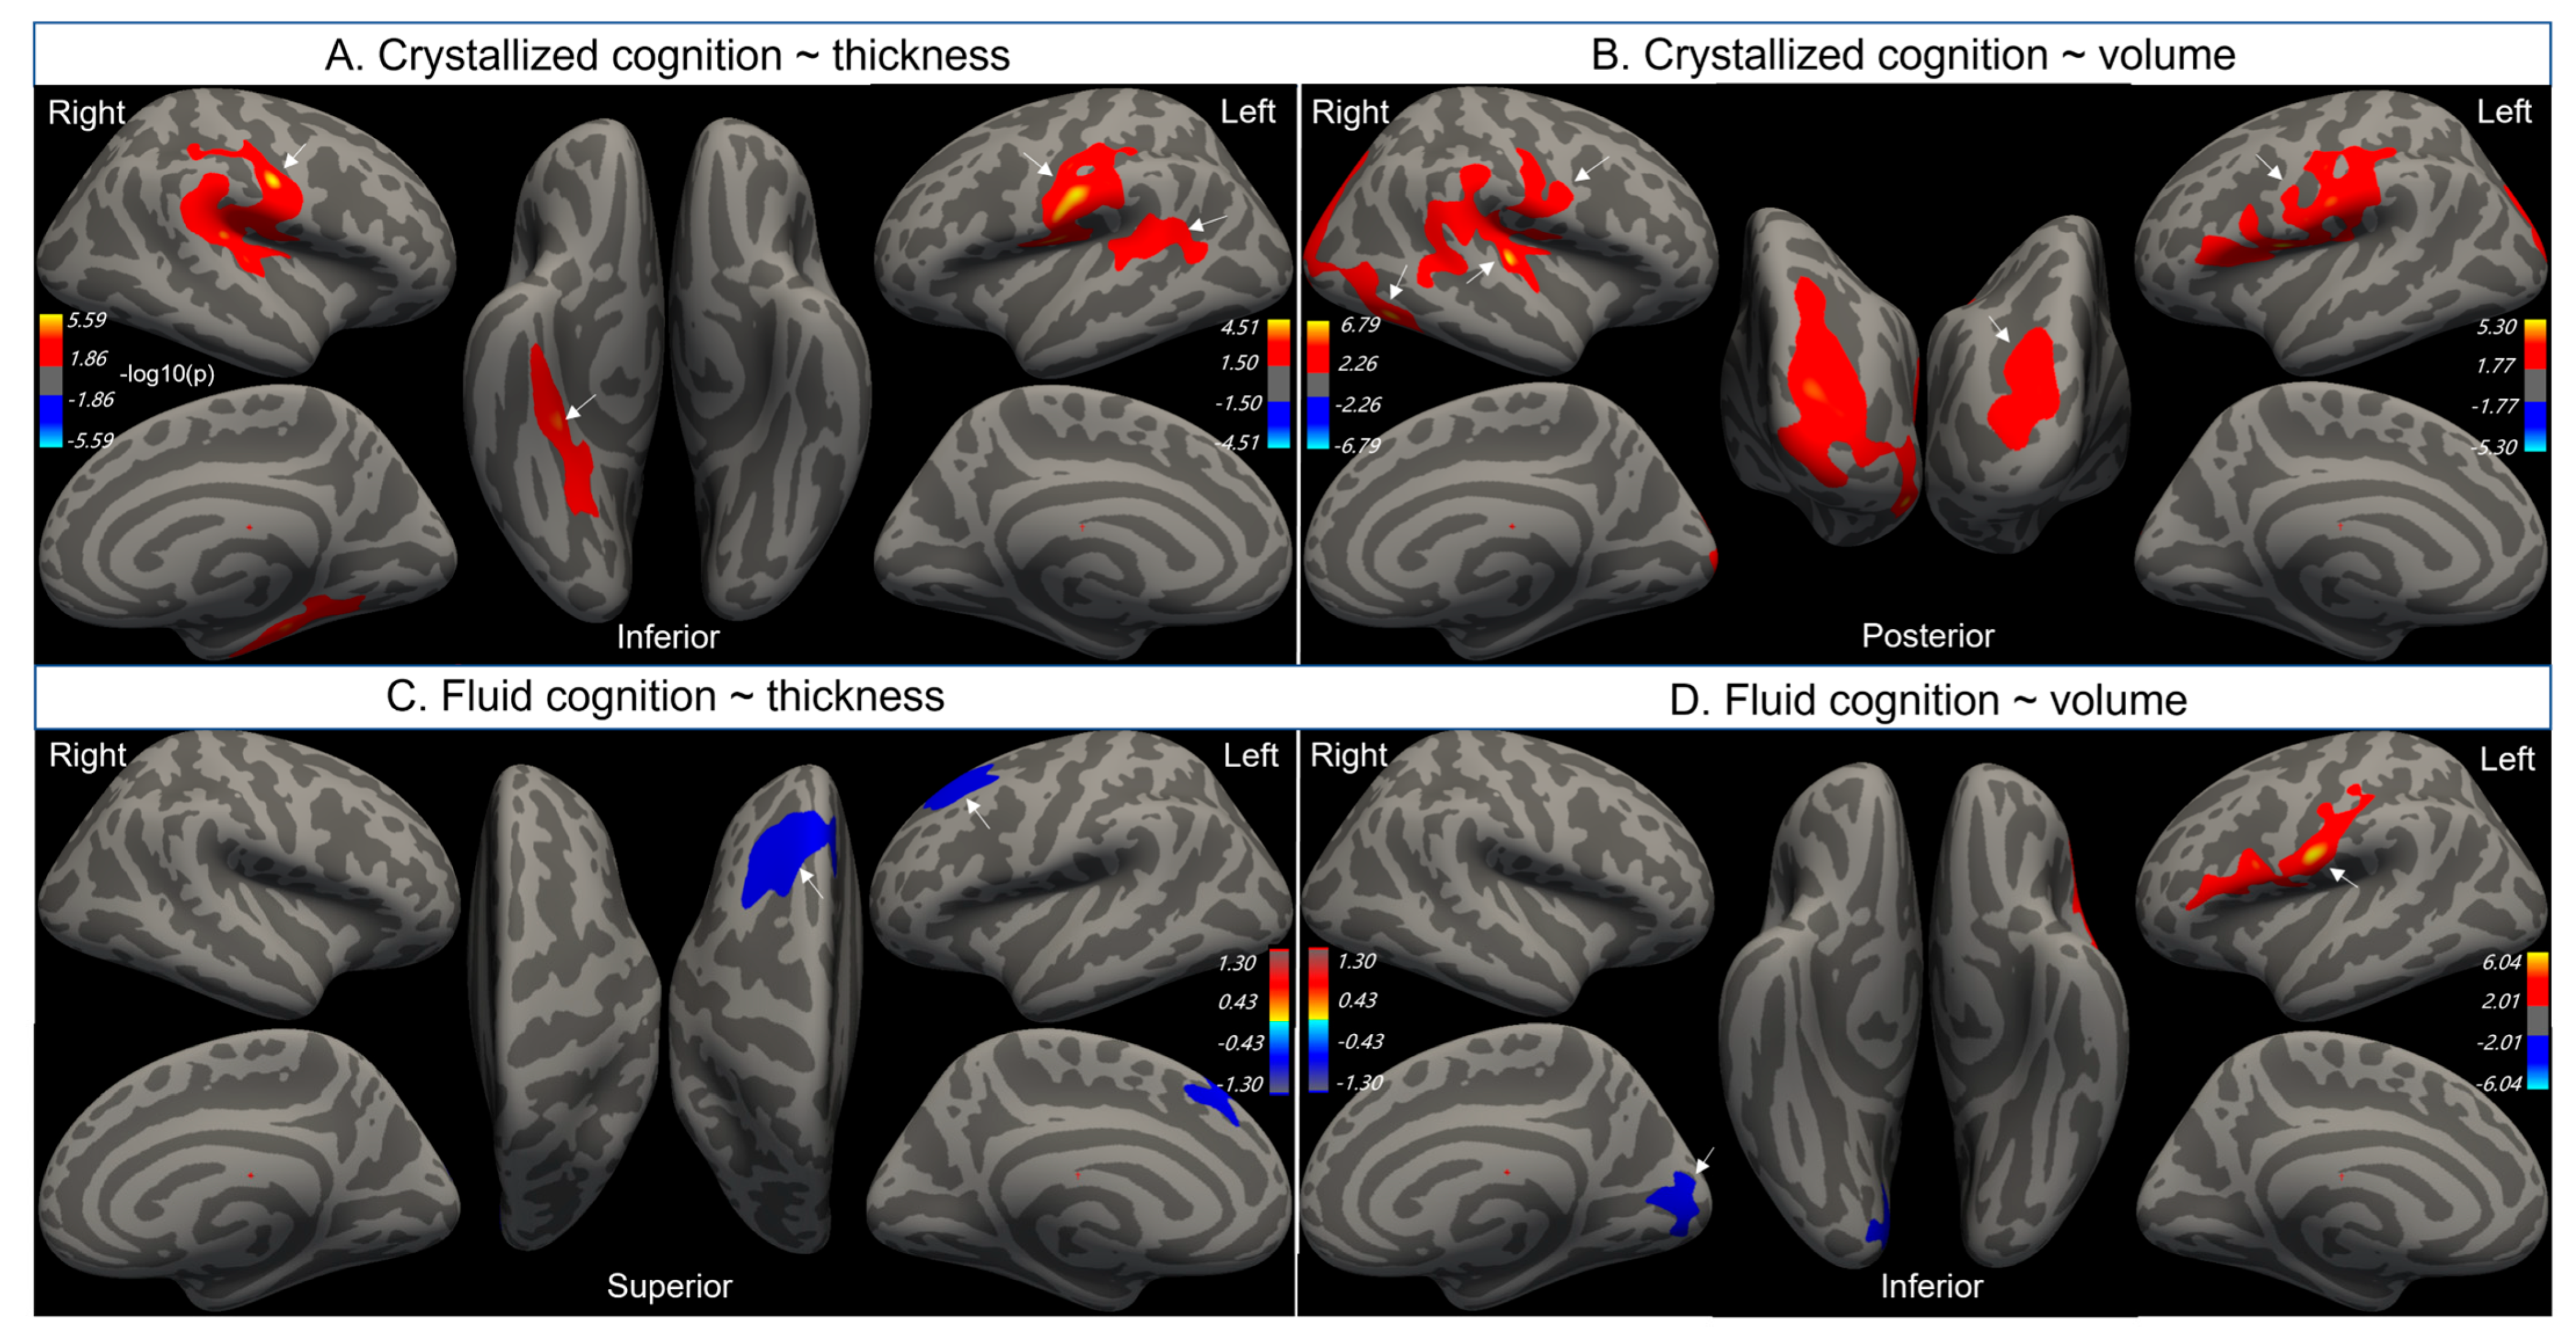
Figure 3 shows the results of our vertex-wise analysis of cortical thickness and volume in relation to target cognitive tests. The results were adjusted for age, sex and years of education as covariates. Table 3 lists the corresponding cortical gyri, the cluster coordinate and extent found in the vertex-wise analysis.
Crystallized cognition was associated with larger precentral gyri and thicker postcentral gyri, inferiorly, in both hemispheres (Figure 3A,B, Table 3a). The inferior pre- and post-central gyri represent the primary motor and somatosensory cortex of the face and tongue, respectively. In addition, crystallized cognition was associated with larger left lateral occipital, right inferior temporal and right transverse temporal gyri, as well as with thicker left supramarginal and right parahippocampal gyri. The transverse temporal (Heschl’s) and supramarginal gyri are implicated in auditory and language processing, respectively. Meanwhile, the lateral occipital and inferior temporal gyri are both involved in visual object recognition tasks.
Fluid cognition was associated with a larger inferior left postcentral gyrus and a smaller right lingual and left superior frontal gyri (Figure 3C,D, Table 3b). The lingual gyrus is implicated in visual function, while the superior frontal gyrus is involved in working memory and executive control [28].
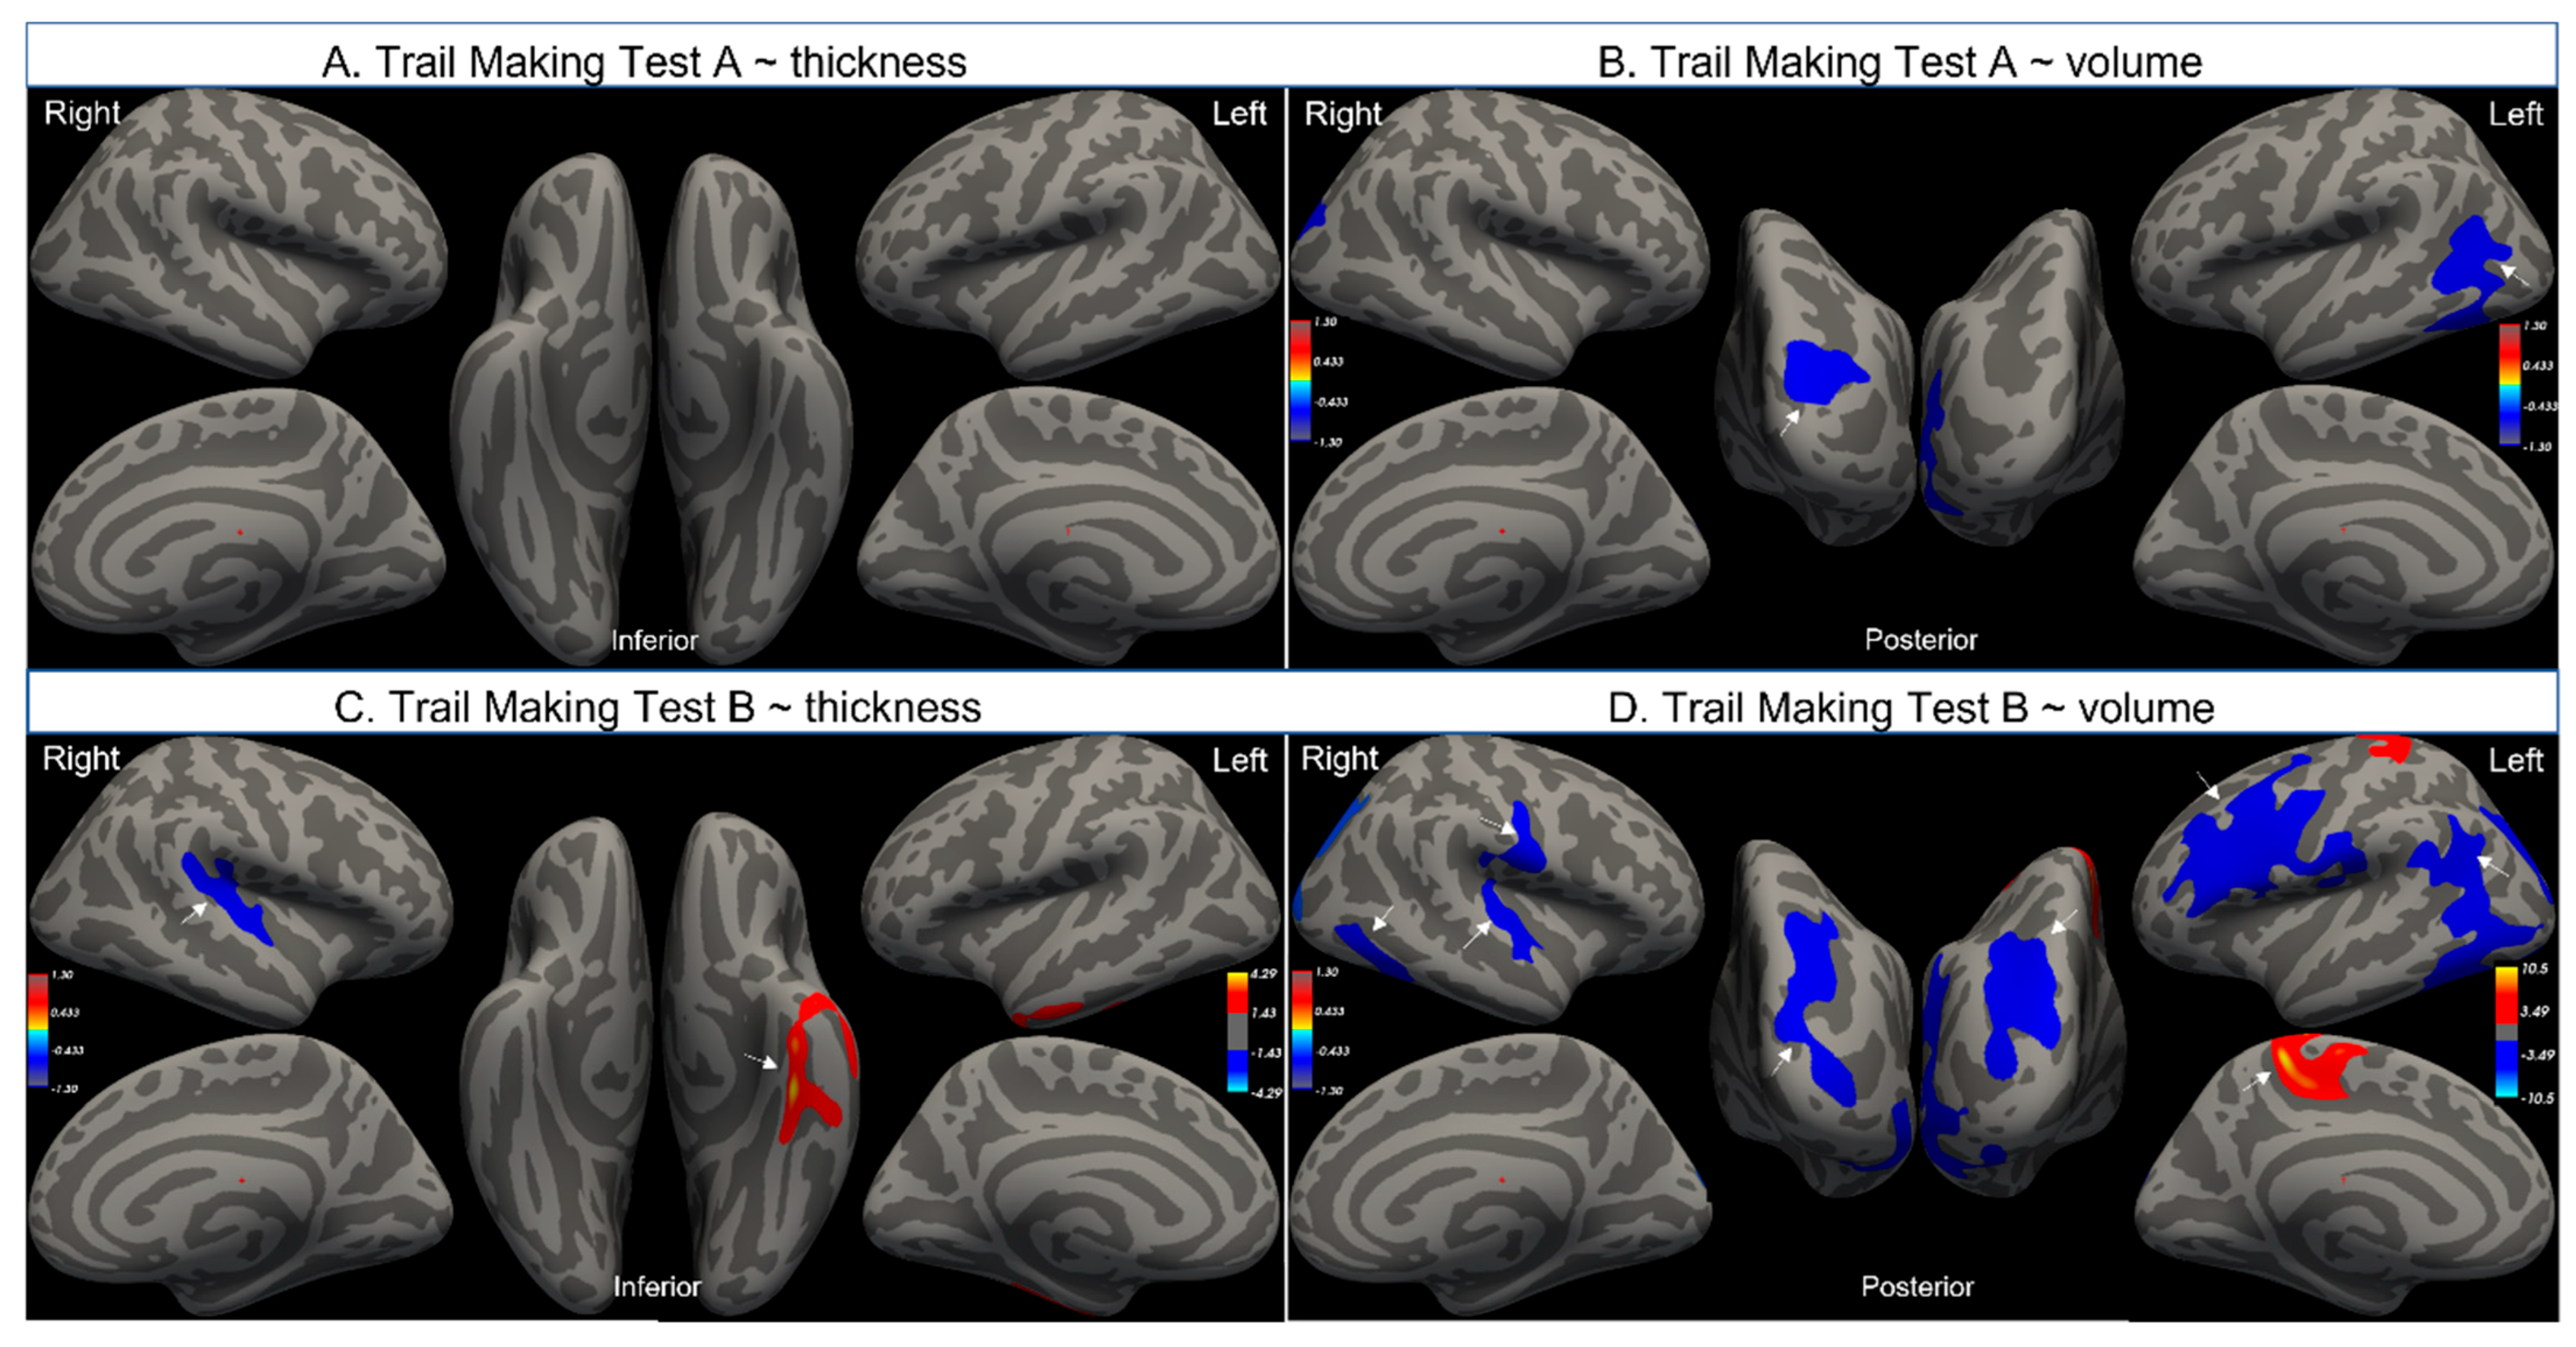
Higher TMT-A scores (worse performance) were associated with a smaller left inferior parietal lobule and right lateral occipital gyrus (Figure 4A,B, Table 3c). The inferior parietal lobule is implicated in spatial awareness and attention functions [29].
Higher TMT-B scores (worse performance) were associated with a smaller left precentral, supramarginal and superior parietal gyri, as well as with smaller right postcentral, transverse temporal, inferior temporal and lateral occipital gyri (Figure 4C,D, Table 3d). The superior parietal lobule is implicated in working memory and somatosensory integration [30]. Higher TMT-B scores were also associated with a thinner right superior temporal gyrus, but also associated with a thicker left fusiform gyrus. The superior temporal gyrus is involved in language processing [31], while the fusiform gyrus is implicated in facial recognition tasks.

3.4. Relations Between Diffusion Metrics and Morphologic ROIs

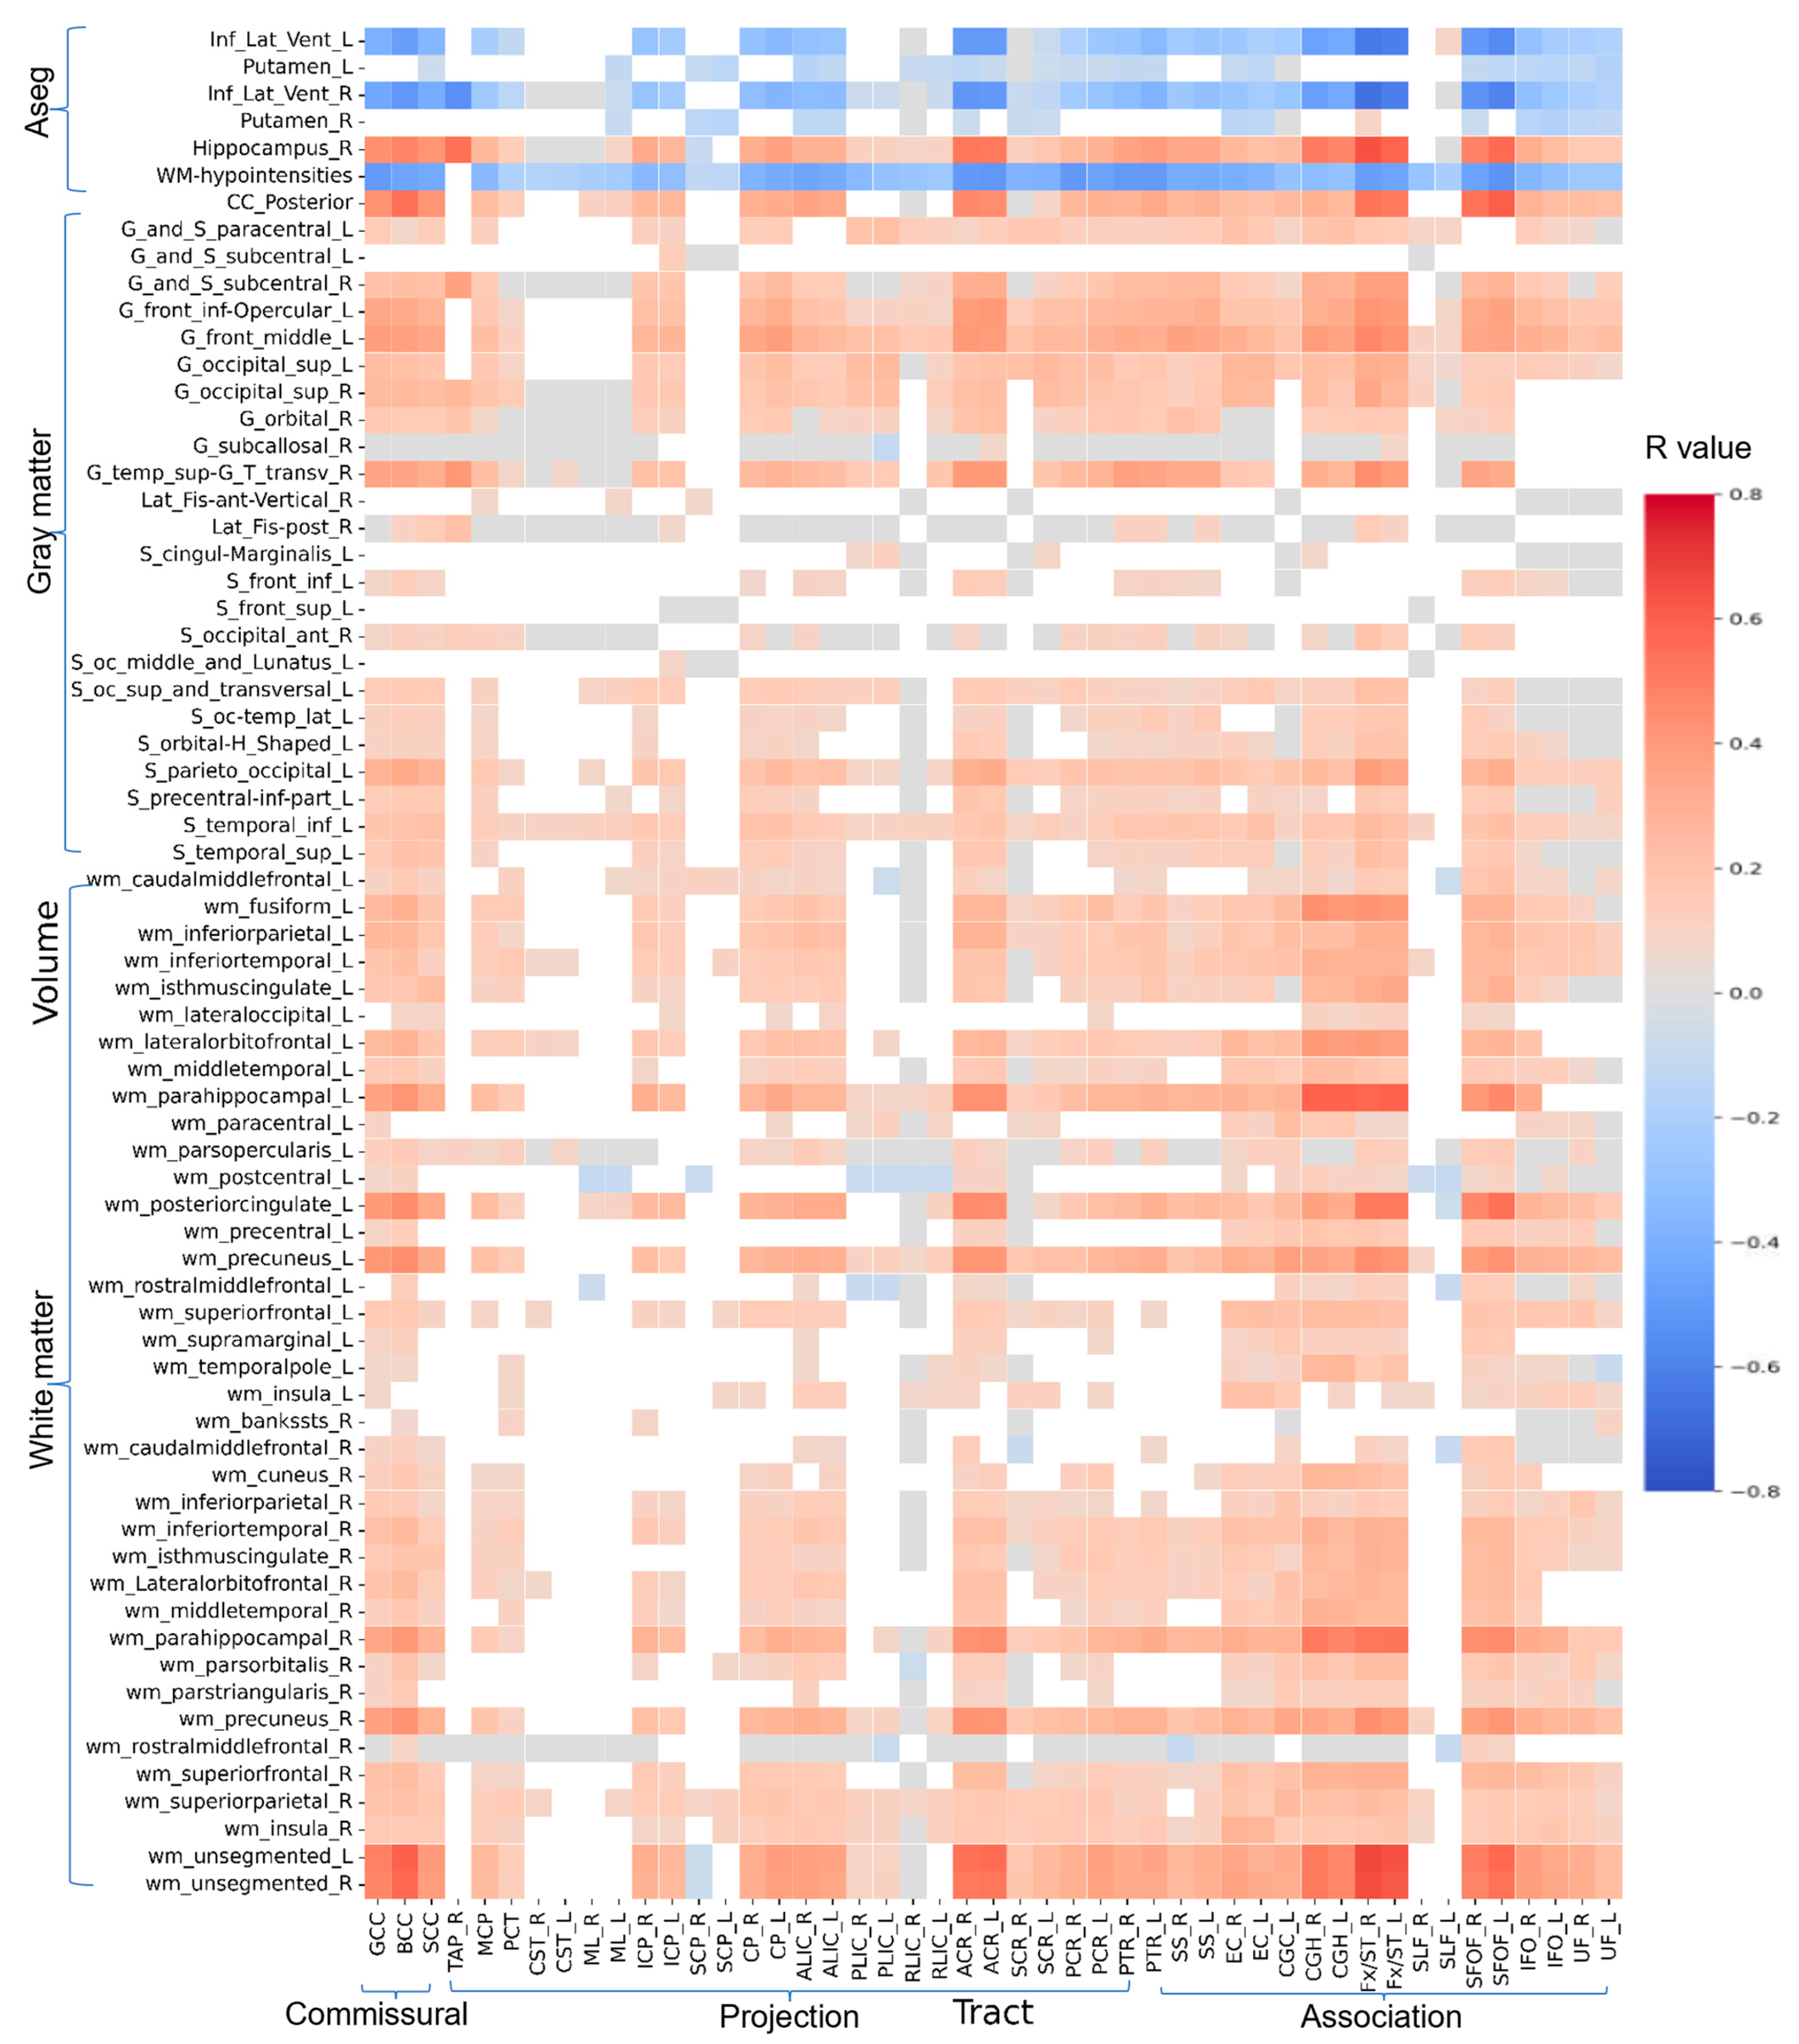
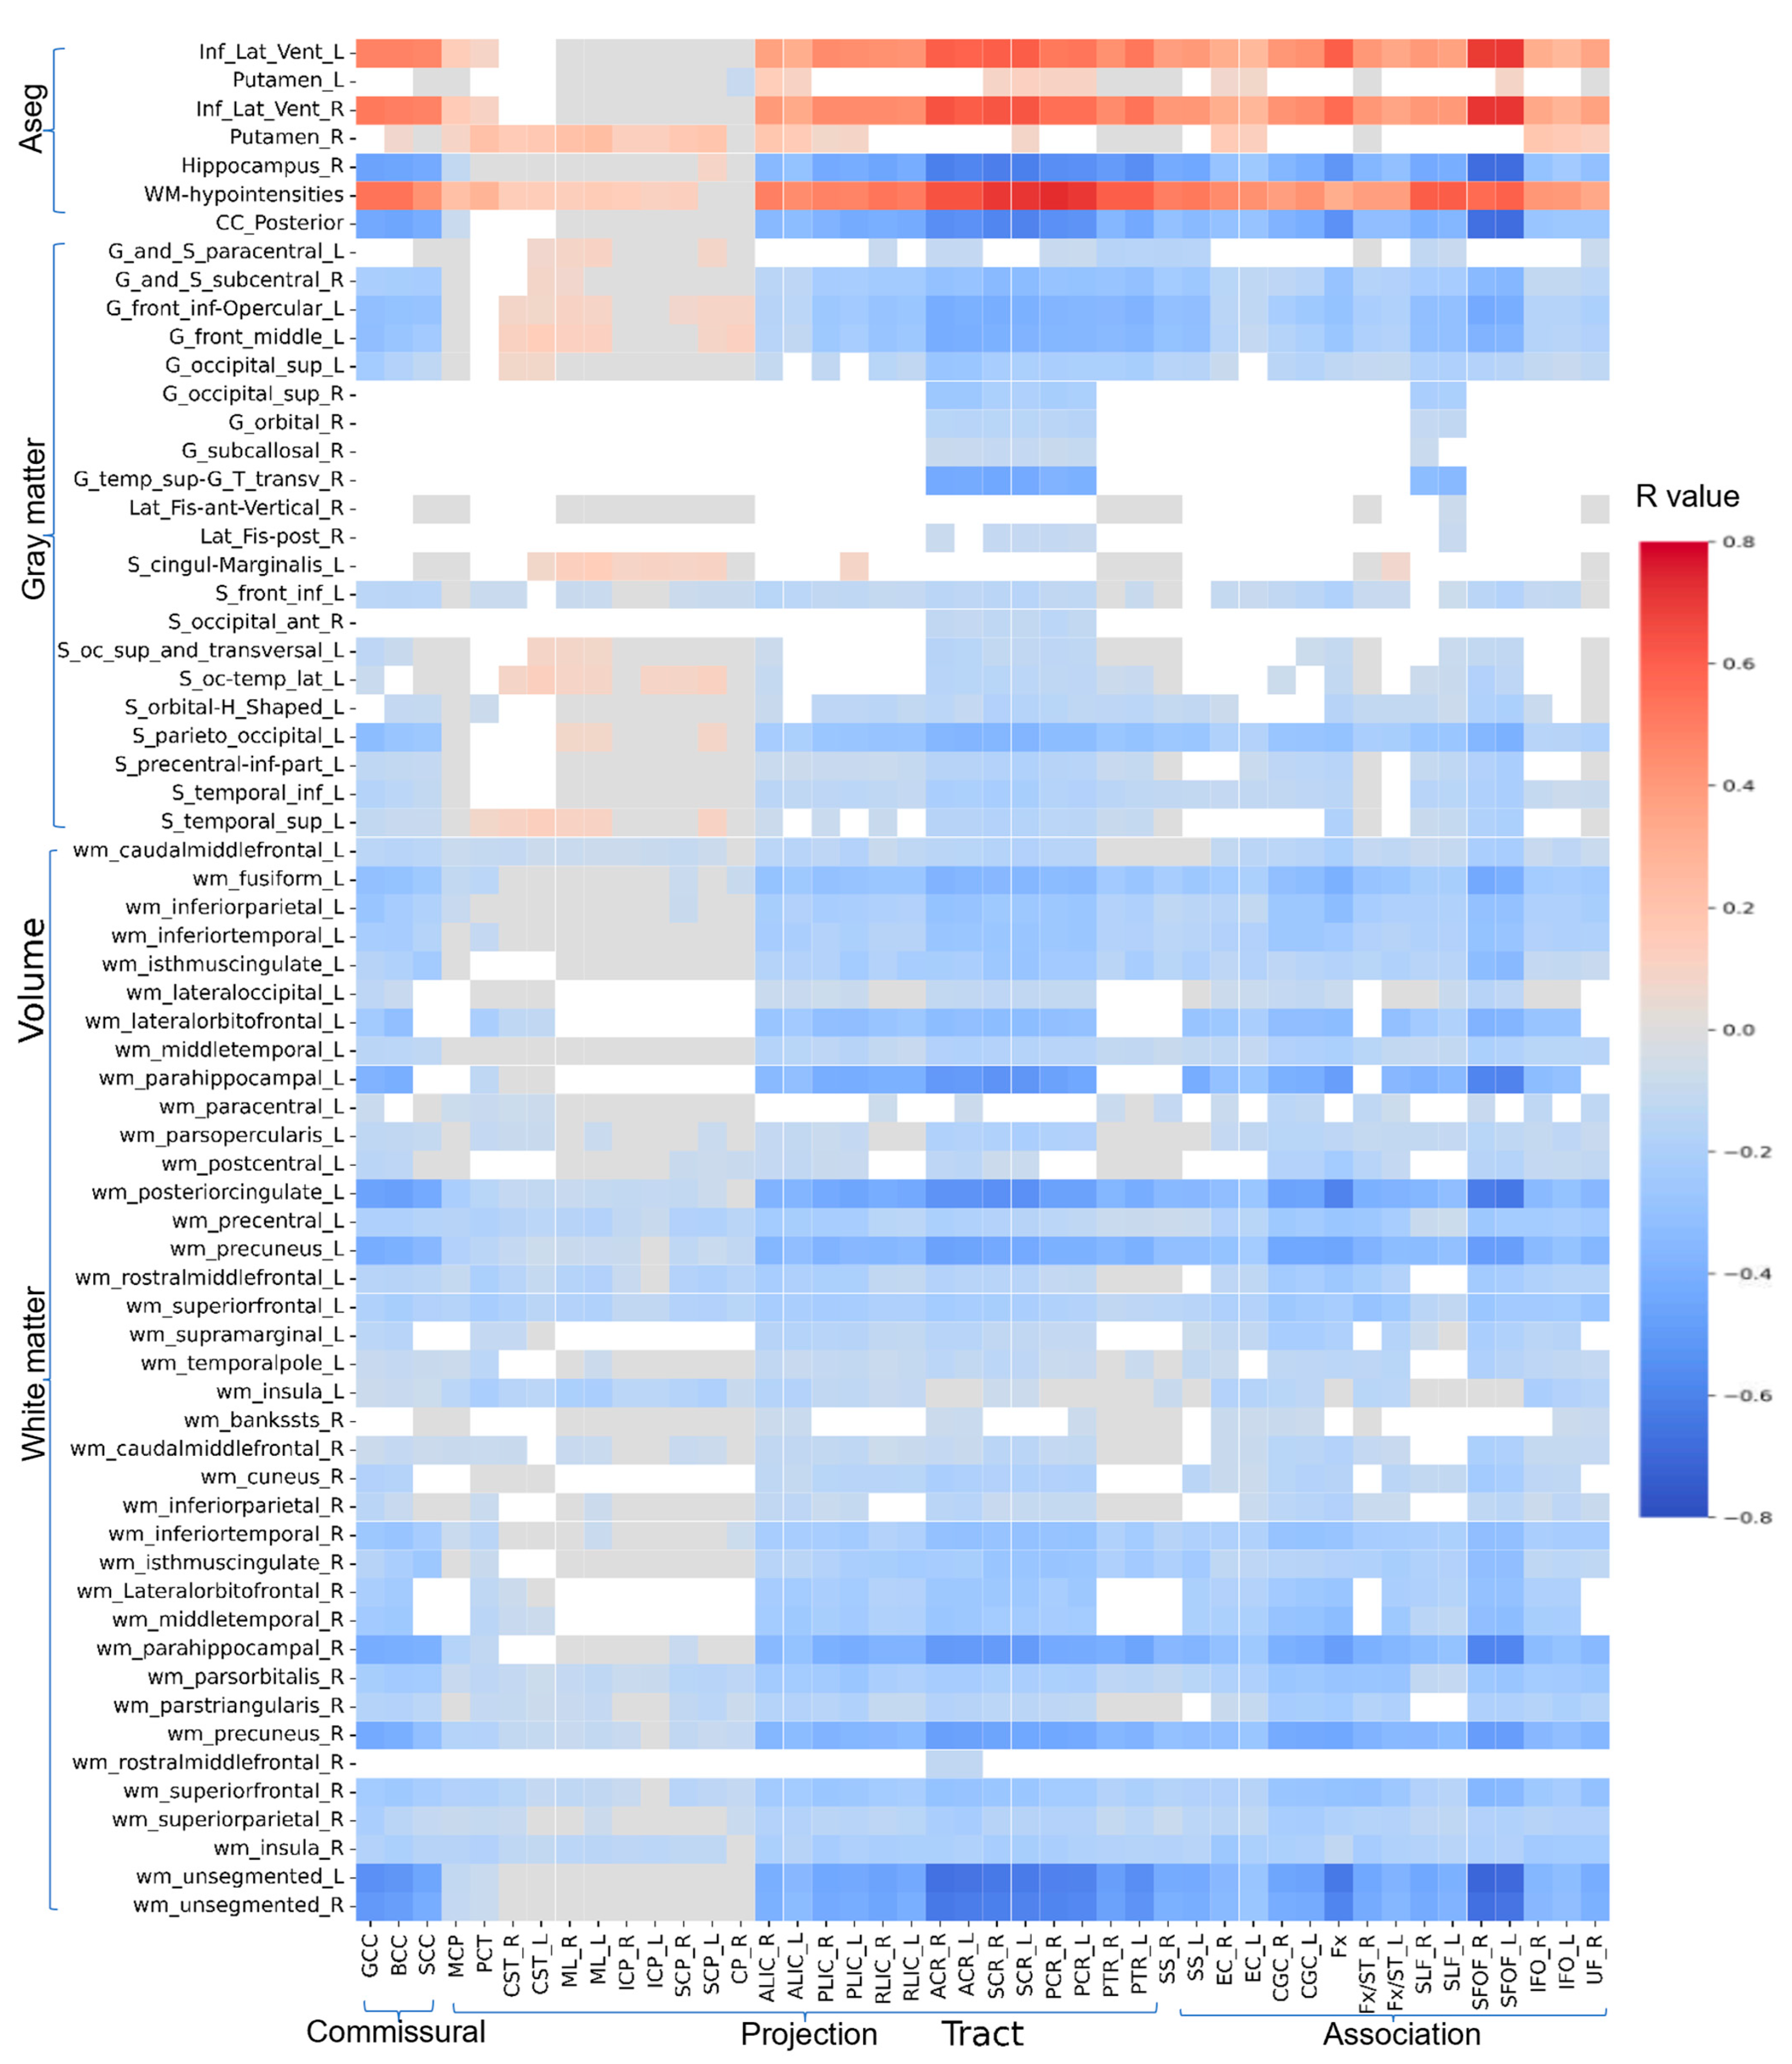
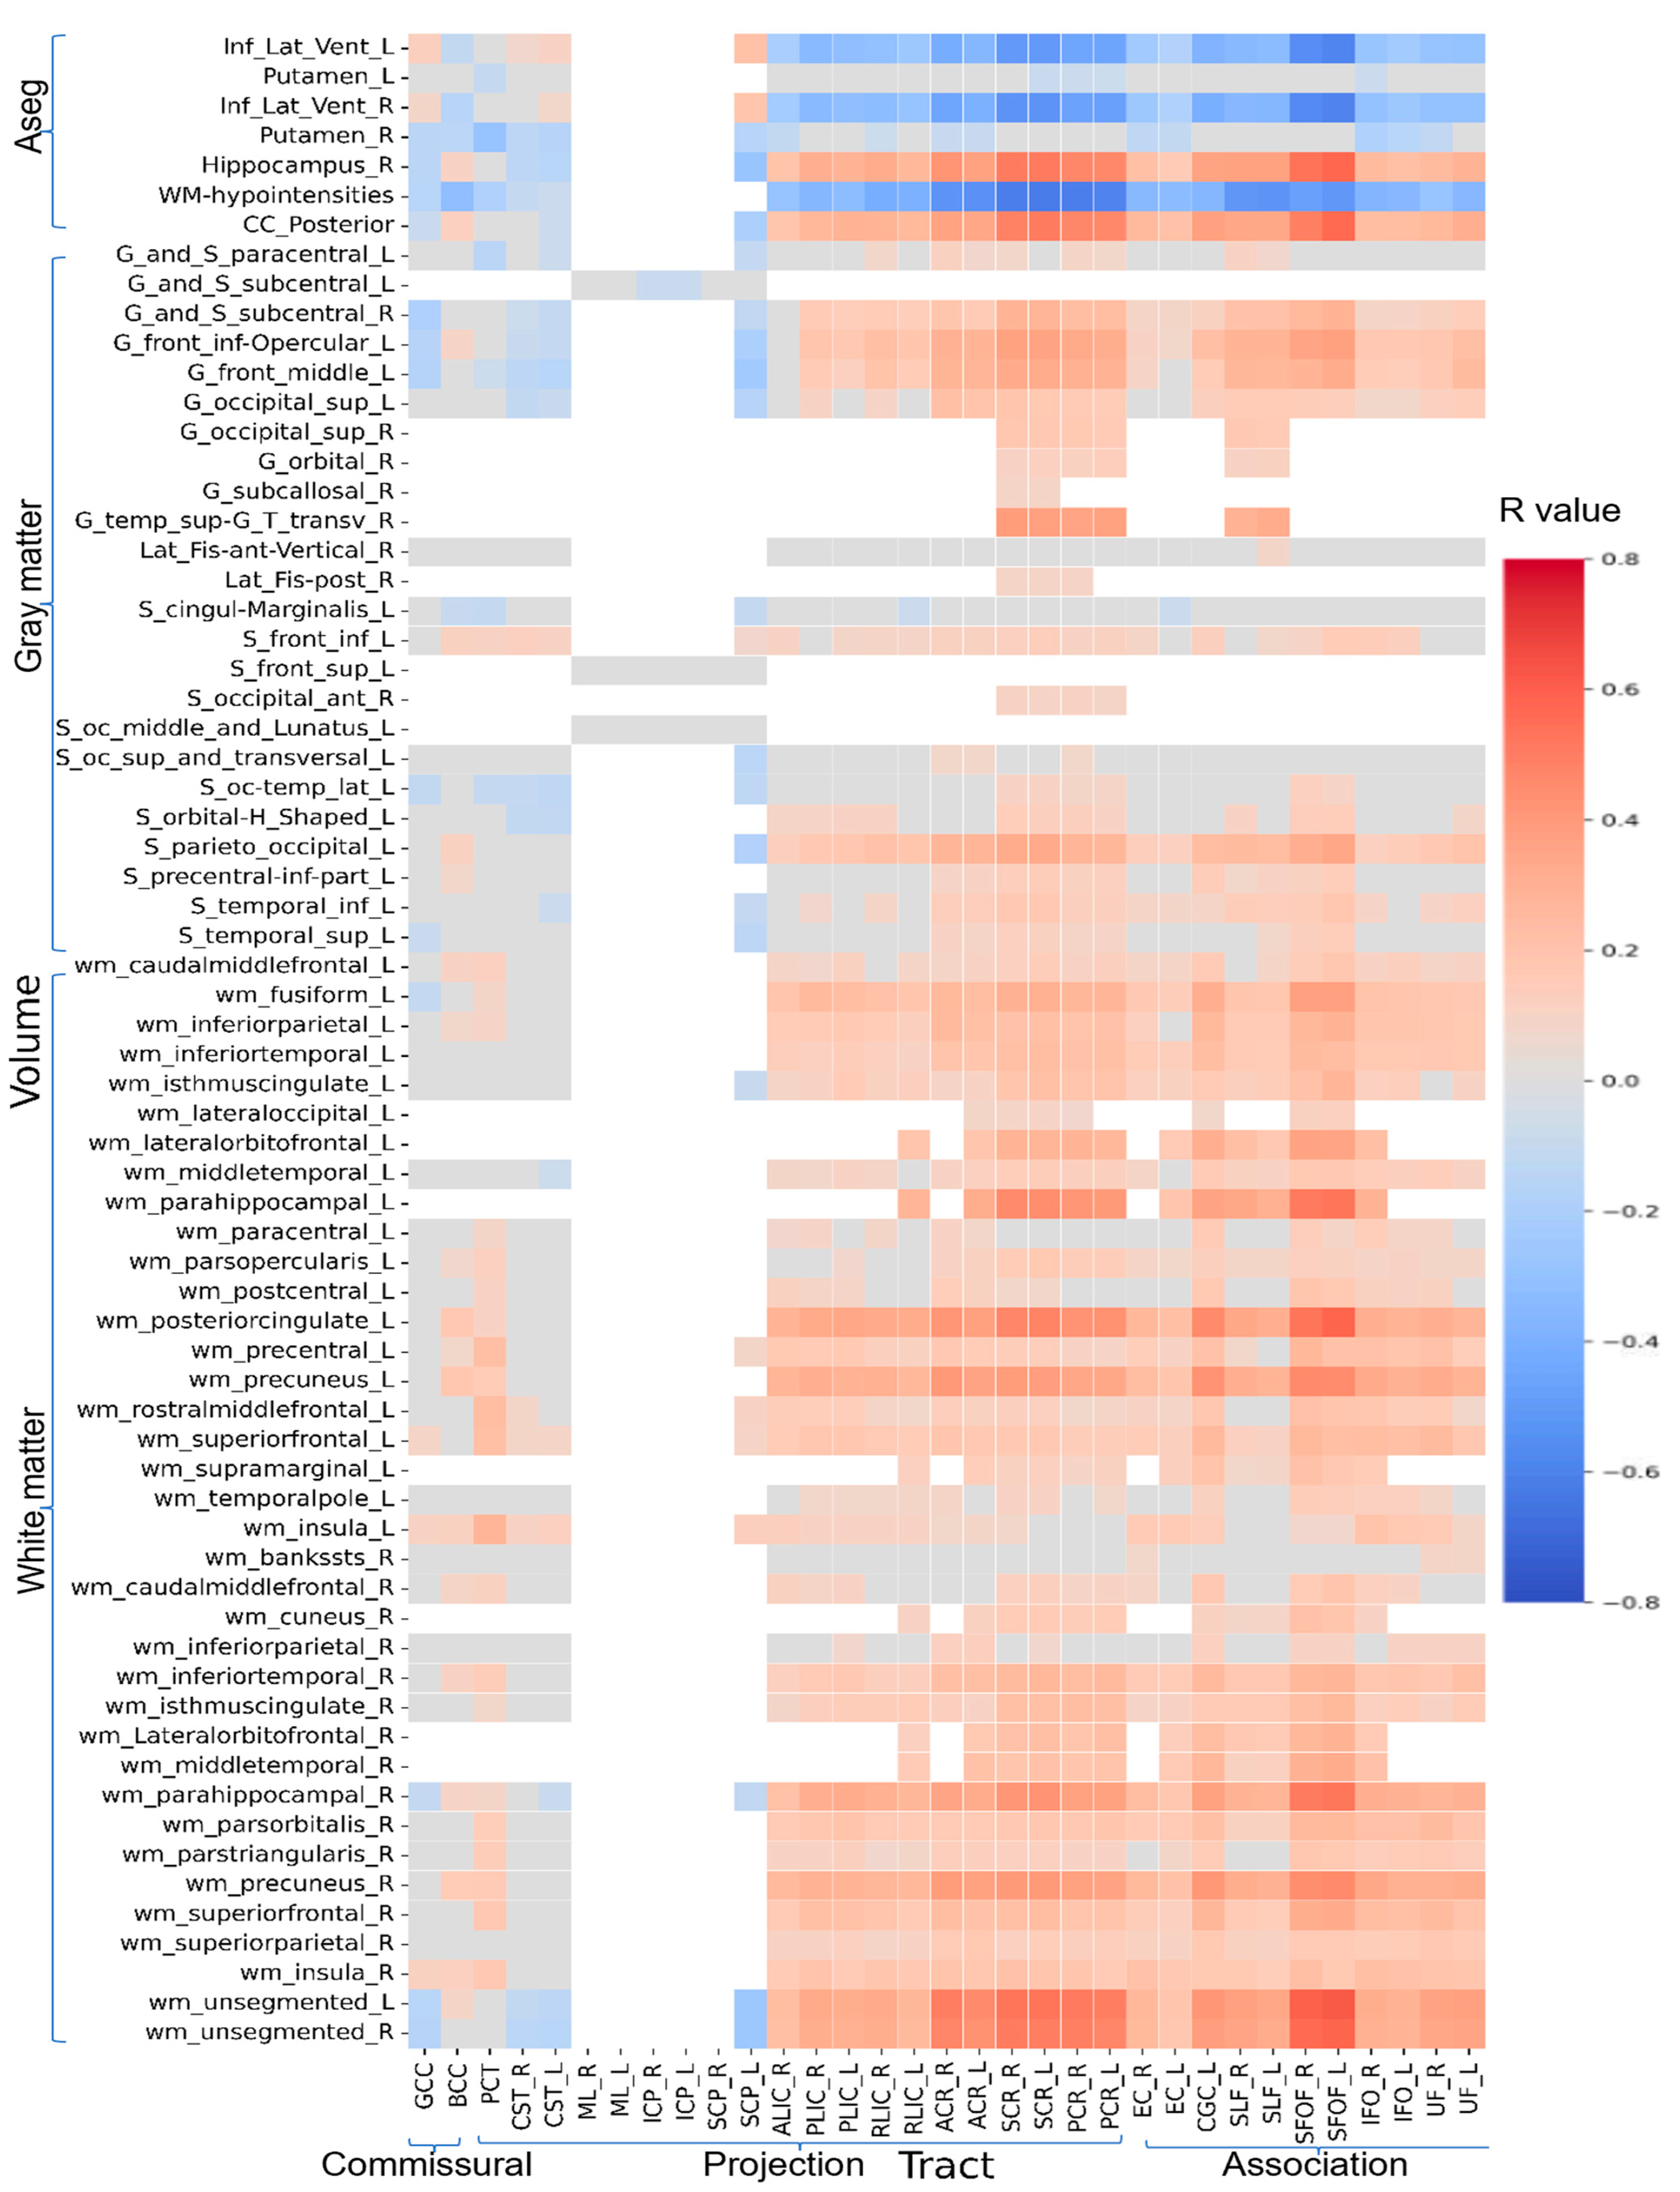
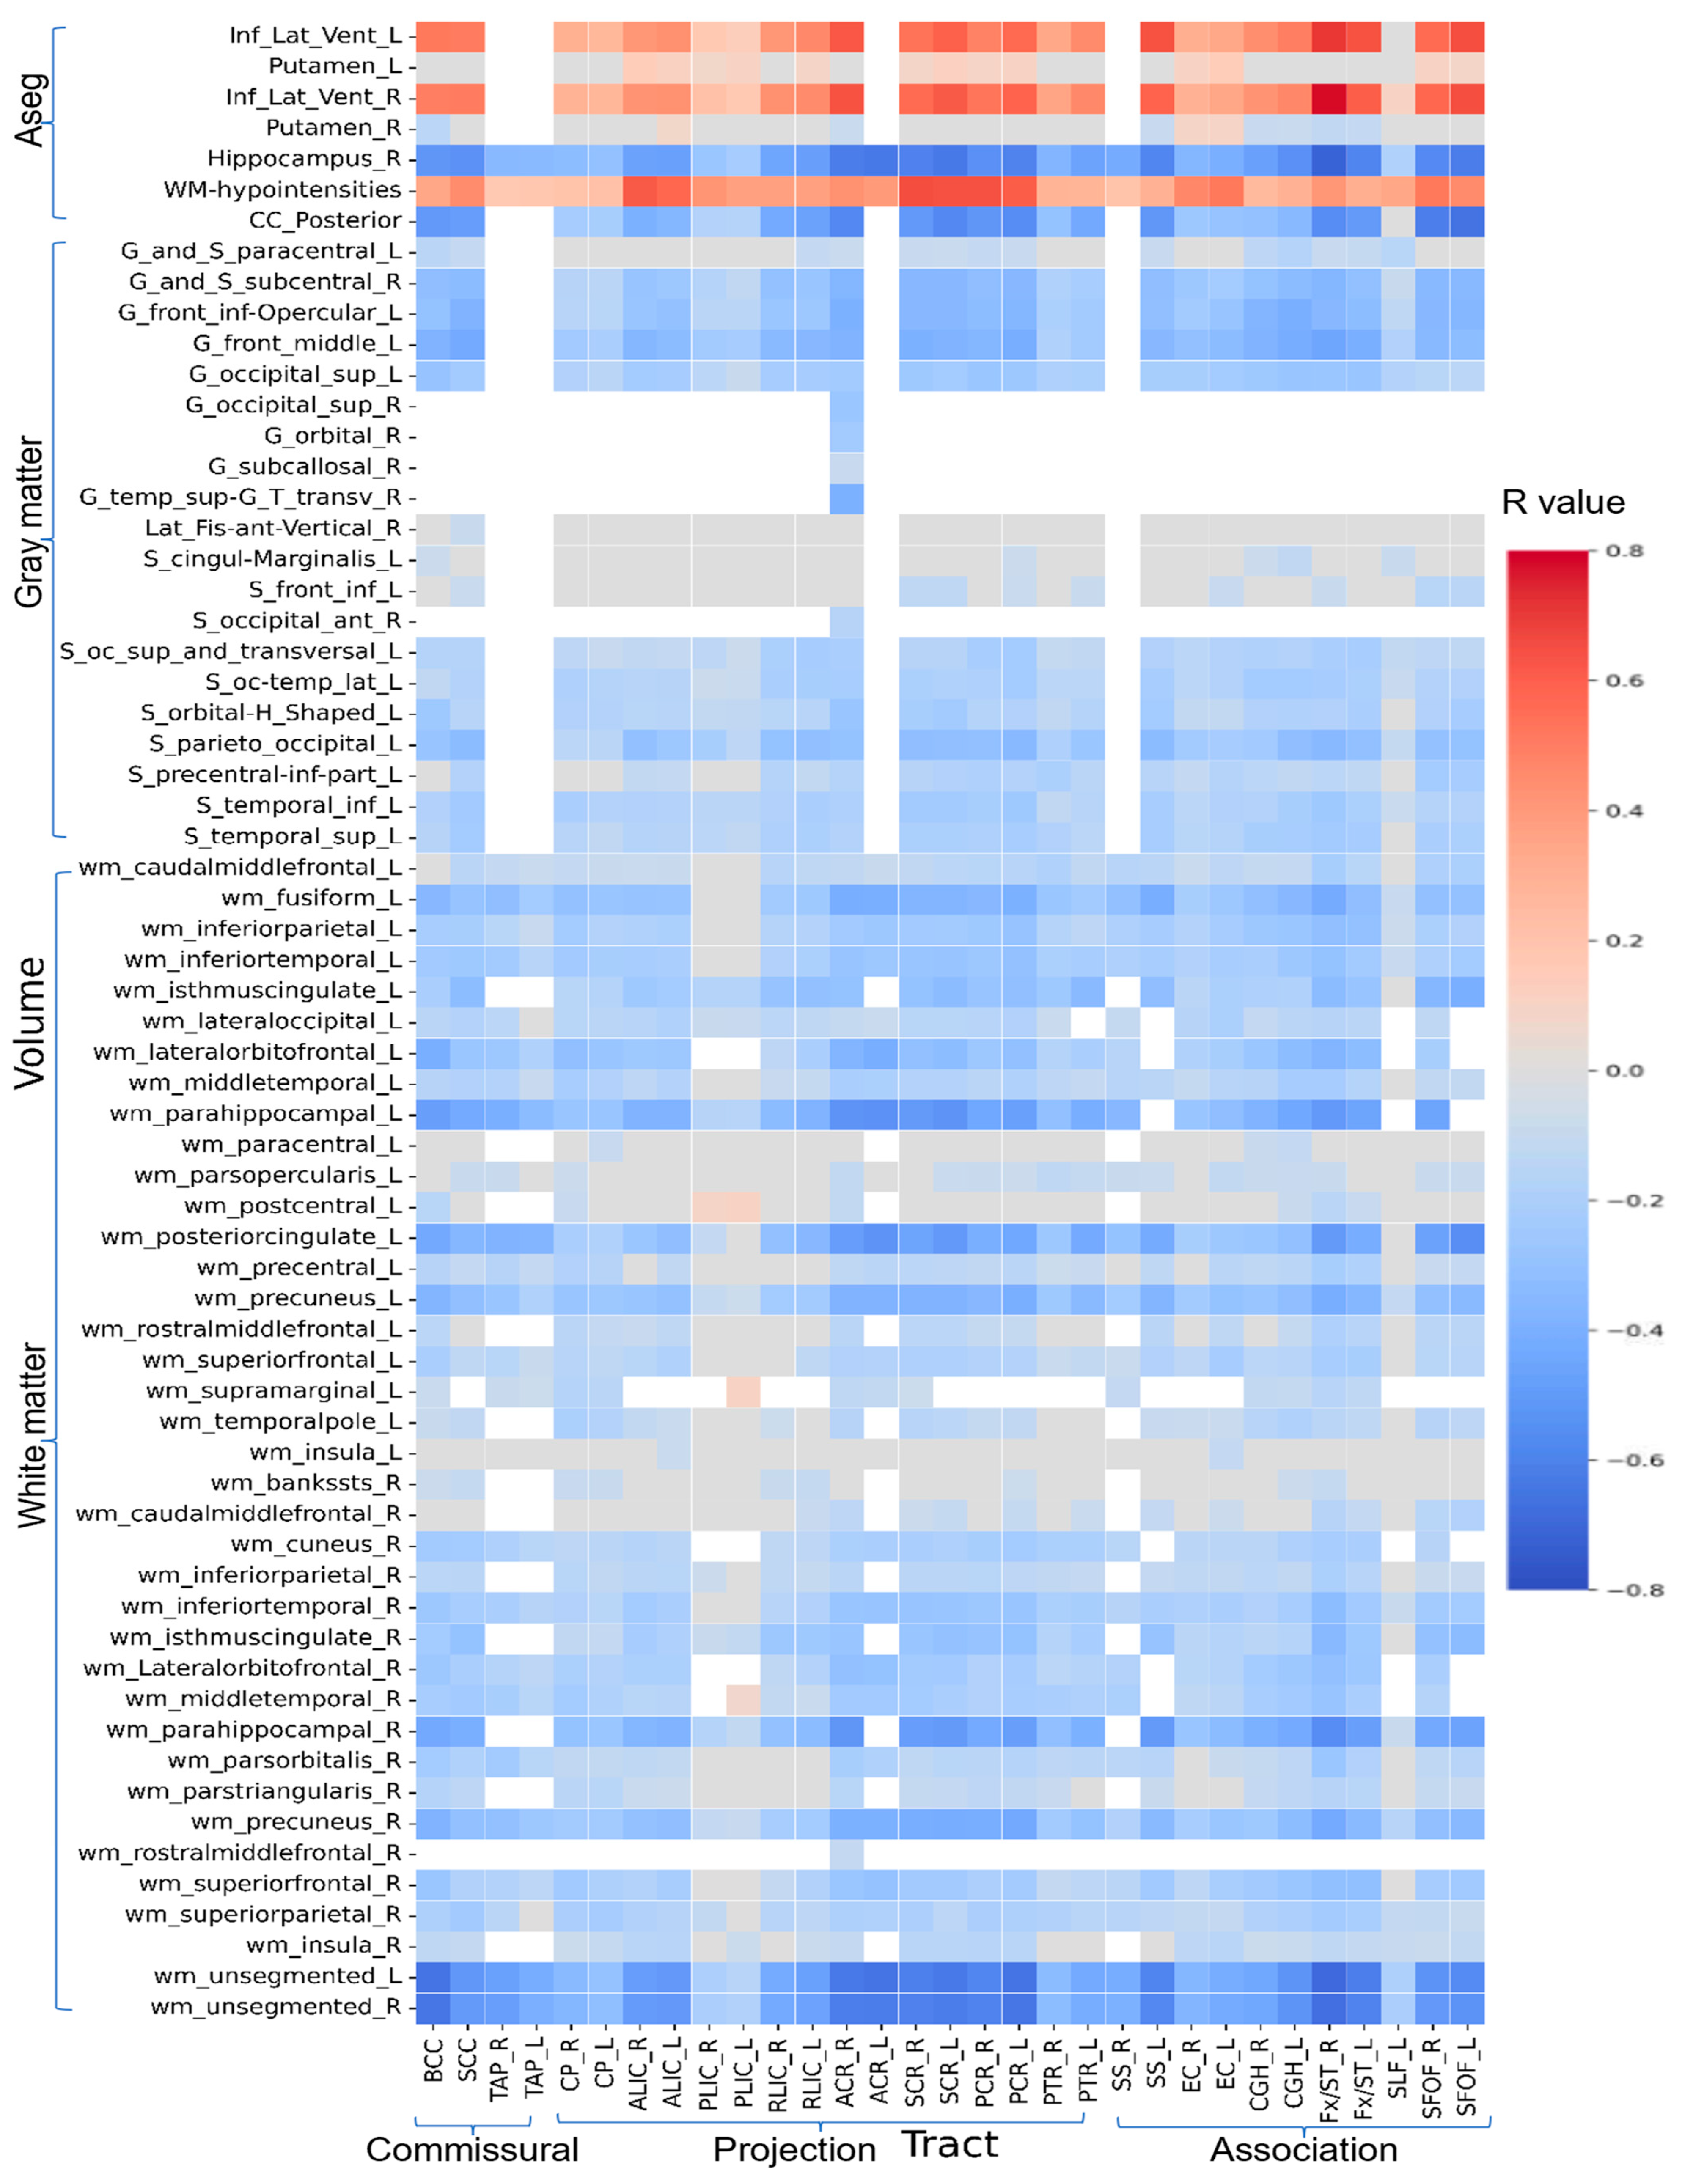
Figure 5, Figure 6, Figure 7 and Figure 8 show heatmaps depicting the relationships between regional brain volumes and different diffusion metrics in the left panel and highlight correlations with significant associations between diffusion and volume metrics and cognitive test performance. Supplementary Table S2 lists all white matter tracts in which mean diffusion metrics showed a significant association with each cognitive performance test after adjusting for age, sex, and years of education as covariates in multivariable regression analyses. Supplementary Table S3a–d lists all cortical and subcortical regions in which regional volumes showed a significant association with each cognitive performance test after adjusting for age, sex, years of education, and total intracranial volume as covariates. Supplementary Table S4a–d reports correlations with significant associations between diffusion and volume metrics and cognitive test performance, with an absolute r > 0.5.
For crystallized cognition, sparse positive correlations were observed between FA and ND values in the body of the corpus callosum, bilateral anterior and superior corona radiata, bilateral superior fronto-occipital fasciculus, and right tapetum, as well as with the volume of the right hippocampus. In contrast, negative correlations were observed with the volumes of the bilateral inferior lateral ventricles and white matter hypointensities. Additional negative correlations were found between the volume of the bilateral inferior lateral ventricles and MD values in the bilateral corona radiata. No significant correlations were observed for fluid cognition or for the OD index.
For both TMT-A and TMT-B, more widespread positive correlations were observed with FA and ND values in the body of the corpus callosum, bilateral corona radiata, fornix/stria terminalis, and superior fronto-occipital fasciculus, as well as with the volumes of the posterior corpus callosum, right hippocampus, and white matter of the bilateral parahippocampal regions and left posterior cingulate. Conversely, negative correlations were observed with the volumes of the bilateral inferior lateral ventricles and white matter hypointensities. These associations were also more pronounced for the MD and free water fraction (FWF) indices. Notably, TMT-A showed stronger correlations with the volume of left parahippocampal white matter, whereas TMT-B showed stronger correlations with the volume of right parahippocampal white matter at this level. In addition, FWF values in the left sagittal stratum and superior fronto-occipital fasciculus were more strongly related to the volumes of specific subcortical regions for TMT-B.

4. Discussion

In this large, demographically representative cohort of healthy adults aged 36 to 100 years, we identified distinct patterns of white matter microstructural and cortical morphological associations for four widely used cognitive measures: fluid cognition, crystallized cognition, TMT-A, and TMT-B. Our findings demonstrate that cognitive domains differ markedly in their dependence on structural integrity, revealing a pattern of structure-cognition coupling across healthy adults. Notably, TMT-B exhibited the strongest and most widespread associations with white matter microstructure and cortical morphology, followed by TMT-A and crystallized cognition, whereas fluid cognition showed only focal structural correlates. Together, these results provide a multimodal structural baseline of cognitive performance in normative aging, offering a valuable reference for interpreting MRI-cognition relationships in studies of neurocognitive disorders.
Among all cognitive measures, TMT-B demonstrated the most pervasive associations, involving nearly all major projection, commissural, and association pathways, including the corona radiata, internal capsule, corpus callosum, external capsule, superior longitudinal fasciculus, and cerebellar peduncles. These pathways support cognitive flexibility, task-switching, and the integration of information across hemispheres and large-scale cortical systems [32,33]. The strong associations between TMT-B and long-range white matter tracts align with the task’s heavy demands on task shifting and switching. TMT-B also showed extensive cortical associations, including inferior parietal, superior parietal, superior temporal, transverse temporal, inferior temporal, and lateral occipital regions, areas implicated in visuospatial processing, attentional control, language processing, and multisensory integration [34,35]. The breadth of these associations underscores that TMT-B performance reflects coordinated activity across networks, rather than localized brain regions. These findings are consistent with longitudinal aging and neurodegeneration research showing that TMT-B is one of the earliest executive measures to decline with age [36] and is highly sensitive to microstructural disruption in cognitive impairment and related disorders [37]. By mapping TMT-B to its structural substrates in healthy adults, our results establish a crucial normative reference for interpreting deviations in disease populations.
Crystallized cognition exhibited a robust pattern of white matter and cortical associations, though less extensive than those of TMT-B. White matter associations primarily involved the corona radiata, posterior thalamic radiations, corpus callosum, superior longitudinal fasciculus, and middle cerebellar peduncle tracts supporting language, semantic retrieval, and the integration of auditory and visual information [38,39]. Cortical findings further highlighted a strong link to semantic and auditory systems, including thicker cortex in the supramarginal, transverse temporal (Heschl’s), and inferior temporal gyri. These areas play central roles in speech perception, phonological processing, and retrieval of stored knowledge [40,41,42]. The pattern supports long-standing models of crystallized intelligence as a function of cumulative learning [43]. Given that crystallized cognition remains relatively preserved in healthy aging and often reflects cognitive reserve, these normative structural associations may serve as an anatomical baseline against which to interpret deviations in conditions affecting semantic memory or language networks, including Alzheimer’s disease and progressive aphasias.
In contrast to crystallized cognition and TMT performance, fluid cognition exhibited only focal associations, predominantly within brainstem projection pathways and a limited portion of the left postcentral gyrus. The minimal structural correlates observed here likely reflect several factors, including the fact that fluid cognition declines earlier than crystallized cognition [44]. These results reinforce the notion that fluid cognition may be less suitable as a primary structural MRI correlate in aging research and that functional or multimodal imaging may be required to fully capture its neural correlations.
Our multimodal correlation analyses further clarified how regional volumes relate to tract-specific microstructural integrity. Crystallized cognition showed modest tract–volume relationships, whereas TMT-A and especially TMT-B showed widespread correlations involving the corpus callosum, parahippocampal white matter, posterior cingulate, and hippocampus. These regions are central hubs in memory and executive control networks [45,46] and are among the earliest areas to exhibit microstructural vulnerability in preclinical Alzheimer’s disease [47,48,49]. We found a positive correlation between the right hippocampus and parahippocampal volume with the FA values of several white tracts, while a negative correlation between bilateral inferior lateral ventral volume and the FA values of these white tracts for CC and TMT-B. These correlations are also likely implicated in aging and Alzheimer’s disease processes [47,48,49].
Understanding which cognitive tests most closely reflect underlying brain structure is essential for interpreting cognition-MRI relationships in aging studies and for designing clinical trials targeting early neurodegenerative change. Our findings suggest that TMT-B is the most structurally informative cognitive measure and may be the best suited for pairing with diffusion and structural MRI in studies of aging, vascular risk, and preclinical Alzheimer’s disease. Crystallized cognition provides meaningful structural information linked to semantic memory and cognitive reserve. Fluid cognition has limited structural correspondence and may require functional or multimodal imaging for full characterization. By establishing normative structural maps of these cognitive measures, this study provides an anatomical reference framework that can aid researchers and clinicians in distinguishing healthy variation from early pathological change.
The present study has several limitations. First, we used a cross-sectional study design, which limits the ability to assess any aging-related longitudinal changes at an individual-level. Second, only a limited number of potential confounding variables have been recorded in the Human Connectome Project, thus limiting our ability to adjust for all potential confounders. Another limitation in our study is that the tract-based diffusion indices were overlaid on the white matter atlas of “JHU-ICBM-DTI-81”. Because of this, some significant areas in our voxel-wise analysis of white matter tracts are unclassified and not listed in Table 2. Finally, the cognitive tests deduced from the NIH toolbox are continuously evolving, and their measurements may change over time.

5. Conclusions

Across a large cohort of healthy adults, we found that cognitive tests vary markedly in how strongly they depend on structural brain integrity. TMT-B showed the most extensive associations with white matter microstructure and cortical morphology, followed by TMT-A and crystallized cognition, whereas fluid cognition demonstrated only focal structural correlates. By establishing normative structure–cognition mappings across healthy adulthood, our findings provide essential benchmarks for interpreting cognitive-MRI relationships in aging research and in studies of preclinical neurodegenerative disease. In particular, the strong structural coupling of TMT-B suggests that it may serve as a sensitive cognitive measure for detecting early disruptions in large-scale neural networks. These results can guide the selection of cognitive tests most aligned with underlying neuroanatomy in both research and clinical settings.

Supplementary Materials

The following supporting information can be downloaded at: https://www.mdpi.com/article/10.3390/ctn10010005/s1, Table S1. Demographics of the studied population in each sub-dataset; Table S2. Tract (ROI) based diffusion metric correlates with different cognitive tests; Table S3. The cortical and subcortical ROI-based correlates of different cognitive tests; Table S4. Summary of correlation coefficient values (over 0.5) between volumes of cortical and subcortical regions and DTI index of white matter tracts for corresponding cognitive tests (FDR corrected); Figure S1. Heatmap of the ROIs with absolute r > 0.5 in Pearson’s correlation.

Author Contributions

Conceptualization, C.Y. and S.P.; methodology, C.Y., N.M.H.E., C.F.W., P.B. and S.P.; formal analysis, C.Y.; investigation, C.Y.; resources, A.T.T.; data curation, C.Y.; writing—original draft preparation, C.Y., H.A.-R., N.M.H.E., C.F.W., P.B., A.T.T., A.M. and S.P.; writing—review and editing, C.Y., H.A.-R., N.M.H.E., C.F.W., P.B., A.T.T., A.M. and S.P.; visualization, C.Y.; supervision, S.P. All authors have read and agreed to the published version of the manuscript.

Funding

Data were provided by the Human Connectome Project, WU-Minn Consortium (Principal Investigators: David Van Essen and Kamil Ugurbil; 1U54MH091657) funded by the NIH Institutes and Centers that support the NIH Blueprint for Neuroscience Research; and by the McDonnell Center for Systems Neuroscience at Washington University.

Institutional Review Board Statement

The study was conducted in accordance with the Declaration of Helsinki, and approved by the Institutional Review Board of Yale University (#2000029470 on 13 January 2021).

Informed Consent Statement

Informed consent was obtained from all subjects involved in the study.

Data Availability Statement

All data used in the present study are available for download from the Human Connectome Project (www.humanconnectome.org accessed on 27 January 2026).

Acknowledgments

We gratefully acknowledge the contribution of Youpeng Ben for the codes writing on Linux system for the data analysis in this work.

Conflicts of Interest

The authors declare no conflicts of interest.

Abbreviations

The following abbreviations are used in this manuscript:
NIHThe National Institutes of Health
TMTTrail Making Tests
HCPthe Human Connectome Project
FCFluid Cognition
CCCrystallized Cognition
MPRAGEmagnetization-prepared rapid gradient-echo
APanterior-to-posterior
PAposterior-to-anterior
dMRIdiffusion-MRI
FAFractional Anisotropy
MDMean Diffusivity
NODDINeurite Orientation Dispersion and Density Imaging
NDneurite density
ODorientation dispersion
FWFfree water fraction
TBSSTract-based spatial statistics
TFCEThreshold Free Cluster Enhancement
FDRFalse Discovery Rate
ROIRegion-of-Interest
CWcluster-wise

References

  1. Filley, C.M.; Fields, R.D. White matter and cognition: Making the connection. J. Neurophysiol. 2016, 116, 2093–2104. [Google Scholar] [CrossRef]
  2. Madden, D.J.; Bennett, I.J.; Song, A.W. Cerebral white matter integrity and cognitive aging: Contributions from diffusion tensor imaging. Neuropsychol. Rev. 2009, 19, 415–435. [Google Scholar] [CrossRef]
  3. Lee, W.J.; Jung, K.H.; Park, K.I.; Chu, K.; Lee, S.K. Domain-specific longitudinal associations between brain volume, white matter lesions, and cognitive function changes. Heliyon 2025, 11, e42536. [Google Scholar] [CrossRef]
  4. Kirova, A.M.; Bays, R.B.; Lagalwar, S. Working memory and executive function decline across normal aging, mild cognitive impairment, and Alzheimer’s disease. BioMed Res. Int. 2015, 2015, 748212. [Google Scholar] [CrossRef] [PubMed]
  5. Gershon, R.C.; Wagster, M.V.; Hendrie, H.C.; Fox, N.A.; Cook, K.F.; Nowinski, C.J. NIH Toolbox for Assessment of Neurological and Behavioral Function. Neurology 2013, 80, S2–S6. [Google Scholar] [CrossRef]
  6. Mitchell, D.J.; Mousley, A.L.S.; Shafto, M.A.; Cam, C.A.N.; Duncan, J. Neural Contributions to Reduced Fluid Intelligence across the Adult Lifespan. J. Neurosci. 2023, 43, 293–307. [Google Scholar] [CrossRef]
  7. Akshoomoff, N.; Beaumont, J.L.; Bauer, P.J.; Dikmen, S.S.; Gershon, R.C.; Mungas, D.; Slotkin, J.; Tulsky, D.; Weintraub, S.; Zelazo, P.D.; et al. VIII. NIH Toolbox Cognition Battery (CB): Composite scores of crystallized, fluid, and overall cognition. Monogr. Soc. Res. Child. Dev. 2013, 78, 119–132. [Google Scholar] [CrossRef] [PubMed]
  8. Nolin, S.A.; Cowart, H.; Merritt, S.; McInerney, K.; Bharadwaj, P.K.; Franchetti, M.K.; Raichlen, D.A.; Jessup, C.J.; Hishaw, G.A.; Van Etten, E.J.; et al. Validity of the NIH toolbox cognitive battery in a healthy oldest-old 85+ sample. J. Int. Neuropsychol. Soc. 2023, 29, 605–614. [Google Scholar] [CrossRef] [PubMed]
  9. Hackett, K.; Krikorian, R.; Giovannetti, T.; Melendez-Cabrero, J.; Rahman, A.; Caesar, E.E.; Chen, J.L.; Hristov, H.; Seifan, A.; Mosconi, L.; et al. Utility of the NIH Toolbox for assessment of prodromal Alzheimer’s disease and dementia. Alzheimers Dement. 2018, 10, 764–772. [Google Scholar] [CrossRef]
  10. Salthouse, T.A. What cognitive abilities are involved in trail-making performance? Intelligence 2011, 39, 222–232. [Google Scholar] [CrossRef]
  11. Arbuthnott, K.; Frank, J. Trail making test, part B as a measure of executive control: Validation using a set-switching paradigm. J. Clin. Exp. Neuropsychol. 2000, 22, 518–528. [Google Scholar] [CrossRef]
  12. Yao, Z.F.; Yang, M.H.; Hwang, K.; Hsieh, S. Frontoparietal structural properties mediate adult life span differences in executive function. Sci. Rep. 2020, 10, 9066. [Google Scholar] [CrossRef]
  13. Anziano, M.; Mouthon, M.; Thoeny, H.; Sperber, C.; Spierer, L. Mental flexibility depends on a largely distributed white matter network: Causal evidence from connectome-based lesion-symptom mapping. Cortex 2023, 165, 38–56. [Google Scholar] [CrossRef] [PubMed]
  14. Bednorz, A.; Religa, D. Utility of the Comprehensive Trail Making Test in the Assessment of Mild Cognitive Impairment in Older Patients. Geriatrics 2023, 8, 108. [Google Scholar] [CrossRef]
  15. Dickerson, B.C.; Sperling, R.A.; Hyman, B.T.; Albert, M.S.; Blacker, D. Clinical Prediction of Alzheimer Disease Dementia Across the Spectrum of Mild Cognitive Impairment. JAMA Psychiatry 2007, 64, 1443–1450. [Google Scholar] [CrossRef]
  16. Bookheimer, S.Y.; Salat, D.H.; Terpstra, M.; Ances, B.M.; Barch, D.M.; Buckner, R.L.; Burgess, G.C.; Curtiss, S.W.; Diaz-Santos, M.; Elam, J.S.; et al. The Lifespan Human Connectome Project in Aging: An overview. NeuroImage 2019, 185, 335–348. [Google Scholar] [CrossRef]
  17. Li, S.C.; Lindenberger, U.; Hommel, B.; Aschersleben, G.; Prinz, W.; Baltes, P.B. Transformations in the couplings among intellectual abilities and constituent cognitive processes across the life span. Psychol. Sci. 2004, 15, 155–163. [Google Scholar] [CrossRef]
  18. Cohen, D.E.; Kim, H.; Levine, A.; Devanand, D.P.; Lee, S.; Goldberg, T.E. Effects of age on the relationship between sleep quality and cognitive performance: Findings from the Human Connectome Project-Aging cohort. Int. Psychogeriatr. 2023, 36, 1171–1181. [Google Scholar] [CrossRef] [PubMed]
  19. Army Individual Test Battery; War Department, Adjutant General’s Office. Manual of Directions and Scoring; Army Individual Test Battery: Washington, DC, USA; War Department, Adjutant General’s Office: Washington, DC, USA, 1944. [Google Scholar]
  20. Reitan, R.M.; Wolfson, D. The Halstead-Reitan Neuropsychological Test Battery: Theory and Clinical Interpretation; Neuropsychology Press: Washington, DC, USA, 1985; Volume 4. [Google Scholar]
  21. Olivera-Souza, R.D.; Moll, J.; Passman, L.J.; Cunha, F.C.; Paes, F.; Adriano, M.V.; Ignacio, F.A.; Marrocos, R.P. Trail making and cognitive set-shifting. Arq. Neuropsiquiatr. 2000, 58, 826–829. [Google Scholar] [CrossRef] [PubMed]
  22. Weintraub, S.; Dikmen, S.S.; Heaton, R.K.; Tulsky, D.S.; Zelazo, P.D.; Slotkin, J.; Carlozzi, N.E.; Bauer, P.J.; Wallner-Allen, K.; Fox, N.; et al. The cognition battery of the NIH toolbox for assessment of neurological and behavioral function: Validation in an adult sample. J. Int. Neuropsychol. Soc. 2014, 20, 567–578. [Google Scholar] [CrossRef]
  23. Straus, E.; Sherman, E.; Spreen, O. A Compendium of Neuropsychological Tests: Administration, Norms, and Commentary; Oxford University Press: New York, NY, USA, 2006; pp. 267–270. [Google Scholar]
  24. Smith, S.M. Fast robust automated brain extraction. Hum. Brain Mapp. 2002, 17, 143–155. [Google Scholar] [CrossRef] [PubMed]
  25. Andersson, J.L.R.; Graham, M.S.; Zsoldos, E.; Sotiropoulos, S.N. Incorporating outlier detection and replacement into a non-parametric framework for movement and distortion correction of diffusion MR images. NeuroImage 2016, 141, 556–572. [Google Scholar] [CrossRef]
  26. Zhang, H.; Schneider, T.; Wheeler-Kingshott, C.A.; Alexander, D.C. NODDI: Practical in vivo neurite orientation dispersion and density imaging of the human brain. NeuroImage 2012, 61, 1000–1016. [Google Scholar] [CrossRef]
  27. Smith, S.M.; Nichols, T.E. Threshold-free cluster enhancement: Addressing problems of smoothing, threshold dependence and localisation in cluster inference. NeuroImage 2009, 44, 83–98. [Google Scholar] [CrossRef]
  28. du Boisgueheneuc, F.; Levy, R.; Volle, E.; Seassau, M.; Duffau, H.; Kinkingnehun, S.; Samson, Y.; Zhang, S.; Dubois, B. Functions of the left superior frontal gyrus in humans: A lesion study. Brain 2006, 129, 3315–3328. [Google Scholar] [CrossRef] [PubMed]
  29. Clower, D.M.; West, R.A.; Lynch, J.C.; Strick, P.L. The inferior parietal lobule is the target of output from the superior colliculus, hippocampus, and cerebellum. J. Neurosci. 2001, 21, 6283–6291. [Google Scholar] [CrossRef] [PubMed]
  30. Koenigs, M.; Barbey, A.K.; Postle, B.R.; Grafman, J. Superior parietal cortex is critical for the manipulation of information in working memory. J. Neurosci. 2009, 29, 14980–14986. [Google Scholar] [CrossRef]
  31. Bigler, E.D.; Mortensen, S.; Neeley, E.S.; Ozonoff, S.; Krasny, L.; Johnson, M.; Lu, J.; Provencal, S.L.; McMahon, W.; Lainhart, J.E. Superior temporal gyrus, language function, and autism. Dev. Neuropsychol. 2007, 31, 217–238. [Google Scholar] [CrossRef]
  32. Schulte, T.; Muller-Oehring, E.M. Contribution of callosal connections to the interhemispheric integration of visuomotor and cognitive processes. Neuropsychol. Rev. 2010, 20, 174–190. [Google Scholar] [CrossRef]
  33. Perry, M.E.; McDonald, C.R.; Hagler, D.J., Jr.; Gharapetian, L.; Kuperman, J.M.; Koyama, A.K.; Dale, A.M.; McEvoy, L.K. White matter tracts associated with set-shifting in healthy aging. Neuropsychologia 2009, 47, 2835–2842. [Google Scholar] [CrossRef]
  34. Yi, H.G.; Leonard, M.K.; Chang, E.F. The Encoding of Speech Sounds in the Superior Temporal Gyrus. Neuron 2019, 102, 1096–1110. [Google Scholar] [CrossRef]
  35. Lin, Y.H.; Dadario, N.B.; Hormovas, J.; Young, I.M.; Briggs, R.G.; MacKenzie, A.E.; Palejwala, A.H.; Fonseka, R.D.; Kim, S.J.; Tanglay, O.; et al. Anatomy and White Matter Connections of the Superior Parietal Lobule. Oper. Neurosurg. 2021, 21, E199–E214. [Google Scholar] [CrossRef]
  36. MacPherson, S.E.; Allerhand, M.; Cox, S.R.; Deary, I.J. Individual differences in cognitive processes underlying Trail Making Test-B performance in old age: The Lothian Birth Cohort 1936. Intelligence 2019, 75, 23–32. [Google Scholar] [CrossRef]
  37. Blacker, D.; Lee, H.; Muzikansky, A.; Martin, E.C.; Tanzi, R.; McArdle, J.J.; Moss, M.; Albert, M. Neuropsychological Measures in Normal Individuals That Predict Subsequent Cognitive Decline. JAMA Neurol. 2007, 64, 862–871. [Google Scholar] [CrossRef]
  38. Houston, J.; Allendorfer, J.; Nenert, R.; Goodman, A.M.; Szaflarski, J.P. White Matter Language Pathways and Language Performance in Healthy Adults Across Ages. Front. Neurosci. 2019, 13, 1185. [Google Scholar] [CrossRef] [PubMed]
  39. Shekari, E.; Nozari, N. A narrative review of the anatomy and function of the white matter tracts in language production and comprehension. Front. Hum. Neurosci. 2023, 17, 1139292. [Google Scholar] [CrossRef] [PubMed]
  40. Sliwinska, M.W.; Khadilkar, M.; Campbell-Ratcliffe, J.; Quevenco, F.; Devlin, J.T. Early and sustained supramarginal gyrus contributions to phonological processing. Front. Psychol. 2012, 3, 161. [Google Scholar] [CrossRef] [PubMed]
  41. Martin, A.; Chao, L.L. Semantic memory and the brain: Structure and processes. Curr. Opin. Neurobiol. 2001, 11, 194–201. [Google Scholar] [CrossRef]
  42. Simons, J.S.; Graham, K.S.; Owen, A.M.; Patterson, K.; Hodges, J.R. Perceptual and Semantic Components of Memory for Objects and Faces: A PET Study. J. Cogn. Neurosci. 2001, 13, 430–443. [Google Scholar] [CrossRef]
  43. Flanagan, D.P.; Dixon, S.G. The Cattell-Horn-Carroll (CHC) Theory of Cognitive Abilities. In Encyclopedia of Special Education; Wiley: Hoboken, NJ, USA, 2014. [Google Scholar]
  44. Tucker-Drob, E.M.; de La Fuente, J.; Köhncke, Y.; Brandmaier, A.M.; Nyberg, L.; Lindenberger, U. A strong dependency between changes in fluidand crystallized abilities in human cognitive aging. Sci. Adv. 2022, 8, eabj2422. [Google Scholar] [CrossRef]
  45. Goddings, A.L.; Roalf, D.; Lebel, C.; Tamnes, C.K. Development of white matter microstructure and executive functions during childhood and adolescence: A review of diffusion MRI studies. Dev. Cogn. Neurosci. 2021, 51, 101008. [Google Scholar] [CrossRef] [PubMed]
  46. Kollenburg, L.; Arnts, H.; Green, A.; Strauss, I.; Vinke, S.; Kurt, E. The cingulum: Anatomy, connectivity and what goes beyond. Brain Commun. 2025, 7, fcaf048. [Google Scholar] [CrossRef] [PubMed]
  47. Kantarci, K.; Schwarz, C.G.; Reid, R.I.; Przybelski, S.A.; Lesnick, T.G.; Zuk, S.M.; Senjem, M.L.; Gunter, J.L.; Lowe, V.; Machulda, M.M.; et al. White matter integrity determined with diffusion tensor imaging in older adults without dementia: Influence of amyloid load and neurodegeneration. JAMA Neurol. 2014, 71, 1547–1554. [Google Scholar] [CrossRef] [PubMed]
  48. Molinuevo, J.L.; Ripolles, P.; Simo, M.; Llado, A.; Olives, J.; Balasa, M.; Antonell, A.; Rodriguez-Fornells, A.; Rami, L. White matter changes in preclinical Alzheimer’s disease: A magnetic resonance imaging-diffusion tensor imaging study on cognitively normal older people with positive amyloid beta protein 42 levels. Neurobiol. Aging 2014, 35, 2671–2680. [Google Scholar] [CrossRef]
  49. Hoy, A.R.; Ly, M.; Carlsson, C.M.; Okonkwo, O.C.; Zetterberg, H.; Blennow, K.; Sager, M.A.; Asthana, S.; Johnson, S.C.; Alexander, A.L.; et al. Microstructural white matter alterations in preclinical Alzheimer’s disease detected using free water elimination diffusion tensor imaging. PLoS ONE 2017, 12, e0173982. [Google Scholar] [CrossRef]
Figure 1. Flowchart of inclusion of subjects with DTI (A) or T1-weighted (B) images with corresponding cognitive data. CC: crystallized cognition; DTI: diffusion tensor images; FA: Fractional Anisotropy; FC: fluid cognition; FWF: free water fraction; HCP: Human Connectome Project; MD: Mean Diffusivity; ND: neurite density index; NODDI: Neurite Orientation Dispersion and Density Imaging; OD: orientation dispersion index; TMT: Trail Making Test.
Ctn 10 00005 g001
Figure 2. Voxel-wise associations between DTI/NODDI metrics and four cognitive measures (AD) assessed using TBSS. Maps display 1-p values from voxel-wise regression analyses, corrected for multiple comparisons using threshold-free cluster enhancement (TFCE; p < 0.05), with age, sex, and years of education included as covariates. Statistical results are projected onto the mean FA skeleton representing main white matter tracts (shown in green; FA threshold = 0.2). Significant positive and negative associations are shown using red–yellow and light blue–blue color scales, respectively, corresponding to voxels surviving the p < 0.05 threshold.
Ctn 10 00005 g002
Figure 3. Vertex-wise regression analysis of crystallized (A,B) and fluid cognition (C,D) with cortical thickness and volume, controlling for age, sex and years of education (cluster corrected, p < 0.05). Arrows indicate cortical regions showing statistically significant associations, which are listed in Table 3. The light blue-to-yellow color scale represents −log10(p) values, with warmer colors indicating greater statistical significance.
Ctn 10 00005 g003
Figure 4. Vertex-wise regression analysis of Trail Making Test A (A,B) and B (C,D) with cortical thickness and volume, controlling for age, sex and years of education (cluster corrected, p < 0.05). The arrows denote the regions with significance which are listed in Table 3. The values in the light blue–yellow scale denote −log10|p|.
Ctn 10 00005 g004
Figure 5. Heatmaps of all correlation coefficient (R) values between volumes of cortical and subcortical regions and white matter tracts FA. Supplemental Figure S1 shows a limited heatmap of the ROIs with absolute r > 0.5 in Pearson’s correlation.
Ctn 10 00005 g005
Figure 6. Heatmaps of all correlation coefficient (R) values between volumes of cortical and subcortical regions and white matter tracts MD. Supplemental Figure S1 shows a limited heatmap of the ROIs with absolute r > 0.5 in Pearson’s correlation.
Ctn 10 00005 g006
Figure 7. Heatmaps of all correlation coefficient (R) values between volumes of cortical and subcortical regions and white matter tracts ND (p < 0.05, FDR corrected). Supplemental Figure S1 shows a limited heatmap of the ROIs with absolute r > 0.5 in Pearson’s correlation.
Ctn 10 00005 g007
Figure 8. Heatmaps of all correlation coefficient (R) values between volumes of cortical and subcortical regions and white matter tracts FWF (p < 0.05, FDR corrected). Supplemental Figure S1 shows a limited heatmap of the ROIs with absolute r > 0.5 in Pearson’s correlation.
Ctn 10 00005 g008
Table 1. Demographics and characteristics of the studied population.
CharacteristicTotal Number of Subjects (n = 725)
Age (years)60.35 ± 15.73
Education (years)17.48 ± 2.21
Sex—male 319 (44%)
Race
 White525 (72.4%)
 Black101 (13.9%)
 Asian52 (7.2%)
 more than one race31 (4.3%)
 American Indian2 (0.3%)
 unknown14 (1.9%)
TMT-A 30.38 ± 12.98
TMT-B 76.52 ± 59.04
Fluid Cognition component99.11 ± 12.58
Crystalized Cognition component 110.93 ± 9.19
Values are presented as frequency (percentage) or mean ± standard deviation.
Table 2. Summary of 1-p value maps of top 14 tracts (sorted by minimum p values > number of voxels > neuroimaging metrics) from each cluster in regression analysis of DTI indices (TBSS) with crystallized cognition (a), fluid cognition (b), trail making tests A (c) and B (d) (corrected by TFCE, p < 0.05), adjusting by age, sex and education.
White Matter TractNumber of VoxelsMinimum p ValuesNeuroimaging Metrics
a. Crystallized Cognition
Anterior corona radiata—Left1131;1449;8590.002;0.01;0.008FA;MD;ND
Anterior corona radiata—Right877;1074;5830.002;0.01;0.008FA;MD;ND
Body of corpus callosum1983;2084;8420.002;0.01;0.008FA;MD;ND
Genu of corpus callosum1213;8950.002;0.01FA;MD
Middle cerebellar peduncle1672;8710.002;0.06FA;OD
Posterior corona radiata—Left5100.008ND
Posterior corona radiata—Right5430.008ND
Posterior thalamic radiation—Left6390.06OD
Posterior thalamic radiation—Right6140.06OD
Splenium of corpus callosum1246;1099;14010.002;0.01;0.008FA;MD;ND
Superior corona radiata—Left969;8420.01;0.008MD;ND
Superior corona radiata—Right1205;11180.01;0.008MD;ND
Superior longitudinal fasciculus—Left1262;1392;1418;7300.002;0.01;0.008;0.06FA;MD;ND;OD
Superior longitudinal fasciculus—Right1000;1050;1126;5390.002;0.01;0.008;0.06FA;MD;ND;OD
b. Fluid Cognition
cerebellar peduncle—Left1050.014FA
cerebellar peduncle—Right1780.014FA
Corticospinal tract—Left1540.014FA
Corticospinal tract—Right890.014FA
Inferior cerebellar peduncle—Left890.014FA
Inferior cerebellar peduncle—Right650.014FA
Middle cerebellar peduncle1460.014FA
Medial lemniscus—Left1300.014FA
Medial lemniscus—Right1050.014FA
Posterior corona radiata—Left840.028FA
Retrolenticular part of the internal capsule—Left2950.042FA
Superior cerebellar peduncle—Left1950.014FA
Superior cerebellar peduncle—Right2680.014FA
Superior longitudinal fasciculus—Left5740.028FA
c. Trail Making Test A
Anterior corona radiata—Left1467;1873;1271;8020.002;0.002;0.004;0.002FA;MD;ND;FWF
Anterior corona radiata—Right1180;1423;974;9580.002;0.002;0.004;0.002FA;MD;ND;FWF
Body of corpus callosum2640;2372;402;609;1559;24390.002;0.002;0.004;0.004;0.004;0.002FA;MD;ND;ND;OD;FWF
Genu of corpus callosum1681;1660;418;6960.002;0.002;0.004;0.002FA;MD;ND;FWF
Middle cerebellar peduncle1853;1186;7370.002;0.004;0.002FA;OD;FWF
Posterior corona radiata—Left5000.004ND
Posterior corona radiata—Right4550.004ND
Posterior thalamic radiation—Left803;7710.002;0.004FA;OD
Posterior thalamic radiation—Right1131;9200.002;0.004FA;OD
Splenium of corpus callosum2033;1517;18410.002;0.004;0.002FA;OD;FWF
Superior corona radiata—Left1194;1025;7370.002;0.004;0.002MD;ND;FWF
Superior corona radiata—Right1399;1153;7690.002;0.004;0.002MD;ND;FWF
Superior longitudinal fasciculus—Left959;1243;1246;6720.002;0.002;0.004;0.004FA;MD;ND;OD
Superior longitudinal fasciculus—Right1074;1292;1079;3560.002;0.002;0.004;0.004FA;MD;ND;OD
d. Trail Making Test B
Anterior corona radiata—Left1554;1907;1638;1730.004;0.002;0.004;0.002FA;MD;ND;FWF
Anterior corona radiata—Right1456;1490;1238;5260.004;0.002;0.004;0.002FA;MD;ND;FWF
Anterior limb of the internal capsule—Right6580.002FWF
Body of corpus callosum3101;3143;2403;1119;20320.004;0.002;0.004;0.008;0.002FA;MD;ND;OD;FWF
External capsule—Left5760.002FWF
Genu of corpus callosum1768;1825;9780.004;0.002;0.004FA;MD;ND
Middle cerebellar peduncle2048;1432;11320.004;0.002;0.004FA;MD;ND
Posterior corona radiata—Right5350.002FWF
Posterior limb of the internal capsule—Right5920.002FWF
Splenium of corpus callosum1916;1948;1369;871;19910.004;0.002;0.004;0.008;0.002FA;MD;ND;OD;FWF
Superior corona radiata—Left1228;1189;6660.002;0.004;0.002MD;ND;FWF
Superior corona radiata—Right1465;1409;6500.002;0.004;0.002MD;ND;FWF
Superior longitudinal fasciculus—Left1217;1334;1426;6490.004;0.002;0.004;0.008FA;MD;ND;OD
Superior longitudinal fasciculus—Right1184;1400;13440.004;0.002;0.004FA;MD;ND
Table 3. Summary of vertex-wise regression analysis of crystallized cognition (a), fluid cognition (b), trail making tests A (c) and B (d) with cortical thickness and volume, controlling for age, sex and years of education (cluster corrected, p < 0.05).
RegionSize (mm2)CW-pCW-pMinCW-pMax
a. Crystallized Cognition
ThicknessPostcentral—Left2297.60.0002<0.000010.0004
Supramarginal—Left1152.770.01970.017130.02227
Postcentral—Right3668.810.0002<0.000010.0004
Parahippocampal—Right1225.960.006190.004790.00759
VolumePrecentral—Left3898.460.0002<0.000010.0004
Lateral occipital—Left1164.080.00220.00140.003
Inferior temporal—Right3608.250.0002<0.000010.0004
Transverse temporal—Right2776.650.0002<0.000010.0004
Precentral—Right935.860.012160.010170.01415
b. Fluid Cognition
ThicknessSuperior frontal—Left1647.910.00120.00060.0018
VolumePostcentral—Left2150.130.0002<0.000010.0004
Pericalcarine—Right775.510.040970.037440.04449
c. Trail Making Test A
VolumeInferior parietal—Left1795.430.0002<0.000010.0004
Lateral occipital—Right841.550.024450.021680.02721
d. Trail Making Test B
ThicknessFusiform—Left1194.650.015940.013750.01832
Superior temporal—Right1378.10.005190.0040.00659
VolumePrecentral—Left5533.290.000200.0004
Supramarginal—Left3693.570.000200.0004
Paracentral—Left2128.270.000200.0004
Superior parietal—Left1885.820.000200.0004
Lateral occipital—Right1632.860.000200.0004
Inferior temporal—Right916.820.013950.011770.01613
Transverse temporal—Right858.950.022470.01990.02524
Postcentral—Right785.50.038230.034690.04175
CW-p: mean cluster-wise p value; CW-pMin: minimum cluster-wise p value; CW-pMax: maximum cluster-wise p value.
Disclaimer/Publisher’s Note: The statements, opinions and data contained in all publications are solely those of the individual author(s) and contributor(s) and not of MDPI and/or the editor(s). MDPI and/or the editor(s) disclaim responsibility for any injury to people or property resulting from any ideas, methods, instructions or products referred to in the content.