Article

Surface Aggregation Adsorption of Binary Solutions Between Diiodomethane, Furfural, and N,N-Dimethylformamide

1
Key Laboratory of Colloid & Interface Chemistry (Ministry of Education), Shandong University, Jinan 250100, China
2
National Engineering Technology Research Center of Colloidal Materials, Shandong University, Jinan 250100, China
*
Author to whom correspondence should be addressed.
Colloids Interfaces 2025, 9(5), 67; https://doi.org/10.3390/colloids9050067
Submission received: 12 September 2025 / Revised: 29 September 2025 / Accepted: 2 October 2025 / Published: 9 October 2025

Abstract

The surface tensions (σ) of binary solutions of diiodomethane (DIM, 1)–furfural (FA, 2), DIM (1)–N,N-dimethylformamide (DMF, 2), and FA (1)–DMF (2) were determined at 25 °C over the entire bulk composition range, and the surface adsorption behavior was analyzed using the surface aggregation adsorption (SAA) model proposed recently. In particular, by combining the SAA model with the Gibbs adsorption equation, the changes in the Gibbs surface excess (Γ2) and the adsorption layer thickness (τ) with the bulk composition (x2,b) were investigated. The SAA model combined with the modified Eberhart model can well describe the σ-isotherms of the three binary solutions. The surface adsorption trends of component 2 in DIM–FA, DIM–DMF, and FA–DMF decrease in turn. The change trends of Γ2 and τ with x2,b are dependent on the SAA model parameters, namely, the adsorption equilibrium constant (Kx) and the average aggregation number (n). With an increase in x2,b, Γ2 continuously increases when Kx < 2v1/[n(2n − 1)v2] (where v1 and v2 are the partial molar volumes of components 1 and 2, respectively); otherwise (i.e., Kx ≥ 2v1/[n(2n − 1)v2]), Γ2 initially increases and then decreases, showing a maximum on the Γ2-isotherm. When n ≥ 1, τ gradually decreases with an increase in x2,b; otherwise (i.e., n < 1), τ initially increases and then decreases, showing a maximum on the τ-isotherm. An increase in the adsorption trend leads to a decrease in both Γ2 and τ. This work provides a better understanding of the surface adsorption behavior of liquid mixtures.

Graphical Abstract

1. Introduction

Surface adsorption of liquid mixtures is an important interfacial phenomenon [1,2,3,4], which involves three fundamental physical quantities, namely, the surface tension, composition, and thickness of surface adsorption layers. Many techniques, such as ellipsometry [5,6], neutron reflection [7,8], mass spectrometry (combined with an indigenous cluster beam apparatus) [9], vibrational frequency spectroscopy [10,11], and metastable induced electron spectroscopy [12], have been used to determine the composition and thickness of surface layers, but it is currently difficult to accurately (or independently) obtain data over the entire composition range. Owing to the fact that the surface tension of liquid mixtures is easy to accurately determine over the entire composition range, thermodynamic models are typically used to predict (or estimate) the composition and thickness of surface layers from the surface tension data [8,13,14,15,16,17,18,19,20,21].
Many thermodynamic (or empirical or semi-empirical) models have been developed to relate the surface properties (tension, composition, and thickness) of liquid mixtures with their bulk compositions [22,23,24,25,26,27,28,29,30,31,32,33,34,35]. However, due to the complexity of surface phenomena, existing models still lack universality [33,34]. For instance, the surface tension isotherms of binary solutions can be divided into two main types, namely, the Langmuir-type (L-type) and the sigmoid-type (S-type) [33]. Most of the existing models can reasonably describe the L-type isotherms, but not the S-type ones [33]. This is because some assumptions in establishing the models deviate from the real state of solutions. In fact, the dependence of the surface composition and thickness on the bulk composition is still not fully understood.
Recently, we proposed a thermodynamic model, called the “surface aggregation adsorption” (SAA) model, for liquid mixtures, relating the surface composition with the bulk one [33,34]. By coupling it with the modified Eberhart model [25,28], an equation with two parameters (i.e., the adsorption equilibrium constant and the average aggregation number) was developed to relate the surface tension with the bulk composition, which can well describe the L-type and S-type isotherms [33]. In addition, the SAA model and the modified Eberhart model can be combined with the Gibbs adsorption equation to calculate the Gibbs excess and thickness of adsorption layers [36]. Previous reports on the change in surface layer thicknesses with bulk compositions mainly focused on the aqueous solutions of short-chain alcohols (especially ethanol) [8,9,10,13,17,18,36], but yet no reports on non-aqueous solutions. It is interesting to understand the dependence of the thickness of surface adsorption layers (or the Gibbs excess layers) on the bulk composition.
In the current work, the surface tensions (σ) of binary solutions between diiodomethane (DIM), furfural (FA), and N,N-dimethylformamide (DMF) were determined over the entire bulk composition range, and the surface adsorption behavior was analyzed using the SAA model from the σ data. In particular, by combining the SAA model and the modified Eberhart model with the Gibbs equation, the changes in the Gibbs excess and thickness of the adsorption layer with the bulk composition were investigated. This work provides a better understanding of the surface adsorption behavior of liquid mixtures.

2. Experimental Section and Theoretical Basis

2.1. Chemicals

Diiodomethane (DIM) was purchased from Aladdin (Shanghai, China). Furfural (FA) and N,N-dimethylformamide (DMF) were purchased from Macklin (Shanghai, China). All chemicals were of analytical grade and used as received. Ultrapure water (with a resistivity of 18.25 MΩ·cm at 25.0 °C) was obtained using a Hitech-Kflow water purification system (Hitech, Shanghai, China).

2.2. Surface Tension Determination

Surface tensions of pure liquids (σ0) and their mixtures (σ) were measured at 25.0 ± 0.2 °C using a Sigma 700 automatic tensiometer (Biolin, Gothenburg, Sweden). Each test sample was equilibrated for at least 10 min before measurements. All of the tests were performed in triplicate, and their average values were reported here.

2.3. Theoretical Basis

For clarity, the theoretical basis of the SAA model [33] and the surface excess model are summarized in the following.
Let us consider a binary solution consisting of components 1 and 2, with a planar surface layer. The surface layer is considered as a homogeneous surface phase with a definite thickness (τ) [20,24,25,26,27,29,30,31,32,33,34].
The SAA model. The SAA model [33] assumes that: (1) the molecules of component 2 (commonly the surface-active component) adsorb into the surface layer, directly forming aggregates with an average aggregation number of n, and (2) the surface layer consists of surface sites, and each site is occupied by one molecule of component 1 or one aggregate formed by component 2. The adsorption equilibrium is schematically expressed as
Site - ( C 1 ) + n ( C 2 ) b u l k   K x   Site - ( n C 2 ) a g g r + ( C 1 ) b u l k
where Site represents the surface sites, (C1) and (C2) represent the molecules of components 1 and 2, respectively, (nC2)aggr represents an aggregate formed by n molecules of component 2, the subscript “bulk” represents the bulk phase, and Kx is the adsorption equilibrium constant.
Further, assume that the activity coefficients of all of the species Site-(C1), Site-(nC2)aggr, (C1)bulk, and (C2)bulk are unity. According to the adsorption equilibrium principle, the Kx can be expressed as,
K x = x a g g r x 1 , b x 1 , s x 2 , b n
where xaggr and x1,s are the mole fractions of aggregates and component 1 in the surface phase, respectively, and x1,b and x2,b are the mole fractions of components 1 and 2 in the bulk phase, respectively.
Assuming that the partial molar volume of aggregates (vaggr) equals n times that of component 2 in the surface phase (v2,s), i.e., vaggr = nv2,s, Equation (2) can be written as
K x * = ϕ 2 , s x 1 , b ϕ 1 , s x 2 , b n
where ϕ1,s and ϕ2,s are the volume fractions of components 1 and 2 in the surface phase, and Kx*2,sKx/ν1,s, here v1,s is the partial molar volume of component 1 in the surface phase.
Considering ϕ1,s + ϕ2,s = 1 and x1,b + x2,b = 1, from Equation (3) one has
ϕ 2 , s = K x * x 2 , b n 1 x 2 , b + K x * x 2 , b n
Equation (4) is the SAA model equation. If n = 1, Equation (4) becomes the Langmuir-like model [33,37].
Since the surface compositions are now difficult to determine, the estimation of the two parameters (Kx and n) requires another independent equation that connects the surface compositions with the surface tension. A suitable and widely used equation is the modified Eberhart mixing rule [25,28], which is represented as
σ = ϕ 1 , s σ 1 0 + ϕ 2 , s σ 2 0
where σ is the surface tension of binary liquid mixtures, and σ10 and σ20 are the surface tensions of pure components 1 and 2, respectively. Equation (5) gives πr = ϕ2,s, where πr is the reduced surface pressure (πr) [27], defined as πr = (σ10σ)/(σ10σ20). According to Equation (5), the surface composition can be obtained only from σ data.
Combining Equations (4) and (5) gives
σ = σ 1 0 K x * x 2 , b n x 1 , b + K x * x 2 , b n σ 1 0 σ 2 0
π r = K x * x 2 , b n 1 x 2 , b + K x * x 2 , b n
Equation (7) can be written in a linear form as
lg π r ( 1 x 2 , b ) 1 π r = lg K x * + n lg x 2 , b
Equation (8) indicates that the plot of lg[πr(1 − x2,b)/(1 − πr)] vs. lgx2,b should be a straight line, and the values of n and Kx* (and thus Kx) can be estimated from its slope and intercept.
Adsorption free energy. Based on the adsorption equilibrium principle, the standard Gibbs free energy change in adsorption per mole of component 2 (∆Gad0) can be represented as [33]
Δ G ad 0 = R T n ln K x
where R is the universal gas constant and T is the absolute temperature. Equation (9) indicates that the adsorption tendency is determined by Kx and n. For positive adsorption (Kx > 1 and ∆Gad0 < 0), larger Kx and smaller n correspond to a stronger adsorption tendency (i.e., a larger |∆Gad0|).
The surface excess. The surface excess (or adsorption amount) is a relative quantity characterizing the difference in compositions between the surface phase and the bulk phase. There exist different definitions for the surface excess [24], among which the most widely used is the Gibbs surface excess.
At constant T and pressure (p), and assuming the activity coefficients of all components being unity, the Gibbs adsorption equation can be expressed as [1]
Γ 2 = x 2 , b R T d σ d x 2 , b
where Γ2 is the Gibbs surface excess of component 2, defined by the Gibbs dividing surface (a zero-volume dividing surface within the surface layer, located at the position with zero surface excess of component 1) [1]. Guggenheim and Adam [24] elucidated the physical meaning of the Gibbs excess, i.e., the difference between the amount of adsorbate (here component 2) contained in the adsorbed layer per unit area and that contained in the bulk solution with the same amount of solvent (here component 1) as the adsorbed layer [13,16,17].
Combining Equation (10) with Equation (6) gives,
Γ 2 = K x * x 2 , b n ( n x 1 , b + x 2 , b ) R T ( x 1 , b + K x * x 2 , b n ) 2 σ 1 0 σ 2 0
This is the algebraic expression for the Gibbs surface excess, which can be used to calculate Γ2 over the entire concentration range (x2,b = 0–1) with the parameters Kx* and n obtained from the SAA model. For simplicity, Equation (11) may be called the Gibbs-SAA equation.
From Equation (11), the limiting values of Γ2 at x2,b → 0 and x2,b → 1, denoted as Γ2(x→0) and Γ2(x→1), respectively, can be obtained as
lim x 2 , b 0 Γ 2 Γ 2 ( x 0 ) = 0
lim x 2 , b 1 Γ 2 Γ 2 ( x 1 ) = 1 R T K x * σ 1 0 σ 2 0
At x2,b→0, Γ2 = 0, an expected result; while at x2,b→1, Γ2 > 0 (i.e., Γ2 ≠ 0), arising from the definition (or physical meaning) of the Gibbs surface excess [1,22,24]. A strong adsorption trend (i.e., large Kx* or Kx) results in a low Γ2(x→1). Over the entire concentration range (x2,b = 0–1), Γ2 ≥ 0, indicating positive adsorption of component 2 with lower surface tension (σ20 < σ10).
In addition, the surface excess can be expressed by the difference in the absolute concentrations between the surface and bulk phases, called “the absolute surface excess”:
Δ Φ 2 = ϕ 2 , s ϕ 2 , b
Δ X 2 = x 2 , s x 2 , b
where ΔΦ2 and ΔX2 are the surface excess expressed by the mole and volume fractions, respectively, for component 2.
Adsorption layer thickness. Based on the Gibbs equation and the SAA model, an equation for predicting the adsorption layer thickness τ can be established [36]. According to the physical meaning of the Gibbs excess Γ2 [1,24], one has,
Γ 2 = τ v 2 ϕ 2 , s ϕ 1 , s ϕ 1 , b ϕ 2 , b
Note that the term in the bracket is the Gibbs surface excess expressed in volume fraction (defined by the Gibbs dividing surface). Let ΔΦ2(1)ϕ2,sϕ1,s ϕ2,b/ϕ1,b. The ΔΦ2(1) values can be calculated using the modified Eberhart mixing rule Equation (5) from the σ data. At ϕ2,b → 1 (or x2,b → 1), one has
lim x 2 , b 1 Δ Φ 2 ( 1 ) Δ Φ 2 ( x 1 ) ( 1 ) = 1 1 n K x
Strong adsorption trends (large nKx) lead to large ΔΦ2(x→1)(1). If nKx = 1 (or n = 1 and Kx = 1), ΔΦ2(x→1)(1) = 0, corresponding to the ideal state.
Combining Equation (16) with Equations (3), (4), and (11) gives
τ = v 1 , s v 2 , s n K x ( n x 1 , b + x 2 , b ) R T ( v 1 , s x 1 , b + v 2 , s n K x x 2 , b n ) ( n K x x 2 , b 1 n ) σ 1 0 σ 2 0
Equation (18) is the adsorption layer thickness (ALT) equation, which can predict τ over the entire bulk concentration range. Note that the physical meaning of the so-obtained τ is the thickness of the surface excess layer, rather than that of the “real” surface layer of liquids. The thickness of the surface excess layer is determined only by its composition difference with the bulk phase, while that of the “real” surface layer is determined by all physical properties different from the bulk phase (such as density besides composition [6]).
If Kx = 1 and n = 1, Equation (18) gives τ → ∞, which is reasonable, because the condition (Kx = 1 and n = 1) corresponds to the “ideal” state, i.e., no surface adsorption occurs (with τ → ∞ or τ = 0). It should be noted that, for the binary systems with n ≤ 1, the ALT equation is applicable over the entire x2,b range, but for those with n > 1, it gives unreasonable (negative or infinite) τ at extremely low x2,b (i.e., when x2,b ≤ (1/nKx)1/(n−1)). For example, for a binary system with n = 1.27 and Kx = 6.37 (corresponding to the DIM-FA system, see Section 3.1), Equation (18) gives negative or infinite τ at x2,b ≤ 4.3 × 10⁻⁴. When Kx > 1 and n > 1, the σ-isotherm is S-type [33]. That is, Equation (18) is not fully applicable to systems with S-type isotherms. This is because the modified Eberhart mixing rule Equation (5) is an empirical equation [29], not a thermodynamic one. It can be seen from Equation (16) that if Equation (5) gives ΔΦ2(1) ≤ 0 while the Gibbs equation (Equation (10)) gives Γ2 > 0, an unreasonable negative or infinite τ will be obtained. In fact, a more reasonable scenario is that, at x2,b → 0 (or ϕ2,s → 0), no surface aggregation occurs, i.e., n = 1 (rather than n > 1). Therefore, for the systems with n > 1, the τ at extremely low x2,b can be estimated by extrapolating τ at x2,b > (1/nKx)1/(n−1) to x2,b = 0.
From Equation (18), the limiting τ values at x2,b → 0 (with n ≤ 1) and x2,b→1, denoted as τx→0 and τx→1, respectively, can be obtained as
lim x 0 τ τ x 0 = v 2 , s K x R T ( K x 1 ) σ 1 0 σ 2 0 ( for   n = 1 )
lim x 0 τ τ x 0 = v 2 , s n R T σ 1 0 σ 2 0 ( for   n < 1 )
lim x 1 τ τ x 1 = v 1 , s R T ( n K x 1 ) σ 1 0 σ 2 0
Equations (19)–(21) indicate that strong adsorption trend (i.e., large Kx and low n) results in small τx→0 and τx→1, similar to the case of Γ2(x→1). In addition, τx→0 is related to v2,s while τx→1 to v1,s, which are consistent with the physical meaning of τ thus obtained.

2.4. Model Fitting

The model fitting for test data was performed using Origin2016 software with the Levenberg−Marquardt algorithm. The best-fit values of model parameters were automatically obtained from the software, which correspond to the minimum sum of squares of residuals. The average absolute deviation (AAD) and the average relative deviation (ARD) were used as accuracy criteria, which are represented as
AAD = 1 m i = 1 m X exp X cal
ARD = 100 % m i = 1 m X exp X cal X exp
where Xexp and Xcal are the experimental and model-calculated values of the physical quantity X, and m represents the number of data points. Low AAD and ARD values indicate that the model fits the experimental data well.

3. Results and Discussion

Based on the SAA model, the Gibbs-SAA equation, and the ALT equation, we investigated the surface adsorption behavior of three binary solutions: DIM (1)–FA (2), DIM (1)–DMF (2), and FA (1)–DMF (2). Table 1 shows the physical properties of pure liquids (DIM, FA, and DMF) involved here, including their relative molar masses (Mr), densities (ρ0, at 25 °C) and critical densities (ρc0) [38]. Their bulk molar volumes (vb0, at 25 °C) and critical molar volumes (vc0) were calculated using Mr, ρ0, and ρc0, which are also listed in Table 1. Note that the vc0 and ρc0 values of DIM were estimated using the Wetere method [38]. The surface tensions (σ0) of the pure liquids DIM, FA, and DMF were determined here at 25 °C to be 49.04, 43.10, and 36.40 mN/m, respectively, which are very close to the literature-reported values (ca. 50.0–50.55, 43.0–43.10, and 36.52–36.98 mN/m, respectively) [38,39,40,41,42,43,44,45,46], indicating that the σ data determined here are credible.
In the following model calculations, let v1,s/v2,s = v1,b/v2,b and assume the partial molar volume of component i is equal to its molar volume (vi = vi0) [22]. In addition, assume that the amount of matter of the surface phase is significantly lower than that of the bulk phase, that is, the surface adsorption does not induce a change in the bulk composition [21].

3.1. Surface Aggregation Adsorption

The surface tensions of DIM (1)–FA (2), DIM (1)–DMF (2), and FA (1)–DMF (2) binary solutions were determined at 25.0 °C over the entire x2,b range. The σ and πr data are shown in Tables S1–S3 in the Supporting Information (SI).
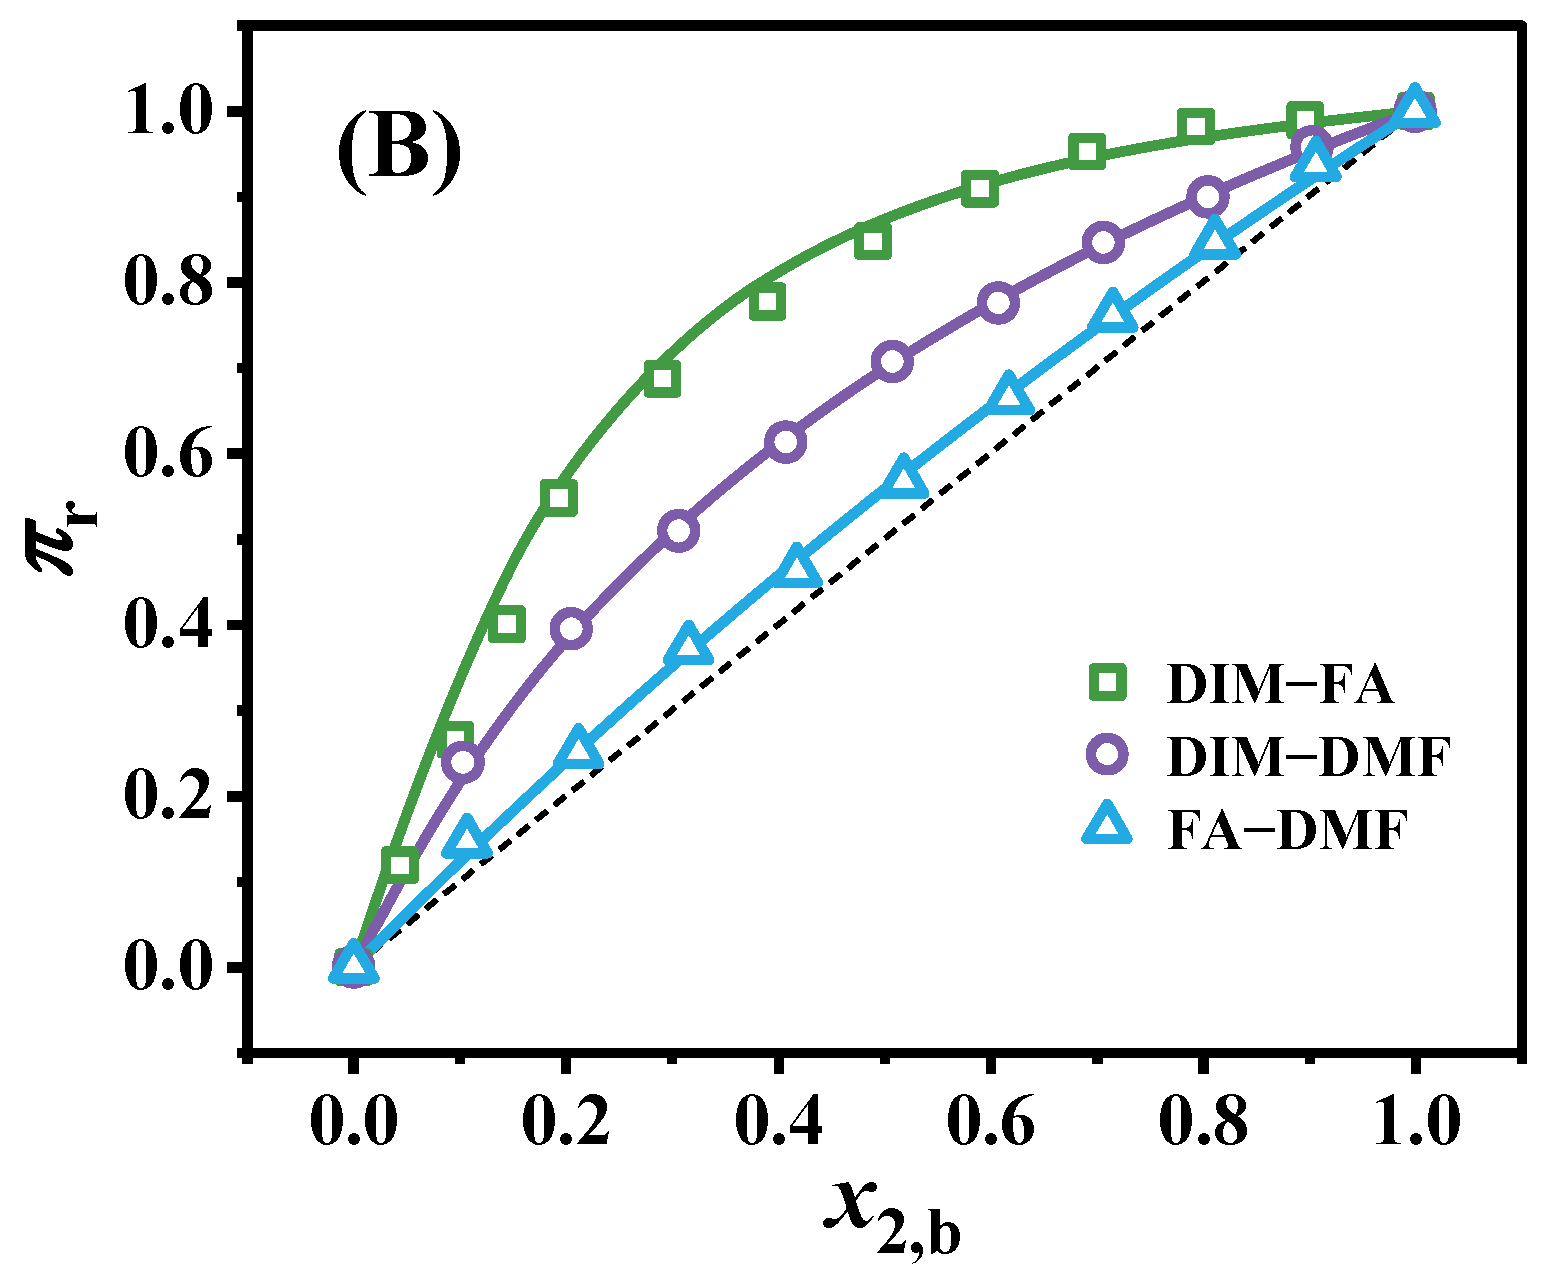
Figure 1 shows the isotherms of σ and πr versus x2,b for the three binary solutions. With an increase in x2,b, σ gradually decreases and πr gradually increases, showing the characteristics of conventional L-type isotherms [33]. Based on the modified Eberhart mixing rule [28], πr = ϕ2,s, thus the πr–isotherms are the isotherms of ϕ2,s versus x2,b. For the three binary solutions, their πr isotherms are above the “ideal” correlation line (as marked with the dotted line), indicating the positive adsorption of component 2 occurs. This is reasonable due to σ20 < σ10 for the three systems. The πr values at given x2,b increase in turn for DIM (1)–FA (2), DIM (1)–DMF (2), and FA (1)–DMF (2), indicating their adsorption trends increase in turn.
The πrx2,b data of the three binary solutions were linearly fitted using Equation (8), as shown in Figure 2. All of the plots of lg[πr(1 − x2,b)/(1 − πr)] versus lgx2,b show good straight lines, with the adjusted coefficients of determination being 0.988, 0.995, and 0.993 for DIM–FA, DIM–DMF, and FA–DMF, respectively. From the slopes and intercepts of the plots, the n and Kx* of the three solutions were estimated, and the Kx was then obtained, which are listed in Table 2, where the standard deviations of the best-fitted n and lgKx* values were less than 0.05 and 0.04, respectively. For all of the three systems, Kx > 1, corresponding to positive adsorption.
The σx2,b and πrx2,b curves of the three binary solutions were then calculated using Equations (6) and (7), respectively, with the n and Kx* values thus obtained (Table 2), which are also shown in Figure 1. All of the model curves coincide well with the experimental data. The AAD and ARD of the model-predicted σ values with the experimental ones are listed in Table 2, which are less than 0.06 mN/m and 0.15%, respectively. These results indicate that the SAA model is reasonable, which can well describe the σ or πr–isotherms of the three binary solutions.
It should be noted that for DIM–DMF and FA–DMF systems, Kx > 1 and n ≤ 1, consistent with the L-type isotherms intuitively observed [33]. However, for the DIM–FA system, Kx > 1 and n > 1, which actually correspond to the S-type isotherms [33], different from the L-type isotherm intuitively observed. This is because the negative deviation of πr from the ideal correlation line at extremely low x2,b (x2,b < 2.7 × 10⁻³) is too small to appear on the figure. The πrx2,b data of the DIM–FA were also nonlinearly fitted using the Langmuir-like model (Equations (4) or (7) with n = 1), showing the best-fitted Kx* = 5.22 (Figure S1). The AAD and ARD obtained by the Langmuir-like model for σ data were ca. 0.14 mN/m and 0.32%, respectively, which are larger than those obtained by the SAA model (0.059 mN/m and 0.13%, respectively). This indicates that the SAA model can better describe the σ or πr–isotherms of the DIM–FA system than the Langmuir-like model (Figure S1).
In addition, the ∆Gad0 of the three systems at 25.0 °C was calculated using Equation (9) with the Kx and n values obtained, listed in Table 2. The ∆Gad0 values of the three systems are all negative, indicating that the surface adsorption is spontaneous. For DIM–FA, DIM–DMF, and FA–DMF, the absolute ∆Gad0 (|∆Gad0|) values decrease in turn, indicating the adsorption trends decrease in turn, consistent with their πr–isotherms observed (Figure 1B).

3.2. The Surface Excess

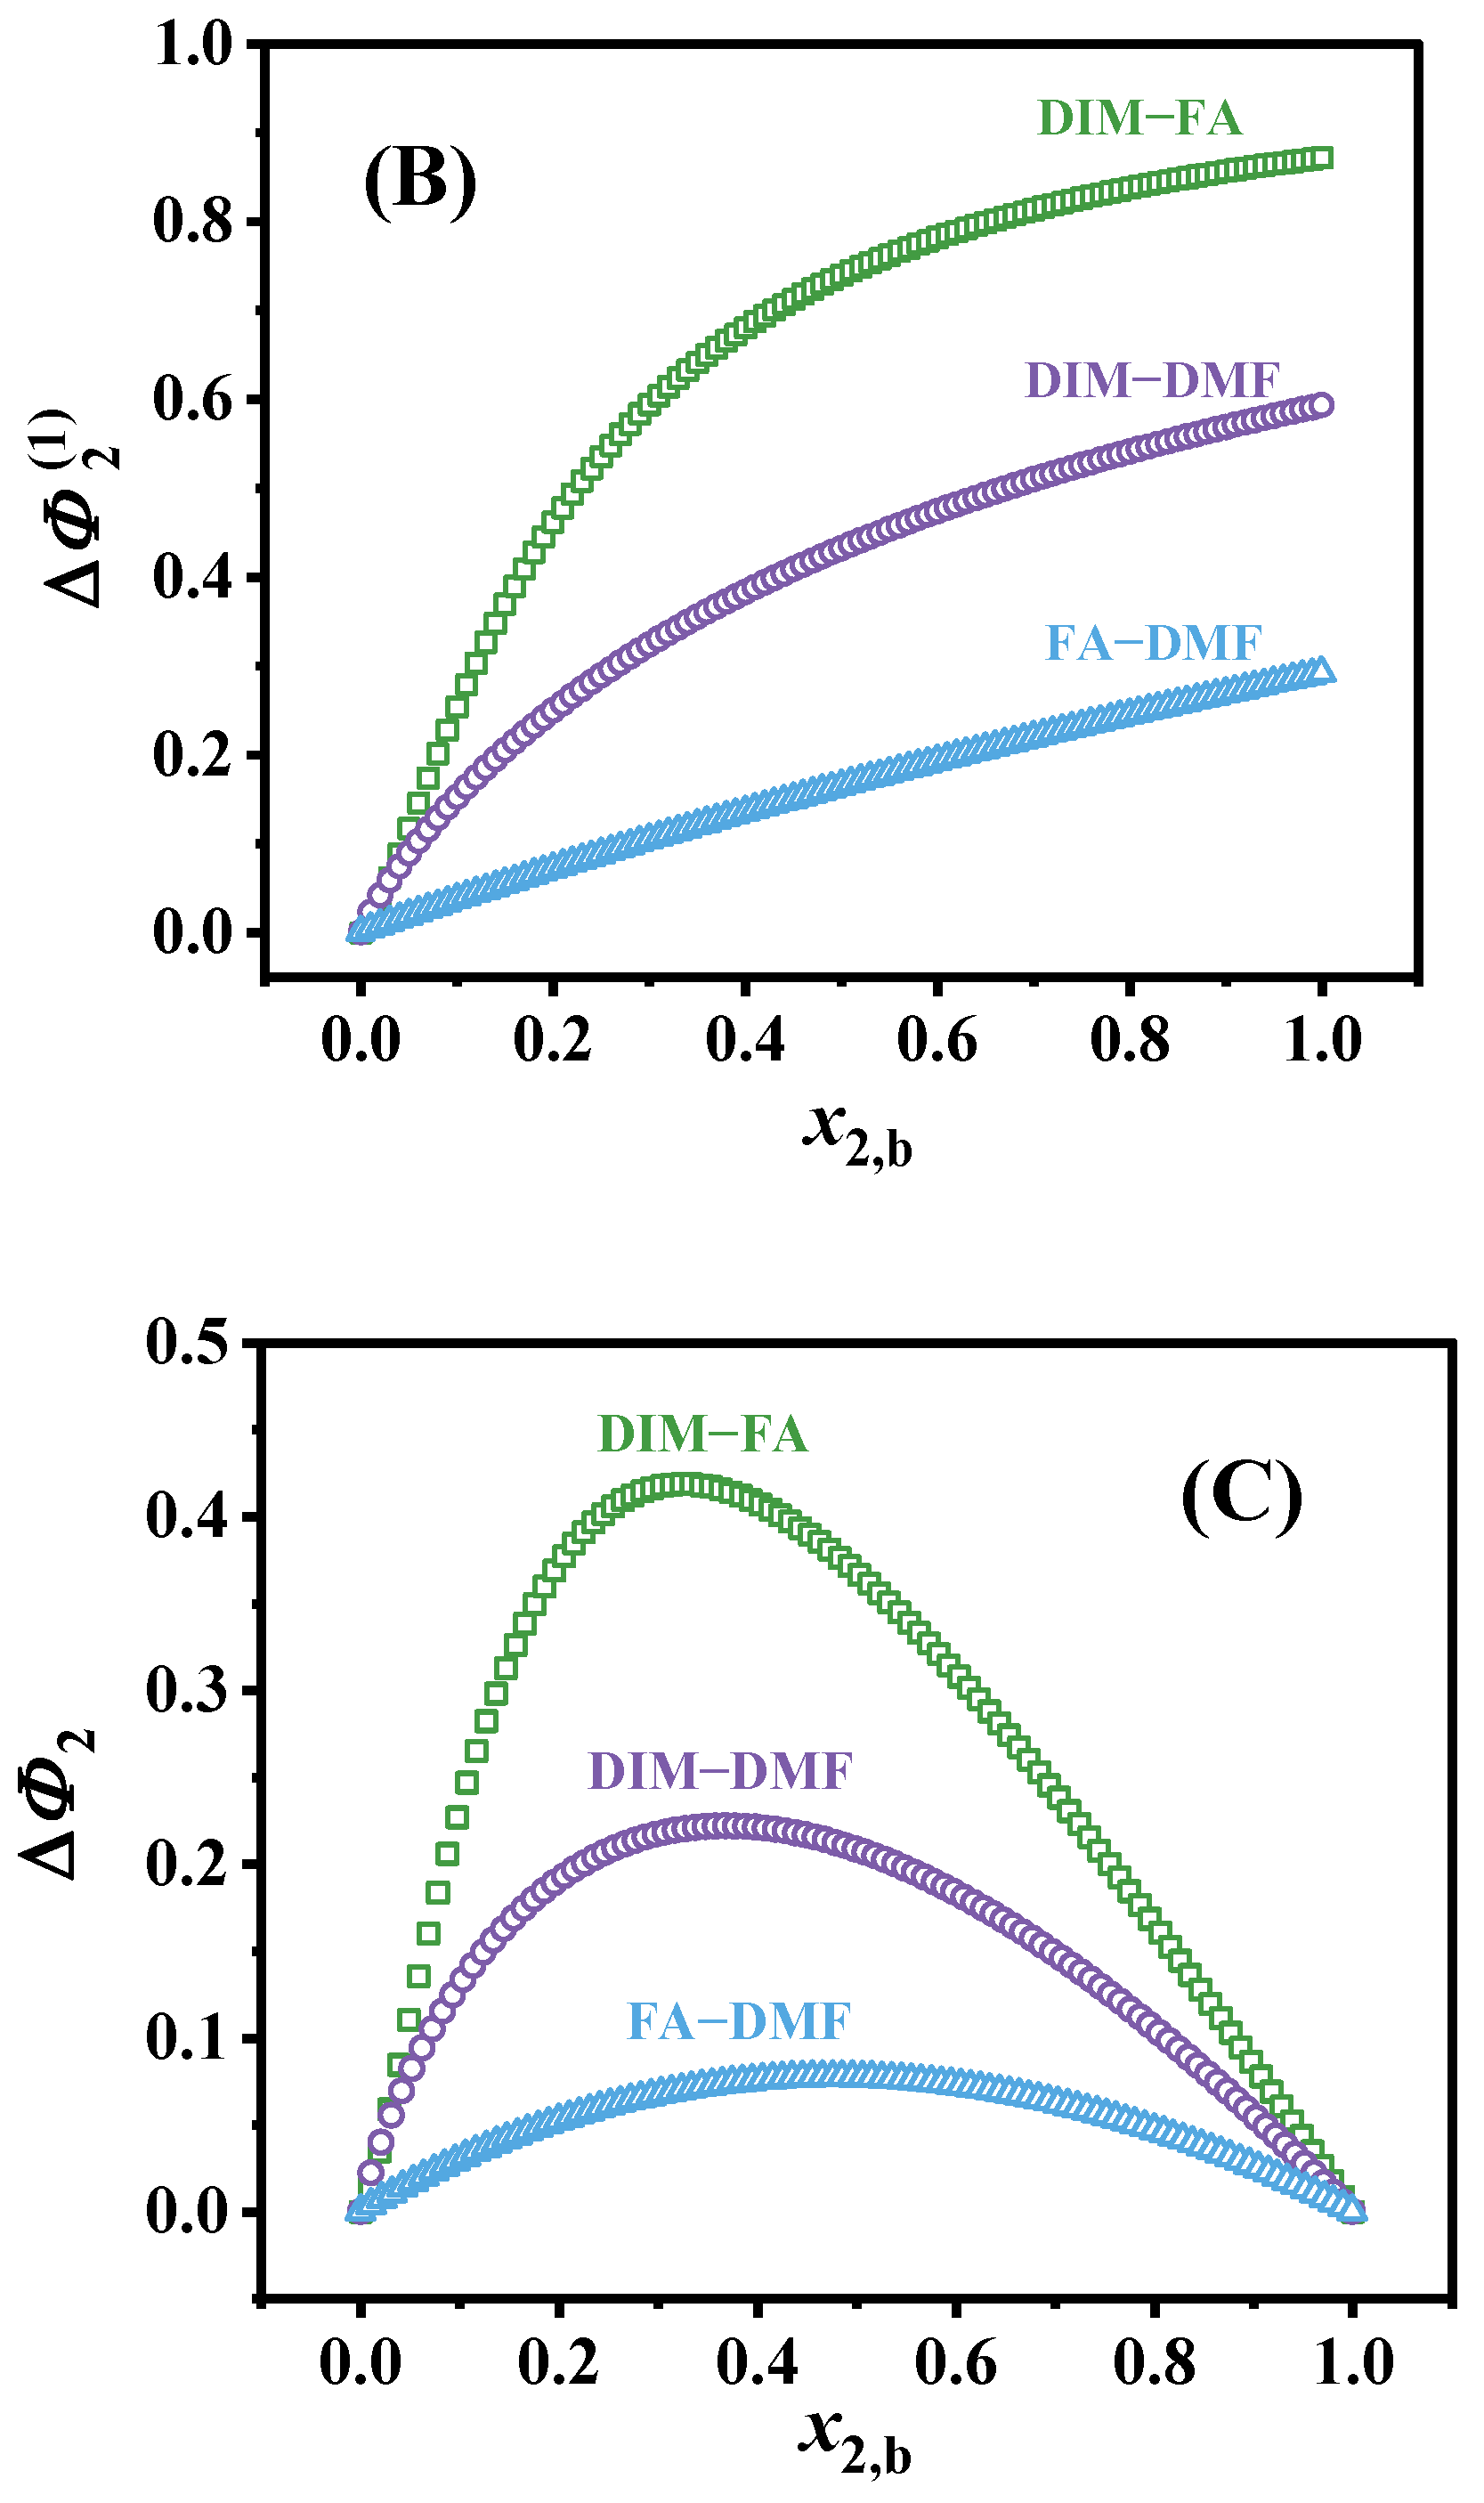
The Gibbs excess Γ2 values at different x2,b were calculated using the Gibbs-SAA equation (Equation (11)), as shown in Figure 3A. The change of Γ2 with x2,b exhibits different trends for the three systems. For DIM–FA, with an increase in x2,b, its Γ2 initially increases and then decreases, showing a maximum at x2,b ≈ 0.20. This result is similar to those of binary aqueous solutions of short-chain alcohols [24,36,47]. For DIM–DMF, Γ2 initially rapidly increases and then gradually reach equilibrium; while for FA–DMF, its Γ2 continuously (almost linearly) increases. The shape of Γ2-isotherms is determined by Kx* and n values. Owing to the fact that dΓ2/dx2,b ≥ 0 at x2,b → 0, if dΓ2/dx2,b ≤ 0 at x2,b → 1, a maximum Γ2 will appear on the Γ2-isotherm. Therefore, it can be derived that only when Kx* ≥ 2/(2n − 1) (or Kx ≥ 2v1,s/[n(2n − 1)v2,s]), there exists a maximum on Γ2-isotherm. In addition, the Γ2(x→1) values of DIM–FA, DIM–DMF, and FA–DMF were obtained to be ca. 0.29, 2.23, and 2.09 μmol/m2, which are listed in Table 3 for clarity.
The Gibbs surface excess ΔΦ2(1) and the absolute surface excess ΔΦ2 are also shown in Figure 3 (B and C) as a function of x2,b. With an increase in x2,b, ΔΦ2(1) gradually increases. The ΔΦ2(x→1)(1) values of DIM–FA, DIM–DMF, and FA–DMF were obtained to be ca. 0.88, 0.56, and 0.28, respectively, which are listed in Table 3. Large ΔΦ2(1) corresponds to the strong adsorption trend. In addition, with an increase in x2,b, ΔΦ2 initially increases and then decreases, showing a maximum. At x2,b = 0 and x2,b = 1, ΔΦ2 = 0, which is an expected result. The maximum ΔΦ2 values of DIM–FA, DIM–DMF, and FA–DMF increases sequentially, corresponding to their increasing adsorption trends. ΔΦ2(1) and ΔΦ2 can well reflect the adsorption trend of binary solutions.

3.3. Adsorption Layer Thickness

It has been demonstrated that the molar volumes of components in the surface phase (vs) are larger than those in the bulk phase (vb) [13,48,49,50,51]. Many models were suggested to estimate vs [48,49,50], and the Paquette model was chosen here, which was commonly used in the literature [13,48,49,50,51]. The Paquette model [48] can be written as
v s = v c 3 / 5 v b 2 / 5
where vc is the critical molar volume. The so-obtained vs values of pure liquids (vs0) involved here at 25 °C are shown in Table 1.
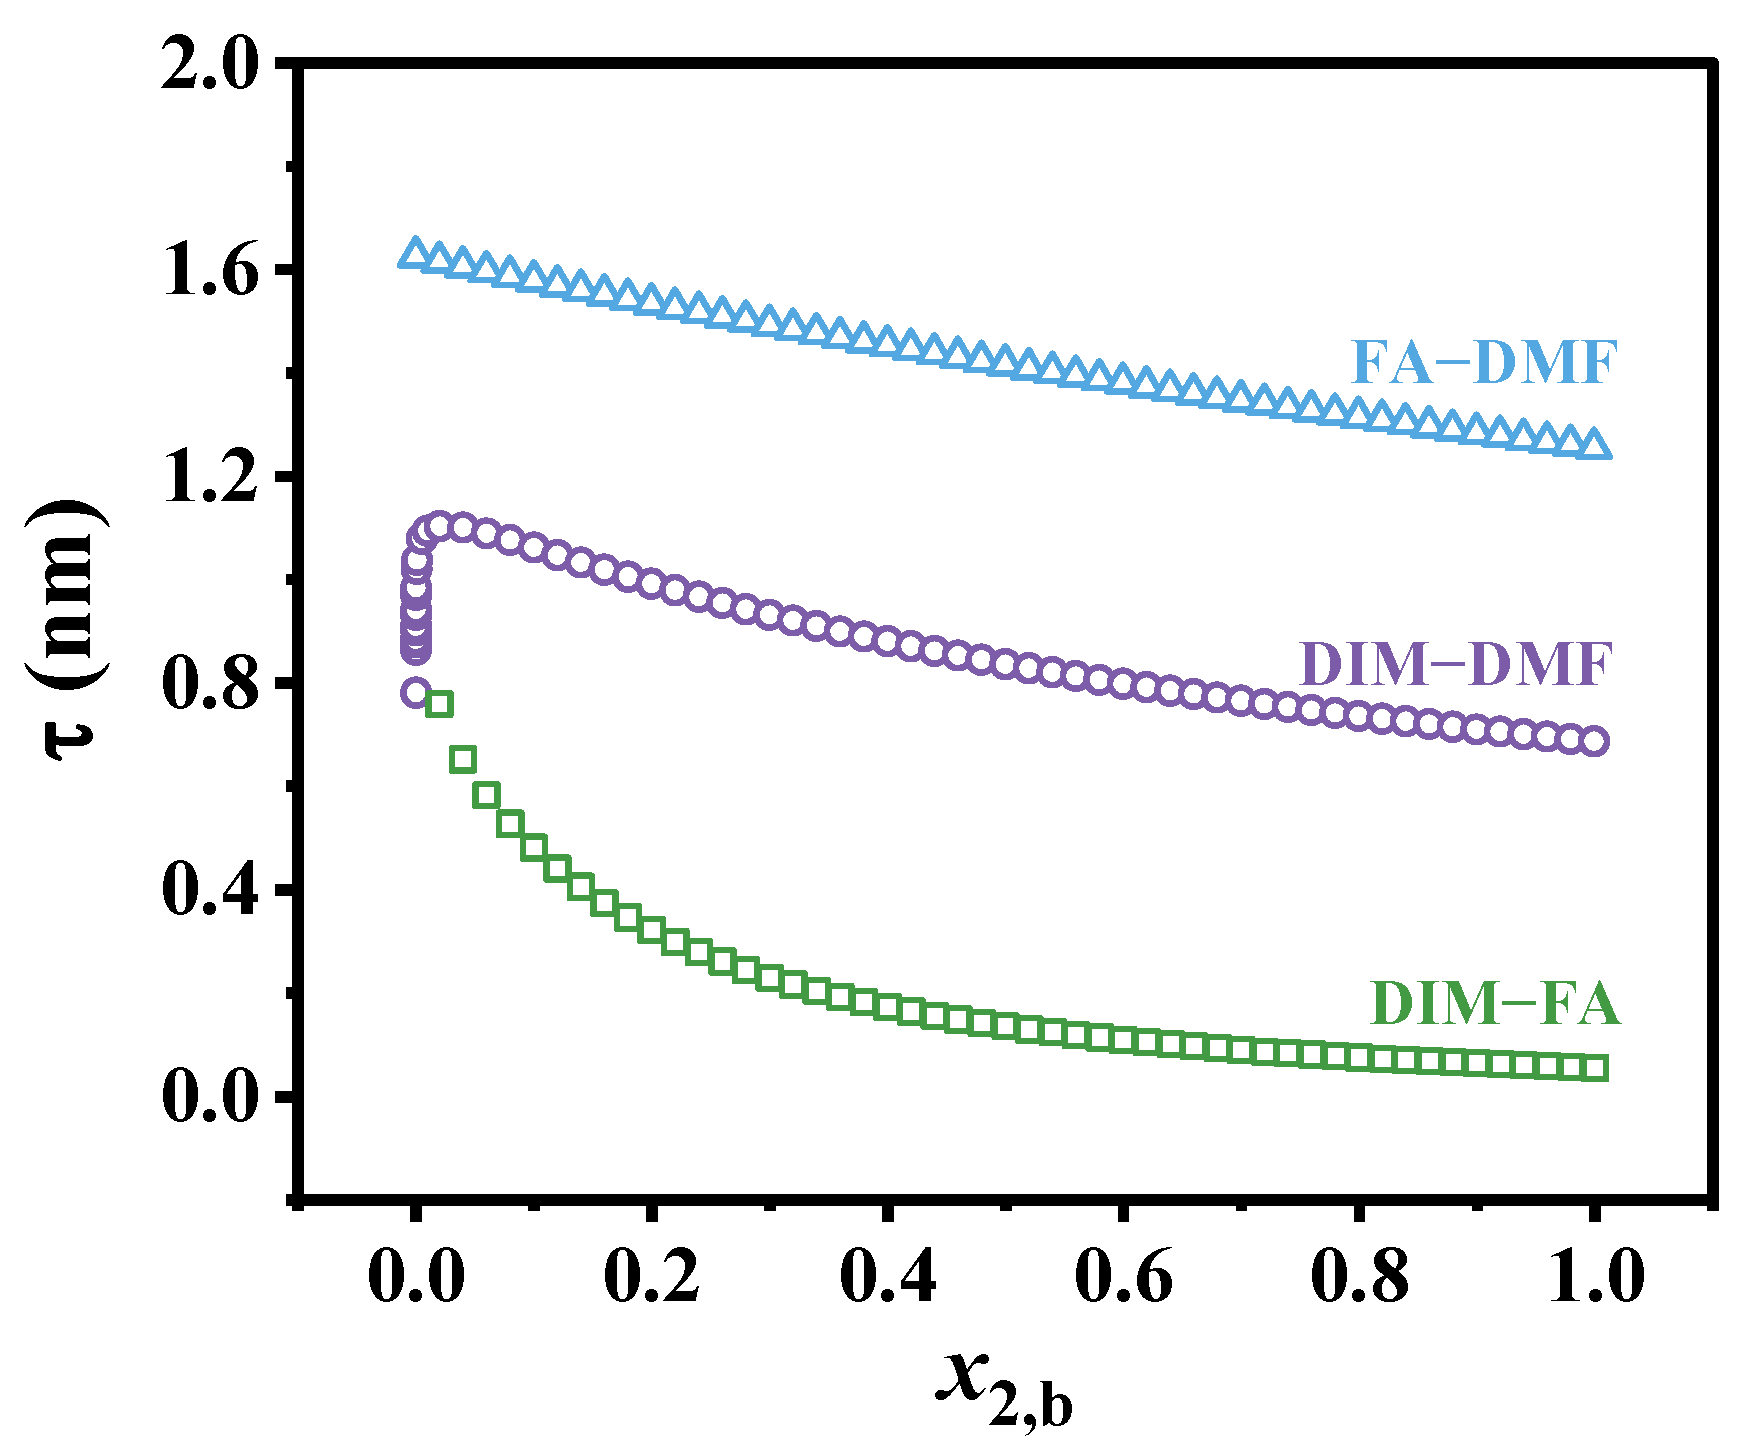
The change in τ with x2,b was calculated using the ALT equation (Equation (18)) for DIM (1)–FA (2), DIM (1)–DMF (2), and FA (1)–DMF (2) systems, as shown in Figure 4, where the partial molar volumes of component 2 in the surface phase are assumed to be equal to their molar volumes (v2.s = v2,s0). Note that for the DIM–FA system with n > 1, negative τ will be obtained at x2,b < 4.3 × 10⁻⁴, which is unreasonable, thus only the τ values at x2,b > 6 × 10⁻³ are shown here. The three systems exhibit different trends. With an increase in x2,b, for the DIM–FA system (with n > 1), its τ gradually decreases (or exponentially decays, with x2,b from 6 × 10⁻³ to 1), similar to the literature-reported results for aqueous solutions of short-chain alcohols [7,8,14,36]. For the FA–DMF system (with n = 1), its τ almost linearly decreases. However, for the DIM–DMF system (with n < 1), its τ initially sharply increases and then gradually decreases, showing a maximum at x2,b = 0.04. Similar results were reported in the literature [13,17,18] for the water-ethanol solution. These results indicate that the binary solutions with n < 1 exhibit a maximum on the τx2,b isotherms.
In addition, except in the extremely low x2,b (x2,b → 0) range, the τ values of DIM–FA, DIM–DMF, and FA–DMF increase in turn, suggesting strong adsorption leads to a small τ. The τ values observed here for the three systems (at x2,b = 0.5) are ca. 0.2–1.4 nm, which are comparable with those obtained by other models [13,14,15,18,52,53], molecular simulations [8,11,54,55], and experimental measurements [4,6,8,11,56,57,58] for various binary mixtures (0.25–1.7 nm).
The τx→0 and τx→1 of the three binary solutions were calculated using Equations (19)–(21), which are listed in Table 3. Note that the τx→0 of the DIM–FA was obtained by extrapolation (or at x2,b ≈ 6 × 10⁻³). The so-obtained τx→0 values are ca. 0.78–1.62 nm and the τx→1 values (of DIM–DMF and FA–DMF) are ca. 0.69–1.25 nm, which are comparable with the thickness of surface layers reported for pure liquids (0.45–1.43 nm) [4,6,55,58]. Note that a small τx→1 value was observed for DIM–FA (only ~0.05 nm), arising from its small Γ2(x→1) and large ΔΦ2(1) (Table 3).
Taking the side-length of the equivalent cubes of molecules in the surface phase (ls, calculated using vs0, Table 1) as a measure of the molecular size, the number of molecular layers of component 2 in the surface phase at x2,b → 0, denoted as N2(x→0), was estimated using N2(x→0) = τ(x→0)/l2,s to be 1.2, 1.2, and 2.5 for DIM–FA, DIM–DMF, and FA–DMF, respectively, which are listed in Table 3. The N2(x→0) values obtained here (ca. 1.2–2.5) suggest that the surface phase contains one to three molecular layers, which is close to those reported in the literature [4,6,13,16,26,52].

4. Conclusions

The surface tensions (σ) of binary solutions of DIM (1)–FA (2), DIM (1)–DMF (2), and FA (1)–DMF (2) were determined at 25 °C over the entire bulk composition range, and their surface adsorption behaviors were analyzed using the SAA model, the modified Eberhart model, and the Gibbs adsorption equation.
The SAA model combined with the modified Eberhart model can well describe the σ-isotherms of the three binary solutions. The surface adsorption trends of component 2 in DIM–FA, DIM–DMF, and FA–DMF decrease in turn. The change trends of the Gibbs excess Γ2 and adsorption layer thickness τ with x2,b are dependent of the Kx* or Kx and n values. With an increase in x2,b, Γ2 continuously increases when Kx* < 2/(2n − 1), while when Kx* ≥ 2/(2n − 1), Γ2 initially increases and then gradually decreases, showing a maximum on the Γ2-isotherm. When n ≥ 1, τ gradually decreases with an increase in x2,b, while when n < 1, τ initially increases and then decreases, showing a maximum on the τ-isotherm. With an increase in the adsorption trend (or |∆Gad0|), Γ2 and τ decrease while ΔΦ2(1) and ΔΦ2 increase. This work provides a better understanding of the surface adsorption behavior of liquid mixtures.

Supplementary Materials

The following supporting information can be downloaded at: https://www.mdpi.com/article/10.3390/colloids9050067/s1, Table S1: Surface tensions and compositions of DIM(1)–FA(2) binary mixtures at 25.0 °C. Table S2: Surface tensions and compositions of DIM(1)–DMF(2) binary mixtures at 25.0 °C. Table S3: Surface tensions and compositions of FA(1)–DMF(2) binary mixtures at 25.0 °C. Figure S1: (A) Nonlinear fitting plot of the Langmuir-like model for πrx2,b data of DIM–FA, with the best-fitted Kx* = 5.22; (B) The σx2,b curves of DIM–FA calculated using the Langmuir-like model (with Kx* = 5.22), showing AAD ≈ 0.14 mN/m and ARD ≈ 0.32%.

Author Contributions

Conceptualization, W.H.; methodology, W.H. and N.D.; investigation, Z.H., N.D. and W.H.; writing—original draft preparation, Z.H., N.D. and W.H.; supervision, W.H.; project administration, W.H.; funding acquisition, W.H. and N.D. All authors have read and agreed to the published version of the manuscript.

Funding

This research was funded by the National Natural Science Foundation of China (No. 22272088) to W. Hou, the National Oil & Gas Major Project of China (No. 2025ZD1403200) to N. Du, and the Natural Science Foundation of Shandong Province (China, No. ZR2025MS229) to N. Du. We would like to acknowledge the technical support from Shandong University Structural Constituent and Physical Property Research Facilities.

Data Availability Statement

The raw data supporting the conclusions of this article will be made available by the authors on request.

Conflicts of Interest

The authors declare no conflicts of interest.

References

  1. Marmur, A. Interfaces at equilibrium: A guide to fundamentals. Adv. Colloid Interface Sci. 2017, 244, 164–173. [Google Scholar] [CrossRef]
  2. Kaptay, G. The chemical (not mechanical) paradigm of thermodynamics of colloid and interface science. Adv. Colloid Interface Sci. 2018, 256, 163–192. [Google Scholar] [CrossRef]
  3. Kleinheins, J.; Shardt, N.; Haber, M.E.; Ferronato, C.; Nozière, B.; Peter, T.; Marcolli, C. Surface tension models for binary aqueous solutions: A review and intercomparison. Phys. Chem. Chem. Phys. 2023, 25, 11055–11074. [Google Scholar] [CrossRef] [PubMed]
  4. Fellows, A.P.; Duque, Á.D.; Balos, V.; Lehmann, L.; Netz, R.R.; Wolf, M.; Thämer, M. Sum-frequency generation spectroscopy of aqueous interfaces: The role of depth and its impact on spectral interpretation. J. Phys. Chem. C 2024, 128, 20733–20750. [Google Scholar] [CrossRef]
  5. Privat, M.; Bennes, R.; Tronel-Peyroz, E. Ellipsometry and adsorption: The determination of isotherms and the adsorbed layer thickness and fluctuations of the composition in the liquid-vapor interface. J. Colloid Interface Sci. 1988, 121, 198–207. [Google Scholar] [CrossRef]
  6. Douillard, J.M. Experimental approach of the relation between surface tension and interfacial thickness of simple liquids. J. Colloid Interface Sci. 2009, 337, 307–310. [Google Scholar] [CrossRef] [PubMed]
  7. Li, Z.X.; Lu, J.R.; Styrkas, D.A.; Thomas, R.K.; Rennie, A.R.; Penfold, J. The structure of the surface of ethanol/water mixtures. Mol. Phys. 1993, 80, 925–939. [Google Scholar] [CrossRef]
  8. Hyde, A.E.; Ohshio, M.; Nguyen, C.V.; Yusa, S.I.; Yamada, N.L.; Phan, C.M. Surface properties of ethanol/water mixtures: Thickness and composition. J. Mol. Liq. 2019, 290, 111005. [Google Scholar] [CrossRef]
  9. Raina, G.; Kulkarni, G.U.; Rao, C.N.R. Surface enrichment in alcohol−water mixtures. J. Phys. Chem. A 2001, 105, 10204–10207. [Google Scholar] [CrossRef]
  10. Chen, H.; Gan, W.; Wu, B.H.; Wu, D.; Guo, Y.; Wang, H.F. Determination of structure and energetics for Gibbs surface adsorption layers of binary liquid mixture 1. Acetone + water. J. Phys. Chem. B 2005, 109, 8053–8063. [Google Scholar] [CrossRef]
  11. Liu, J.; Li, X.; Hou, J.; Li, X.; Lu, Z. The influence of sodium iodide salt on the interfacial properties of aqueous methanol solution by a combined molecular simulation and sum frequency generation vibrational spectroscopy study. Langmuir 2019, 35, 7050–7059. [Google Scholar] [CrossRef]
  12. Kirmse, K.; Morgner, H. Binary liquid mixtures. The relation between surface tension and surface composition as studied by mies (metastable induced electron spectroscopy). Langmuir 2006, 22, 2193–2199. [Google Scholar] [CrossRef]
  13. Rafati, A.A.; Bagheri, A.; Khanchi, A.R.; Ghasemian, E.; Najafi, M. Application of the UNIFAC model for prediction of surface tension and thickness of the surface layer in the binary mixtures. J. Colloid Interface Sci. 2011, 355, 252–258. [Google Scholar] [CrossRef]
  14. Azizian, S.; Moghadam, T.F. Derivation of a new equation for prediction of the thin layer depth of the extended-Langmuir model for dilute binary mixtures. Colloids Surfaces A 2011, 378, 67–71. [Google Scholar] [CrossRef]
  15. Lemraski, E.G.; Pouyanfar, Z. Prediction of surface tension, surface mole fraction and thickness of the surface layer in the ionic liquid binary mixtures. J. Mol. Liq. 2015, 203, 52–58. [Google Scholar] [CrossRef]
  16. Bermúdez-Salguero, C.; Gracia-Fadrique, J. Gibbs excess and the calculation of the absolute surface composition of liquid binary mixtures. J. Phys. Chem. B 2015, 119, 5598–5608. [Google Scholar] [CrossRef] [PubMed]
  17. Bagheri, A.; Fazli, M.; Bakhshaei, M. Surface properties and surface thickness of aqueous solutions of alcohols. J. Mol. Liq. 2016, 224, 442–451. [Google Scholar] [CrossRef]
  18. Santos, M.S.C.S.; Reis, J.C.R. Thermodynamic evaluation of molar surface area and thickness of water + ethanol mixtures. J. Mol. Liq. 2018, 255, 419–428. [Google Scholar] [CrossRef]
  19. Hernández, A.; Tahery, R. Modeling of surface tension and phase equilibria for water + amine mixtures from (298.15 to 323.15) K using different thermodynamic models. J. Solut. Chem. 2022, 51, 31–57. [Google Scholar] [CrossRef]
  20. Ma, W.; Du, N.; Hou, W. Predicting surface tension and surface composition of multicomponent liquid mixtures. (I) Ternary mixtures of isopropanol, water, and n-decane or n-tetradecane. Chem. Phys. 2025, 595, 112718. [Google Scholar] [CrossRef]
  21. Jia, Q.; Du, N.; Deng, Q.; Hou, W. Effect of temperature on the surface aggregation adsorption of water–alcohol binary mixtures. J. Mol. Liq. 2025, 431, 127825. [Google Scholar] [CrossRef]
  22. Gibbs, J.W. On the equilibrium of heterogeneous substances. Trans. Conn. Acad. Arts Sci. 1878, 3, 441–458. [Google Scholar] [CrossRef]
  23. Butler, J.A.V. The thermodynamics of the surfaces of solutions. Proc. R. Soc. London Ser. A 1932, 138, 348–375. [Google Scholar]
  24. Guggenheim, E.A.; Adam, N.K. The thermodynamics of adsorption at the surface of solutions. Proc. R. Soc. London Ser. A 1933, 139, 218–236. [Google Scholar]
  25. Eberhart, J.G. The surface tension of binary liquid mixtures. J. Phys. Chem. 1966, 70, 1183–1186. [Google Scholar] [CrossRef]
  26. Shereshefsky, J.L. A theory of surface tension of binary solutions I. Binary liquid mixtures of organic compounds. J. Colloid Interface Sci. 1967, 24, 317–321. [Google Scholar] [CrossRef]
  27. Connors, K.A.; Wright, J.L. Dependence of surface tension on composition of binary aqueous-organic solutions. Anal. Chem. 1989, 61, 194–198. [Google Scholar] [CrossRef]
  28. Laaksonen, A.; Kulmala, M. An explicit cluster model for binary nuclei in water–alcohol systems. J. Chem. Phys. 1991, 95, 6745–6748. [Google Scholar] [CrossRef]
  29. Piñeiro, Á.; Brocos, P.; Amigo, A.; Gracia-Fadrique, J.; Lemus, M.G. Extended Langmuir isotherm for binary liquid mixtures. Langmuir 2001, 17, 4261–4266. [Google Scholar] [CrossRef]
  30. Bermúdez-Salguero, C.; Clavijo-Penagos, J.A.; Romero, C.M.; Gracia-Fadrique, J. New insight into surface tension inverted curvature for liquid-liquid and solid-liquid binary mixtures: The special case of hexamethylenetetramine in water. Colloid Surf. A 2014, 448, 53–59. [Google Scholar] [CrossRef]
  31. Phan, C.M. The surface tension and interfacial composition of water–ethanol mixture. J. Mol. Liq. 2021, 342, 117505. [Google Scholar] [CrossRef]
  32. Phan, C.M. Affinity of amphiphilic molecules to air/water surface. ACS Omega 2023, 8, 47928–47937. [Google Scholar] [CrossRef]
  33. Qi, W.; Yu, X.; Du, N.; Hou, W. General adsorption model to describe sigmoidal surface tension isotherms of binary liquid mixtures. Langmuir 2023, 39, 507–518. [Google Scholar] [CrossRef]
  34. Qi, W.; Hou, W. A model for predicting the surface tension and composition of multicomponent liquid mixtures. Sci. Sin. Chim. 2023, 53, 1236–1246. [Google Scholar] [CrossRef]
  35. Mulero, Á.; Hernández, A.; Vadillo-Rodríguez, V.; Cachadiña, I. Correlations of surface tension for mixtures of n-alkanes as a function of the composition: Applicability and performance analysis of existing models. Phys. Chem. Chem. Phys. 2025, 27, 12812–12836. [Google Scholar] [CrossRef] [PubMed]
  36. Yu, X.; Qi, W.; Deng, Q.; Hou, W. Surface adsorption of water-alcohol binary solutions. Chem. J. Chin. Univ. 2023, 44, 20230316. [Google Scholar]
  37. Belton, J.W.; Evans, M.G. Studies in the molecular forces involved in surface formation. II. The surface free energies of simple liquid mixtures. Trans. Faraday Soc. 1945, 41, 1–12. [Google Scholar] [CrossRef]
  38. Ma, P. Handbook of Basic Data of Petrochemical Industries; Chemical Industry Press: Beijing, China, 1982. [Google Scholar]
  39. Jańczuk, B.; Wójcik, W.; Zdziennicka, A. Determination of the components of the surface tension of some liquids from interfacial liquid-liquid tension measurements. J. Colloid Interface Sci. 1993, 157, 384–393. [Google Scholar] [CrossRef]
  40. Balkenende, A.R.; van de Boogaard, H.J.A.P.; Scholten, M.; Willard, N.P. Evaluation of different approaches to assess the surface tension of low-energy solids by means of contact angle measurements. Langmuir 1998, 14, 5907–5912. [Google Scholar] [CrossRef]
  41. Oosterlaken, B.M.; van den Bruinhorst, A.; de With, G. On the use of probe liquids for surface energy measurements. Langmuir 2023, 39, 16701–16711. [Google Scholar] [CrossRef]
  42. Michaels, A.; Alexander, R.; Becker, C. Estimation of surface tensions. Ind. Eng. Chem. 1950, 42, 2332–2336. [Google Scholar] [CrossRef]
  43. Lomba, L.; Giner, B.; Bandrés, I.; Lafuente, C.; Pino, M.R. Physicochemical properties of green solvents derived from biomass. Green Chem. 2011, 13, 2062–2070. [Google Scholar] [CrossRef]
  44. Lomba, L.; Giner, B.; Lopéz, M.C.; Aldea, L.; Lafuente, C. Thermophysical properties of furfural compounds. Chem. Eng. Data 2014, 59, 329–338. [Google Scholar] [CrossRef]
  45. Rafati, A.A.; Ghasemian, E.; Iloukhani, H. Surface tension and surface properties of binary mixtures of 1,4-dioxane or N,N-dimethyl formamide with n-alkyl acetates. J. Chem. Eng. Data 2009, 54, 3224–3228. [Google Scholar] [CrossRef]
  46. Zhang, S.; Zhao, L.; Yue, X.; Li, B.; Zhang, J. Density, viscosity, surface tension and spectroscopic studies for the liquid mixture of tetraethylene glycol + N,N-dimethyl formamide at six temperatures. J. Mol. Liq. 2018, 264, 451–457. [Google Scholar] [CrossRef]
  47. Yano, Y.F. Correlation between surface and bulk structures of alcohol-water mixtures. J. Colloid Interface Sci. 2005, 284, 255–259. [Google Scholar] [CrossRef]
  48. Goldsack, D.E.; White, B.R. An iterative technique for calculating surface tensions of non-electrolyte solutions. Can. J. Chem. 1983, 61, 1725–1729. [Google Scholar] [CrossRef]
  49. Tronel-Peyroz, E.; Douillard, J.M.; Tenebre, L.; Bennes, R.; Privat, M. Associated complex formation in the liquid-vapor interface: The water-ethanol and water-tert-butyl alcohol systems. Langmuir 1987, 3, 1027–1034. [Google Scholar] [CrossRef]
  50. Nath, S. Surface tension of nonideal binary liquid mixtures as a function of composition. J. Colloid Interface Sci. 1999, 209, 116–122. [Google Scholar] [CrossRef] [PubMed]
  51. Santos, M.S.C.S.; Reis, J.C.R. New thermodynamics for evaluating the surface-phase enrichment in the lower surface tension component. ChemPhysChem 2014, 15, 2834–2843. [Google Scholar] [CrossRef] [PubMed]
  52. Tahery, R.; Modarress, H.; Satherley, J. Surface tension prediction and thermodynamic analysis of the surface for binary solutions. Chem. Eng. Sci. 2005, 60, 4935–4952. [Google Scholar] [CrossRef]
  53. Randles, J.E.B.; Behr, B. Adsorption at liquid interfaces. I. Surface tension at the interface between a binary liquid mixture and its vapour. J. Electroanal. Chem. 1972, 35, 389–404. [Google Scholar] [CrossRef]
  54. Azad, R.; Sharma, T.; Martin, D.; Daschakraborty, S.; Raj, R. Unraveling the surface activity of ethanol–water mixtures through experiments and molecular dynamics simulations. Langmuir 2024, 40, 17577–17589. [Google Scholar] [CrossRef] [PubMed]
  55. AbouHaidar, R.; Bougueroua, S.; Duflot, D.; Gaigeot, M.-P.; Wyslouzil, B.; Toubin, C. Unraveling aqueous alcohol freezing: New theoretical tools from graph theory to extract molecular processes in MD simulations. Faraday Discuss. 2025, 258, 396–418. [Google Scholar] [CrossRef] [PubMed]
  56. Li, Z.X.; Lu, J.R.; Thomas, R.K.; Penfold, J. Neutron reflection study of butanol and hexanol adsorbed at the surface of their aqueous solutions. J. Chem. Soc. Faraday Trans. 1996, 92, 565–572. [Google Scholar] [CrossRef]
  57. Yano, Y.F. Surface structure of aqueous 2-butoxyethanol mixtures studied by x-ray reflection. J. Chem. Phys. 2002, 116, 8093–8096. [Google Scholar] [CrossRef]
  58. Fellows, A.P.; Duque, Á.D.; Balos, V.; Lehmann, L.; Netz, R.R.; Wolf, M.; Thämer, M. How thick is the air–water interface? A direct experimental measurement of the decay length of the interfacial structural anisotropy. Langmuir 2024, 40, 18760–18772. [Google Scholar] [CrossRef]
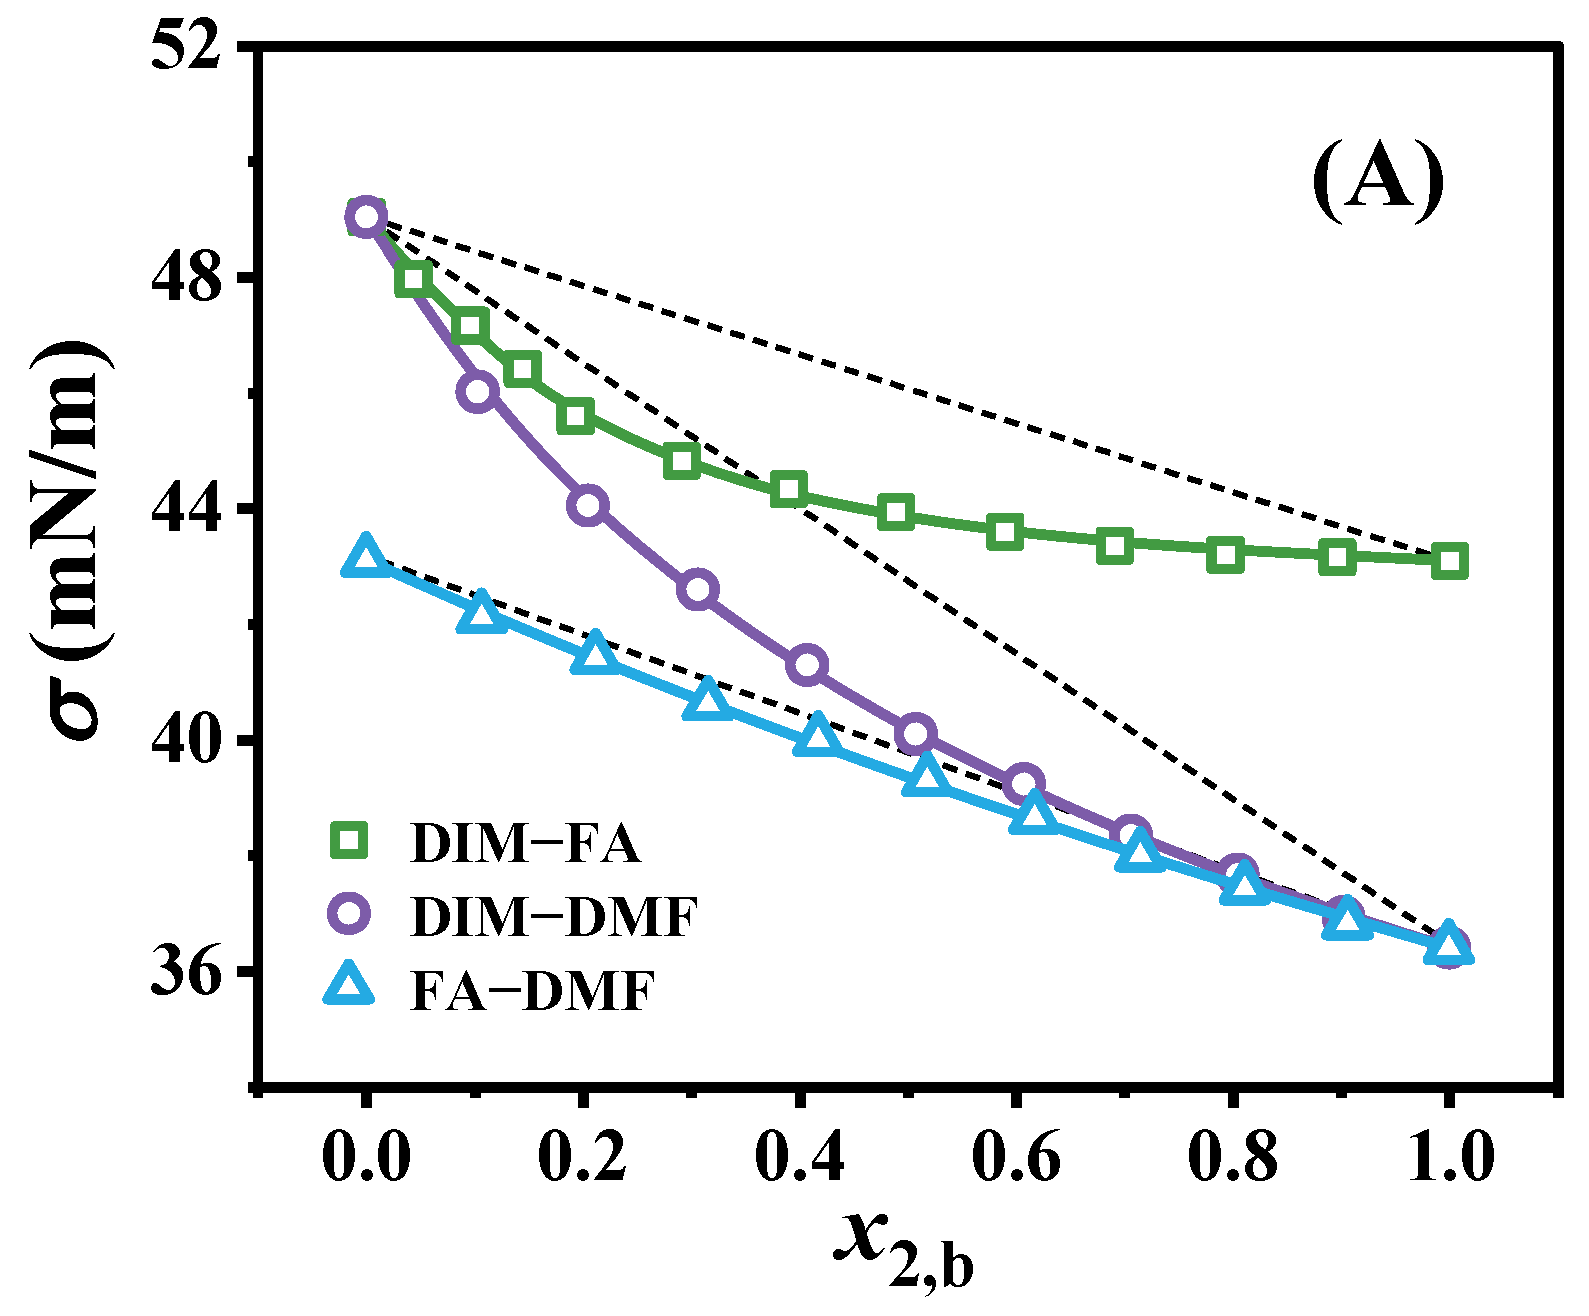
Figure 1. Isotherms of (A) σ and (B) πr vs. x2,b for binary solutions. The symbols represent the experimental data, and the solid lines represent the fitting using the SAA model (Equations (6) and (7)). The dotted lines represent the “ideal” correlation.
Colloids 09 00067 g001aColloids 09 00067 g001b
Figure 2. Linear fitting plots of Equation (8) for πr − x2,b data of binary solutions. The symbols represent the experimental data, and the solid lines represent the fitting using the SAA model (Equation (8)).
Colloids 09 00067 g002
Figure 3. Changes in the Gibbs excesses (A) Γ2 and (B) ΔΦ2(1) and (C) the absolute surface excess ΔΦ2 with bulk composition (x2,b) for binary solutions.
Colloids 09 00067 g003aColloids 09 00067 g003b
Figure 4. Change in surface adsorption layer thickness (τ) with bulk composition (x2,b) for binary solutions.
Colloids 09 00067 g004
Table 1. Physical properties of pure liquids.
LiquidMr
(g/mol)
ρ0
(g/cm3)
ρc0
(g/cm3)
vb0
(cm3/mol)
vc0
(cm3/mol)
vs0
(cm3/mol)
ls
(nm)
DIM267.843.33~0.9180.43~297176.10.66
FA96.091.160.35982.84267.6167.40.65
DMF73.100.940.26777.77273.7165.50.65
Table 2. Best-fitting parameter values for surface tension data of binary solutions. (AAD and ARD correspond to the σ − x2,b data over the entire x2,b range).
Binary SolutionnKx*KxAAD
(mN/m)
ARD (%)Gad0
(kJ/mol)
DIM (1)–FA (2)1.278.456.370.0590.13−3.62
DIM (1)–DMF (2)0.922.212.470.0420.10−2.44
FA (1)–DMF (2)1.001.281.380.0400.10 −0.80
Table 3. Adsorption parameters of binary solutions at 25 °C.
Binary SolutionΓ2(x→1)
(μmol/m2)
Δ Φ 2 ( x 1 ) ( 1 ) τx→0 (nm)τx→1 (nm)N2(x→0)
DIM (1)–FA (2)0.290.88~0.80.051.2
DIM (1)–DMF (2)2.230.560.780.691.2
FA (1)–DMF (2)2.090.281.621.252.5
Disclaimer/Publisher’s Note: The statements, opinions and data contained in all publications are solely those of the individual author(s) and contributor(s) and not of MDPI and/or the editor(s). MDPI and/or the editor(s) disclaim responsibility for any injury to people or property resulting from any ideas, methods, instructions or products referred to in the content.