
Optical Investigation of the Combined Effect of pH and Temperature on the Interactions of BSA Protein with Iron Oxide Nanoparticles

 ,
,  , , ,
, , ,  , ,
, , 
Abstract
1. Introduction
2. Materials and Methods
2.1. Preparation of Colloidal Solution of Ions Nanoparticles
2.2. Preparation of Colloidal BSA Solutions
2.3. pH Measurement
2.4. TEM-Microscopy
2.5. Temperature Control
2.6. Dynamic Light Scattering
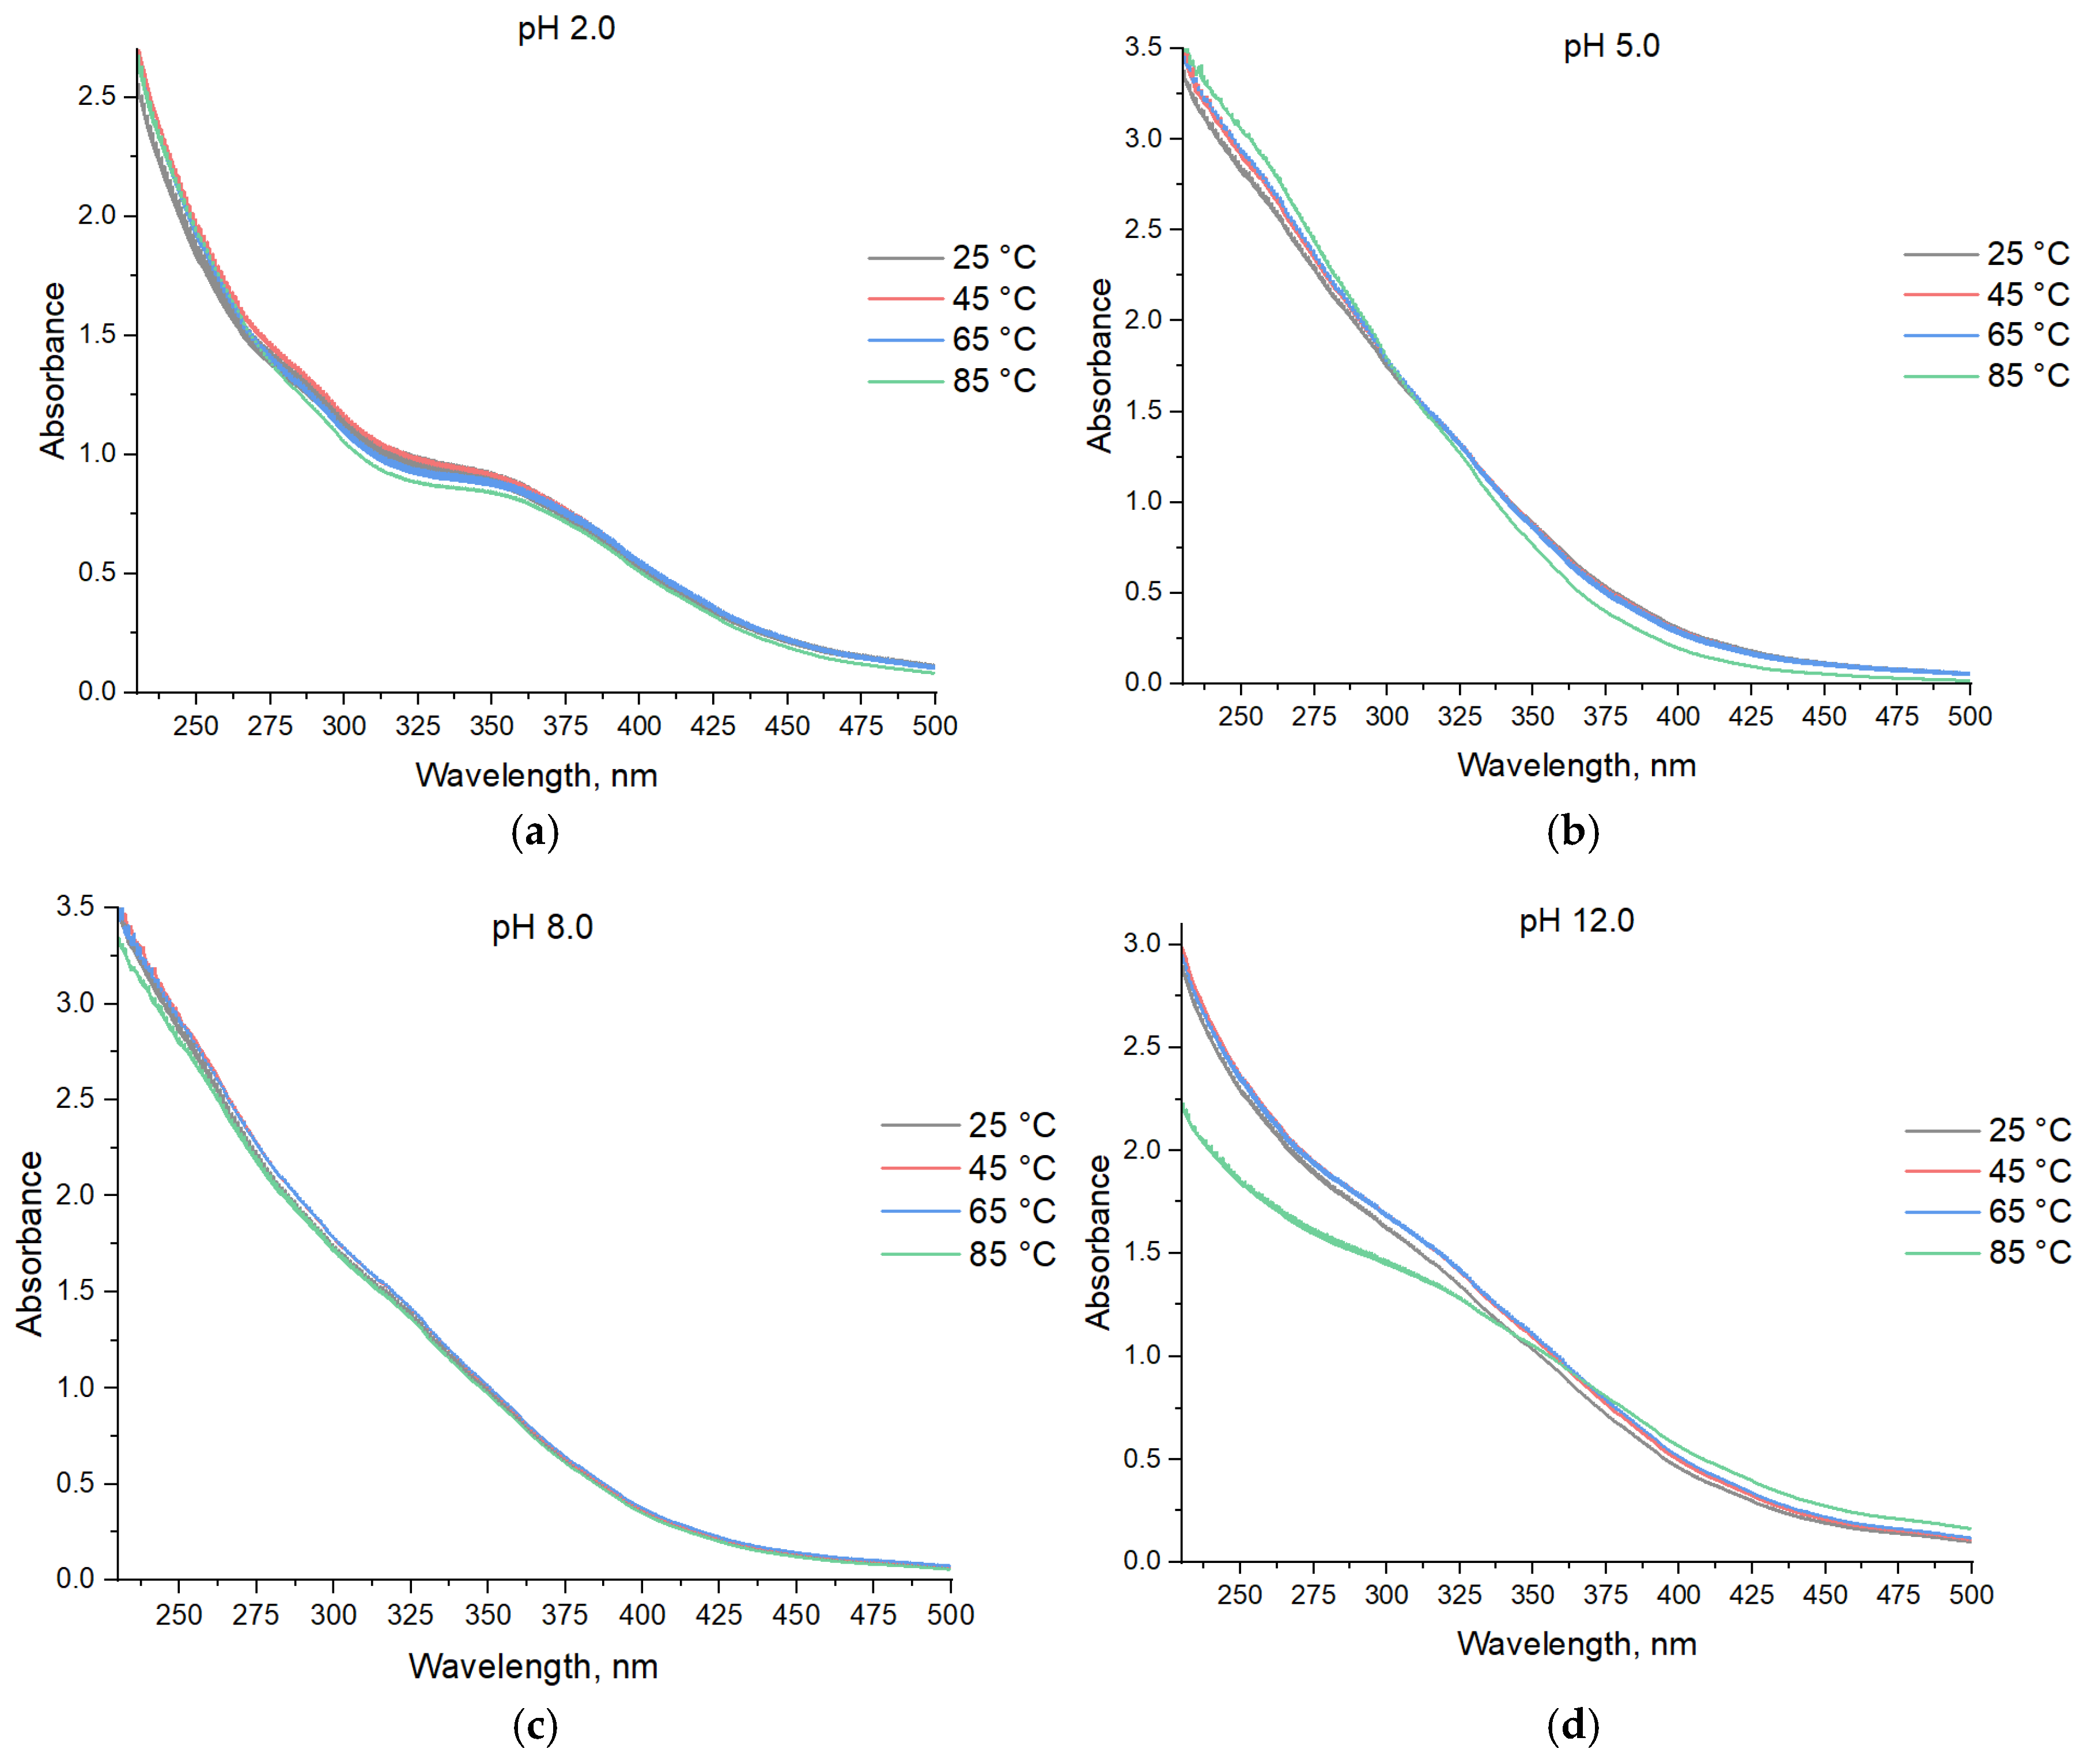
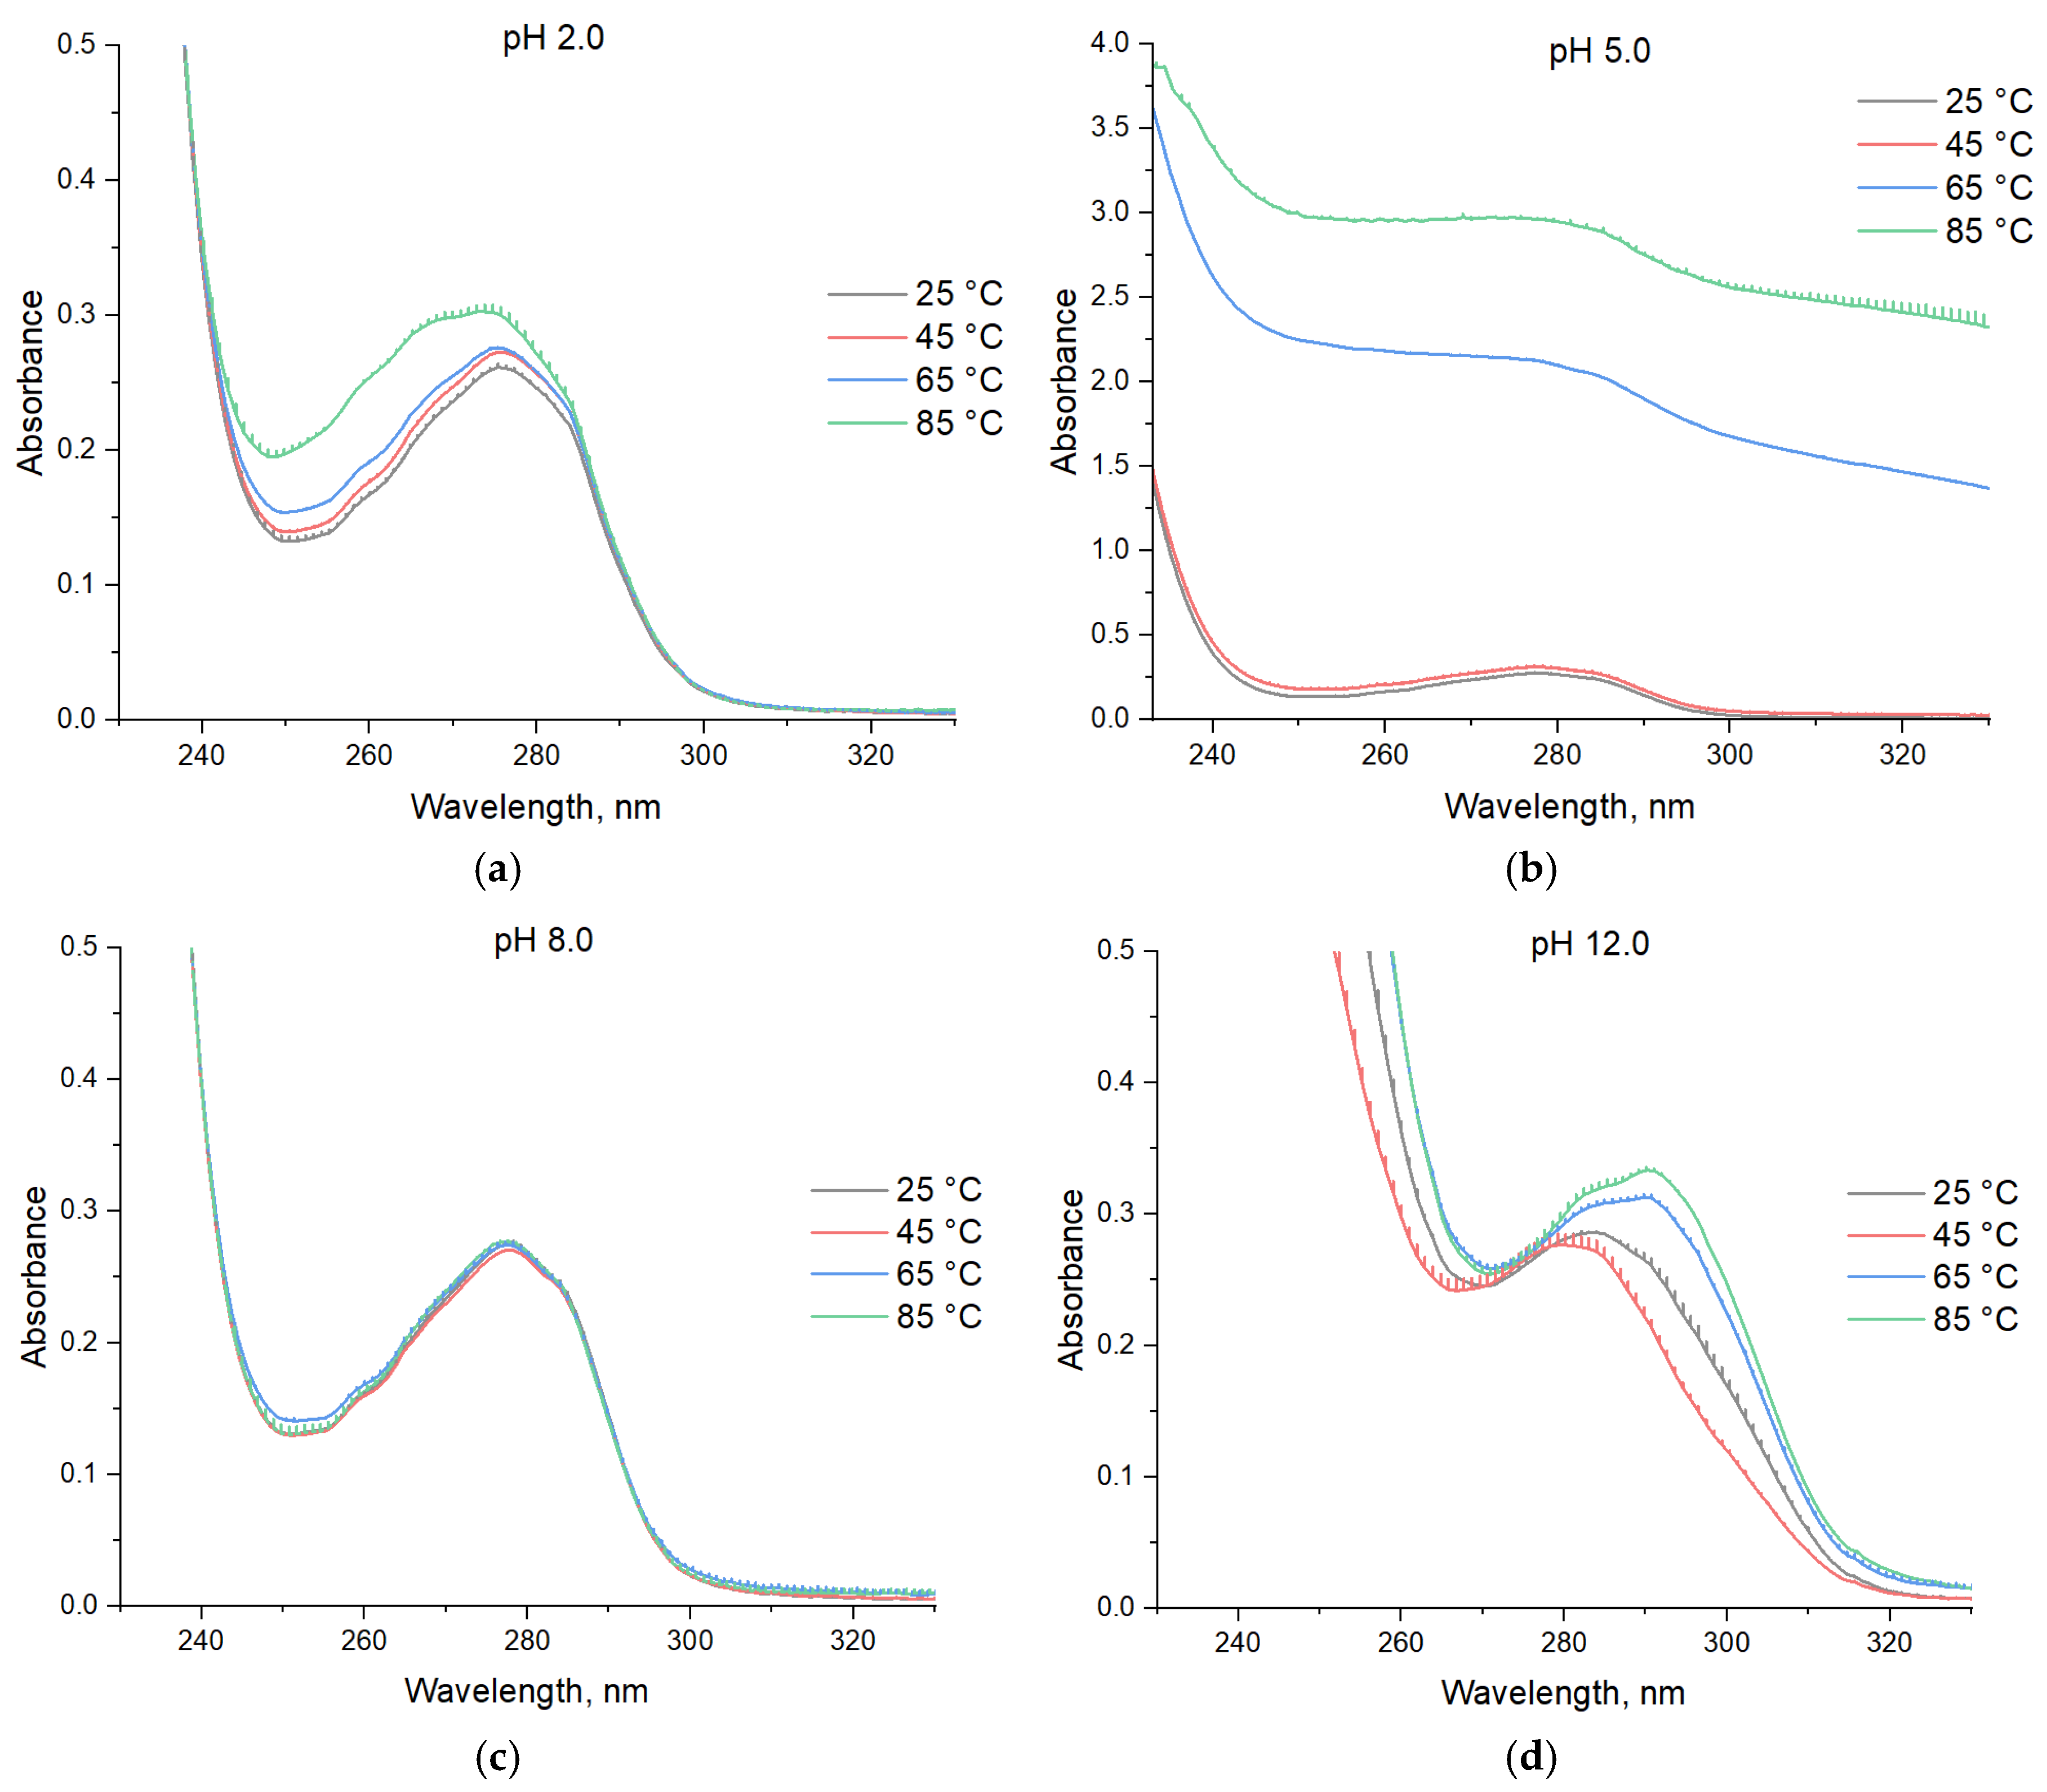
2.7. Absorption Spectroscopy
2.8. Measurement of ζ-Potential
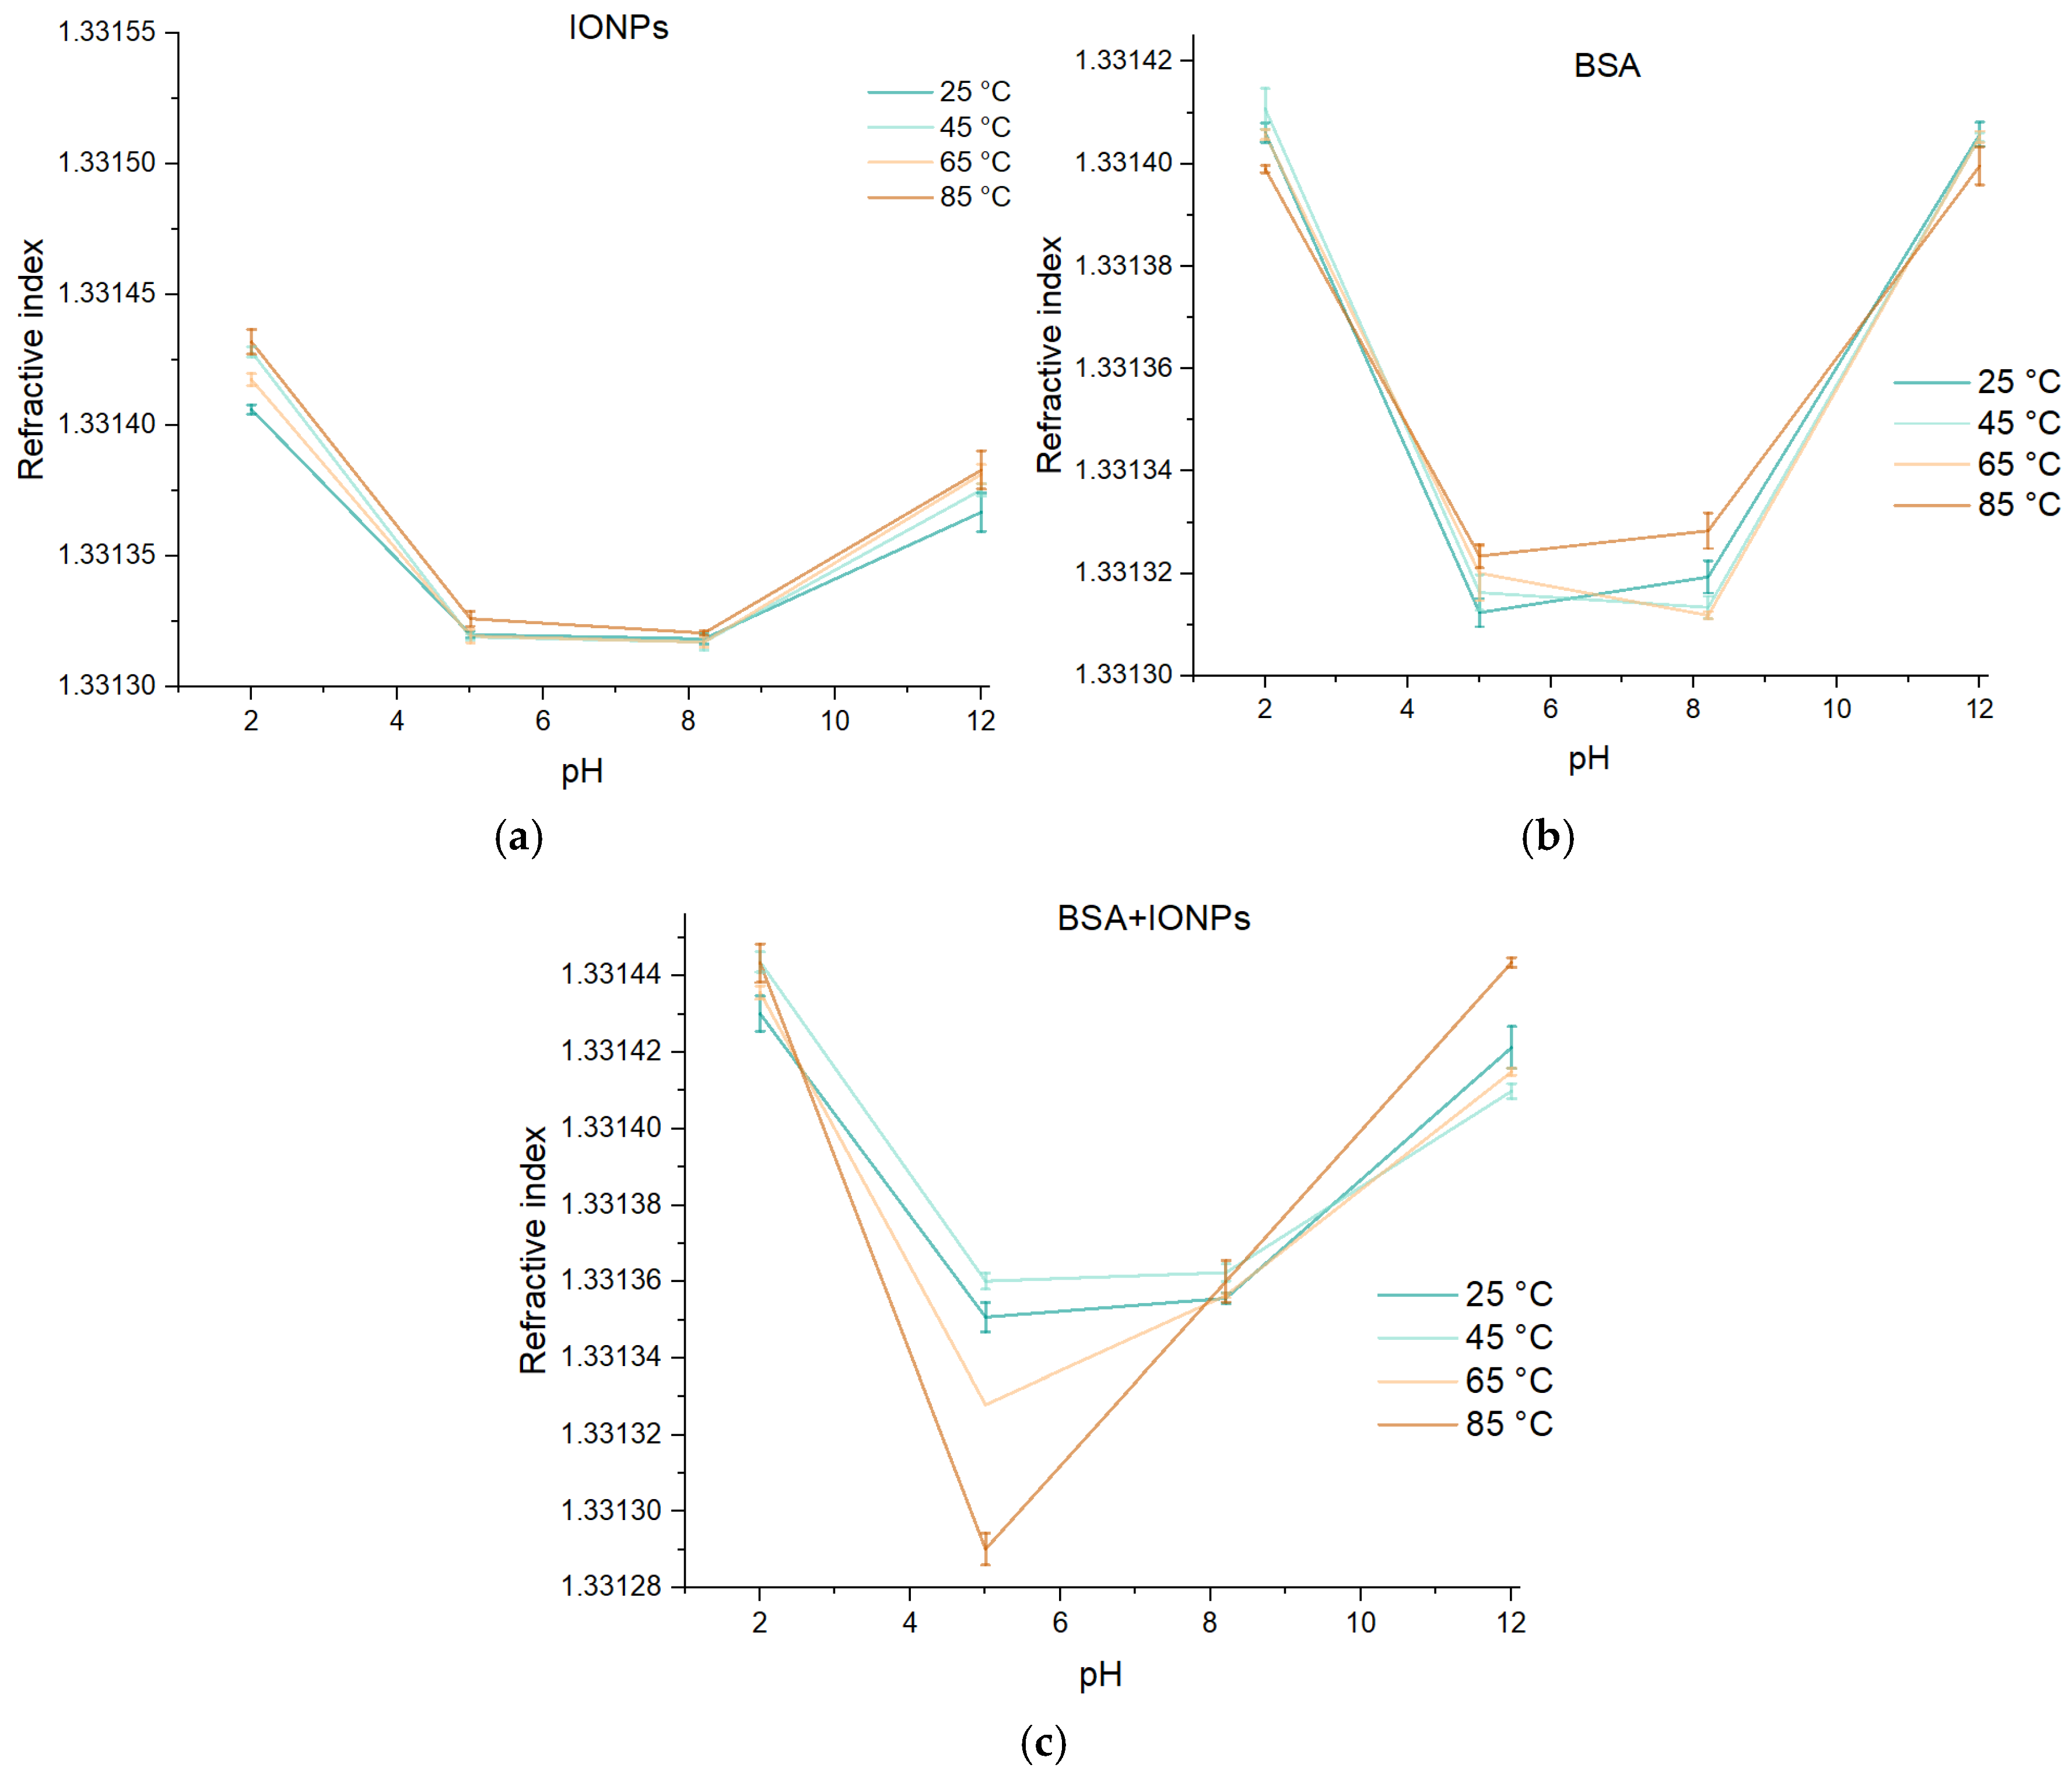
2.9. Refractometry
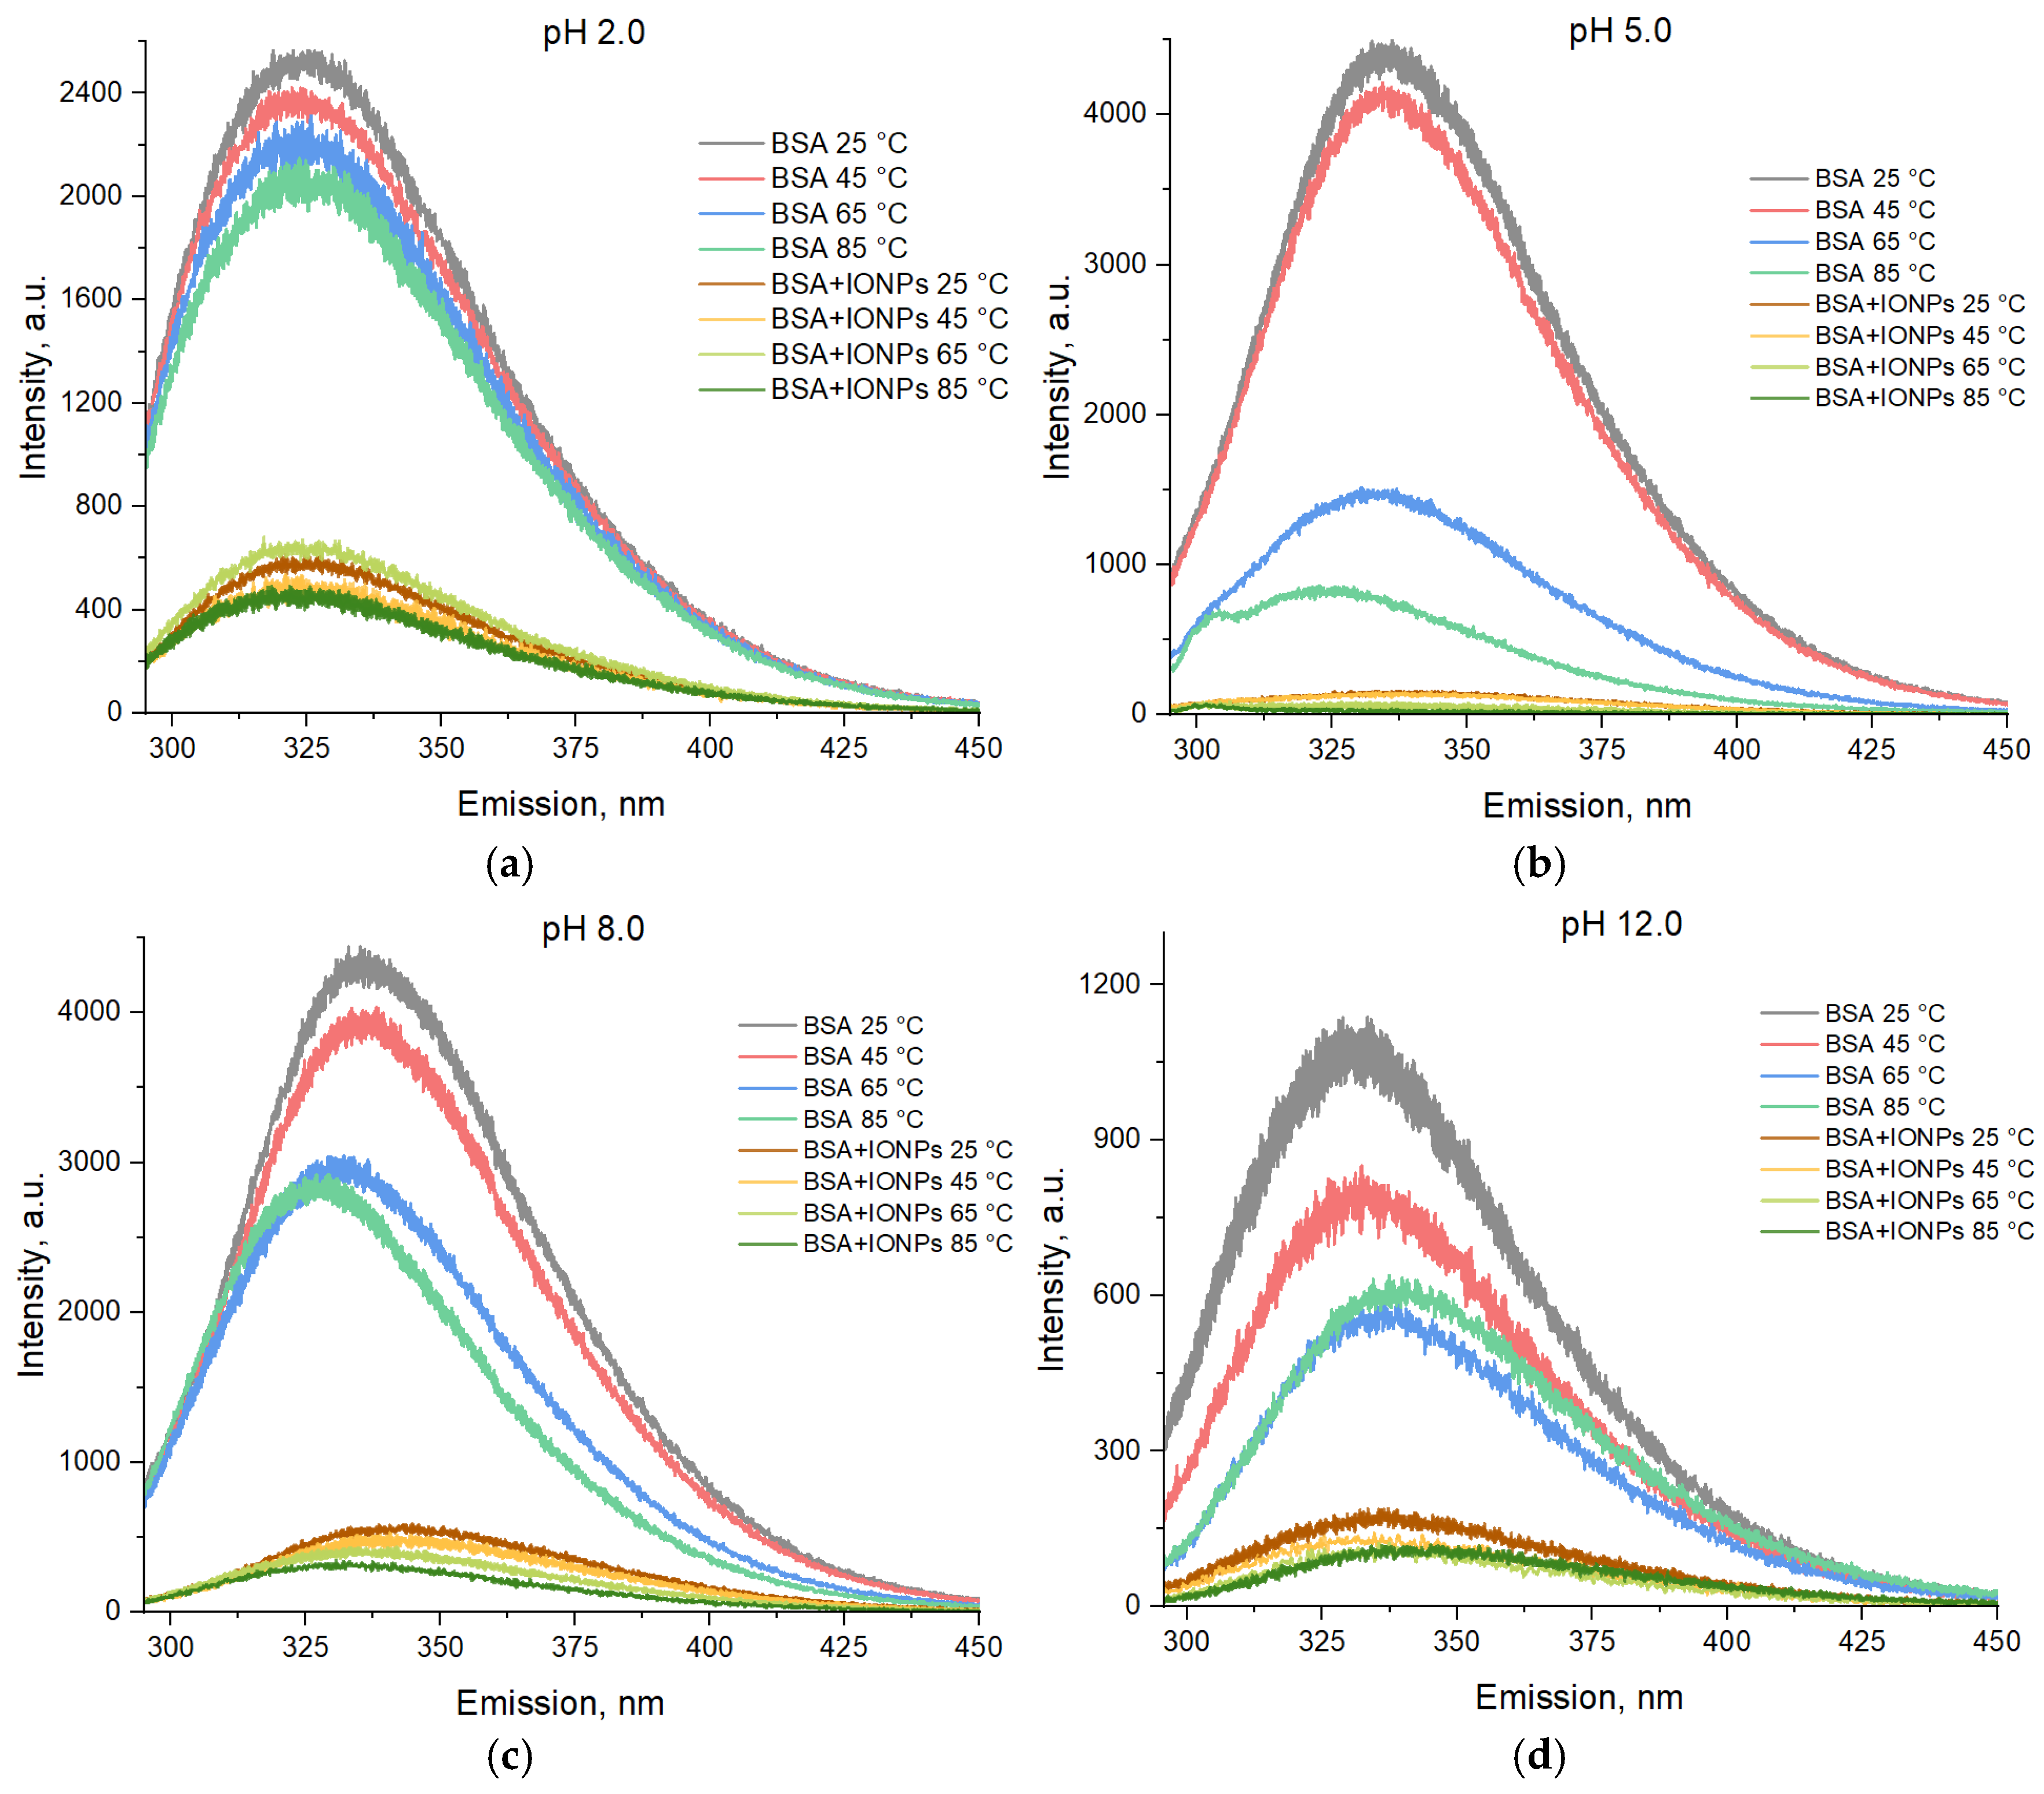
2.10. Fluorescence Spectroscopy
3. Results
4. Conclusions
Author Contributions
Funding
Data Availability Statement
Conflicts of Interest
Abbreviations
| IONPs | Iron oxide nanoparticles |
| BSA | Bovine Serum Albumin |
| DLS | Dynamic light scattering |
Appendix A
Appendix A.1

Appendix A.2

Appendix A.3
Appendix A.4

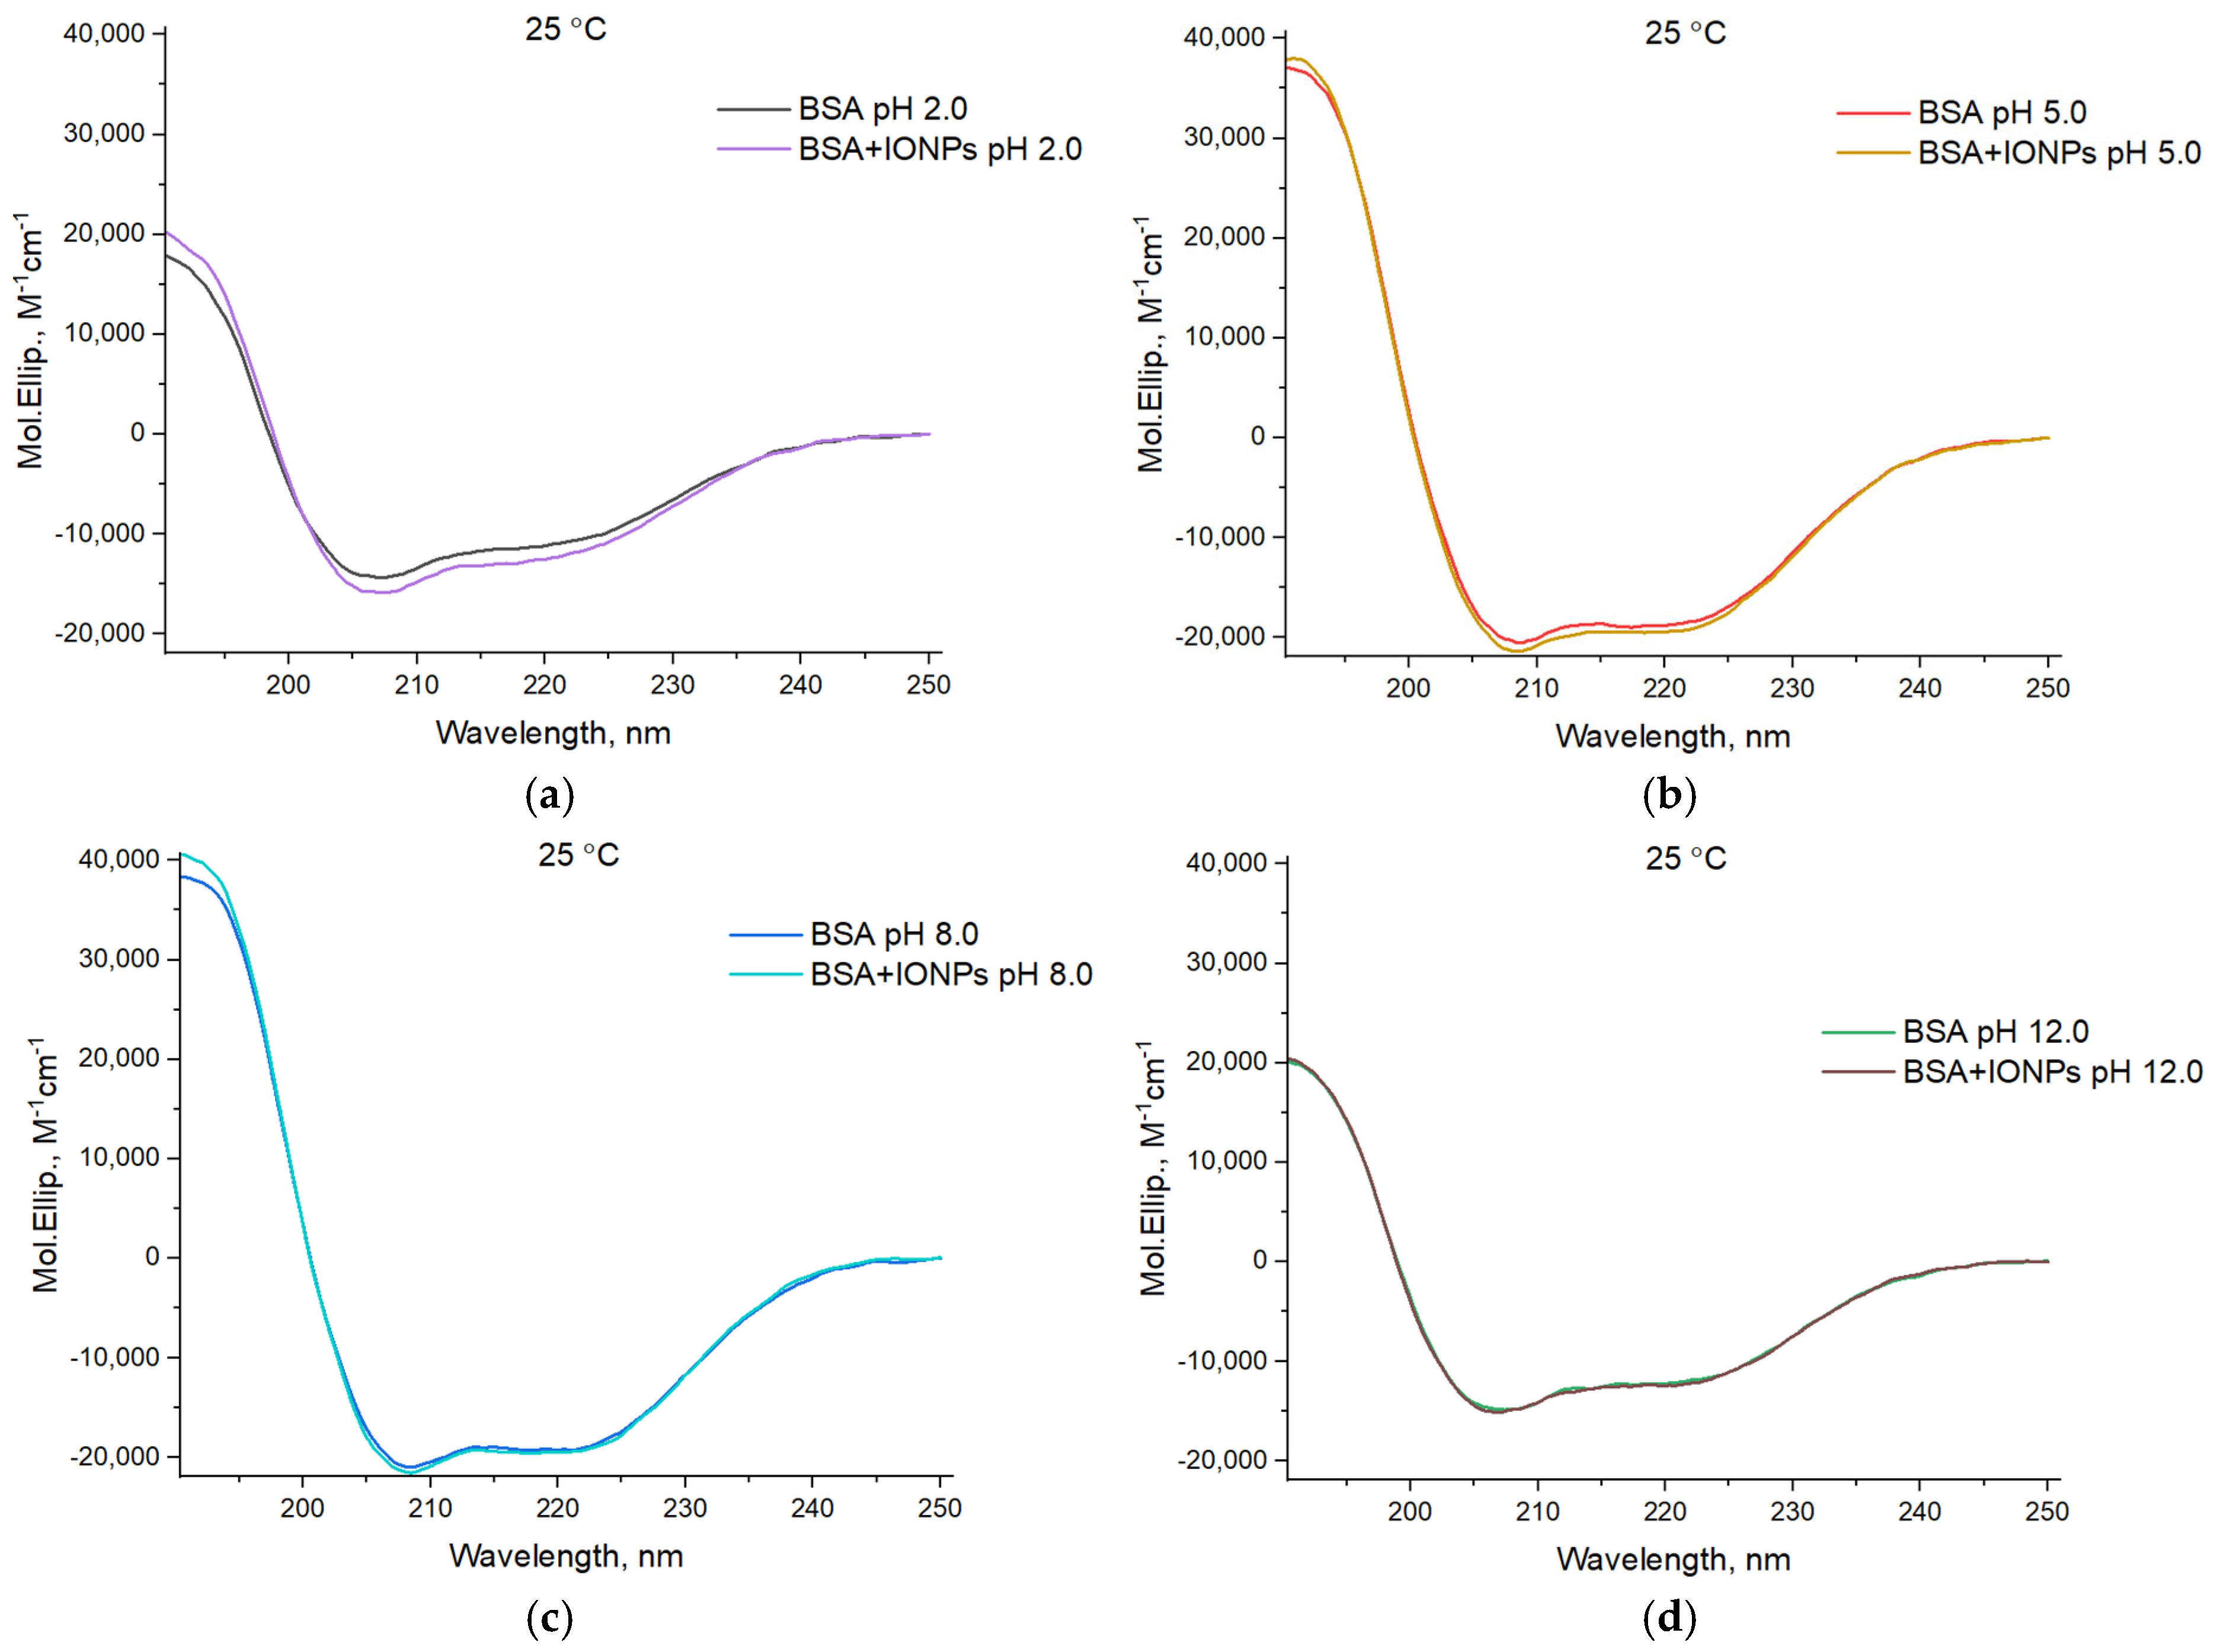
| Samples | pH | α-Helix, % | Β-Sheet, % | Turn, % | Disorder, % |
|---|---|---|---|---|---|
| BSA | 2.0 | 32.9 | 15.1 | 21.8 | 30.3 |
| BSA + IONPs | 36.0 | 13.4 | 20.4 | 30.3 | |
| BSA | 5.0 | 54.1 | 5.6 | 14.2 | 26.1 |
| BSA + IONPs | 55.6 | 4.5 | 13.9 | 26.1 | |
| BSA | 8.0 | 55.8 | 5.0 | 13.4 | 25.9 |
| BSA + IONPs | 57.4 | 4.4 | 12.5 | 25.7 | |
| BSA | 12.0 | 36.4 | 12.4 | 20.6 | 30.6 |
| BSA + IONPs | 36.6 | 12.2 | 20.4 | 30.8 |
References
- Ahmed, I.; Mir, F.A.; Banday, J.A. Synthesis of metal and metal oxide nanoparticles using plant extracts—Characterization and applications. BioNanoScience 2023, 13, 1541–1557. [Google Scholar] [CrossRef]
- Tuttolomondo, M.V.; Municoy, S.; Echazú, M.I.A.; López, L.M.; Alvarez, G.S. Magnetic nanoparticles for nucleic acid delivery: Magnetofection, gene therapy and vaccines. Magn. Nanopart. Biomed. Appl 2023, 143, 278–313. [Google Scholar] [CrossRef]
- Khabibullin, V.R.; Chetyrkina, M.R.; Obydennyy, S.I.; Maksimov, S.V.; Stepanov, G.V.; Shtykov, S.N. Study on doxorubicin loading on differently functionalized iron oxide nanoparticles: Implications for controlled drug-delivery application. Int. J. Mol. Sci. 2023, 24, 4480. [Google Scholar] [CrossRef]
- Abdulsada, F.M.; Hussein, N.N.; Sulaiman, G.M. Potentials of Iron Oxide Nanoparticles (Fe3O4): As Antioxidant and Alternative Therapeutic Agent Against Common Multidrug-Resistant Microbial Species. Iraqi J. Sci. 2023, 64, 2759–2773. [Google Scholar] [CrossRef]
- Rahman, M. Magnetic resonance imaging and iron-oxide nanoparticles in the era of personalized medicine. Nanotheranostics 2023, 7, 424. [Google Scholar] [CrossRef]
- Ahmed, M.A.; Shafiei-Masouleh, S.-S.; Mohsin, R.M.; Salih, Z.K. Foliar application of iron oxide nanoparticles promotes growth, mineral contents, and medicinal qualities of Solidago virgaurea L. J. Soil Sci. Plant Nutr. 2023, 23, 2610–2624. [Google Scholar] [CrossRef] [PubMed]
- Shirsat, S.; K, S. Iron oxide nanoparticles as iron micronutrient fertilizer—Opportunities and limitations. J. Plant Nutr. Soil Sci. 2024, 187, 565–588. [Google Scholar] [CrossRef]
- Shoudho, K.N.; Uddin, S.; Rumon, M.M.H.; Shakil, M.S. Influence of physicochemical properties of iron oxide nanoparticles on their antibacterial activity. ACS Omega 2024, 9, 33303–33334. [Google Scholar] [CrossRef] [PubMed]
- Ventura-Aguilar, R.I.; Bautista-Baños, S.; Mendoza-Acevedo, S.; Bosquez-Molina, E. Nanomaterials for designing biosensors to detect fungi and bacteria related to food safety of agricultural products. Postharvest Biol. Technol. 2023, 195, 112116. [Google Scholar] [CrossRef]
- Garg, S.; Rumjit, N.P.; Roy, S. Smart agriculture and nanotechnology: Technology, challenges, and new perspective. Adv. Agrochem 2024, 3, 115–125. [Google Scholar] [CrossRef]
- Francis, D.V.; Abdalla, A.K.; Mahakham, W.; Sarmah, A.K.; Ahmed, Z.F. Interaction of plants and metal nanoparticles: Exploring its molecular mechanisms for sustainable agriculture and crop improvement. Environ. Int. 2024, 190, 108859. [Google Scholar] [CrossRef] [PubMed]
- Santás-Miguel, V.; Arias-Estévez, M.; Rodríguez-Seijo, A.; Arenas-Lago, D. Use of metal nanoparticles in agriculture. A review on the effects on plant germination. Environ. Pollut. 2023, 334, 122222. [Google Scholar] [CrossRef]
- Gudkov, S.V.; Sarimov, R.M.; Astashev, M.E.; Pishchalnikov, R.Y.; Yanykin, D.V.; Simakin, A.V.; Shkirin, A.V.; Serov, D.A.; Konchekov, E.M.; Ogly, G. Modern physical methods and technologies in agriculture. Phys. Uspekhi 2024, 67, 194–210. [Google Scholar] [CrossRef]
- Serov, D.A.; Burmistrov, D.E.; Simakin, A.V.; Astashev, M.E.; Uvarov, O.V.; Tolordava, E.R.; Semenova, A.A.; Lisitsyn, A.B.; Gudkov, S.V. Composite coating for the food industry based on fluoroplast and ZnO-NPs: Physical and chemical properties, antibacterial and antibiofilm activity, cytotoxicity. Nanomaterials 2022, 12, 4158. [Google Scholar] [CrossRef]
- Góral, D.; Marczuk, A.; Góral-Kowalczyk, M.; Koval, I.; Andrejko, D. Application of iron nanoparticle-based materials in the food industry. Materials 2023, 16, 780. [Google Scholar] [CrossRef]
- Misra, S.K.; Rosenholm, J.M.; Pathak, K. Functionalized and Nonfunctionalized Nanosystems for Mitochondrial Drug Delivery with Metallic Nanoparticles. Molecules 2023, 28, 4701. [Google Scholar] [CrossRef] [PubMed]
- Sharma, K.; Chauhan, C. Role of magnetic nanoparticle (MNPs) in cancer treatment: A review. Mater. Today Proc. 2023, 81, 919–925. [Google Scholar] [CrossRef]
- Qiao, R.; Fu, C.; Forgham, H.; Javed, I.; Huang, X.; Zhu, J.; Whittaker, A.K.; Davis, T.P. Magnetic iron oxide nanoparticles for brain imaging and drug delivery. Adv. Drug Deliv. Rev. 2023, 197, 114822. [Google Scholar] [CrossRef] [PubMed]
- Oberdick, S.D.; Jordanova, K.V.; Lundstrom, J.T.; Parigi, G.; Poorman, M.E.; Zabow, G.; Keenan, K.E. Iron oxide nanoparticles as positive T1 contrast agents for low-field magnetic resonance imaging at 64 mT. Sci. Rep. 2023, 13, 11520. [Google Scholar] [CrossRef]
- Vangijzegem, T.; Lecomte, V.; Ternad, I.; Leuven, L.V.; Muller, R.N.; Stanicki, D.; Laurent, S. Superparamagnetic iron oxide nanoparticles (SPION): From fundamentals to state-of-the-art innovative applications for cancer therapy. Pharmaceutics 2023, 15, 236. [Google Scholar] [CrossRef]
- Hernandes, E.P.; Lazarin-Bidóia, D.; Bini, R.D.; Nakamura, C.V.; Cótica, L.F.; de Oliveira Silva Lautenschlager, S. Doxorubicin-loaded iron oxide nanoparticles induce oxidative stress and cell cycle arrest in breast cancer cells. Antioxidants 2023, 12, 237. [Google Scholar] [CrossRef] [PubMed]
- Rivas-García, L.; Quiles, J.L.; Varela-López, A.; Giampieri, F.; Battino, M.; Bettmer, J.; Montes-Bayón, M.; Llopis, J.; Sánchez-González, C. Ultra-small iron nanoparticles target mitochondria inducing autophagy, acting on mitochondrial dna and reducing respiration. Pharmaceutics 2021, 13, 90. [Google Scholar] [CrossRef]
- Zafar, S.; Farooq, A.; Batool, S.; Tariq, T.; Hasan, M.; Mustafa, G. Green synthesis of iron oxide nanoparticles for mitigation of chromium stress and anti-oxidative potential in Triticum aestivum. Hybrid Adv. 2024, 5, 100156. [Google Scholar] [CrossRef]
- Kreslavski, V.D.; Shmarev, A.N.; Ivanov, A.A.; Zharmukhamedov, S.K.; Strokina, V.; Kosobryukhov, A.; Yu, M.; Allakhverdiev, S.I.; Shabala, S. Effects of iron oxide nanoparticles (Fe3O4) and salinity on growth, photosynthesis, antioxidant activity and distribution of mineral elements in wheat (Triticum aestivum). Funct. Plant Biol. 2023, 50, 932–940. [Google Scholar] [CrossRef] [PubMed]
- Ghouri, F.; Sarwar, S.; Sun, L.; Riaz, M.; Haider, F.U.; Ashraf, H.; Lai, M.; Imran, M.; Liu, J.; Ali, S. Silicon and iron nanoparticles protect rice against lead (Pb) stress by improving oxidative tolerance and minimizing Pb uptake. Sci. Rep. 2024, 14, 5986. [Google Scholar] [CrossRef]
- Kim, W.; Ly, N.K.; He, Y.; Li, Y.; Yuan, Z.; Yeo, Y. Protein corona: Friend or foe? Co-opting serum proteins for nanoparticle delivery. Adv. Drug Deliv. Rev. 2023, 192, 114635. [Google Scholar] [CrossRef]
- Le, T.-D.; Suttikhana, I.; Ashaolu, T.J. State of the art on the separation and purification of proteins by magnetic nanoparticles. J. Nanobiotechnol. 2023, 21, 363. [Google Scholar] [CrossRef]
- Turovsky, E.A.; Baryshev, A.S.; Plotnikov, E.Y. Selenium nanoparticles in protecting the brain from stroke: Possible signaling and metabolic mechanisms. Nanomaterials 2024, 14, 160. [Google Scholar] [CrossRef]
- Shan, H.; Zhao, Q.; Guo, Y.; Gao, M.; Xu, X.; McClements, D.J.; Cao, C.; Yuan, B. Impact of pH on the formation and properties of whey protein coronas around TiO2 nanoparticles. J. Agric. Food Chem. 2023, 71, 5756–5769. [Google Scholar] [CrossRef]
- Tukova, A.; Nie, Y.; Tavakkoli Yaraki, M.; Tran, N.T.; Wang, J.; Rodger, A.; Gu, Y.; Wang, Y. Shape dependent protein-induced stabilization of gold nanoparticles: From a protein corona perspective: Special Collection: Distinguished Australian Researchers. Aggregate 2023, 4, e323. [Google Scholar] [CrossRef]
- Astashev, M.; Serov, D.; Sarimov, R.; Gudkov, S. Influence of the Vibration Impact Mode on the Spontaneous Chemiluminescence of Aqueous Protein Solutions. Phys. Wave Phenom. 2023, 31, 189–199. [Google Scholar] [CrossRef]
- Paukštytė, J.; Cabezas, R.M.L.; Feng, Y.; Tong, K.; Schnyder, D.; Elomaa, E.; Gregorova, P.; Doudin, M.; Särkkä, M.; Sarameri, J. Global analysis of aging-related protein structural changes uncovers enzyme-polymerization-based control of longevity. Mol. Cell 2023, 83, 3360–3376. [Google Scholar] [CrossRef]
- Xu, Q.; Ma, Y.; Sun, Y.; Li, D.; Zhang, X.; Liu, C. Protein amyloid aggregate: Structure and function. Aggregate 2023, 4, e333. [Google Scholar] [CrossRef]
- Wang, W.; Huang, Z.; Li, Y.; Wang, W.; Shi, J.; Fu, F.; Huang, Y.; Pan, X.; Wu, C. Impact of particle size and pH on protein corona formation of solid lipid nanoparticles: A proof-of-concept study. Acta Pharm. Sin. B 2021, 11, 1030–1046. [Google Scholar] [CrossRef] [PubMed]
- Resende, L.F.T.; Basilio, F.C.; Filho, P.A.; Therézio, E.M.; Silva, R.A.; Oliveira, O.N., Jr.; Marletta, A.; Campana, P.T. Revisiting the conformational transition model for the pH dependence of BSA structure using photoluminescence, circular dichroism, and ellipsometric Raman spectroscopy. Int. J. Biol. Macromol. 2024, 259, 129142. [Google Scholar] [CrossRef]
- Sajib, M.; Forghani, B.; Vate, N.K.; Abdollahi, M. Combined effects of isolation temperature and pH on functionality and beany flavor of pea protein isolates for meat analogue applications. Food Chem. 2023, 412, 135585. [Google Scholar] [CrossRef] [PubMed]
- Mahmoudi, M.; Landry, M.P.; Moore, A.; Coreas, R. The protein corona from nanomedicine to environmental science. Nat. Rev. Mater. 2023, 87, 422. [Google Scholar] [CrossRef]
- Liu, W.; Rose, J.; Plantevin, S.; Auffan, M.; Bottero, J.Y.; Vidaud, C. Protein corona formation for nanomaterials and proteins of a similar size: Hard or soft corona? Nanoscale 2013, 5, 1658. [Google Scholar] [CrossRef]
- Mahmoudi, M.; Kalhor, H.R.; Laurent, S.; Lynch, I. Protein fibrillation and nanoparticle interactions: Opportunities and challenges. Nanoscale 2013, 5, 2570. [Google Scholar] [CrossRef]
- Sarimov, R.M.; Nagaev, E.I.; Matveyeva, T.A.; Binhi, V.N.; Burmistrov, D.E.; Serov, D.A.; Astashev, M.E.; Simakin, A.V.; Uvarov, O.V.; Khabatova, V.V.; et al. Investigation of Aggregation and Disaggregation of Self-Assembling Nano-Sized Clusters Consisting of Individual Iron Oxide Nanoparticles upon Interaction with HEWL Protein Molecules. Nanomaterials 2022, 12, 3960. [Google Scholar] [CrossRef]
- Akopdzhanov, A.G.; Shimanovskii, N.L.; Borisova, A.I.; Parshin, V.A.; Frolov, G.A. Magnetic Ferrite Nanoparticles as a Possible Platform for Magnetic-Resonance Contrast Agents. Pharm. Chem. J. 2020, 53, 1164. [Google Scholar] [CrossRef]
- Park, J.H.; Sut, T.N.; Jackman, J.A.; Ferhan, A.R.; Yoon, B.K.; Cho, N.J. Controlling adsorption and passivation properties of bovine serum albumin on silica surfaces by ionic strength modulation and cross-linking. Phys. Chem. Chem. Phys. 2017, 19, 8854. [Google Scholar] [CrossRef]
- Shkirin, A.; Suyazov, N.; Chirikov, S.; Chaikov, L.; Shermeneva, M.; Gudkov, S. Features of light scattering in turbid media as modeled for two-component emulsions. Phys. Wave Phenom. 2024, 32, 280–289. [Google Scholar] [CrossRef]
- Molkova, E.; Pustovoi, V.; Baimler, I.; Simakin, A.; Burmistrov, D.; Gorudko, I.; Gudkov, S. Optical Study of the Influence of the Medium Acidity on the Interaction between Gold Nanoparticles and Bovine Serum Albumin in Aqueous Solution. Phys. Wave Phenom. 2024, 32, 232–240. [Google Scholar] [CrossRef]
- Alzoubi, F.; Noqta, O.; AlZoubi, T.; AlJabaly, H.; Alkhateeb, H.; Alqadi, M.; Makhadmeh, G. Exploring the impact of pH on the properties of citric acid-coated iron oxide nanoparticles as high-performance T2 contrast agent for MRI applications. Results Eng. 2023, 18, 101206. [Google Scholar] [CrossRef]
- Serrano-Lotina, A.; Portela, R.; Baeza, P.; Alcolea-Rodríguez, V.; Villarroel, M.; Ávila, P. Zeta potential as a tool for functional materials development. Catal. Today 2023, 423, 113862. [Google Scholar] [CrossRef]
- Kosmulski, M. The pH dependent surface charging and points of zero charge. X. Update. Adv. Colloid Interface Sci. 2023, 319, 102973. [Google Scholar] [CrossRef]
- Li, J.; Li, L. Preparation of a novel nanoparticle with extruded soy protein isolate-oat β-glucan: Interfacial properties and mechanism of emulsion stability. Food Hydrocoll. 2024, 150, 109686. [Google Scholar] [CrossRef]
- García-Acevedo, P.; González-Gómez, M.A.; Arnosa-Prieto, Á.; de Castro-Alves, L.; Piñeiro, Y.; Rivas, J. Role of dipolar interactions on the determination of the effective magnetic anisotropy in iron oxide nanoparticles. Adv. Sci. 2023, 10, 2203397. [Google Scholar] [CrossRef]
- Zhang, W.; Zhang, Y.; He, Y.; Xu, X.; Zhao, X. Oil density and viscosity affect emulsion stability and destabilization mechanism. J. Food Eng. 2024, 366, 111864. [Google Scholar] [CrossRef]
- Rodríguez-Calderón, A.G.; Núñez-Anita, R.E.; Holguín-Momaca, J.T.; Contreras-García, M.E. Constructing Noncytotoxic Organometallic Nanostructures of Ag–BSA–CaCO3. Appl. Organomet. Chem. 2024, 38, e7745. [Google Scholar] [CrossRef]
- Esfandiary, R.; Middaugh, C.R. Ultraviolet absorption spectroscopy. In Analysis of Aggregates and Particles in Protein Pharmaceuticals; Wiley: Hoboken, NJ, USA, 2012; p. 169. [Google Scholar] [CrossRef]
- Sarimov, R.M.; Matveyeva, T.A.; Binhi, V.N. Laser interferometry of the hydrolytic changes in protein solutions: The refractive index and hydration shells. J. Biol. Phys. 2018, 44, 345. [Google Scholar] [CrossRef] [PubMed]
- Bag, S.; Mitra, R.; DasGupta, S.; Dasgupta, S. Inhibition of Human Serum Albumin Fibrillation by Two-Dimensional Nanoparticles. J. Phys. Chem. B 2017, 121, 5474. [Google Scholar] [CrossRef]
- Nan, Z.; Hao, C.; Ye, X.; Feng, Y.; Sun, R. Interaction of graphene oxide with bovine serum albumin: A fluorescence quenching study. Spectrochim. Acta Part A Mol. Biomol. Spectrosc. 2019, 210, 348. [Google Scholar] [CrossRef]
- Wang, Y.; Xie, Y.; Li, T.; Wang, Y.; Jiang, J.; Zhang, X.; Xia, B.; Wang, S.; Huang, J.; Dong, W. Pickering emulsions with high ionic strength resistance stabilized by pea protein isolate-polyglycerol conjugate particles with good biocompatibility. Int. J. Biol. Macromol. 2024, 269, 131797. [Google Scholar] [CrossRef]
- Shahabadi, N.; Zendehcheshm, S.; Mahdavi, M. Exploring the In-Vitro Antibacterial Activity and Protein (Human Serum Albumin, Human Hemoglobin and Lysozyme) Interaction of Hexagonal Silver Nanoparticle Obtained from Wood Extract of Wild Cherry Shrub. ChemistrySelect 2023, 8, e202204672. [Google Scholar] [CrossRef]
- Khan, S.; Cho, W.C.; Hussain, A.; Azimi, S.; Babadaei, M.M.N.; Bloukh, S.H.; Edis, Z.; Saeed, M.; Hagen, T.L.T.; Ahmadi, H. The interaction mechanism of plasma iron transport protein transferrin with nanoparticles. Int. J. Biol. Macromol. 2023, 240, 124441. [Google Scholar] [CrossRef]
- Honcharova, O.; Dmytrenko, O.; Lesiuk, A.; Kulish, M.; Pavlenko, O.; Naumenko, A.; Doroshenko, I.Y.; Zholobak, N.; Kaniuk, M. Binding parameters and conjugation mechanisms in the solutions of BSA with antioxidant CeO2 nanoparticles. Mol. Cryst. Liq. Cryst. 2023, 750, 144–154. [Google Scholar] [CrossRef]


| Properties of Aqueous Colloid of Nanoparticles | |
|---|---|
| Average hydrodynamic diameter (DLS), nm | ~10 |
| Average size of nanoparticles (TEM image), nm | ~3–5 |
| Functional groups on the surface | Sodium citrate |
| Shape | Spherical |
| PDI (Polydispersity Index) | 0.39 |
| Concentration, particles/ml | ~5 × 10¹² |
| Concentration, mg/ml | 0.0125 |
| ζ-potential, mV | −26.4 |
| pH | 8.2 |
| Colloidal Solution | Zeta Potential, mV | |||
|---|---|---|---|---|
| pH 2.0 | pH 5.0 | pH 8.0 | pH 12.0 | |
| IONPs | −6.4 ± 0.4 | −23.8 ± 0.5 | −27.4 ± 2.3 | −35.6 ± 3.9 |
| BSA | +8.0 ± 0.4 | −2.7 ± 0.8 | −20.8 ± 1.3 | −23.6 ± 1.1 |
| BSA + IONPs | +24.5 ± 0.2 | −8.4 ± 1.0 | −15.8 ± 0.6 | −33.0 ± 0.1 |
Disclaimer/Publisher’s Note: The statements, opinions and data contained in all publications are solely those of the individual author(s) and contributor(s) and not of MDPI and/or the editor(s). MDPI and/or the editor(s) disclaim responsibility for any injury to people or property resulting from any ideas, methods, instructions or products referred to in the content. |
© 2025 by the authors. Licensee MDPI, Basel, Switzerland. This article is an open access article distributed under the terms and conditions of the Creative Commons Attribution (CC BY) license (https://creativecommons.org/licenses/by/4.0/).
Share and Cite
Molkova, E.A.; Sarimov, R.M.; Matveeva, T.A.; Simakin, A.V.; Akopdzhanov, A.G.; Serov, D.A.; Rebezov, M.B.; Astashev, M.E.; Sergienko, K.V.; Sevostyanov, M.A.; et al. Optical Investigation of the Combined Effect of pH and Temperature on the Interactions of BSA Protein with Iron Oxide Nanoparticles. Colloids Interfaces 2025, 9, 45. https://doi.org/10.3390/colloids9040045
Molkova EA, Sarimov RM, Matveeva TA, Simakin AV, Akopdzhanov AG, Serov DA, Rebezov MB, Astashev ME, Sergienko KV, Sevostyanov MA, et al. Optical Investigation of the Combined Effect of pH and Temperature on the Interactions of BSA Protein with Iron Oxide Nanoparticles. Colloids and Interfaces. 2025; 9(4):45. https://doi.org/10.3390/colloids9040045
Chicago/Turabian StyleMolkova, Elena A., Ruslan M. Sarimov, Tatyana A. Matveeva, Alexander V. Simakin, Arthur G. Akopdzhanov, Dmitriy A. Serov, Maksim B. Rebezov, Maxim E. Astashev, Konstantin V. Sergienko, Mikhail A. Sevostyanov, and et al. 2025. "Optical Investigation of the Combined Effect of pH and Temperature on the Interactions of BSA Protein with Iron Oxide Nanoparticles" Colloids and Interfaces 9, no. 4: 45. https://doi.org/10.3390/colloids9040045
APA StyleMolkova, E. A., Sarimov, R. M., Matveeva, T. A., Simakin, A. V., Akopdzhanov, A. G., Serov, D. A., Rebezov, M. B., Astashev, M. E., Sergienko, K. V., Sevostyanov, M. A., Khort, D. O., Smirnov, I. G., Dorokhov, A. S., Izmailov, A. Y., & Gudkov, S. V. (2025). Optical Investigation of the Combined Effect of pH and Temperature on the Interactions of BSA Protein with Iron Oxide Nanoparticles. Colloids and Interfaces, 9(4), 45. https://doi.org/10.3390/colloids9040045