3.1. Crystal Structure
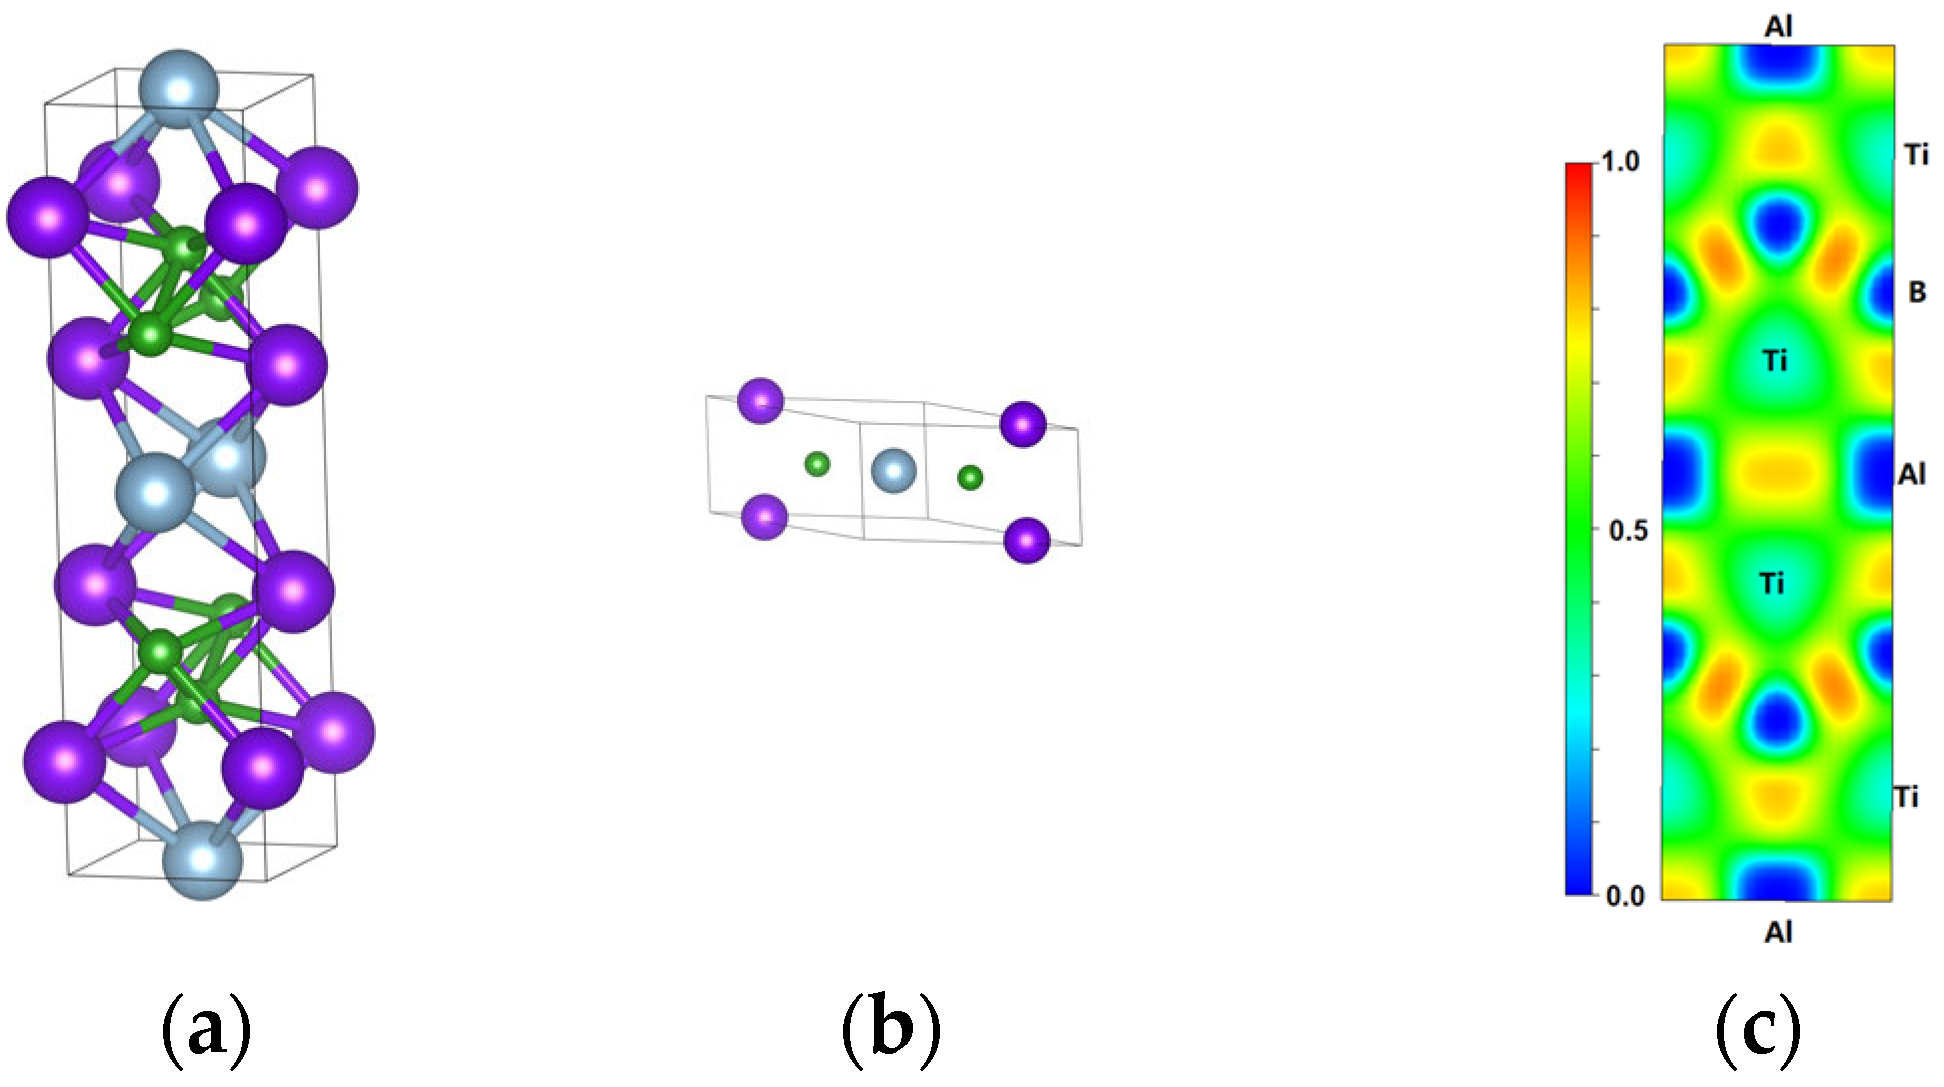
As shown in
Figure 1a,b, Ti
2AlB
2 is composed of three elements: titanium (Ti) in purple, aluminum (Al) in bright grey, and boron (B) in green. It belongs to the orthorhombic crystal system, and its space group is Cmmm (No. 65). Due to the differences in atomic types and sizes between Ti, Hf, Al, In, and Sn in Ti
2AlB
2 and Hf
2AB
2 (A = In, Sn), the types of chemical bonds and bond lengths formed between the different atoms—Al, In, Sn, Ti, Hf, and boron (B)—vary. This variation results in changes to the bonding modes and spatial distribution of the atoms, ultimately leading to distinct spatial group configurations in the crystals of Ti
2AlB
2 and Hf
2AB
2 (A = In, Sn) [
33]. The lattice parameters of Ti
2AlB
2 are as follows:
a = 11.32 Å,
b = 2.98,
c = 3.29 Å, and
α =
β =
γ = 90°. The structure of Ti
2AlB
2 can be described as an alternating stacking of Ti-B nanolayers and Al monolayers. The Ti-B nanolayer maintains the atomic arrangement characteristic of the binary boride, while the Al layer contributes additional structural stability. This configuration imparts Ti
2AlB
2 materials with distinctive physical properties, including high fracture toughness, excellent damage tolerance, and good oxidation resistance.
As shown in
Figure 1c, bonding information is obtained using the Electron Localization Function (ELF) of Ti
2AlB
2 (001) surface. In the ELF distribution, values of 1, 0.5, and 0 represent absolutely localized electrons, uniformly distributed electrons, and ultra-low density electrons, respectively [
42]. It was observed that all Ti, Al, and B ions in the Ti
2AlB
2 structure were immersed in a relatively uniform electron gas (indicated by the green region). A covalent bond was established between B and B, while a weaker covalent bond appears to exist between Ti and B. Additionally, a quasi-electron gas, characteristic of metallic bonding, is present between Ti and Al. The presence of Ti atoms may interfere with the interactions between Al and B, resulting in the formation of localized electrons.
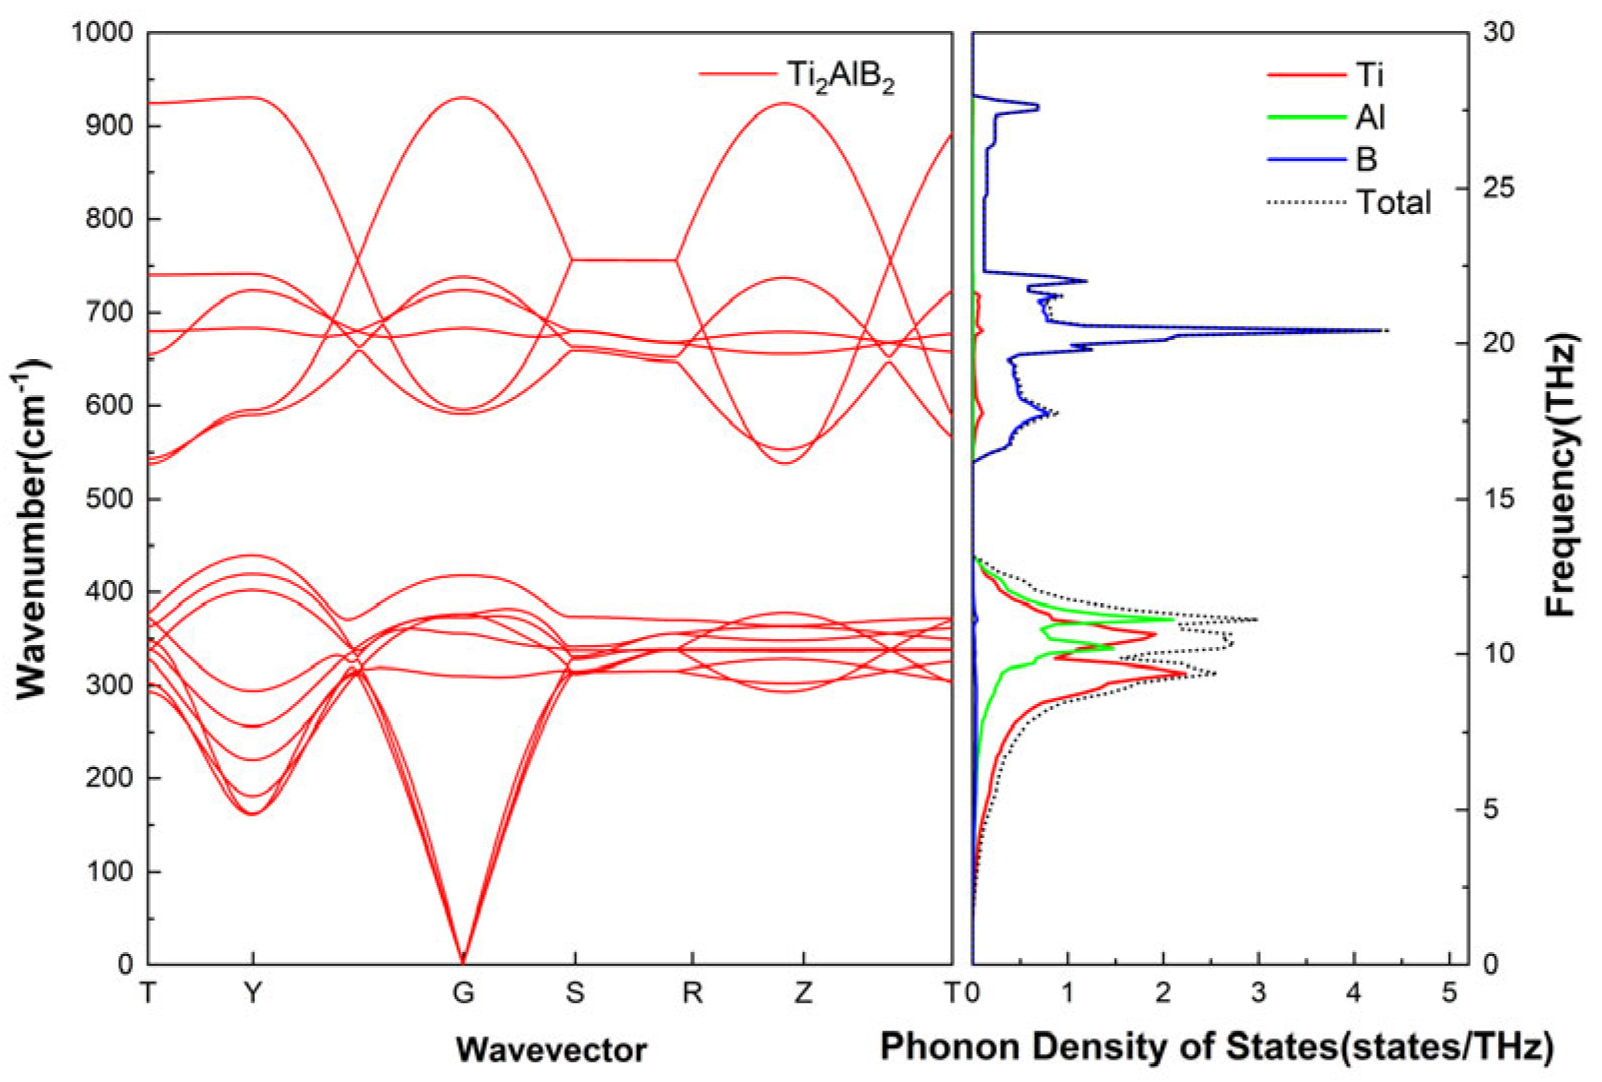
3.3. Phonon Dispersion
As shown in
Figure 3, there are Ti, Al, and B in Ti
2AlB
2. The varying atomic masses and chemical bonding characteristics result in a specific range of phonon vibration frequencies, leading to distinct phonon spectra and densities of states. The frequency of phonon vibrations associated with Ti and Al is relatively low. In contrast, the B atom may induce higher frequency phonon vibrations due to its smaller atomic mass and the stronger chemical bonds it forms with surrounding atoms.
In the low wave vector region, the frequency of the acoustic phonons in Ti2AlB2 exhibits a significant linear relationship with the wave vector. This relationship corresponds to the collective low-frequency vibrations of the atoms within the Ti2AlB2 crystal, akin to the propagation of elastic waves in the material. The contribution to this region primarily arises from the out-of-plane vibrations of the heavy atom Ti and the weak bonding vibrations of the Al layer. The optical branch phonon frequency in the lower region of Ti2AlB2 is elevated, corresponding to the relative vibrations between different atoms within the unit cell. At the same time, the intensity and direction of chemical bonds, such as Ti-B and Al-B, will affect the vibration mode and frequency distribution of optical phonons. The dispersion curve of Ti2AlB2 optical phonons is relatively flat in the range of 300–400 cm−1, and the phonon group velocity in this region is small. The optical phonon dispersion in the higher frequency region of Ti2AlB2 is primarily influenced by the vibrations of the light atom B, particularly the B-B stretching vibrations and the stretching modes of the Ti-B bonds. Due to the complexity of the crystal structure, the phonon density of states curve for Ti2AlB2 exhibits multiple peaks, which correspond to the various vibrational modes and frequency ranges associated with the Ti-Ti, Ti-Al, and Ti-B bonds, among others.
3.4. Optical Properties
In this paper, we calculate the optical properties of the Ti
2AlB
2 material, including the absorption coefficient, refractive index, reflectivity, dielectric constant, and loss function. Typically, the linear optical response function can be expressed using the complex dielectric function
ε(ω). The expression for the complex dielectric function is as follows:
In the formula above,
ε1(ω) represents the real part of the dielectric function, while
ε2(ω) denotes the imaginary part, and
ω represents frequency. The momentum matrix elements of the occupied and unoccupied wave functions can be used to obtain the direct transition probability, as well as to apply the Kramers-Kronig dispersion relation theory [
43,
44]. At the same time, the relationship between the complex refractive index and the complex relative permittivity is utilized.
where
represents refractive index,
represents extinction coefficient. According to Formulas (2)–(4), we can get:
The absorption coefficient
of an object can be expressed as
where
c represents the speed of light in a vacuum, it can be observed that the absorption coefficient is proportional to the imaginary component of the dielectric function.
The other optical properties, such as reflectivity R(ω) and the energy loss function L(ω), can also be derived from the real and imaginary parts of the dielectric function, as shown in Equations (8) and (9).
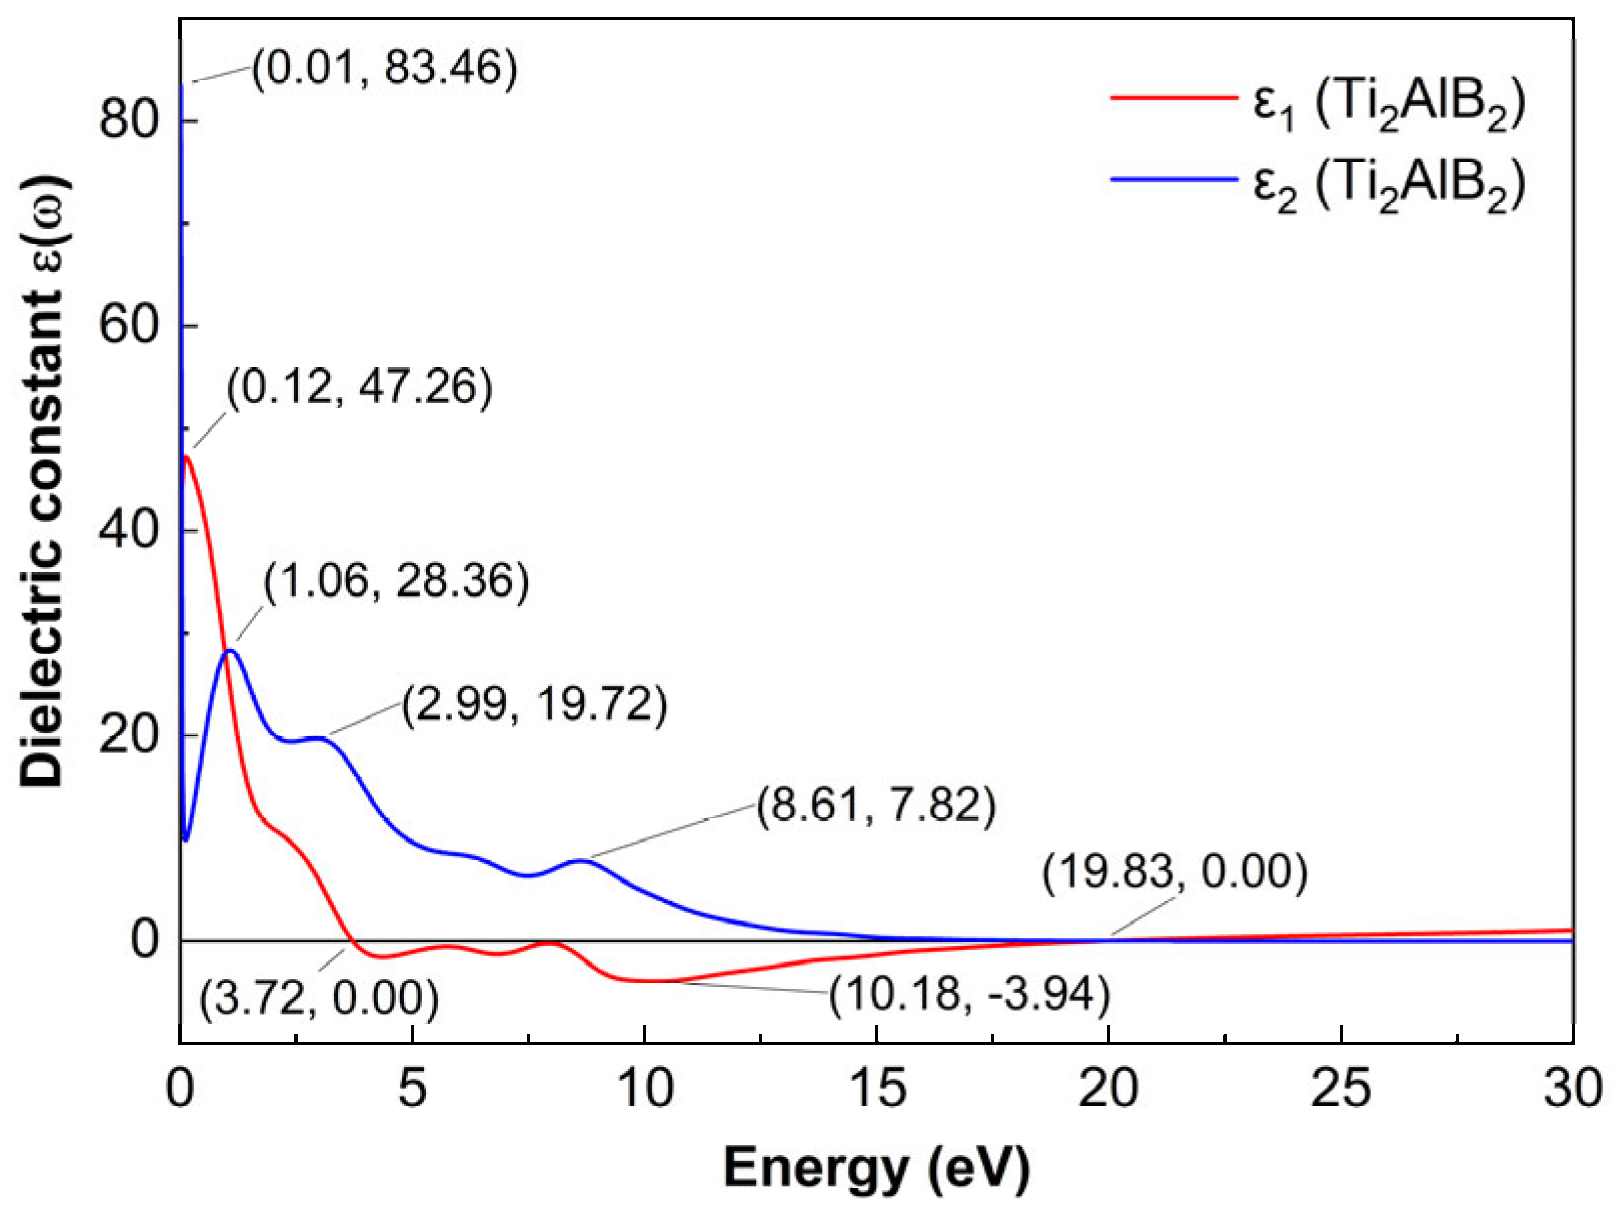
3.4.1. Dielectric Constant
In this paper, the static dielectric constant ε1(0) of Ti2AlB2 is as high as 83.46 at 0.01 eV. This indicates that the crystal structure contains a significant number of free electrons, further demonstrating the metallic conductivity of Ti2AlB2 and confirming the Drude-like behavior (metallic characteristics) of MAlB system materials.
Here, electrons in metal conductors experience both intra-band and inter-band transitions, with inter-band transitions significantly influencing the complex dielectric constant. Consequently, we must employ the Drude model to calculate the imaginary part of the dielectric constant [
45]:
where
is the plasma frequency and
is the relaxation polarization time. The imaginary part ε
2 of the complex dielectric constant arises from various relaxation polarizations, which occur due to the internal polarization of the material’s inability to adapt to changes in the external high-frequency electric field. This represents the loss term of the material.
The complex dielectric function describes the response of the material to electromagnetic radiation. The real part
ε1 represents the degree of polarization of the compound. The higher the degree of polarization, the greater the value of
ε1. And the imaginary part,
ε2, is associated with dielectric loss. As shown in
Figure 4, the dielectric constant of the Ti
2AlB
2 material is presented. A notable peak of
ε1 at 0.12 eV reaches 47.26, indicating that Ti
2AlB
2 possesses strong polarization capabilities and a significant electrical energy storage capacity. The dielectric constant,
ε1, decreases continuously within the range of 0.12 to 10.18 eV and exhibits oscillations between 3.72 eV and 10.18 eV. It approaches zero at 3.72 eV, subsequently becoming negative. At 10.18 eV,
ε1 attains its minimum value of −3.94. In the energy ranges of 10.18 eV to 19.83 eV to 30 eV, the real part of the dielectric function,
ε1, gradually increases. A significant absorption peak of the imaginary part,
ε2, near 0.01 eV reaches a value of 83.46, indicating that Ti
2AlB
2 may exhibit higher dielectric loss, which results in the absorption of electromagnetic wave energy during propagation. On the whole,
ε2 decreases in the range of 1.06 eV–30 eV, and there is a shock peak in the middle, and finally gradually approaches between 0 and 3.
At the same time, the ε1 curve becomes negative at approximately 3.72 eV to 19.83 eV. When the incident light energy is less than zero in the real part of the dielectric function of Ti2AlB2, it indicates that light cannot propagate within the corresponding energy range. And there are notable peaks of ε2 in the low photon energy region. These peaks indicate transitions of electrons between Ti-3d and B-p or Ti-3d and Al-p orbitals, which is consistent with the results of the projected density of states (PDOS).
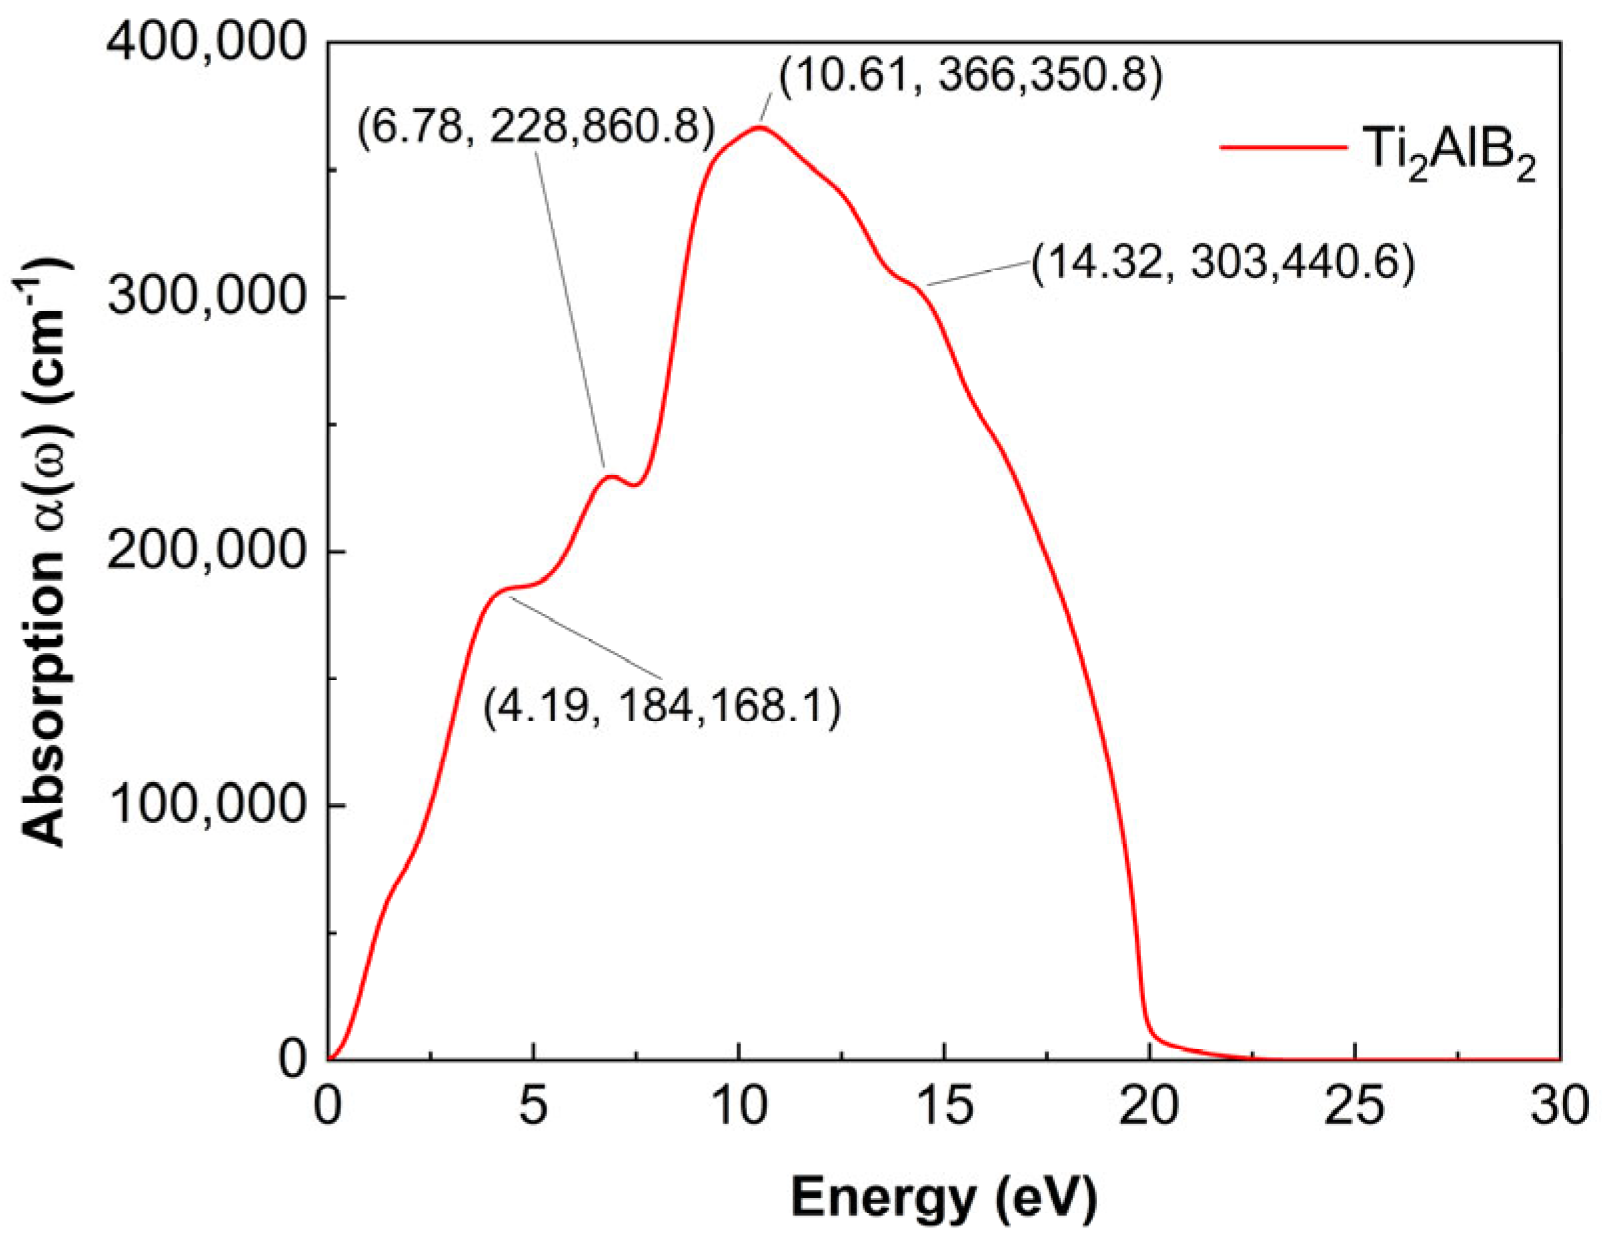
3.4.2. Absorption Coefficient
As shown in
Figure 5, the absorption coefficient of the Ti
2AlB
2 material is depicted in the diagram. The higher absorption peaks occur at photon energies of 4.19 eV, 6.78 eV, and 10.61 eV, and 14.32 eV, reaching values of 184,168.1 cm
−1, 228,860.8 cm
−1, 366,350.8 and 303,440.6 cm
−1, respectively. This indicates that the material exhibits strong absorption capacity at these energy levels.
On the whole, the peaks at 0–10.61 eV continue to rise, while a valley appears at about 23 eV. A peak emerges near 10.61 eV and reaches its maximum. And the absorption spectra of Ti2AlB2 exhibit an approximately linear behavior in the infrared, visible, near-ultraviolet, and mid-ultraviolet regions.
Several peaks are observed in the far-ultraviolet and extreme-ultraviolet regions. This phenomenon is attributed to the presence of Ti-B covalent bonds in Ti2AlB2. The density of states graph indicates that these peaks are primarily the result of electron transitions between the Ti d orbitals and the B s and B p orbitals. Similar to metals, Ti2AlB2 exhibits an absorption spectral coefficient on the order of 105, allowing Ti2AlB2 to absorb photons from electromagnetic waves in the ultraviolet region without an optical band gap. The fundamental reason for this phenomenon may be attributed to the role of metallic bonding in Ti2AlB2. At the same time, it has been found that they possess a high absorption capacity within a specific wavelength range, which is highly advantageous for optoelectronic applications.
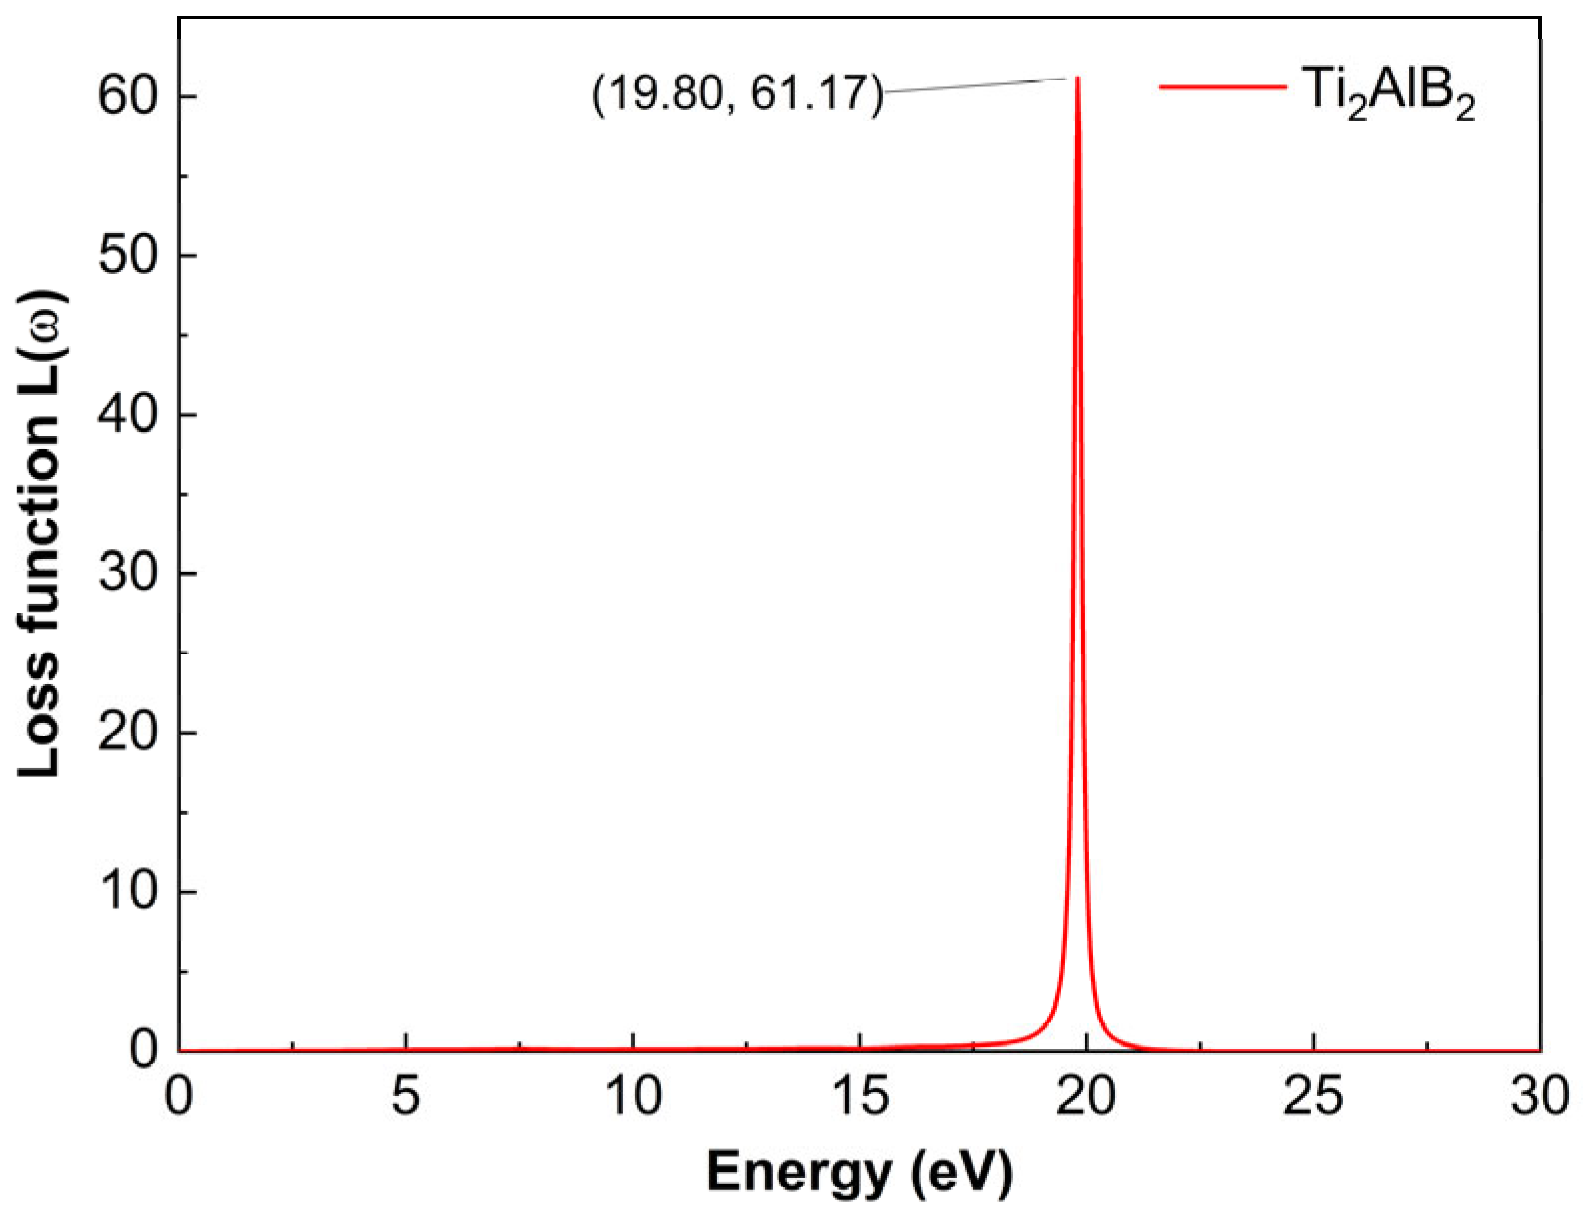
3.4.3. Loss Function
Figure 6 shows the loss function of Ti2AlB2. The loss function L
(ω) describes the energy loss rate when electrons traverse the material. The L
(ω) spectrum of the plasmon resonance in the Ti2AlB2 structure exhibits a prominent peak at 19.80 eV corresponding to 61.17. The energy loss function represents the energy loss of photons as they traverse a crystal, with its peak corresponding to the plasma frequency. The peak of Ti2AlB2 at 19.80 eV may represents the plasma frequency
. When the frequency of the incident light exceeds the plasma frequency, the material becomes transparent.
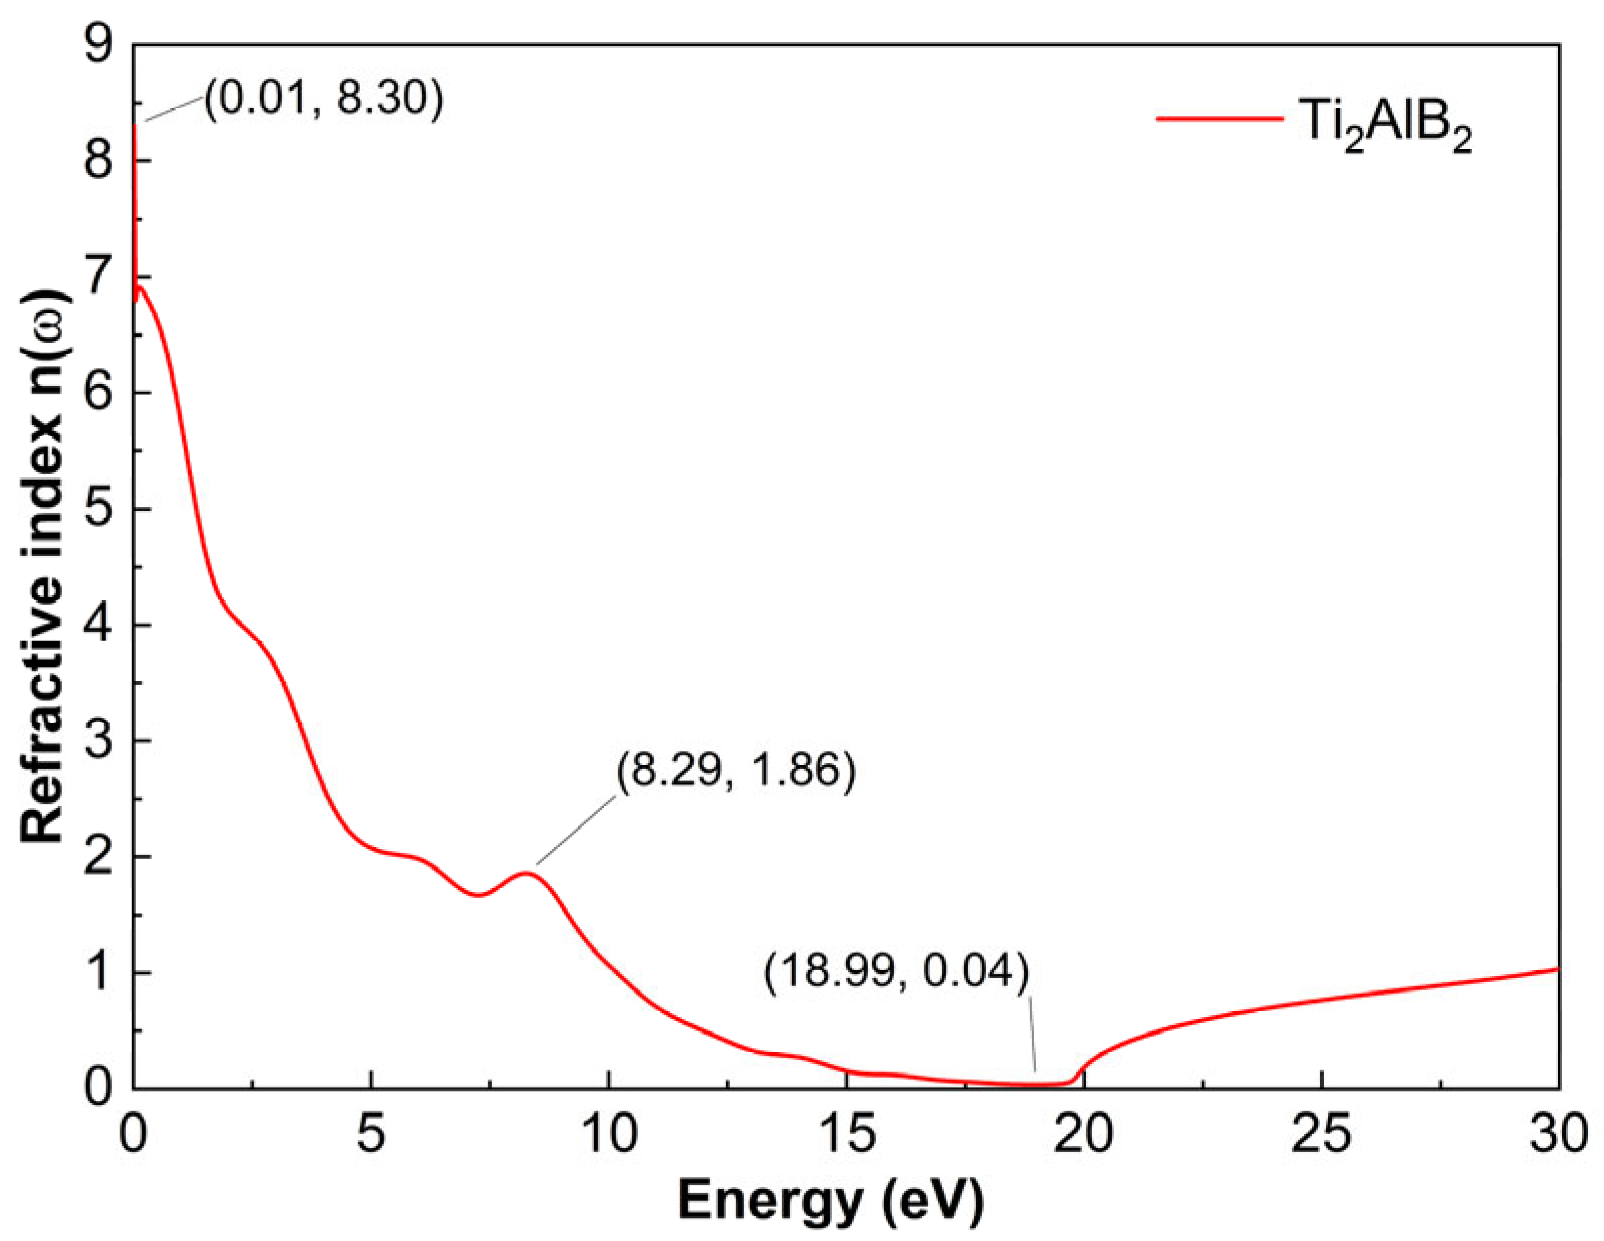
3.4.4. Refractive Index
As shown in
Figure 7, the refractive index of the Ti
2AlB
2 material is presented. A higher value is observed at 0.01 eV, where
n reaches 8.30, indicating that the refractive index is greater at this energy level. Overall, the refractive index decreases continuously within the range of 0 to 18.70 eV, reaching a minimum value of 0.37 at 18.70 eV. The refractive index, n, decreases gradually with increasing photon energy, demonstrating an anomalous dispersion relationship. Then, it rises gradually within the range of 18.70 eV. The refractive index
n increases slowly with the rise in energy, demonstrating a normal dispersion relationship.
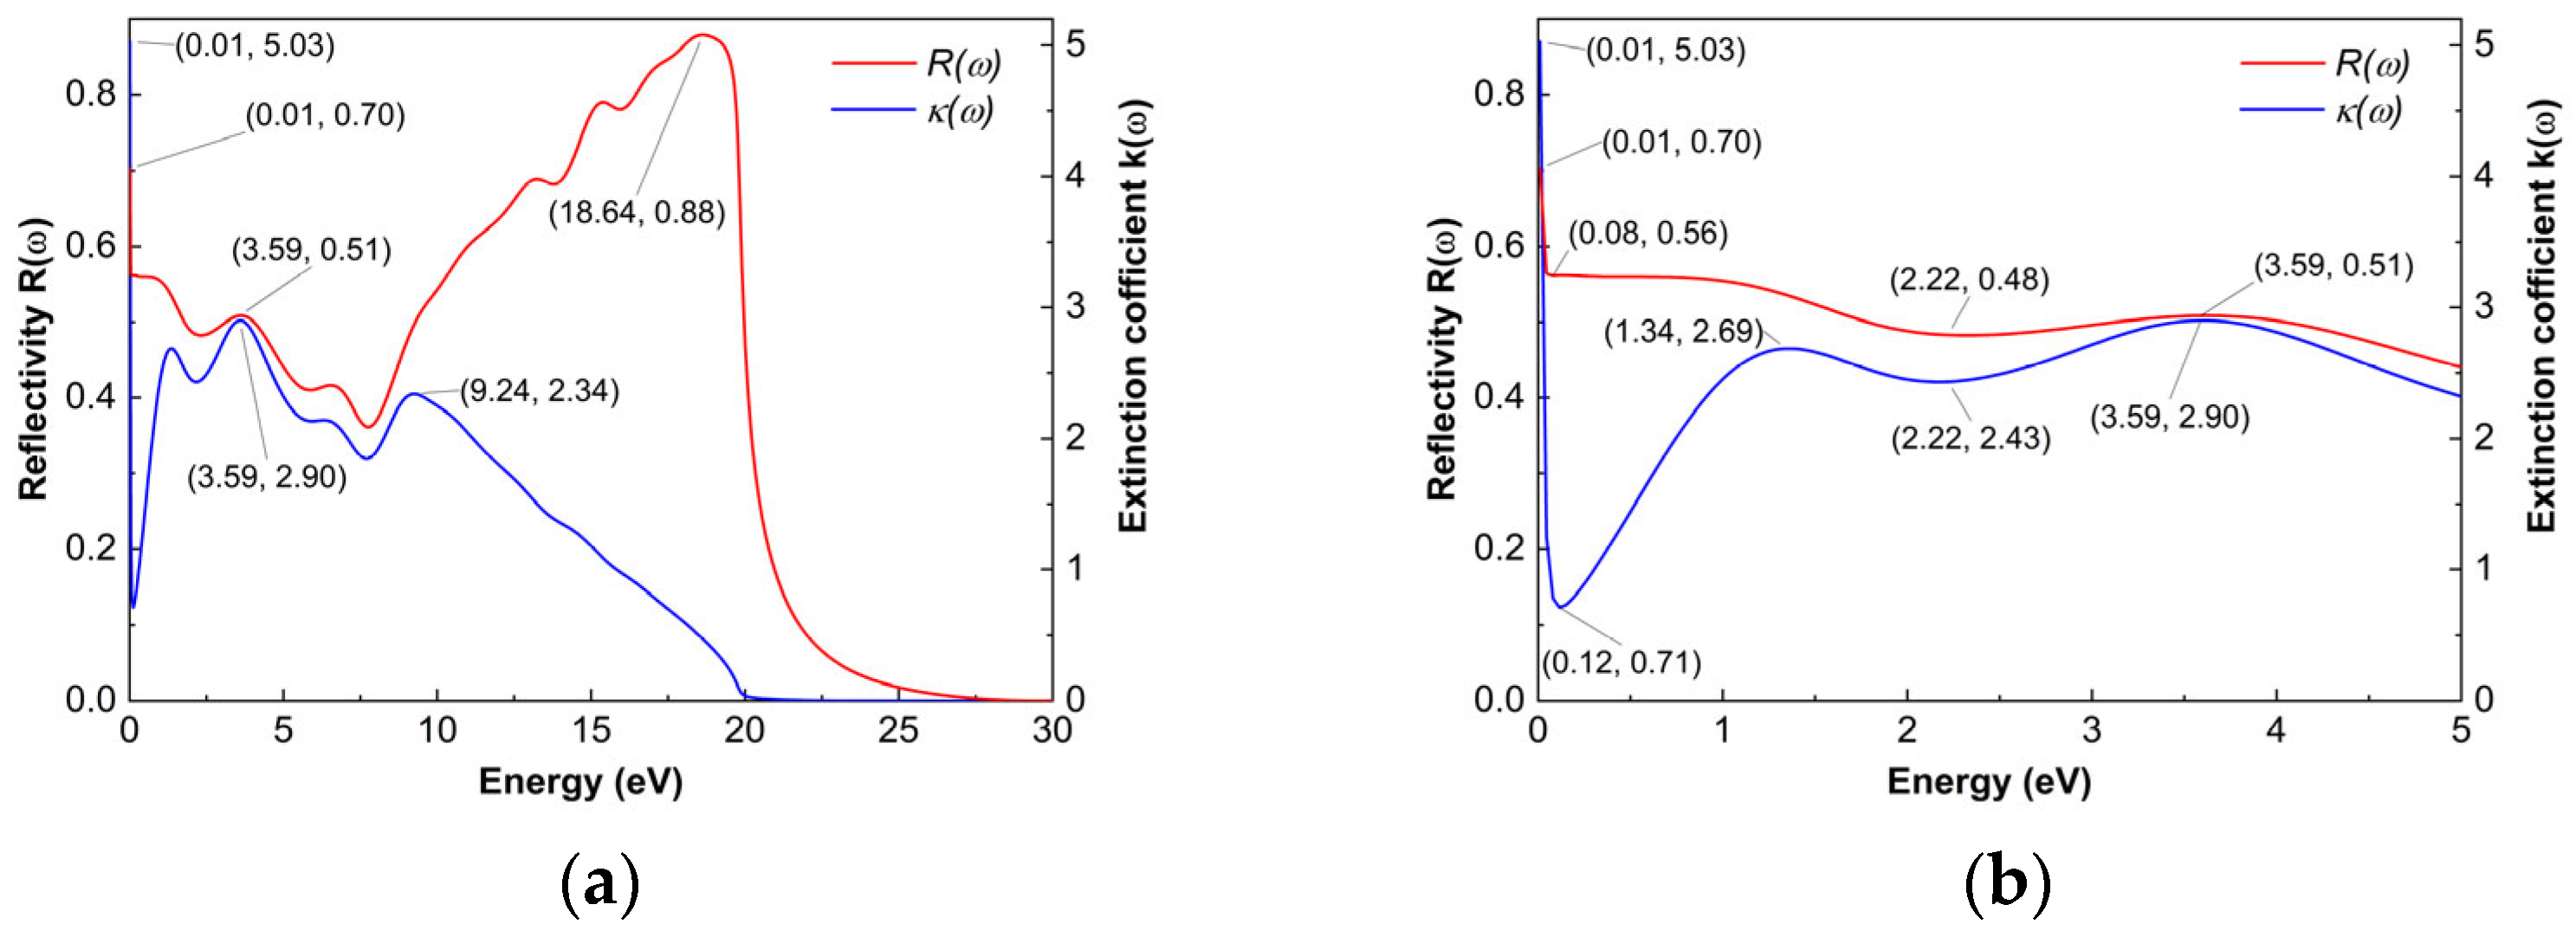
3.4.5. Reflectivity and Extinction Coefficient
As shown in
Figure 8a, the reflectivity of Ti
2AlB
2 exceeds 44% in the energy range of 0 to 5 eV. And at 0.01 eV, it obtained a value of 70%. At 18.6 eV, the maximum is reached at 88%. Notably, in the region between 3.72 eV and 19.83 eV, the reflectivity is particularly high, and
ε1(ω) is less than 0. During this range, certain near-ultraviolet, medium-ultraviolet, and some far-ultraviolet light cannot propagate through the crystal, resulting in pronounced reflective characteristics in these wavelengths. The reflectivity reaches a minimum value of 0 at approximately 28 eV, rendering the material colorless and transparent to incident light in this range. This phenomenon is closely related to the extinction coefficient.
As shown in
Figure 8a, the extinction coefficient of the Ti
2AlB
2 material is presented. Within the energy range of 0.01 eV to 21.2 eV, the extinction coefficient
k(ω) gradually decreases from 5.03 of the maximum value to 0 of the minimum value. At approximately 21.2 eV to 30 eV, the extinction coefficient
k(ω) attains a minimum value of 0, indicating that the material is colorless and transparent to incident light in this region.
And, as illustrated in
Figure 8b, within the energy range of 2.69 eV to 5 eV, the reflectivity shows a strong correlation with the extinction coefficient. The specific relationship between reflectivity and the extinction coefficient is described by Equation (8), where the peaks in the extinction coefficient typically correspond to variations in reflectivity. This finding also highlights the consistency between the complex refractive index model and the energy absorption mechanism, as well as the validity of the model calculations for the Ti
2AlB
2 sample.
It can be observed from the diagram that the trend in reflectivity of Ti2AlB2 as a function of incident photon energy closely aligns with that of its corresponding ε(ω) and extinction coefficient k(ω). The transitions associated with the reflectivity spectrum of Ti2AlB2 primarily occur at energies of 0.01 eV, 3.59 eV, and 18.64 eV, with reflectivity values of 70%, 51% and 88%, respectively. This indicates that Ti2AlB2 exhibits strong reflective properties for near-infrared, visible, and ultraviolet light. Near 1 eV lies the exciton absorption region of Ti2AlB2. In this vicinity, the imaginary part of the dielectric function, ε2(ω), reaches a larger values of 28.36 at 1.06 eV, indicating the strongest light absorption of the system. This value is also closely aligned with the calculated peak of the extinction coefficient, k, at 1.34 eV. The energy range of Ti2AlB2 spans from 21.2 eV to 30 eV, placing it within the far ultraviolet region.
As shown in Figure, the reflectivity of the Ti2AlB2 material is notably high, exceeding 44% in the range of 0 to 5 eV. In contrast, the reflectivity in some regions approaches 0%, allowing the corresponding incident light to pass through transparently. According to reports, compounds with an average R(ω) value greater than 43% in the visible spectrum can reflect most of the solar spectrum. Therefore, the Ti2AlB2 material examined in this paper has significant potential as a spacecraft coating material, effectively reflecting the heat generated by solar radiation. The calculated reflectivity curve of the Ti2AlB2 material enhances our understanding of its light reflection characteristics and serves as a valuable reference for the design of optical films and reflective components.
3.5. Lattice Thermal Conductivity
The lattice thermal conductivity of the material is positively correlated with phonon relaxation time and group velocity, while it is negatively correlated with the Grüneisen parameter (γ), phase space (), the number of scattering channels, and the phonon scattering rate. These factors can be accurately calculated using ShengBTE software.
The lattice thermal conductivity is calculated as follows [
46]:
where V is the volume of primitive cell,
is the Boltzmann constant.
T is temperature.
is the Bose-Einstein distribution depending on the phonon frequency.
is phonon mode. And
represents Reduced Planck constant.
represents the phonon group velocity,
denotes the phonon relaxation time (the reciprocal of the scattering rate), and
is influenced by disordered two-phonon scattering and three-phonon anharmonic scattering of isotopes. If we consider a reciprocal lattice with phonon branches and a specific volume in the Brillouin zone, we define the total phase space available for three-phonon processes (both normal and umklapp) as the sum of all possible modes of the three phonons, constrained by certain conditions:
where Ω is a normalization factor,
corresponds to absorption processes,
corresponds to emission processes. And
where
corresponds to absorption processes and
corresponds to emission processes.
represents phonon momentum. Finally, there is a physical relationship among the anharmonic three-phonon scattering rate (
), the phonon phase space (
), and the Grüneisen parameter (
γ). Together with the phonon group velocity (
) and the phonon relaxation time (
), these factors become the primary determinants of the lattice thermal conductivity [
39,
47,
48,
49,
50,
51].
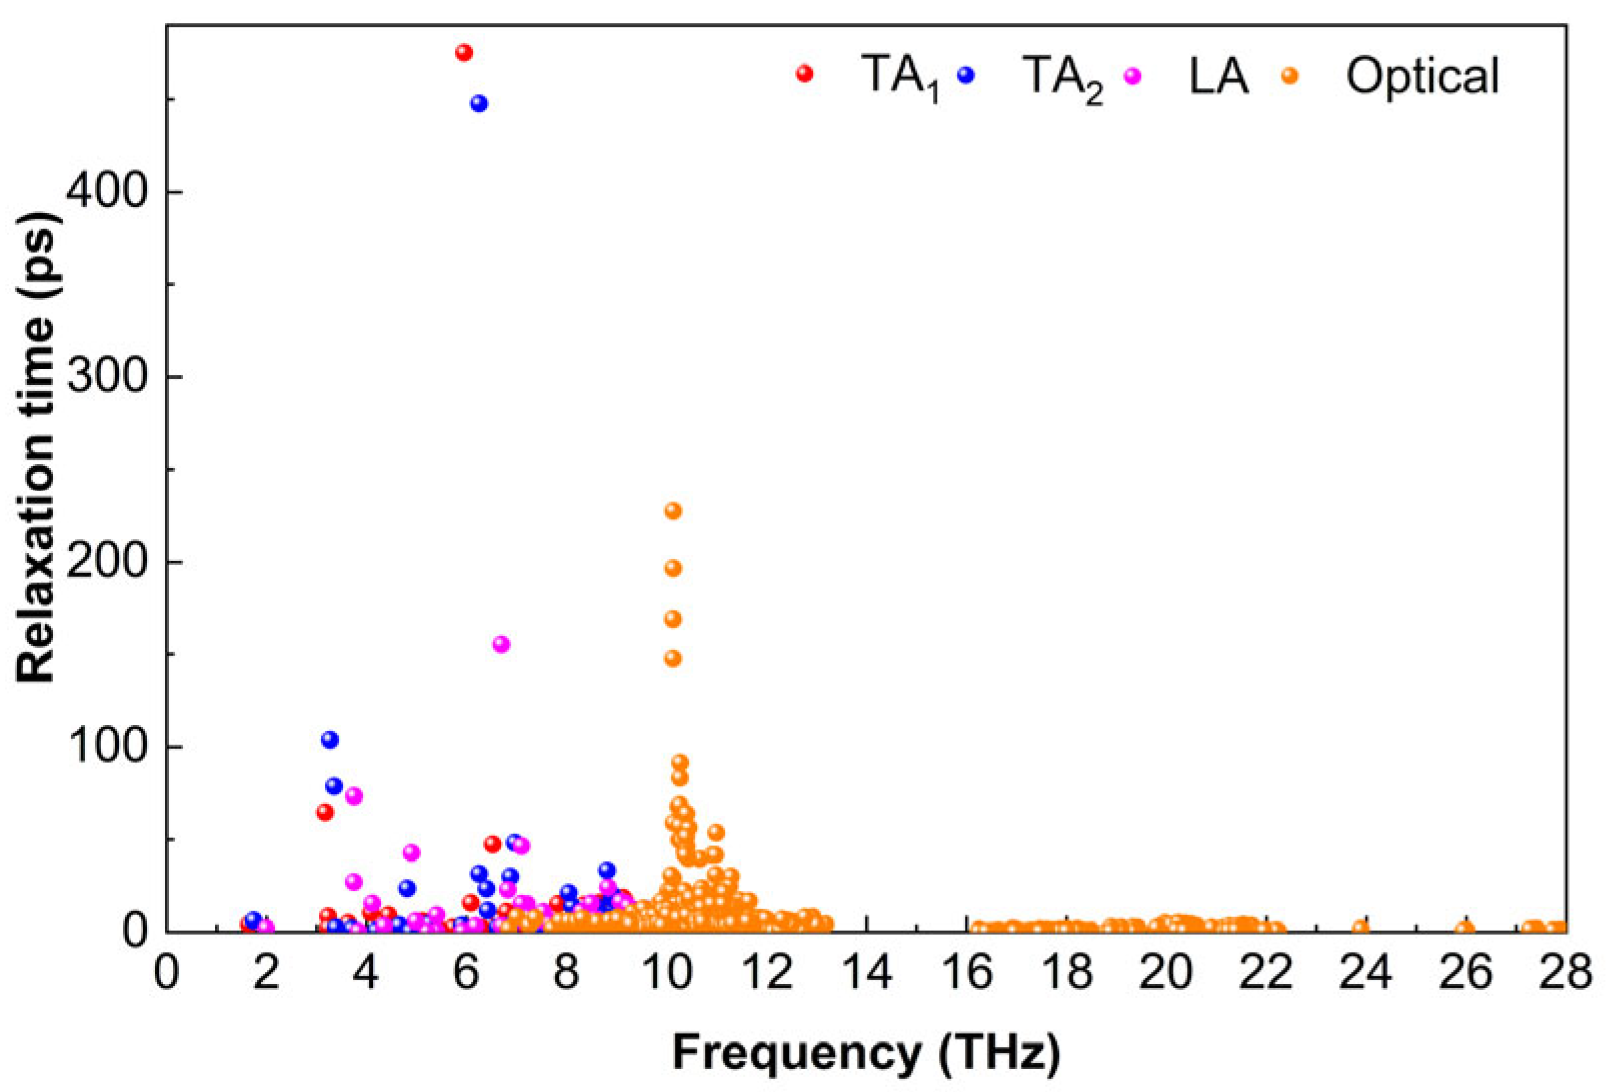
3.5.1. Phonon Relaxation Time
The relaxation time of phonons is determined by the accumulation of various scattering processes, including inverse scattering, boundary scattering, and defect scattering. As the anharmonic interaction increases, the strength of phonon-phonon interactions also increases, resulting in a decrease in the thermal conductivity of the lattice. The key parameter, phonon relaxation time (τ), can be calculated using ShengBTE software to obtain the total scattering rate of phonons. The phonon relaxation time is the reciprocal of the total scattering rate, which is comprised of the isotope scattering rate and the anharmonic three-phonon scattering rate.
As shown in
Figure 9, the relaxation time of Ti
2AlB
2 at 300 K varies with frequency. In the low-frequency range, the relaxation time of the acoustic phonon and low-frequency optical phonon modes is comparable to that of the acoustic phonon mode. The acoustic branch of Ti
2AlB
2 exhibits a significantly larger relaxation time, while the optical branch demonstrates a relatively smaller relaxation time. The relaxation time associated with the TA
1 branch is below the maximum value of 474.9 ps, while the phonon relaxation time for the TA
2 branch is below 447.7 ps. The relaxation time for the LA mode is relatively short, measuring approximately 155.3 ps. Within the frequency range of 9.2 to 27.9 THz, the phonon relaxation time is predominantly influenced by the optical branch, which is below 227.5 ps. In the frequency range of 6.8 to 9.9 THz, it partially overlaps with the TA
1, TA
2, and LA branches.
At 300 K, the TA1, TA2, LA, and optical phonons of Ti2AlB2 exhibit longer relaxation times, resulting in reduced phonon scattering in the low-frequency region. This increased phonon relaxation time suggests that phonons play a significant role in the heat transport process, potentially contributing to the higher thermal conductivity of Ti2AlB2. In the middle and high-frequency range (7.9–13.2 THz), the relaxation times of optical phonons are also substantial, with most values falling between 0 and 30.5 ps. While the middle and high-frequency optical phonon modes participate in thermal transport, the lattice thermal conductivity is predominantly influenced by acoustic phonon modes and low-frequency optical modes.
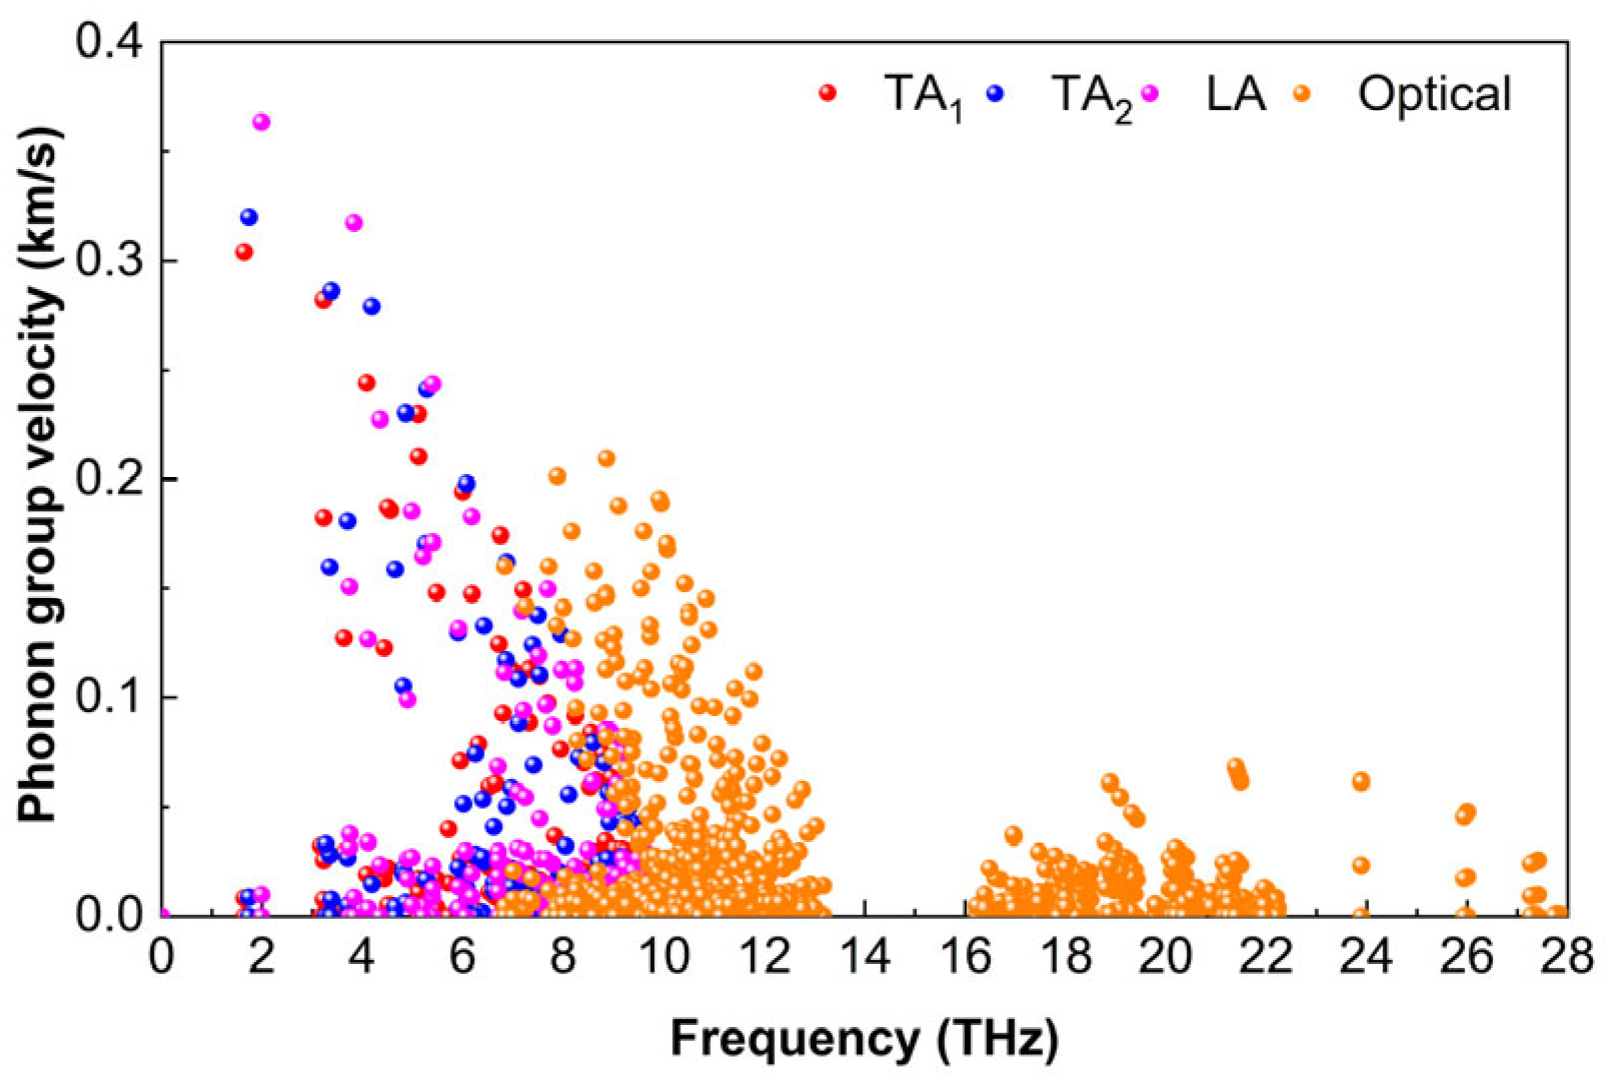
3.5.2. Group Velocity
The phonon group velocity υ is the derivative of the frequency to the wave vector, which is an important factor in the evaluation of heat transport capacity. The phonon group velocity can be calculated from the change trend of the phonon dispersion [
52], which can be expressed as follows:
where
is the phonon frequency. And q represents wave vector. In
Figure 10, it is evident that the phonon group velocity of Ti
2AlB
2 is relatively low. The TA
1, TA
2, and LA modes of Ti
2AlB
2 exhibit group velocities that are close to those of the optical branch, while the acoustic branch is primarily concentrated in the range of 1 THz to 10 THz. Among these, the TA
1 mode has the smallest phonon group velocity, with a maximum value of approximately 0.30 km/s. In the low-frequency region, LA phonons exhibit the highest group velocity, with some reaching 0.36 km/s. In contrast, a limited number of TA
2 phonons attain approximately 0.32 km/s. The group velocity of optical phonons is significantly lower than that of acoustic phonons in the frequency range of 6.8 THz to 13.0 THz, with a maximum velocity of only 0.21 km/s. Additionally, the optical branch in the high-frequency range (16.2 THz to 27.9 THz) demonstrates a notably low group velocity of just 0.07 km/s.
The low phonon group velocity of Ti2AlB2 can largely be attributed to the weak M-Al and Al-B bonds, as well as the high average atomic mass of Ti2AlB2, which collectively result in a relatively low overall group velocity. However, since group velocity is not the sole factor influencing the lattice thermal conductivity of Ti2AlB2, the thermal conductivity cannot be fully predicted based on phonon group velocity alone.
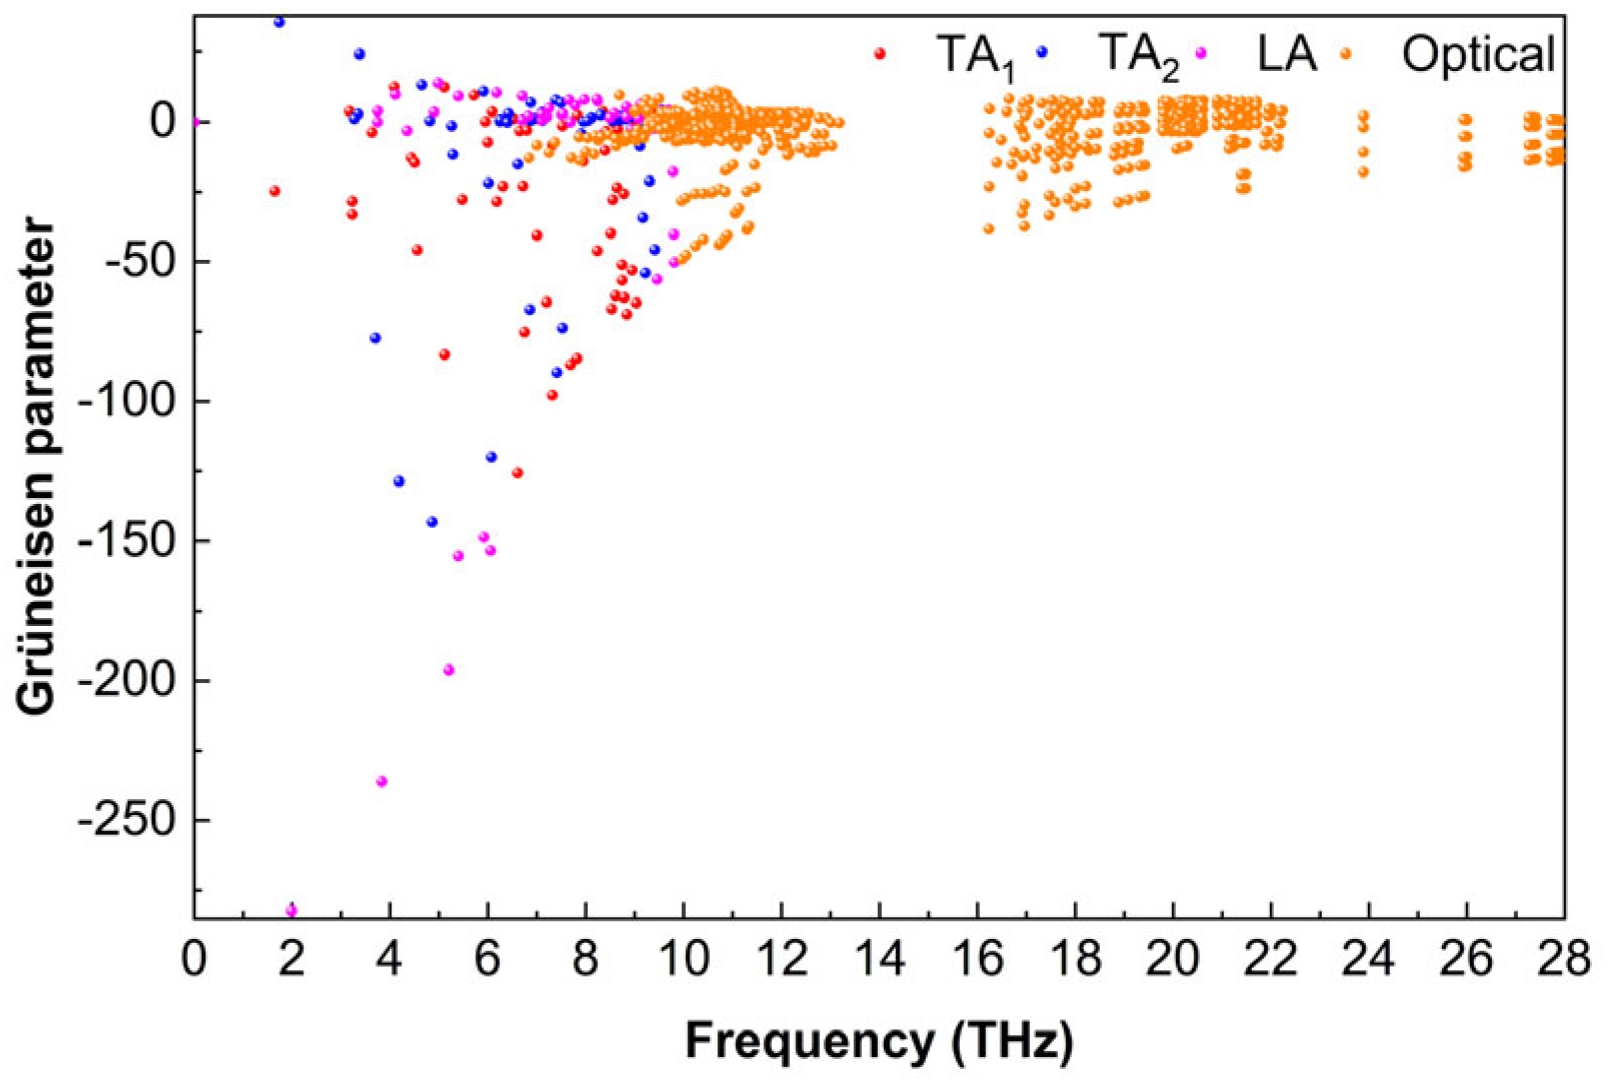
3.5.3. Grüneisen Parameter
Figure 11 shows the Grüneisen parameter (
γ) values of the Ti
2AlB
2 material across different phonon modes. The acoustic branch of Ti
2AlB
2 exhibits a large absolute value of
γ, while the optical branch shows a smaller absolute value. At approximately 2 THz, the absolute value of
γ reaches its maximum of 282.3, which is associated with the LA mode. The absolute values of
γ for TA
1 and TA
2 modes are slightly lower, with maximum values of 143.2 and 125.7, respectively. The absolute value of
γ in the optical mode within the range of 6.63 to 27.9 THz does not exceed 49.2. Overall, the absolute value of
γ for Ti
2AlB
2 is relatively high, suggesting significant phonon-phonon scattering due to the strong anharmonic vibrations of atoms within the lattice, which results in considerable anharmonicity. This elevated anharmonicity contributes to increased phonon scattering, which may facilitate a reduction in lattice thermal conductivity.
However, it is important to note that the lattice thermal conductivity of the material is influenced not only by the Grüneisen parameter (γ) but also by factors, such as phonon group velocity and phonon relaxation time. These factors must be taken into account when analyzing the lattice thermal conductivity of the material. A comprehensive study of the lattice thermal conductivity of Ti2AlB2 materials should integrate the Grüneisen parameter (γ), phonon group velocity, phonon relaxation time, and other relevant factors.
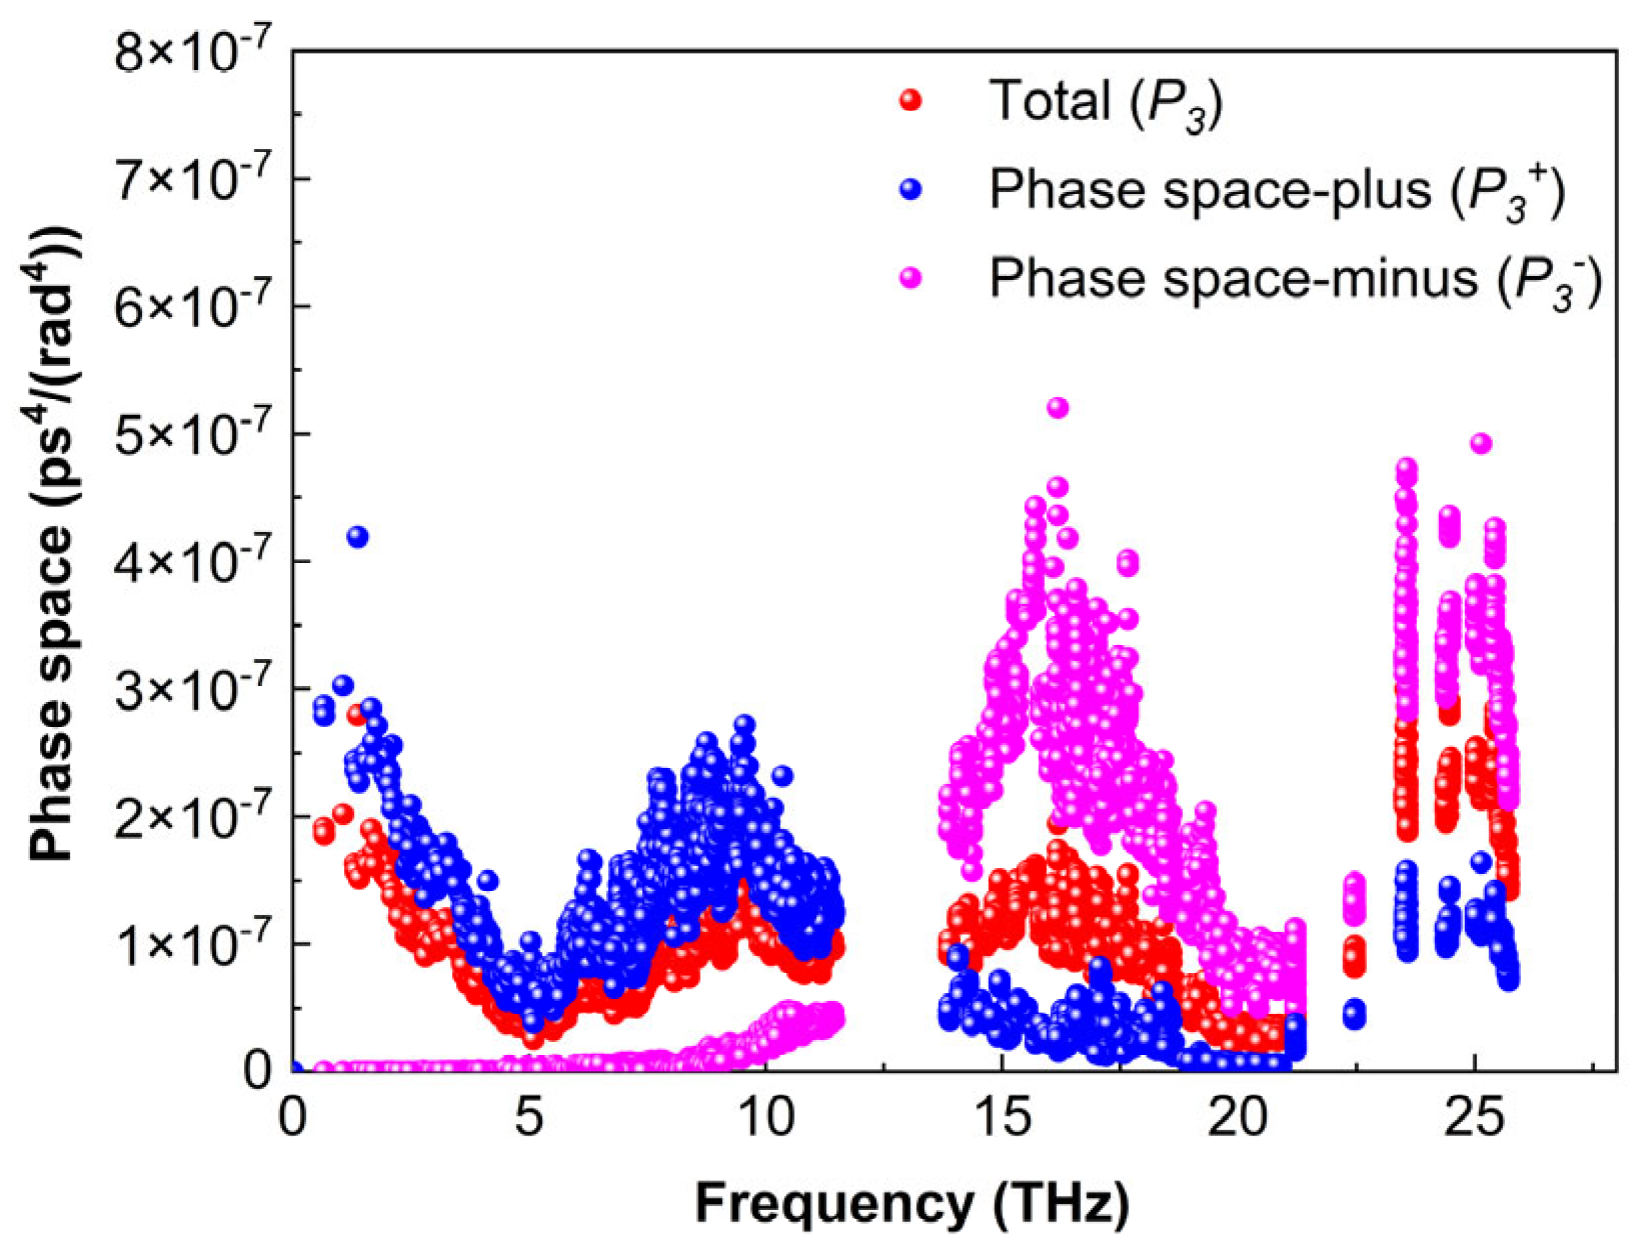
3.5.4. Phase Space
At the same time, the three-phonon scattering volume phase space quantitatively describes the number of available scattering channels determined by the phonon dispersion of the material (Formulas (12) and (13)). The three-phonon scattering phase space (
) can illustrate this change. A larger
value indicates a greater space available for three-phonon scattering, resulting in a longer required relaxation time (
τ).
Figure 12 illustrates the relationship between
and the phonon frequency of Ti2AlB2. In the frequency range of 0.67 to 11.4 THz, the scattering phase space
for the absorption process of Ti2AlB2 is larger than that for the emission process
. Conversely, in the range of 13.9 to 25.7 THz, the scattering phase space for the emission process exceeds that of the absorption process. A gap in the phonon volume phase space is observed between 11.4 and 13.9 THz.
Ti2AlB2 possesses a substantial volume phase space, limited effective scattering channels, smooth phonon transmission, and weak coupling between various frequencies and phonon modes. These characteristics facilitate the directional transmission of phonons, minimize scattering and energy loss, and may contribute to a high lattice thermal conductivity.
3.5.5. Cumulative Lattice Thermal Conductivity
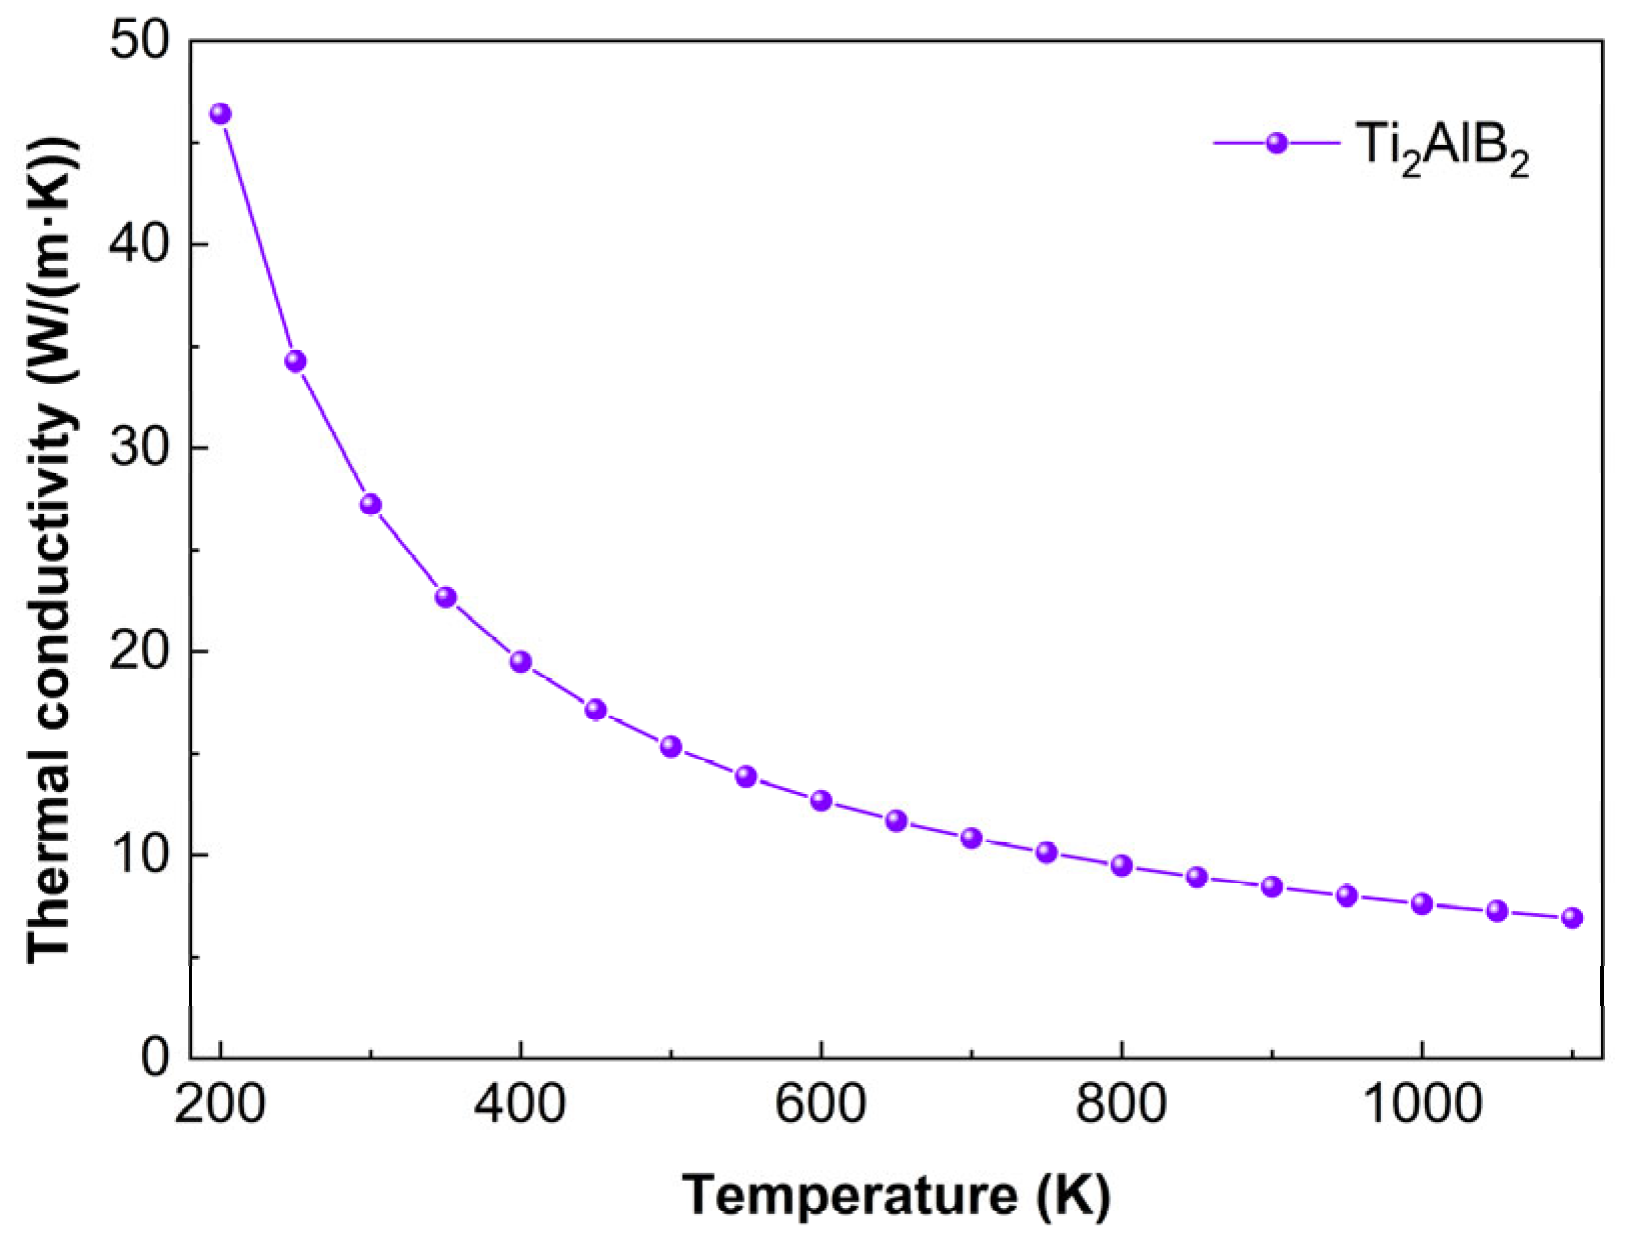
Figure 13 illustrates the variation in Ti
2AlB
2 thermal conductivity with temperature. At 200 K, the thermal conductivity of Ti
2AlB
2 is 46.4 W/(m·K), while at 1100 K, it decreases to 6.9 W/(m·K). The thermal conductivity data indicate that as the temperature increases, the thermal conductivity gradually decreases and levels off. This trend suggests that rising temperatures lead to intensified lattice vibrations, an increased likelihood of phonon-phonon scattering, more frequent phonon collisions, and enhanced anharmonic effects, resulting in a gradual flattening of the thermal conductivity curve.
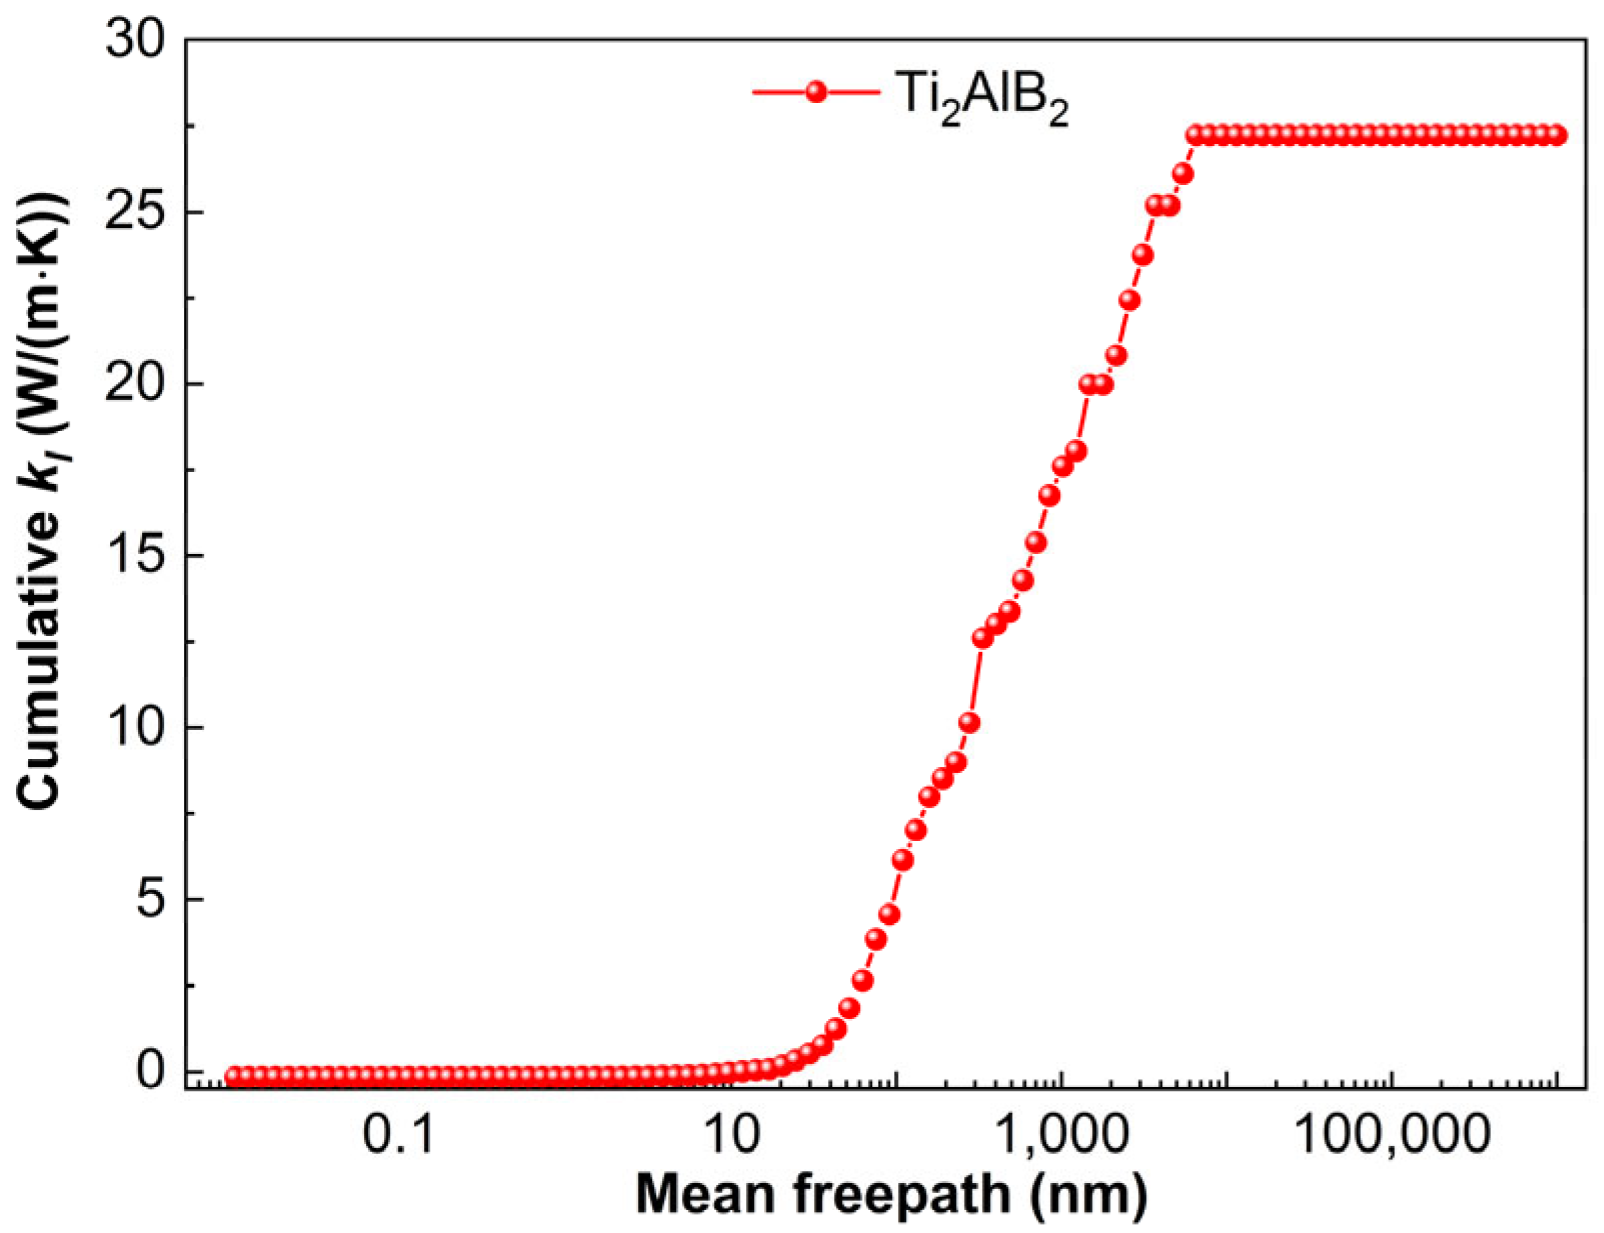
Figure 14 illustrates the variation in the lattice thermal conductivity of Ti
2AlB
2 as a function of the mean free path (MFP) at 300 K. The size of the material is a significant factor influencing its lattice thermal conductivity. Notably, the lattice thermal conductivity of Ti
2AlB
2 remains constant when the MFP exceeds 6579.3 nm. This indicates that the contribution to thermal conductivity arises from phonons with MFP shorter than the critical size. When the material’s size exceeds the critical threshold of 6579.3 nm, the lattice thermal conductivity of Ti
2AlB
2 shows minimal variation. Since then, there has been minimal phonon scattering, resulting in stable lattice thermal conductivity. Ultimately, the thermal conductivity of Ti
2AlB
2 is measured at 27.2 W/(m·K).
Combined with the phonon dispersion relation spectrum of Ti
2AlB
2 shown in
Figure 3, it is observed that the vibration frequenciNo need to explain.es corresponding to Ti atoms and a small number of Al atoms are distributed within the lowest frequency range, which is associated with the acoustic branch. Most of the low-frequency regions are dominated by Ti, with some corresponding to the vibrational modes of Al atoms. These modes of Ti and Al are associated with the interlaminar shear and bending vibrations of the material. The low-frequency phonon modes significantly contribute to thermal conductivity, and the vibrational modes of Ti and Al atoms play a crucial role in heat conduction. The medium-high frequency region is primarily dominated by B atoms, which corresponds to the vibrational modes of Ti and B atoms, particularly the chemical bond vibrations between Ti and B atoms. The high-frequency phonon mode, specifically the vibration of B atoms, contributes minimally to thermal conductivity due to significant scattering. Additionally, high-frequency optical phonons associated with strong covalent bonds, such as B-B vibrations, may result in a shorter mean free path for phonons, further reducing their contribution to thermal conductivity.
In the frequency range of 0 THz to 10.0 THz, lattice vibrations are primarily attributed to Tiatoms. However, in the range of 7.8 THz to 12.9 THz, interactions between Ti and Al atoms become significant, making them the dominant contributors to lattice vibrations in this region. This suggests that Ti and Al atoms interact or interfere with one another in the 7.8 THz to 12.9 THz range, leading to increased scattering. This interaction also causes the coupling of low-energy optical phonons with acoustic phonons, which further enhances phonon-phonon scattering and results in a reduction in lattice thermal conductivity. A set of flat optical branches was identified in the high-frequency phonon dispersion range of 16.3 THz to 28 THz, accompanied by a distinct spike in the PhDOS. These high-frequency optical branches consist primarily of B atoms, with a minimal presence of Tiatoms. An optical-acoustic energy gap of approximately 3.3 THz exists between the low-frequency and high-frequency optical branches, primarily due to the significant difference in atomic weights between the Ti and B elements in the Ti2AlB2 material.
In general, the lattice thermal conductivity of Ti2AlB2 is 27.2 W/m∙K, which is considered below average for materials. For Ti2AlB2, factors, such as the Grüneisen parameter, phonon relaxation time, and phonon group velocity, do not exhibit a single dominant influence. However, it is noteworthy that the interaction or interference between Ti and Al atoms in the 7.8 THz to 12.9 THz frequency range may contribute to an increase in scattering channels or anharmonicity, both of which are significant factors in the low thermal conductivity of Ti2AlB2. Additionally, the extended phonon relaxation time also plays a crucial role in this reduced thermal conductivity. These studies provide valuable insights for adjusting the lattice thermal conductivity of related materials, such as Ti2AlB2.


