Article

Composition-Dependent Optical Behavior of SnS1−xSex Nanosheet Arrays Films

1
School of Physics and Optoelectronic Engineering, Guangdong University of Technology, Guangzhou 510006, China
2
Guangdong Provincial Key Laboratory of Sensing Physics and System Integration Applications, Guangdong University of Technology, Guangzhou 510006, China
*
Author to whom correspondence should be addressed.
Colloids Interfaces 2025, 9(3), 37; https://doi.org/10.3390/colloids9030037
Submission received: 6 May 2025 / Revised: 7 June 2025 / Accepted: 11 June 2025 / Published: 12 June 2025

Abstract

SnS1−xSex (x = 0–1) films composed of vertically oriented nanosheet arrays were fabricated by vacuum thermal evaporation. The compositions of the SnS1−xSex films were well tuned from SnS to SnSe, while their structures and morphology maintained the orthorhombic phase and the uniform nanosheet arrays. Se doping enhances the light absorption of the films, especially in the near-infrared region. The direct and indirect band gaps of the SnS1−xSex (x = 0–1) nanosheet arrays films gradually changed from 1.26 eV and 1.12 eV for SnS to 1.00 eV and 0.79 eV for SnSe, respectively, with the change in compositions. The adjustable band gap makes these films promising candidates for infrared photodetectors and solar energy devices.

Graphical Abstract

1. Introduction

Tin, an environmentally friendly and low-cost element on the earth [1,2], can be chemically combined with the sulfur group elements S and Se to form the simple binary compounds SnXm (X = S, Se; m = 1, 2) with a layered structure. The compounds have a wide range of applications in energy conversion and storage as well as in optoelectronics [3]. Among them, SnS and SnSe are usually p-type narrow bandgap semiconductors due to the presence of intrinsic Sn vacancies [4], and have good potential for applications in near-infrared (NIR) photodetection, photovoltaic batteries, ion storage batteries, and gas sensitive sensor devices [5,6,7]. In addition, high-performance thermoelectric conversion has been demonstrated in SnSe and SnS single crystals and their polycrystalline materials due to ultra-low lattice thermal conductivity and unique band structures in the last decade, making them promising thermoelectric materials [8,9,10].
Although SnS has a layered crystal structure, it is still challenging to obtain large-area two-dimensional (2D) SnS nanostructures with uniform morphology and to explore their device preparation and applications [11]. Currently, 2D SnS has been synthesized by some methods, including mechanical exfoliation [12], liquid phase exfoliation [13], chemical vapor deposition (CVD) [14], physical vapor deposition (PVD) [15], solvent thermal methods [16], and so on. Few-layer SnS nanosheets and atomic-layer SnS were synthesized via mechanical exfoliation [17] and liquid-phase exfoliation [18], respectively, but the samples had small lateral dimensions. Large-area 2D SnS was fabricated by chemical vapor deposition, but the product remains thick [19]. It is still desired to achieve ultrathin SnS with macroscopic lateral dimensions [20].
Theoretical and experimental research has confirmed some unique physicochemical properties and extended the functionalities of 2D SnS and SnSe nanostructures [21]. Khan et al. reported that monomolecular layers of SnS possessed an ultrahigh-voltage electrical coefficient of ~26.1 ± 0.3 p m · V 1 , and a large average voltage peak of 150 m V was obtained at 0.7 % strain output [22]. Tian et al. employed SnS nanoribbons as piezoelectric catalysts for the conversion of CO2 to acetate under the action of periodic ultrasound and achieved 100% selectivity as well as yields up to 2.21 m M · h 1 [23]. Vertically aligned arrays of SnS nanosheets as anode for lithium-ion batteries showed excellent performance [24]. And our laboratory has achieved high-performance gas detection and ion energy storage in SnSe nanosheet arrays film [6,7].
Modulation of the compositions of 2D nanostructures is an important route to tune their properties. SnSxSe1−x nanocrystals synthesized by solution thermal injection exhibited a linearly tuned bandgap [25]. The excellent optoelectronic properties were observed in ultrathin SnS1−xSex nanosheets [26]. Wang et al. synthesized SnSxSe1−x/Ag nanosheets by one-pot method to optimise their photoelectrochemical (PEC) hydrolysis properties [27]. Although some progress has been made in the research of ternary SnS1−xSex nanomaterials, there are still no reports on their 2D nanostructure arrays that have the potential for optoelectrical applications.
In this work, we report the synthesis of ternary SnS1−xSex (x = 0–1) nanosheet arrays films with continuously tunable components by a facile vacuum thermal evaporation method. The detailed characterizations on the phase, compositions, morphology, elemental valence states, lattice vibrational modes, and optical properties of the films were performed. The findings indicate that the band gaps of the ternary SnS1−xSex nanosheet arrays films were well tuned, and the improved light absorption was observed in SnS0.5Se0.5 nanosheet arrays film.

2. Experimental Methods

2.1. Sample Preparation

SnS1−xSex nanosheet arrays films were synthesized by the vacuum thermal evaporation method, and the evaporation source materials were commercially purchased SnS (Alfa Aesar, Shanghai, China, 99.95%) and SnSe (Alfa Aesar, Shanghai, China, 99.99%) powders. The experimental methods were similar to those reported in the literatures [6,7]. In a typical run, SnS and SnSe powders were first mixed according to the stoichiometric ratio SnS1−xSex (x = 0, 0.2, 0.5, 0.8, 1), and then poured into a crucible placed at the evaporation source. The silicon substrates were pre-cleaned with acetone and anhydrous ethanol were fixed on the sample disc. The distance between the substrate and the evaporation source was adjusted to about 2.5 c m . When the vacuum of the chamber was pumped below 1.0 × 10⁻³ Pa, the crucible was heated to 450 °C at 10 °C / m i n . The samples were deposited by evaporation for 10 min and then naturally cooled.

2.2. Structural Characterization and Performance Testing

The structure, surface, and cross-sectional morphological features of the films were examined by X-ray diffraction equipped with Cu K α ( λ = 1.5406 Å ) radiation (XRD, Ultima IV, Rigaku, Tokyo, Japan) and scanning electron microscopy (SEM, SU8010, Hitachi, Tokyo, Japan), respectively. The elemental content and distribution of the samples were obtained by energy-dispersive X-ray spectroscopy (EDS) analysis. The microstructure of the synthesized products was studied by transmission electron microscopy (TEM, Talos F200S, FEI, Hillsborough, OR, USA). The lattice vibrational modes of the films were tested using a micro confocal Raman spectrometer (Raman, Lab RAMHR HR Evolution, HORIBA Jobin Yvon, Paris, France) with an excitation wavelength of 532 n m (1 m W ), and the acquisition time was 60 s. The elemental valence states of the films were analyzed by X-ray photoelectron spectroscopy (XPS, Escalab 250Xi, Thermo Fisher, Waltham, MA, USA). The optical properties of the films were investigated by diffuse reflectance spectroscopy using a UV-Vis-NIR spectrophotometer (UV-3600 Plus, SHIMADZU, Kyoto, Japan) with barium sulphate white powder as a standard reference.

3. Results and Discussion

Figure 1a shows the XRD patterns of SnS1−xSex film samples with different Se contents x increasing from 0 to 1. The diffraction peak positions change gradually from orthorhombic SnS (ICDD PDF Card No.39-0354) to orthorhombic SnSe (ICDD PDF Card No.48-1224) without the appearance of a second phase, which indicates that the obtained samples are pure phases [25,28]. SnS and SnSe have the same crystal structure and can form solid solutions in the whole compositional range [29]. The XRD peaks of the SnS1−xSex film samples gradually shift to lower angles as the Se contents increase, indicating that Se doping results in the expansion of the samples’ lattice volumes. Figure 1b reveals that the cell parameters a , b , and c of the samples calculated from XRD diffraction data increase with Se contents. It should be noted that there is an anomaly trend for the lattice parameters of the SnS0.5Se0.5 sample, and the similar phenomenon is observed in its Raman pattern, shown below. In solid solutions, short-range ordering (SRO) of chalcogen atoms may occur due to differences in bonding energies and atomic radius between S and Se [30]. This ordering can induce local strain fields and symmetry breaking, thereby altering both the lattice parameters and the electronic band structure, which probably leads to the observed anomalies for the SnS0.5Se0.5 sample. As shown in Figure 1c, the Se atoms can substitute for the S atoms of SnS because of the isoelectronic nature of Se with S, and the expansion of the lattice is due to the slightly larger atomic radius of S e 2 (1.84 Å ) than S 2 (1.70 Å ) [31]. In addition, the diffraction peak profiles of the ternary alloy SnS1−xSex (x = 0.2, 0.5, 0.8) films are more broadened and asymmetric than those of SnS and SnSe samples, implying the lattice distortion caused by the substitution of Se for S.
Figure 1d shows the Raman spectra of the SnS1−xSex (x = 0, 0.2, 0.5, 0.8, 1) films. As x gradually increases from 0 to 1, the intensity of the A g 2 (186.37 c m 1 ) peak of SnS gradually decreases and disappears completely [27]. Meanwhile, the intensity of the A g 2 (116.43 c m 1 ) and B 3 g (102.32 c m 1 ) peaks of SnSe are gradually enhanced [26]. In addition, the positions of the characteristic peaks of the samples all show a red shift with increasing x. This trend of the Raman peak intensities is consistent with the lattice expansion revealed by the XRD data, which further confirms that Se is successfully doped into the SnS lattice to form the SnS1−xSex solid solution [29]. It is notable that the Raman peak profiles of the ternary SnS1−xSex films exhibit obvious broadening and asymmetric features compared to those of pure SnS and SnSe, which is not only due to the overlapping of the Raman peaks of SnS and SnSe in the nanosheet arrays films [26], but also probably due to increased structural disorder and phonon scattering [32]. SnSe has an orthorhombic structure (space group P n m a )with 24 phonon modes (3 acoustic and 21 optical), and its phonon dispersion exhibits significant anharmonicity, which makes it sensitive to structural disorder [32]. Moreover, the variations in lattice vibrations observed in the Raman spectra may correlate with the evolution of the band gap in SnS1−xSex films, as strong exciton–phonon interactions can influence the electronic structure, similar to effects reported in ZnTe thin films [33].
Figure 2 shows the SEM morphology and elemental distribution of the SnS1−xSex (x = 0, 0.2, 0.5, 0.8, 1) films. SEM images in Figure 2a–e show that all the films are composed of large-area nanosheets arranged vertically on the silicon substrate and distributed uniformly to form arrays. Nanosheets with different compositions exhibit different lateral sizes: The lateral sizes for SnS nanosheets, SnS0.8Se0.2 nanosheets, SnS0.5Se0.5 nanosheets, SnS0.2Se0.8 nanosheets, and SnSe nanosheets are in the ranges of 0.5~0.9 μm, 1.2~1.8 μm, 1.5~2.8 μm, 1.2~2.2 μm and 1~1.2 μm, respectively. The lateral sizes of SnS1−xSex nanosheets show a trend of increasing and then decreasing with Se doping. With a gradual increase in Se content, the high vapor pressure of Se leads to partial supersaturation during thermal evaporation, increasing the density of the nuclei and limiting the size of the crystals for lateral growth [34,35]. Figure 2f shows the cross-section SEM image of SnS0.5Se0.5 nanosheet arrays, disclosing the structural features of these nanosheet arrays films in the vertical direction. It can be seen that the nanosheets are arranged perpendicular to the substrate in high density to form a film, with a distinct sheet structure at the top of the film and a dense disordered grain layer at the bottom of the film. The thicknesses and lateral sizes of the nanosheets are approximately 5–14 n m and 0.5–1.5 μm, respectively, and the thickness of the nanosheet arrays film was approximately 4 μm. EDS elemental distributions of the SnS0.5Se0.5 nanosheet arrays film in Figure 2g–i show that the elements of Sn, S, and Se are uniformly distributed in the film, and no obvious compositional segregation is observed. Quantitative EDS analyses were done on the compositions of all the nanosheet arrays films, and the results are shown in Table 1. The measured S and Se atom ratio in the sample is close to the named stoichiometric ratio, while the Sn atom proportion is near 50 % .
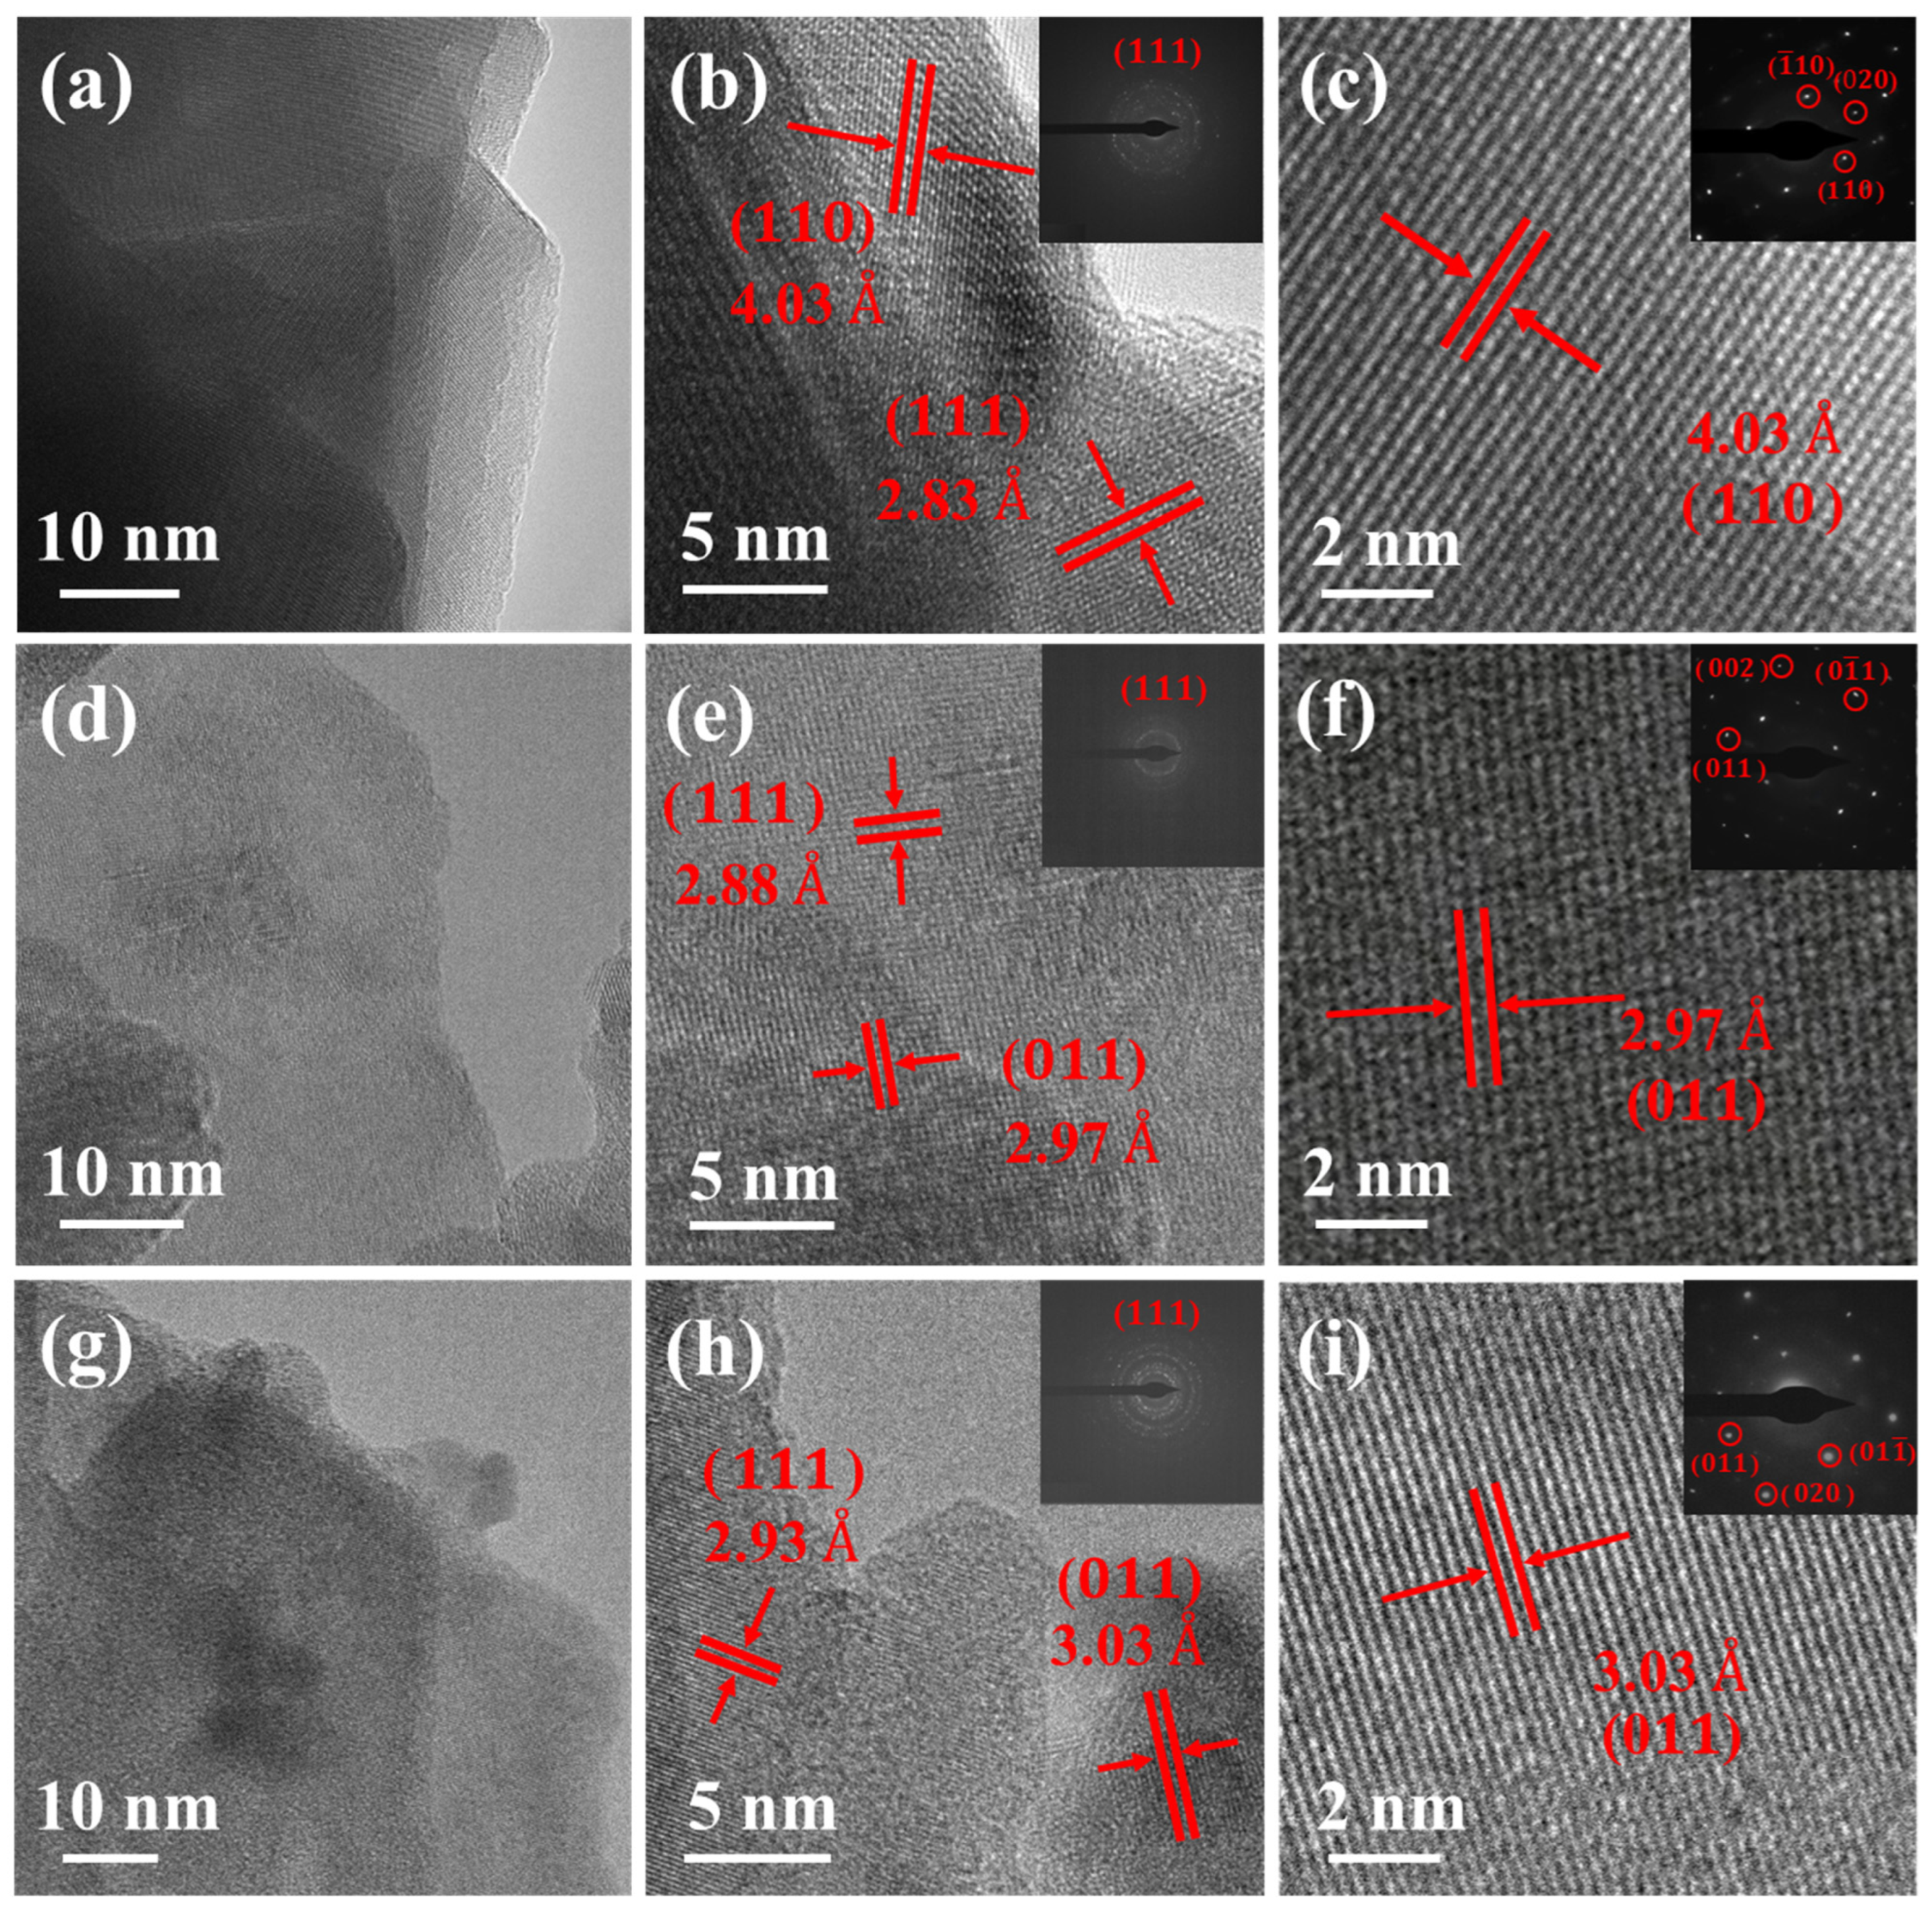
To obtain information about the microstructure of the nanosheet arrays films, the samples were examined by TEM. Figure 3a,d,g show typical low magnification TEM images of SnS, SnS0.5Se0.5, and SnSe nanosheets, respectively, indicating their 2D structural features. The high-resolution TEM (HRTEM) image and the FFT selected area electron diffraction (SAED) pattern insets in Figure 3b,e,h show that the SnS, SnS0.5Se0.5, and SnSe nanosheet arrays films are polycrystalline. In Figure 3b, lattice fringes with interlayer spacings of 4.03 and 2.83 correspond to SnS planes ( 110 ) and ( 111 ), respectively. In Figure 3e, lattice fringes with interlayer spacings of 2.88 and 2.97 are assigned to SnS0.5Se0.5 planes ( 111 ) and ( 011 ), respectively. In Figure 3h, lattice fringes with interlayer spacings of 2.93 and 3.03 are indexed to SnSe planes ( 111 ) and ( 011 ), respectively. The ( 111 ) planar layer spacing of the clear lattice stripes of the nanosheet arrays films increases from 2.83 to 2.93 with the doping of Se atoms, which is consistent with the shifts observed in the Raman peaks and the XRD patterns. This observation is also consistent with the structural evolution shown in Figure 1c, in which the replacement of smaller S atoms with larger Se atoms results in an expanded orthorhombic unit cell of the doped samples. Figure 3c,f,i show HRTEM images of edge regions with single-crystal structures. The corresponding FFT SAED patterns in the insets reveal orthogonal symmetric spot patterns of SnS, SnS0.5Se0.5, and SnSe, respectively, indicating that each of the selected regions is a single crystal. It can be concluded that the individual nanosheets are composed of some small single-crystalline plates.
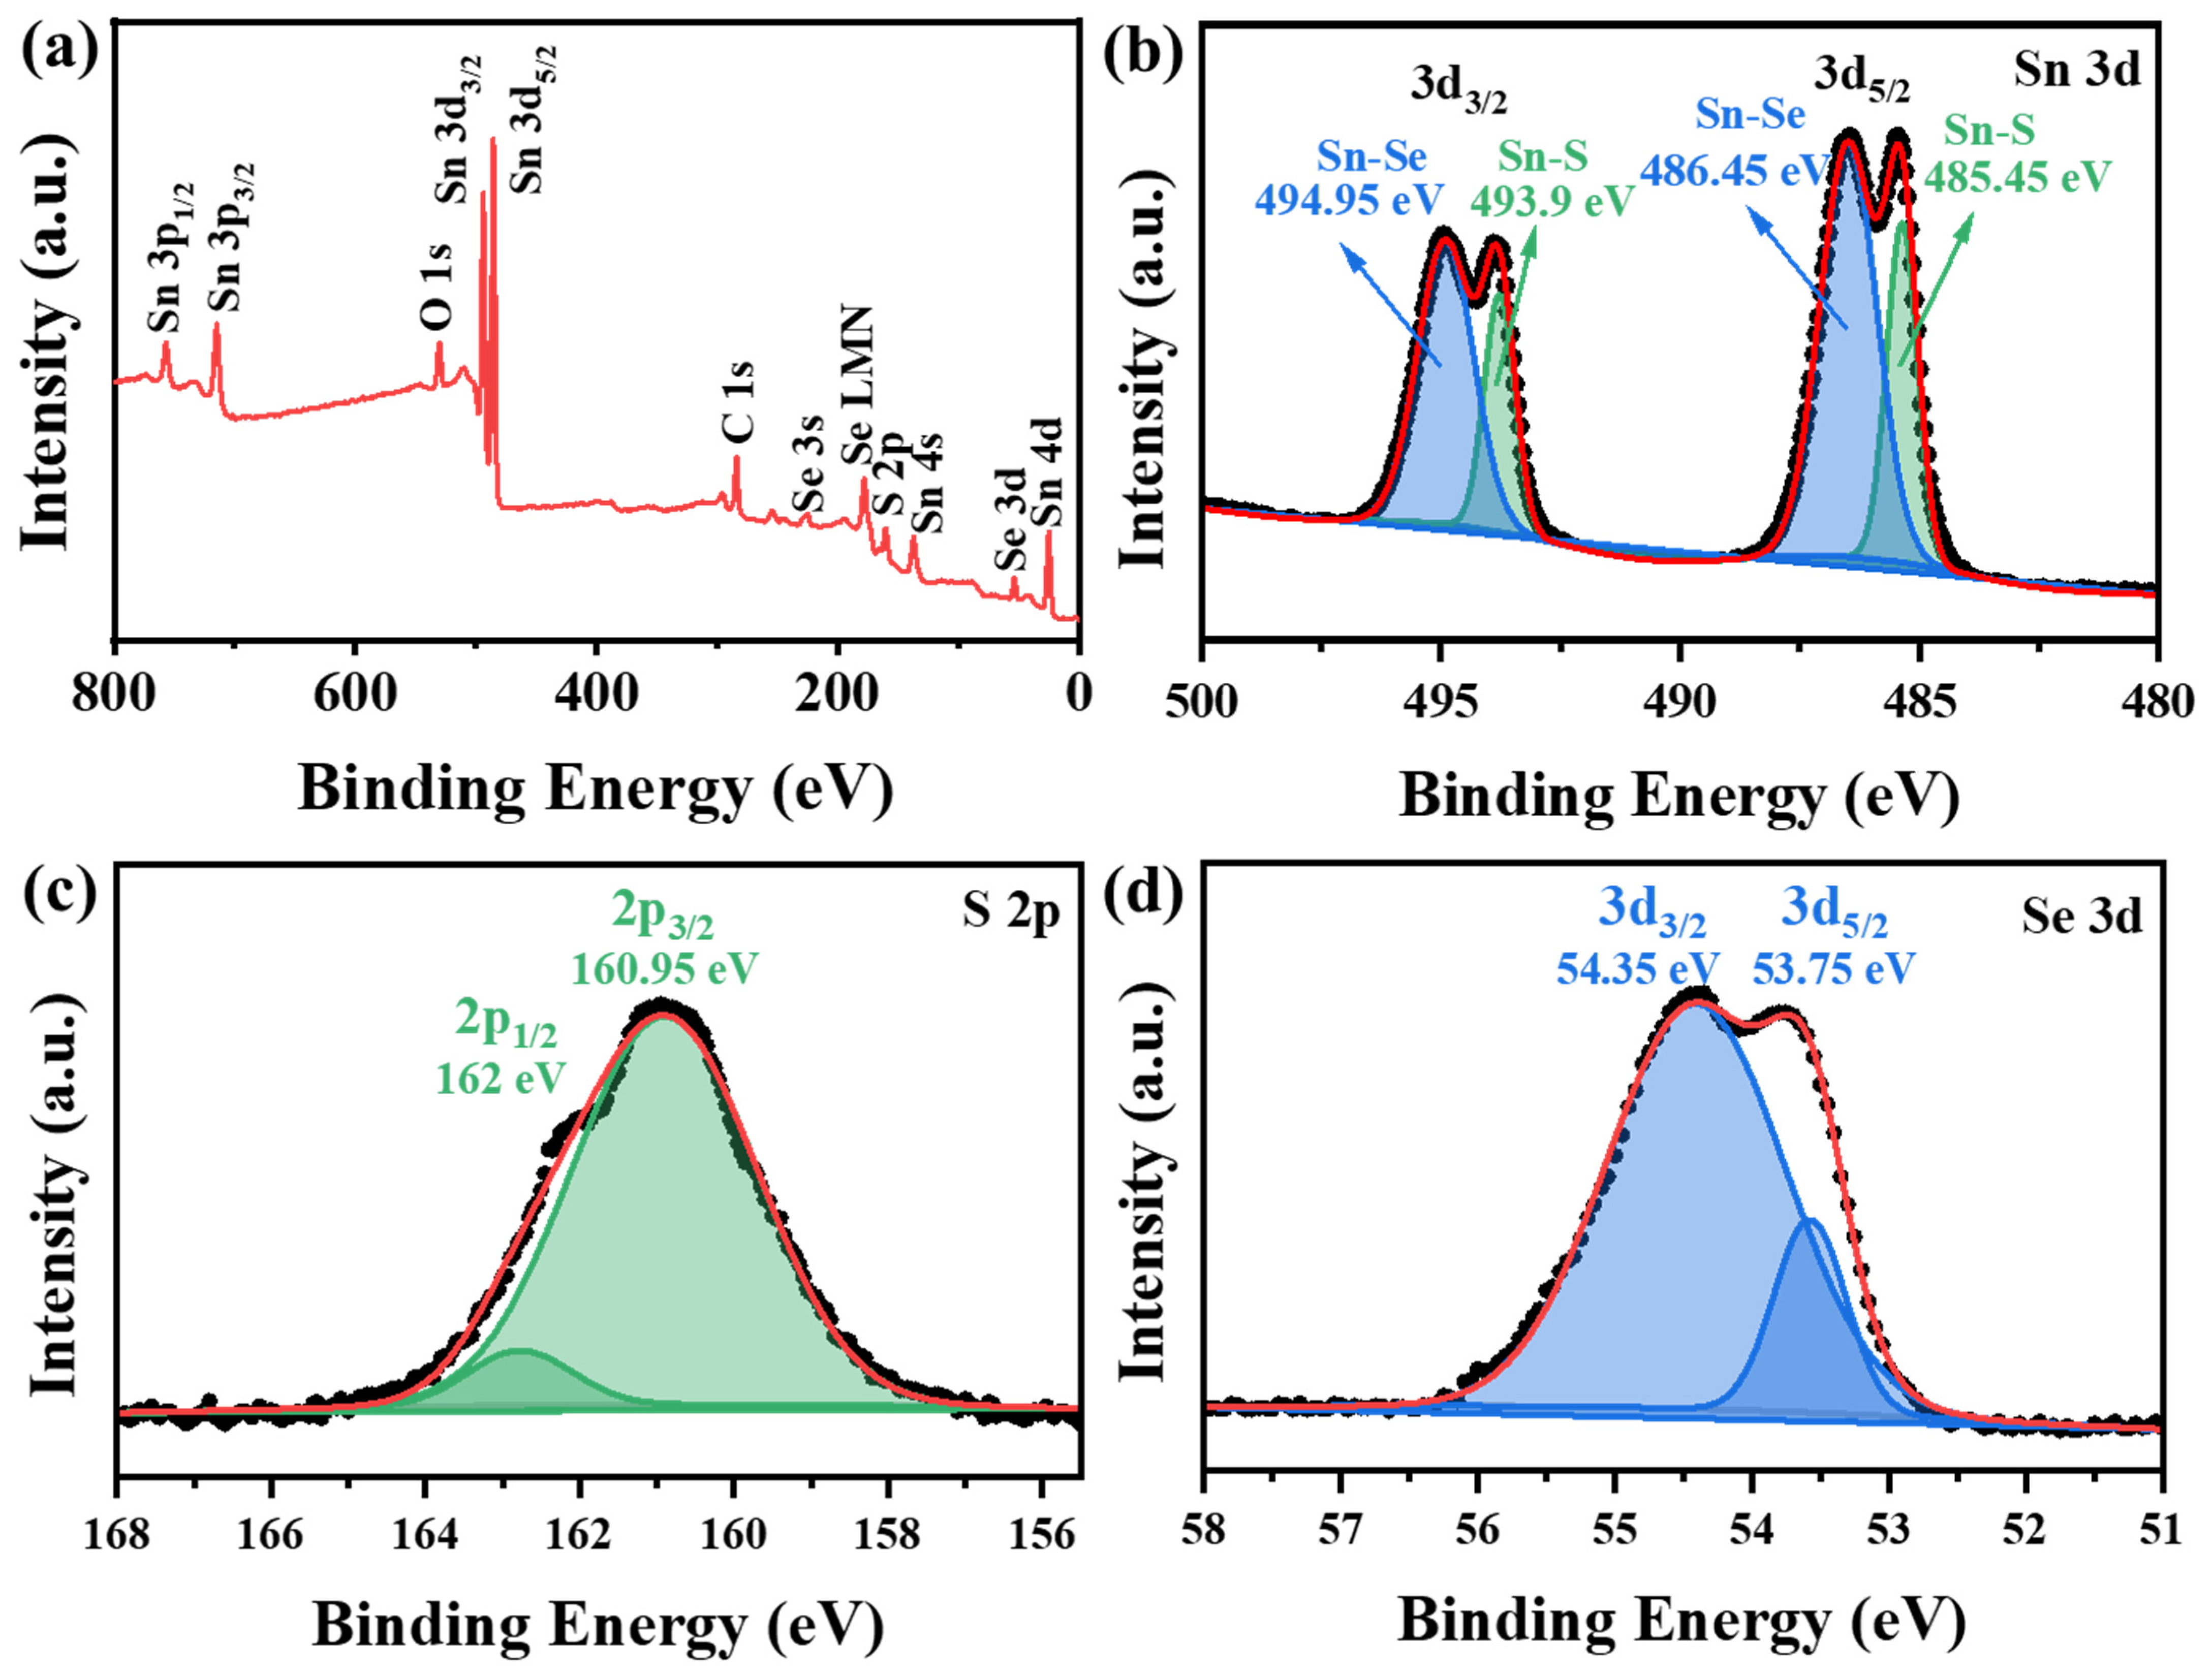
The chemical states of Sn, S and Se elements in the films were analyzed using XPS and the results are shown in Figure 4. Figure 4a shows the full XPS spectrum of the SnS0.5Se0.5 nanosheet arrays film, which was calibrated using the C1s binding energy of 284.8 eV (C-C bond) as the reference standard. It can be seen that the sample is mainly composed of Sn, S and Se. Figure 4b–d show the narrow spectra of Sn 3d, S 2p, and Se 3d, respectively. Two pairs of peaks of Sn 3d at 494.95 and 486.45 eV can be attributed to Sn 3 d 3 / 2 and Sn 3 d 5 / 2 of Sn-Se bond, and the peaks at 493.9 and 485.45 eV are attributed to Sn 3 d 3 / 2 and Sn 3 d 5 / 2 of Sn-S bond, respectively [29,36]. According to the split peak fitting results for S 2p, the binding energies of 162 eV and 160.95 eV correspond to the S 2 p 1 / 2 and S 2 p 3 / 2 peaks of S, respectively [27]. The Se 3d fit shows that Se 3 d 3 / 2 and Se 3 d 5 / 2 peaks of Se correspond to 54.35 and 53.75 eV binding energies, respectively [37]. The fitting results show that in the SnS0.5Se0.5 nanosheet arrays film, Sn, S, and Se exist in the form of S n 2 + , S 2 , and S e 2 , respectively, which further proves that Se substitutes for S in the lattice and confirms the formation of SnS1−xSex alloys.
The optical properties of SnS1−xSex nanosheet arrays films were investigated using UV-visible NIR diffuse reflectance spectroscopy. Figure 5a shows the diffuse reflectance spectral curves of the SnS1−xSex nanosheet arrays films in the wavelength range of 300–1800 n m . The absorption spectra of the samples can be calculated according to the Kubelka–Munk formula [38]:
1 R 2 2 R = α s
where R , α , and s represent the reflectance value, the absorption coefficient and the scattering coefficient, respectively. The low reflectivity of the nanosheet arrays films observed from Figure 5a indicates a strong light trapping effect, which is due to the multiple reflections of incident light by the rough structure of the SnS1−xSex nanosheet arrays. As shown in Figure 5b, with the increase of Se component in the samples, the absorption edge gradually shifts to the larger wavelength band, indicating that the optical energy gaps of the films gradually decrease. As the wavelength increases, the diffuse reflection exhibits a three-stage variation of ‘decrease-increase-decrease’, and in the visible range, the samples have a lower reflectance, corresponding to a higher absorptance. When the wavelength is close to the NIR wavelength, the reflectivity of the sample decreases and the absorptivity increases, which reveals the potential applications of SnS1−xSex nanosheet arrays films in the NIR devices. The photoelectric conversion performance of the films is closely related to their absorption ability. The ternary alloy nanosheet arrays films (especially the samples of SnS0.5Se0.5) have the highest light absorption performance throughout the tested spectral range, so it is reasonable to anticipate the improved photodetection and the related application performance of the ternary alloy SnS1−xSex nanosheet arrays films than that of SnS and SnSe. The optical band gaps ( E g ) of the samples can be calculated by Tauc’s formula [39]:
( α h v ) n = A h v E g
where E g , α and h v represent the band gap, absorption coefficient, and photon energy, respectively. A is a constant of 2 for the direct band gap and 1/2 for the indirect band gap.
Figure 5e shows a plot of the direct and indirect band gaps of the samples as a function of the Se content. The results are consistent with the data in the literatures for SnS and SnSe [40,41]. The band gap becomes progressively smaller with the increase of the Se component in the samples, achieving a successive excess from 1.26 eV and 1.12 eV for SnS to 1.00 eV and 0.79 eV for SnSe. This continuously adjustable bandgap characteristic is attractive for device design and can be well modulated for different applications (photovoltaics, photodetection, infrared absorption) [42].

4. Conclusions

SnS1−xSex (x = 0, 0.2, 0.5, 0.8, 1) nanosheet arrays films were synthesized by vacuum thermal evaporation, and their structures, morphologies, and optical properties were characterized. The results show that Se is doped into the SnS lattice, replacing S, and is uniformly distributed in the nanosheet arrays films. Se doping effectively improves the light absorption properties of SnS sample, and the SnS0.5Se0.5 nanosheet arrays film has the strongest light absorption properties and higher absorption of NIR light, demonstrating the potential for optoelectronic device applications in the NIR region. The direct and indirect band gaps of the SnS1−xSex (x = 0–1) nanosheet arrays films are continuously tunable from SnS to SnSe with component changes, demonstrating their great potential for broadband optoelectronic applications, particularly in near-infrared photodetectors and solar energy devices.

Author Contributions

Conceptualization, J.J. and X.L. (Xinyi Lin); methodology, J.J., X.L. (Xiaofang Lai) and Y.F.; validation, J.J. and X.L. (Xinyi Lin); formal analysis, Y.F. and X.L. (Xinyi Lin); investigation, Y.F. and X.L. (Xinyi Lin); resources, J.J.; writing—original draft preparation, Y.F. and X.L. (Xinyi Lin); writing—review and editing, Y.F. and J.J.; visualization, Y.F.; supervision, J.J. All authors have read and agreed to the published version of the manuscript.

Funding

This research received no external funding.

Data Availability Statement

The original contributions presented in this study are included in the article. Further inquiries can be directed to the corresponding author(s).

Acknowledgments

We would like to thank Shaoyun Yin (S.Y.) and Kai Yan (K.Y.) from the Analytical Testing Centre of the Guangdong University of Technology for their help with the experimental tests.

Conflicts of Interest

The authors declare no conflicts of interest.

References

  1. Jamal, F.; Rafique, A.; Moeen, S.; Haider, J.; Nabgan, W.; Haider, A.; Imran, M.; Nazir, G.; Alhassan, M.; Ikram, M.; et al. Review of Metal Sulfide Nanostructures and their Applications. ACS Appl. Nano Mater. 2023, 6, 7077–7106. [Google Scholar] [CrossRef]
  2. He, H.Y.; Lu, J.; Cao, L.Y.; Li, M. Photodegradation of methyl orange from wastewater on TiO2/SnS combined powders. Res. Chem. Intermed. 2012, 38, 537–547. [Google Scholar] [CrossRef]
  3. Sarkar, A.S.; Mushtaq, A.; Kushavah, D.; Pal, S.K. Liquid exfoliation of electronic grade ultrathin tin(II) sulfide (SnS) with intriguing optical response. npj 2D Mater. Appl. 2020, 4, 1. [Google Scholar] [CrossRef]
  4. Abrikosov, N.K.; Bankina, V.F.; Poretskaya, L.V.; Shelimova, L.E.; Skudnova, E.V. (Eds.) AIVBVI Compounds. In Semiconducting II–VI, IV–VI, and V–VI Compounds; Springer: New York, NY, USA, 1969; pp. 65–157. [Google Scholar]
  5. Kumar, G.M.; Fu, X.; Ilanchezhiyan, P.; Yuldashev, S.U.; Lee, D.J.; Cho, H.D.; Kang, T.W. Highly Sensitive Flexible Photodetectors Based on Self-Assembled Tin Monosulfide Nanoflakes with Graphene Electrodes. ACS Appl. Mater. Interfaces 2017, 9, 32142–32150. [Google Scholar] [CrossRef] [PubMed]
  6. Yang, W.L.; Zhao, C.J.; Du, B.S.; Wu, R.; Lai, X.F.; He, Y.; Jian, J.K. SnSe nanosheet arrays film for trace NO2 detection at room temperature. Sens. Actuators B Chem. 2022, 370, 132407. [Google Scholar] [CrossRef]
  7. Yang, W.L.; Chen, Y.C.; Yin, X.X.; Lai, X.F.; Wang, J.; Jian, J.K. SnSe Nanosheet Array on Carbon Cloth as a High-Capacity Anode for Sodium-Ion Batteries. ACS Appl. Mater. Interfaces 2023, 15, 42811–42822. [Google Scholar] [CrossRef]
  8. Liu, S.; Bai, S.; Wen, Y.; Lou, J.; Jiang, Y.; Zhu, Y.; Liu, D.; Li, Y.; Shi, H.; Liu, S.; et al. Quadruple-band synglisis enables high thermoelectric efficiency in earth-abundant tin sulfide crystals. Science 2025, 387, 202–208. [Google Scholar] [CrossRef]
  9. Chang, C.; Wu, M.H.; He, D.S.; Pei, Y.L.; Wu, C.F.; Wu, X.F.; Yu, H.L.; Zhu, F.Y.; Wang, K.D.; Chen, Y.; et al. 3D charge and 2D phonon transports leading to high out-of-plane ZT in n-type SnSe crystals. Science 2018, 360, 778–782. [Google Scholar] [CrossRef]
  10. Guo, J.; Jian, J.K.; Liu, J.; Cao, B.L.; Lei, R.B.; Zhang, Z.H.; Song, B.; Zhao, H.Z. Synthesis of SnSe nanobelts and the enhanced thermoelectric performance in its hot-pressed bulk composite. Nano Energy 2017, 38, 569–575. [Google Scholar] [CrossRef]
  11. Wang, W.H.; Zhang, T.; Seliverstov, A.; Zhang, H.H.; Wang, Y.C.; Wang, F.Z.; Peng, X.L.; Lu, Q.Q.; Qin, C.; Pan, X.H.; et al. Layer-Dependent Optoelectronic Properties of 2D van der Waals SnS Grown by Pulsed Laser Deposition. Adv. Electron. Mater. 2020, 6, 1901020. [Google Scholar] [CrossRef]
  12. Chen, C.; Chen, X.L.; Shao, Y.C.; Deng, B.C.; Guo, Q.S.; Ma, C.; Xia, F.N. Valley-Selective Linear Dichroism in Layered Tin Sulfide. ACS Photonics 2018, 5, 3814–3819. [Google Scholar] [CrossRef]
  13. Xie, Z.J.; Zhang, F.; Liang, Z.M.; Fan, T.J.; Li, Z.J.; Jiang, X.T.; Chen, H.; Li, J.Q.; Zhang, H. Revealing of the ultrafast third-order nonlinear optical response and enabled photonic application in two-dimensional tin sulfide. Photonics Res. 2019, 7, 494–502. [Google Scholar] [CrossRef]
  14. Zhang, H.D.; Balaji, Y.; Mehta, A.N.; Heyns, M.; Caymax, M.; Radu, I.; Vandervorst, W.; Delabie, A. Formation mechanism of 2D SnS2 and SnS by chemical vapor deposition using SnCl4 and H2S. J. Mater. Chem. C 2018, 6, 6172–6178. [Google Scholar] [CrossRef]
  15. Xia, J.; Li, X.Z.; Huang, X.; Mao, N.N.; Zhu, D.D.; Wang, L.; Xu, H.; Meng, X.M. Physical vapor deposition synthesis of two-dimensional orthorhombic SnS flakes with strong angle/temperature-dependent Raman responses. Nanoscale 2016, 8, 2063–2070. [Google Scholar] [CrossRef]
  16. Li, F.; Ramin Moayed, M.M.; Klein, E.; Lesyuk, R.; Klinke, C. In-Plane Anisotropic Faceting of Ultralarge and Thin Single-Crystalline Colloidal SnS Nanosheets. J. Phys. Chem. Lett. 2019, 10, 993–999. [Google Scholar] [CrossRef]
  17. Higashitarumizu, N.; Kawamoto, H.; Nakamura, M.; Shimamura, K.; Ohashi, N.; Ueno, K.; Nagashio, K. Self-passivated ultra-thin SnS layers via mechanical exfoliation and post-oxidation. Nanoscale 2018, 10, 22474–22483. [Google Scholar] [CrossRef] [PubMed]
  18. Huang, W.C.; Xie, Z.J.; Fan, T.J.; Li, J.G.; Wang, Y.Z.; Wu, L.M.; Ma, D.T.; Li, Z.J.; Ge, Y.Q.; Huang, Z.N.; et al. Black-phosphorus-analogue tin monosulfide: An emerging optoelectronic two-dimensional material for high-performance photodetection with improved stability under ambient/harsh conditions. J. Mater. Chem. C 2018, 6, 9582–9593. [Google Scholar] [CrossRef]
  19. Li, Q.; Wei, A.X.; Lu, J.T.; Tao, L.L.; Yang, Y.B.; Luo, D.X.; Liu, J.; Xiao, Y.; Zhao, Y.; Li, J.B. Synthesis of Submillimeter-Scale Single Crystal Stannous Sulfide Nanoplates for Visible and Near-Infrared Photodetectors with Ultrahigh Responsivity. Adv. Electron. Mater. 2018, 4, 1800154. [Google Scholar] [CrossRef]
  20. Xin, C.; Zheng, J.X.; Su, Y.T.; Li, S.K.; Zhang, B.K.; Feng, Y.C.; Pan, F. Few-Layer Tin Sulfide: A New Black-Phosphorus-Analogue 2D Material with a Sizeable Band Gap, Odd-Even Quantum Confinement Effect, and High Carrier Mobility. J. Phys. Chem. C 2016, 120, 22663–22669. [Google Scholar] [CrossRef]
  21. Gomes, L.C.; Carvalho, A. Phosphorene analogues: Isoelectronic two-dimensional group-IV monochalcogenides with orthorhombic structure. Phys. Rev. B 2015, 92, 085406. [Google Scholar] [CrossRef]
  22. Khan, H.; Mahmood, N.; Zavabeti, A.; Elbourne, A.; Rahman, M.A.; Zhang, B.Y.; Krishnamurthi, V.; Atkin, P.; Ghasemian, M.B.; Yang, J.; et al. Liquid metal-based synthesis of high performance monolayer SnS piezoelectric nanogenerators. Nat. Commun. 2020, 11, 3449. [Google Scholar] [CrossRef]
  23. Tian, W.R.; Li, N.J.; Chen, D.Y.; Xu, Q.F.; Li, H.; Yan, C.L.; Lu, J.M. Vibration-driven Reduction of CO2 to Acetate with 100% Selectivity by SnS Nanobelt Piezocatalysts. Angew. Chem. 2023, 62, e202306964. [Google Scholar] [CrossRef] [PubMed]
  24. Lee, J.; Choi, C.; Lee, H.; Ma, S.; Tan, J.; Jang, G.; Shim, S.G.; Park, Y.S.; Yun, J.; Kim, D.W.; et al. Elucidating the Synergistic Behavior of Orientation-Controlled SnS Nanoplates and Carbon Layers for High-Performance Lithium- and Sodium-Ion Batteries. Adv. Energy Mater. 2022, 12, 2103138. [Google Scholar] [CrossRef]
  25. Wei, H.; Su, Y.J.; Chen, S.Z.; Lin, Y.; Yang, Z.; Chen, X.S.; Zhang, Y.F. Novel SnSxSe1−x nanocrystals with tunable band gap: Experimental and first-principles calculations. J. Mater. Chem. 2011, 21, 12605–12608. [Google Scholar] [CrossRef]
  26. Gao, W.; Li, Y.T.; Guo, J.H.; Ni, M.X.; Liao, M.; Mo, H.J.; Li, J.B. Narrow-gap physical vapour deposition synthesis of ultrathin SnS1−xSex (0 ≤ x ≤ 1) two-dimensional alloys with unique polarized Raman spectra and high (opto)electronic properties. Nanoscale 2018, 10, 8787–8795. [Google Scholar] [CrossRef] [PubMed]
  27. Gong, H.P.; Cao, M.; Jiang, Y.C.; Sun, L.Y.; Shen, Y.; Wang, L.J. SnSxSe1−x/Ag Nanosheet Thin Films for Solar Energy Water Splitting. ACS Appl. Nano Mater. 2021, 4, 13246–13256. [Google Scholar] [CrossRef]
  28. Ju, H.; Kim, K.; Park, D.; Kim, J. Fabrication of porous SnSeS nanosheets with controlled porosity and their enhanced thermoelectric performance. Chem. Eng. J. 2018, 335, 560–566. [Google Scholar] [CrossRef]
  29. Wu, R.Z.; Mao, J.P.; Li, H.; Yang, Y.C.; Hao, W.X.; Wang, Y.; Hao, J.Y. Revealing the relationship of NO2 sensing with energy level in 2D van der Waals SnS1-xSex alloys. Chem. Eng. J. 2023, 469, 144018. [Google Scholar] [CrossRef]
  30. Ektarawong, A.; Alling, B. Stability of SnSe1-xSx solid solutions revealed by first-principles cluster expansion. J. Phys.-Condens. Matter 2018, 30, 29LT01. [Google Scholar] [CrossRef]
  31. Shannon, R.D. Revised effective ionic radii and systematic studies of interatomic distances in halides and chalcogenides. Acta Crystallogr. Sect. A 1976, 32, 751–767. [Google Scholar] [CrossRef]
  32. Gong, Y.R.; Dou, W.; Lu, B.C.; Zhang, X.M.; Zhu, H.; Ying, P.; Zhang, Q.T.; Liu, Y.Q.; Li, Y.A.; Huang, X.Q.; et al. Divacancy and resonance level enables high thermoelectric performance in n-type SnSe polycrystals. Nat. Commun. 2024, 15, 4231. [Google Scholar] [CrossRef] [PubMed]
  33. Iqbal, M.F.; Ul Ain, Q.; Yaqoob, M.M.; Zhu, P.; Wang, D.L. Temperature dependence of exciton-phonon coupling and phonon anharmonicity in ZnTe thin films. J. Raman Spectrosc. 2022, 53, 1265–1274. [Google Scholar] [CrossRef]
  34. Zha, G.Z.; Zhao, Y.; Luo, H.; Jiang, W.L.; Xu, B.Q.; Yang, B. Evaporation Regularities of Elemental Selenium in the Vacuum Distillation Process. Metall. Mater. Trans. B 2022, 53, 3856–3864. [Google Scholar] [CrossRef]
  35. Yuvaraj, D.; Kumar, R.R.; Selvan, V.T.; Sathyanarayanan, M.; Rao, K.N. Growth of ZnSe nano and microstructures at high vacuum by thermal evaporation. Appl. Nanosci. 2014, 4, 469–475. [Google Scholar] [CrossRef]
  36. Wang, T.S.; Legut, D.; Fan, Y.C.; Qin, J.; Li, X.F.; Zhang, Q.F. Building Fast Diffusion Channel by Constructing Metal Sulfide/Metal Selenide Heterostructures for High-Performance Sodium Ion Batteries Anode. Nano Lett. 2020, 20, 6199–6205. [Google Scholar] [CrossRef]
  37. Xiong, X.S.; Zhang, J.; Cheng, Y.S.; Chen, C.; Zeng, J.H.; Xi, J.H.; Kong, Z.; Yuan, Y.J.; Ji, Z.G. Excellent photocatalytic and photoelectrochemical activities from 1D/2D FeSe2/SnSe heterojunction photocatalysts constructed by FeSe2 nanorods and SnSe nanosheets. Int. J. Hydrogen Energy 2022, 47, 7189–7201. [Google Scholar] [CrossRef]
  38. Barton, D.G.; Shtein, M.; Wilson, R.D.; Soled, S.L.; Iglesia, E. Structure and electronic properties of solid acids based on tungsten oxide nanostructures. J. Phys. Chem. B 1999, 103, 630–640. [Google Scholar] [CrossRef]
  39. Hagfeldt, A.; Graetzel, M. Light-Induced Redox Reactions in Nanocrystalline Systems. Chem. Rev. 1995, 95, 49–68. [Google Scholar] [CrossRef]
  40. Li, L.; Chen, Z.; Hu, Y.; Wang, X.W.; Zhang, T.; Chen, W.; Wang, Q.B. Single-Layer Single-Crystalline SnSe Nanosheets. J. Am. Chem. Soc. 2013, 135, 1213–1216. [Google Scholar] [CrossRef]
  41. Sohila, S.; Rajalakshmi, M.; Ghosh, C.; Arora, A.K.; Muthamizhchelvan, C. Optical and Raman scattering studies on SnS nanoparticles. J. Alloys Compd. 2011, 509, 5843–5847. [Google Scholar] [CrossRef]
  42. Alanazi, H.T.A.; Alzaidy, G.A. Recent advancements and progress in development in chalcogenide (S, Se)-based thin films for high-performance photodetectors: A review. Phys. Scr. 2024, 99, 082001. [Google Scholar] [CrossRef]
Figure 1. (a) XRD patterns of SnS1−xSex (x = 0, 0.2, 0.5, 0.8, 1) films; The region marked by the black rectangle is enlarged in the right panel. (b) Variation of cell parameters with Se content (X). (c) Schematic illustration of the crystal structures of SnS (top), SnS1−xSex (middle), and SnSe (bottom). (d) Raman spectra of SnS1−xSex (x = 0, 0.2, 0.5, 0.8, 1) nanosheet arrays films.
Colloids 09 00037 g001
Figure 2. SEM images of surface morphology of SnS1−xSex (x = 0, 0.2, 0.5, 0.8, 1) nanosheet arrays films (a) SnS; (b) SnS0.8Se0.2; (c) SnS0.5Se0.5; (d) SnS0.2Se0.8; (e) SnSe. (f) The cross-section of SnS0.5Se0.5 nanosheet arrays film. (gi) The EDS elemental mappings of Sn, S, and Se for SnS0.5Se0.5 nanosheet arrays film.
Colloids 09 00037 g002
Figure 3. Low-magnification TEM images and high-resolution TEM images of SnS (ac), SnS0.5Se0.5 (df), and SnSe nanosheets (gi), respectively. The insets are the corresponding FFT patterns.
Colloids 09 00037 g003
Figure 4. (a) XPS full spectrum, (b) XPS spectra of Sn 3d, (c) S 2p, and (d) Se 3d for SnS0.5Se0.5 nanosheet arrays film.
Colloids 09 00037 g004
Figure 5. (a) Diffuse reflectance and (b) absorption spectra of SnS1−xSex (x = 0, 0.2, 0.5, 0.8, 1) nanosheet arrays films. (c,d) are Tauc plots for SnS1−xSex (x = 0, 0.2, 0.5, 0.8, 1) nanosheet arrays films (The dashed lines represent the extrapolated tangent used to determine the optical bandgap values). (e) Dependence of the direct band gaps and indirect band gaps of the samples on Se content X.
Colloids 09 00037 g005
Table 1. EDS quantitative analysis on atomic ratio of SnS1−xSex thin films.
SampleSn/%S/%Se/%
SnS49.3850.62
SnS0.8Se0.249.7539.5310.72
SnS0.5Se0.549.4624.9325.61
SnS0.2Se0.849.659.9740.38
SnSe49.3350.67
Disclaimer/Publisher’s Note: The statements, opinions and data contained in all publications are solely those of the individual author(s) and contributor(s) and not of MDPI and/or the editor(s). MDPI and/or the editor(s) disclaim responsibility for any injury to people or property resulting from any ideas, methods, instructions or products referred to in the content.