Article

Preparation of Colloidal Silver Triangular Nanoplates and Their Application in SERS Detection of Trace Levels of Antibiotic Enrofloxacin

1
Department of Science, Technology and Environment, Ministry of Education and Training, 35 Dai Co Viet, Hanoi 100000, Vietnam
2
Institute of Materials Science, Vietnam Academy of Science and Technology, 18 Hoang Quoc Viet, Hanoi 100000, Vietnam
3
Department of Materials Science and Energy, Graduate University of Science and Technology, Vietnam Academy of Science and Technology, 18 Hoang Quoc Viet, Hanoi 100000, Vietnam
*
Author to whom correspondence should be addressed.
Colloids Interfaces 2025, 9(3), 31; https://doi.org/10.3390/colloids9030031
Submission received: 2 April 2025 / Revised: 12 May 2025 / Accepted: 14 May 2025 / Published: 16 May 2025
(This article belongs to the Special Issue Food Colloids: 3rd Edition)

Abstract

:
Surface-enhanced Raman scattering (SERS) is a powerful technique for detecting trace amounts of chemicals due to its capacity to significantly amplify the Raman signal of the molecules of these substances. This is particularly relevant in food systems where monitoring antibiotic residues is critical for food safety. Traditional SERS substrates typically utilize colloidal silver nanospheres (AgNSs), but anisotropic silver nanoparticles with numerous sharp tips can further enhance SERS sensitivity, enabling lower detection limits suitable for food safety regulations. In this study, we describe a straightforward synthesis of colloidal silver triangular nanoplates (AgTNPls), featuring multiple sharp tips, using only four common reagents: silver nitrate, trisodium citrate, sodium borohydride (NaBH4) and hydrogen peroxide (H2O2), all at room temperature. By carefully controlling the sequence of reagent addition, specifically introducing H2O2 after NaBH4, we achieved a two-step synthesis. In the first step, AgNSs seeds form, and in the second, these seeds convert into AgTNPls, resulting in a colloid of relatively uniform AgTNPls with an edge length of approximately 52 nm. The resulting AgTNPls colloid, combined with an aluminum foil, produced an SERS substrate with high enhancement factor of 3.2 × 10⁹ (using rhodamine 6G as a test molecule). Applied to enrofloxacin (an antibiotic widely used in livestock and aquaculture) detection, this substrate achieved a detection limit as low as 0.39 µg/L (0.39 ppb), with enrofloxacin detectable at concentrations down to 5 µg/L. This highly sensitive SERS substrate holds great promise for rapid, accurate detection of antibiotic residues in food products, aiding regulatory compliance and food safety assurance.

1. Introduction

Surface-enhanced Raman scattering (SERS) is a powerful technique capable of amplifying Raman scattering signals from molecules that positioned near nanoscale rough metal surfaces, often achieving enhancement factors in the millions [1]. This remarkable amplification allows for the detection of trace concentrations of organic and biological molecules, making SERS highly effective for chemical and biochemical analyses.
The enhancement in SERS arises from the excitation of localized surface plasmons on nano-rough metal surfaces upon illumination. These plasmons generate intense electric fields that amplify the Raman scattering signals of molecules adsorbed on the surface. The extent of enhancement is influenced by the properties of the nano-rough surface, such as shape, size, and surface morphology. As a result, the preparation of optimal and stable nano-rough surfaces is crucial for achieving high SERS sensitivity.
Early SERS experiments employed electrochemically roughened silver surfaces [2], but advancements in nanotechnology have shifted the focus to designing substrates with metal nanoparticles distributed on solid supports [3]. The shape, size, spacing and arrangement of these metal nanoparticles significantly influence the enhancement factor (EF) of the Raman signal, as “hot spots”—regions of intense signal amplification—are typically found at the sharp edges, tips or in the narrow gaps between particles. To maximize enhancement, researchers have increasingly moved from isotropic spherical nanoparticles to anisotropic structures, such as triangular nanoplates, nanostars and flower-like particles, which feature sharp tips and edges.
Triangular nanoplates, or nanoprisms, are particularly attractive for SERS applications due to their well-defined sharp tips and edges that contribute to enhanced hot spots formation. Among the metals used for SERS, silver is favored over gold for its superior plasmonic activity [4,5,6,7]. Consequently, the synthesis and application of silver triangular nanoplates (AgTNPls) as SERS substrates have been extensively studied [8,9,10,11,12,13,14]. Two common methods for synthesizing AgTNPls are the photo-mediated and seed-mediated approaches. The photo-mediated approach involves light irradiation to transform spherical silver nanoparticles into triangular nanoplates [15], but it is often time-consuming and requires high temperatures. In contrast, the seed-mediated approach is more efficient and versatile [16], making it the method of choice for this study.
The seed-mediated synthesis of AgTNPls, first introduced by Mirkin’s group [17], has undergone various refinements by researchers to improve efficiency and control [9,10,11,18,19,20,21,22]. In the original process, sodium borohydride (NaBH4) was rapidly injected into a solution containing silver nitrate (AgNO3), trisodium citrate (TSC), polyvinylpyrrolidone (PVP) and hydrogen peroxide (H2O2) at room temperature. To simplify the process, we removed PVP from the reactants and reversed the order of NaBH4 and H2O2, based on their distinct functions: NaBH4 reduces AgNO3 to silver nanoparticles, while H2O2 facilitates their transformation into AgTNPls [23,24,25,26]. This modified approach, along with careful optimization of reactant concentrations, produced a colloid predominantly containing uniform AgTNPls, which was not achievable using the conventional method.
While colloidal AgTNPls can serve as SERS substrates, their instability due to nanoparticle movement limits their practical application. Solid substrates, prepared by immobilizing AgTNPls onto a solid support such as a glass slide or silicon wafer [10,11,12,13,27,28], offer greater stability and reproducibility. Recent studies have demonstrated that aluminum foil, due to its natural oxide layer (Al2O3), can enhance the local electromagnetic field via dielectric–metal interactions. The oxide layer acts as a dielectric spacer, preventing charge transfer quenching and supporting the formation of strong electromagnetic “hot spots” at the interface between AgTNPls and the Al substrate. Additionally, the rough surface morphology of commercial Al foil can facilitate nanoparticle immobilization and further intensify local plasmon coupling [29,30,31,32,33,34,35]. In this study, we found that AgTNPls immobilized on Al-foil exhibited enhancement factors hundreds of times greater than those on glass slides or silicon wafers.
Enrofloxacin (ENR), a fluoroquinolone antibiotic, is widely used in livestock and aquaculture due to its broad spectrum of antibacterial activity. However, its overuse has contributed to the rise in antibiotic-resistant bacteria and has raised concerns about harmful residues in food products [36]. Many countries have established maximum residue limits (MRLs) for ENR, typically ranging from 100 to 300 µg/kg, depending on the animal species and target tissue [37]. Accurate and sensitive detection of antibiotic residues is critical for ensuring food safety.
Conventional analytical methods for trace detection of antibiotics, including ENR, such as high-performance liquid chromatography (HPLC) [38,39] and liquid chromatography-mass spectrometry (LC/MS) [40,41], provide high sensitivity, accuracy and repeatability, but are time-consuming, require complex sample preparation and rely on expensive instrumentation. SERS offers a promising alternative, combining high sensitivity with simplicity, rapid analysis and minimal sample preparation. Additionally, as a molecular “fingerprint” technique, SERS enables the simultaneous detection of multiple analytes.
Several studies have reported using SERS for trace detection of ENR with various SERS-active substrates. Tang et al. synthesized SiO2 membranes embedded with silver nanoparticles, achieving an experimental limit of detection (LOD) of 10 nmol/L (3.58 ppb) for ENR [42]. Another study describes a monolayer silver thin film prepared from self-assembled silver nanoparticles at a water/oil interface for ENR detection, with a calculated detection limit of ENR in the fish matrix of 0.71 μg mL−1 (0.71 ppm) [43]. Chen et al. developed Ag/nanocellulose fibers for the in situ detection of ENR, estimating a LOD of 0.069 ppm [44]. Fu and co-authors fabricated a silver nanoparticles-modified microcavity fiber SERS probe to detect ENR in milk, achieving a LOD of 10 μg/mL (10 ppm) [45]. Neng et al. combined SERS and molecularly imprinted polymers (MIPs) to detect ENR, achieving a LOD of 0.25 ng/mL (0.25 ppb) [46]. Zhou et al. developed the petal-like plasmonic nanoparticle clusters-based colloidal SERS method for ENR detection and achieved a LOD of 1.15 μg/kg (1.15 ppb) [47].
In this study, we synthesized AgTNPls using a straightforward, room-temperature, seed-mediated method with minimal reagents. By immobilizing the AgTNPls onto Al-foil, we fabricated a highly sensitive SERS substrate capable of detecting ENR at concentrations as low as 0.39 µg/L (0.39 ppb), a competitive LOD compared to values reported in the literature.

2. Materials and Methods

2.1. Materials

Enrofloxacin (99%) and rhodamine 6G (95%) in powder form were purchased from Sigma-Aldrich. Other chemicals such as silver nitrate (AgNO3) (99.8%), sodium borohydride (NaBH4) (99.8%), trisodium citrate dihydrate (Na3C6H5O7·2H2O) (99%), hydrogen peroxide (H2O2) (30 wt.%) were purchased from Xilong Chemical Co., Ltd. (Shantou, China). All chemicals were used as received, without further purification, and deionized (DI) water was used to prepare all solutions.

2.2. Prepararion of the Silver Nanospheres (AgNSs) and Silver Triangular Nanoplate (AgTNPl) Colloids

The synthesis of AgTNPls colloid was performed using a seed-mediated method in two steps at room temperature. In the first step, small AgNSs were synthesized as seeds, and in the second step, these seeds were grown into AgTNPls. Specifically, during seed fabrication, 0.25 mL of 0.01 M AgNO3 solution was added to 24 mL of DI water. Subsequently, 0.7 mL of 0.05 M trisodium citrate (TSC) solution and 0.25 mL of 0.1 M NaBH4 solution were added simultaneously to this mixture with magnetic stirring for 5 min. The solution turns pale yellow (illustrated in Figure 1a), indicating the formation of AgNSs. Immediately after seed preparation, the growth stage was initiated by adding 65 μL of 30% H2O2 to the seed solution. The color of the solution gradually changed from pale yellow to reddish yellow, then to green, and finally to blue (illustrated in Figure 1b), indicating the successful formation of AgTNPls. Note that a portion of the AgNS colloid was collected after the seed preparation step to create SERS substrates for comparison with those prepared from AgTNPls.
After synthesis, both AgNSs and AgTNPls colloids were centrifuged at 12,000 rpm. The transparent supernatant was discarded, and the precipitate was retained, washed several times in DI water to remove residual reactants, and then redispersed in DI water.

2.3. Preparations for SERS Measurements

SERS spectra were recorded for rhodamine 6G (R6G) and enrofloxacin (ENR) at low concentrations. For each measurement, 20 μL of either AgNSs or AgTNPls colloid was mixed with 20 μL of R6G or ENR solution and vortexed for 10 s. A 40 μL aliquot of the resultant solution was then dispensed onto a commercial aluminum foil (Al-foil) with a diameter of 2 mm. Before use, the Al-foil was washed with acetone and rinsed with DI water. The sample was dry naturally in air. R6G concentrations ranged from 10−5 to 10−13 M, while ENR concentrations ranged from 50 to 0.005 mg/L (ppm) (~1.4 × 10⁻⁴–1.4 × 10⁻⁸ M).
Analyte solutions at low concentrations were prepared by sequential dilution. Specifically, R6G or ENR powder was dissolved in methanol to prepare stock solution with concentrations of 10−2 M or 100 mg/L, respectively. These stock solutions were subsequently diluted with DI water to create R6G in the range of 10−5 to 10−13 M and ENR solutions in the range of 50 to 0.005 mg/L (ppm).
The main fabrication steps and SERS applications of AgTNPls are schematically illustrated in Figure 2.

2.4. Instrumentations

The morphology of AgNSs and AgTNPls was examined using an S-4800 field-emission scanning electron microscope (SEM) (Hitachi, Tokyo, Japan). Size distribution was determined via dynamic light scattering (DLS) using the Zetasizer-Nano ZS (Malvern Instruments, Malvern, UK). Optical absorption spectra of AgNSs and AgTNPls colloids was recorded using UV-Vis absorbance spectroscopy (Shimadzu, Kyoto, Japan) over the range 190–1100 nm. SERS spectra of analytes were measured using portable Raman spectrometer model BWS475-785H with a 785 nm excitation laser (B&W Tek, Newark, DE, USA). The laser spot size was 105 μm with a 20× objective lens magnification. Acquisition time was set to 10 s with 3 accumulations.

3. Results

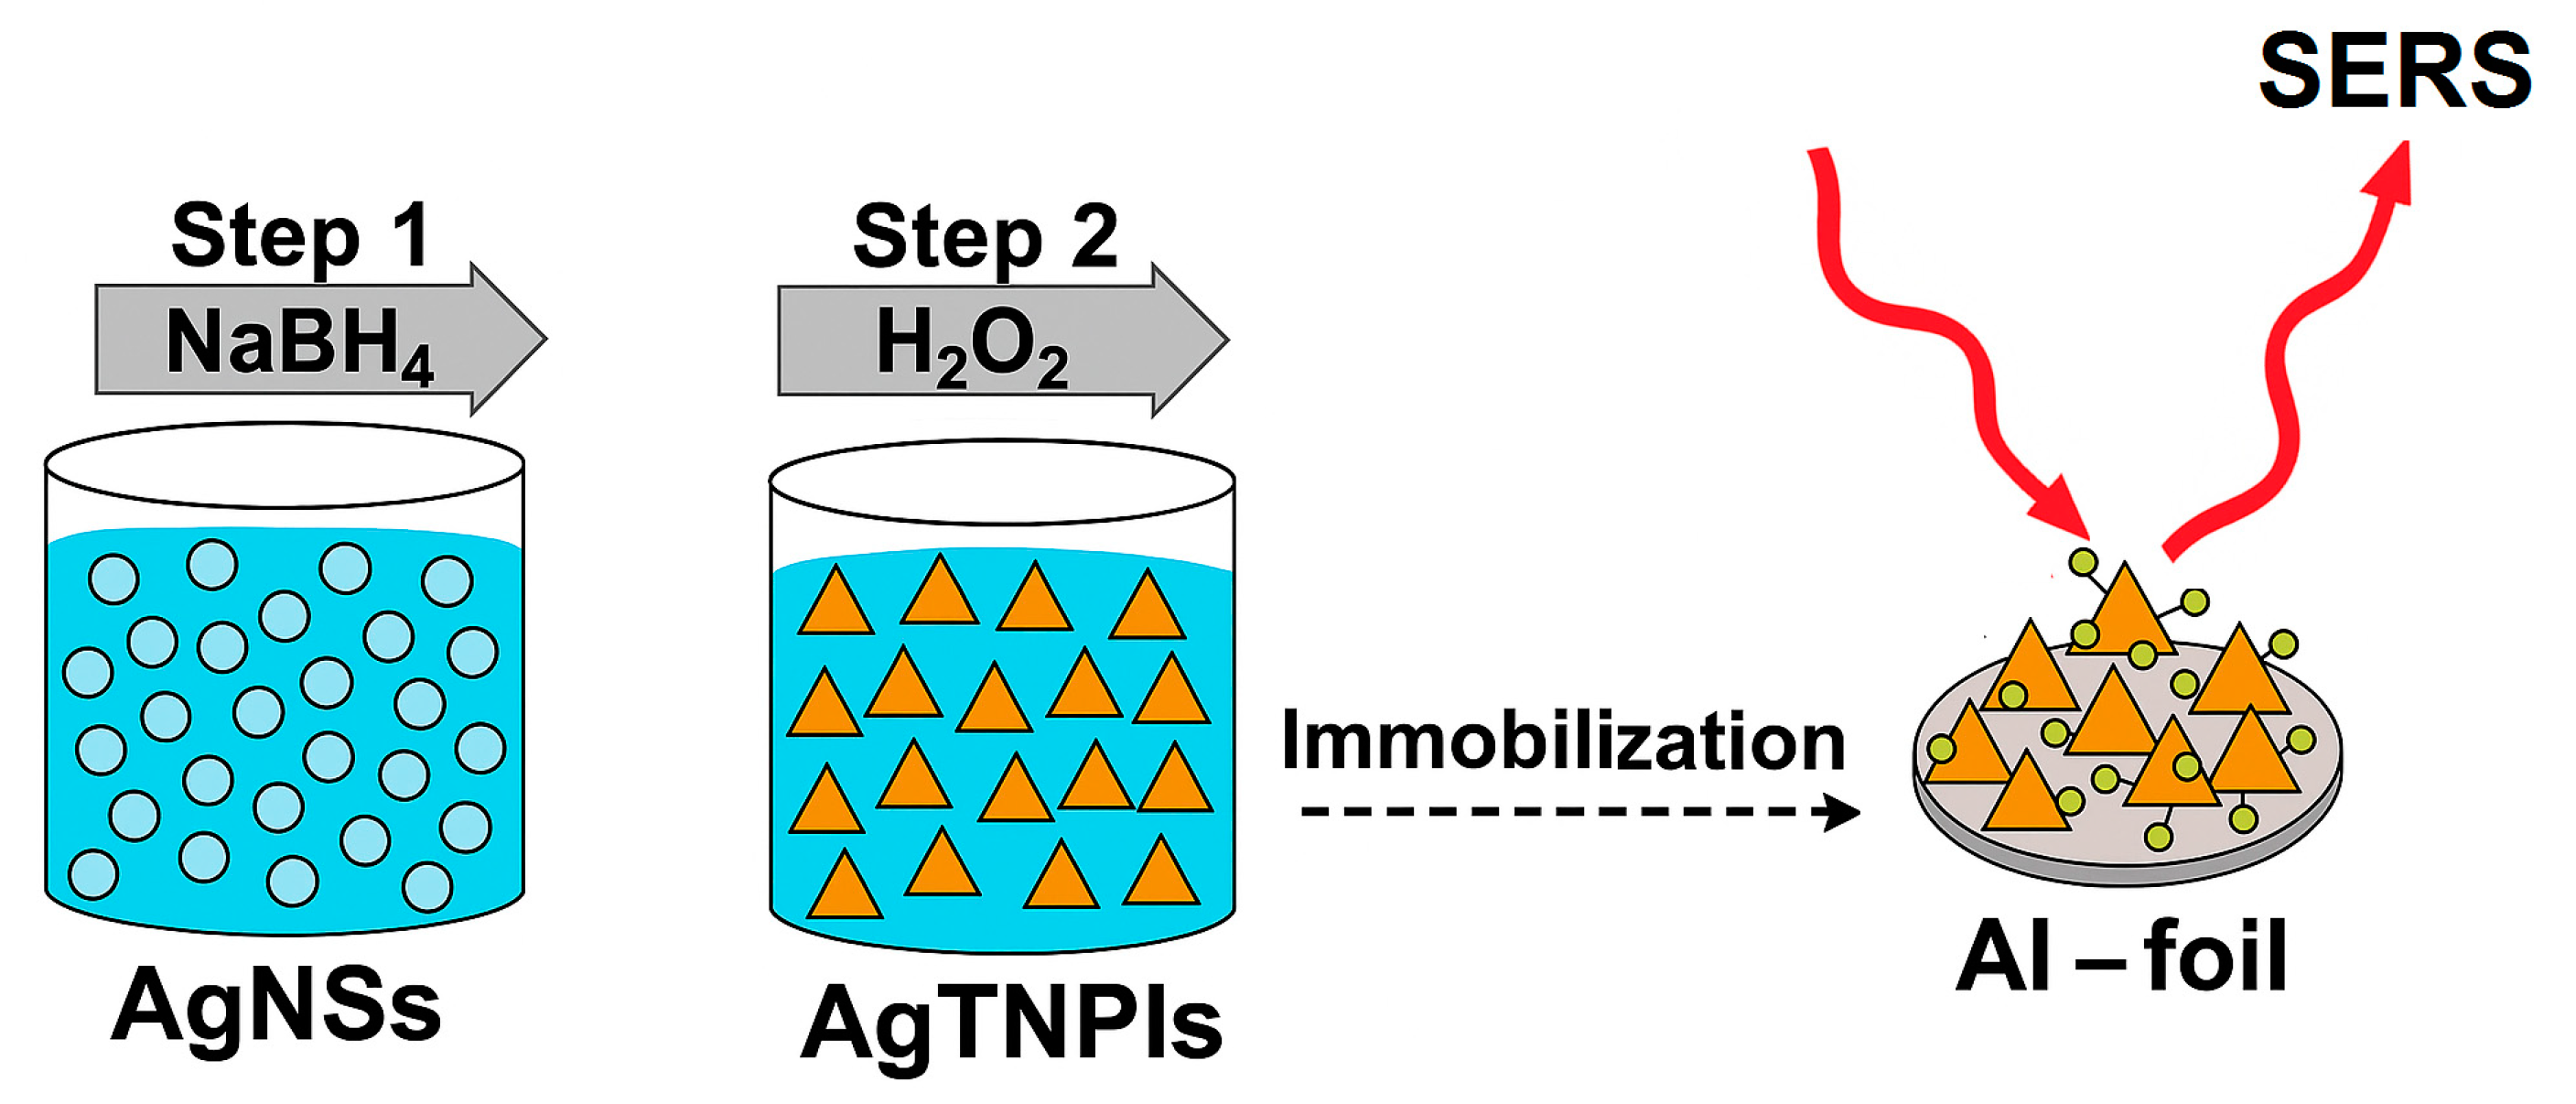
3.1. The AgTNPls Synthesis Process

C. A. Mirkin and G. S. Metraux [17] pioneered the synthesis of AgTNPls via a thermal synthesis using five reagents: AgNO3, NaBH4, H2O2, trisodium citrate (TSC), and polyvinylpyrrolidone (PVP), all mixed in an aqueous solution at room temperature. Subsequent studies have modified this method [9,10,11,18,19,20,21,22]. To streamline the process, we reduced the number of chemicals, excluding PVP, based on findings suggesting that its omission results in more uniform and stable AgTNPls [19,23].
Mirkin’s approach is a seed-mediated method, where small AgNSs (a few to a several tens of nm in diameter) serve as templates for the formation of AgTNPls. However, a key difference in our method is the reversal of the typical addition order of H2O2 and NaBH4. In many studies [9,10,11,17,18,19,20,21,22], H2O2 was added before NaBH4, directly incorporating the seeding step into the formation of AgTNPls. In contrast, we first introduce NaBH4, which reduces AgNO3 to form silver atoms, allowing for AgNSs formation. H2O2 is then added to induce the transformation of AgNSs into AgTNPls, with color changes from pale yellow to blue confirming the transition.
Our results indicate that reversing the addition order led to a colloid predominantly composed of AgTNPls, as confirmed by UV-Vis spectroscopy, which displayed the characteristic peaks of AgTNPls (Figure 3, red curve), and further supported by SEM (Figure 4b). By contrast, when H2O2 was added before NaBH4, the colloid contained a mixture of AgTNPls and spherical nanoparticles (Figure 4c).
Our approach clearly separates two distinct steps: the formation of AgNSs as seeds and their transformation into AgTNPls. Specifically, when NaBH4 is added first, it acts as a strong reducing agent that rapidly reduces Ag+ ions to form small Ag nanospheres (AgNSs) in the 10–25 nm range as seeds. TSC is then added to stabilize these AgNSs and prevent aggregation, which is crucial for achieving uniform AgTNPls. Subsequently, the addition of H2O2 (with its dual role as oxidant and reductant) leads to oxidative etching and anisotropic growth of these seeds, favoring triangular nanoplate formation due to surface energy minimization and facet-selective etching. The citrate ions preferentially adsorb on (111) facets, promoting growth in lateral directions rather than vertical ones, which results in the formation of flat, plate-like structures with edge lengths larger than the original seeds [17,19,23,24,25,26]. In contrast, adding H2O2 before NaBH4 disrupts the controlled seed growth, resulting in a mixture of nanoparticle shapes and less uniformity.

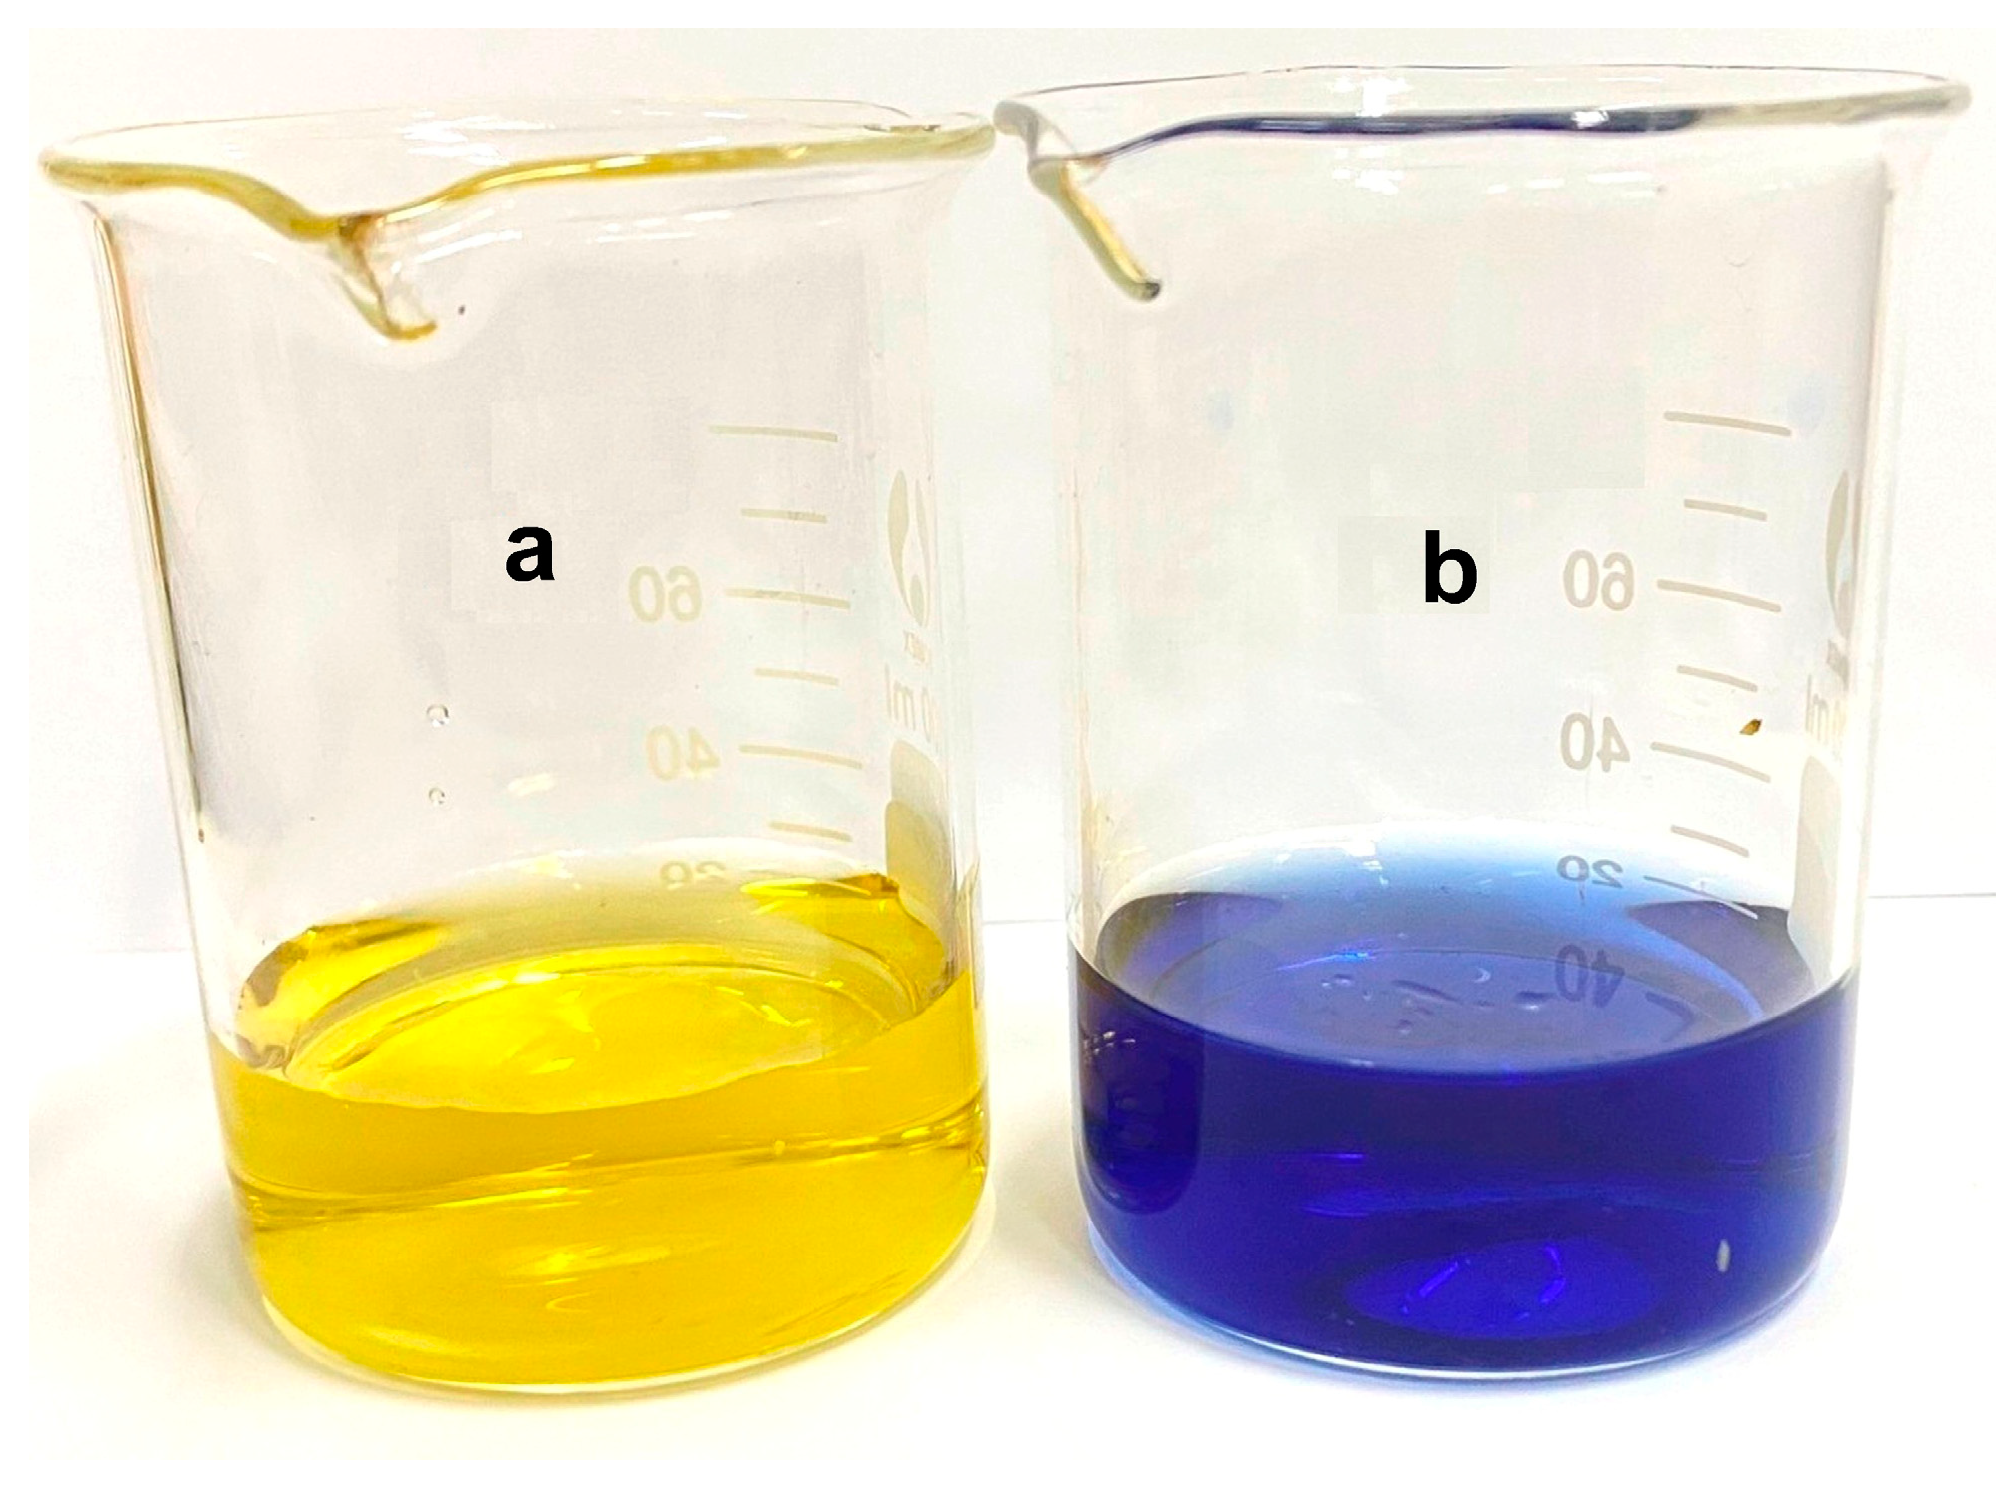
3.2. Color of Silver Colloids

The color of the colloidal solution is indicative of the particle shape, as previously established [8,22]. The pale yellow color after the seeding step (Figure 1a) corresponds to spherical AgNPs, while the final blue solution (Figure 1b) results from the formation of AgTNPls. These observations were further confirmed by UV-Vis spectroscopy (Figure 3) and SEM images (Figure 4a,b).

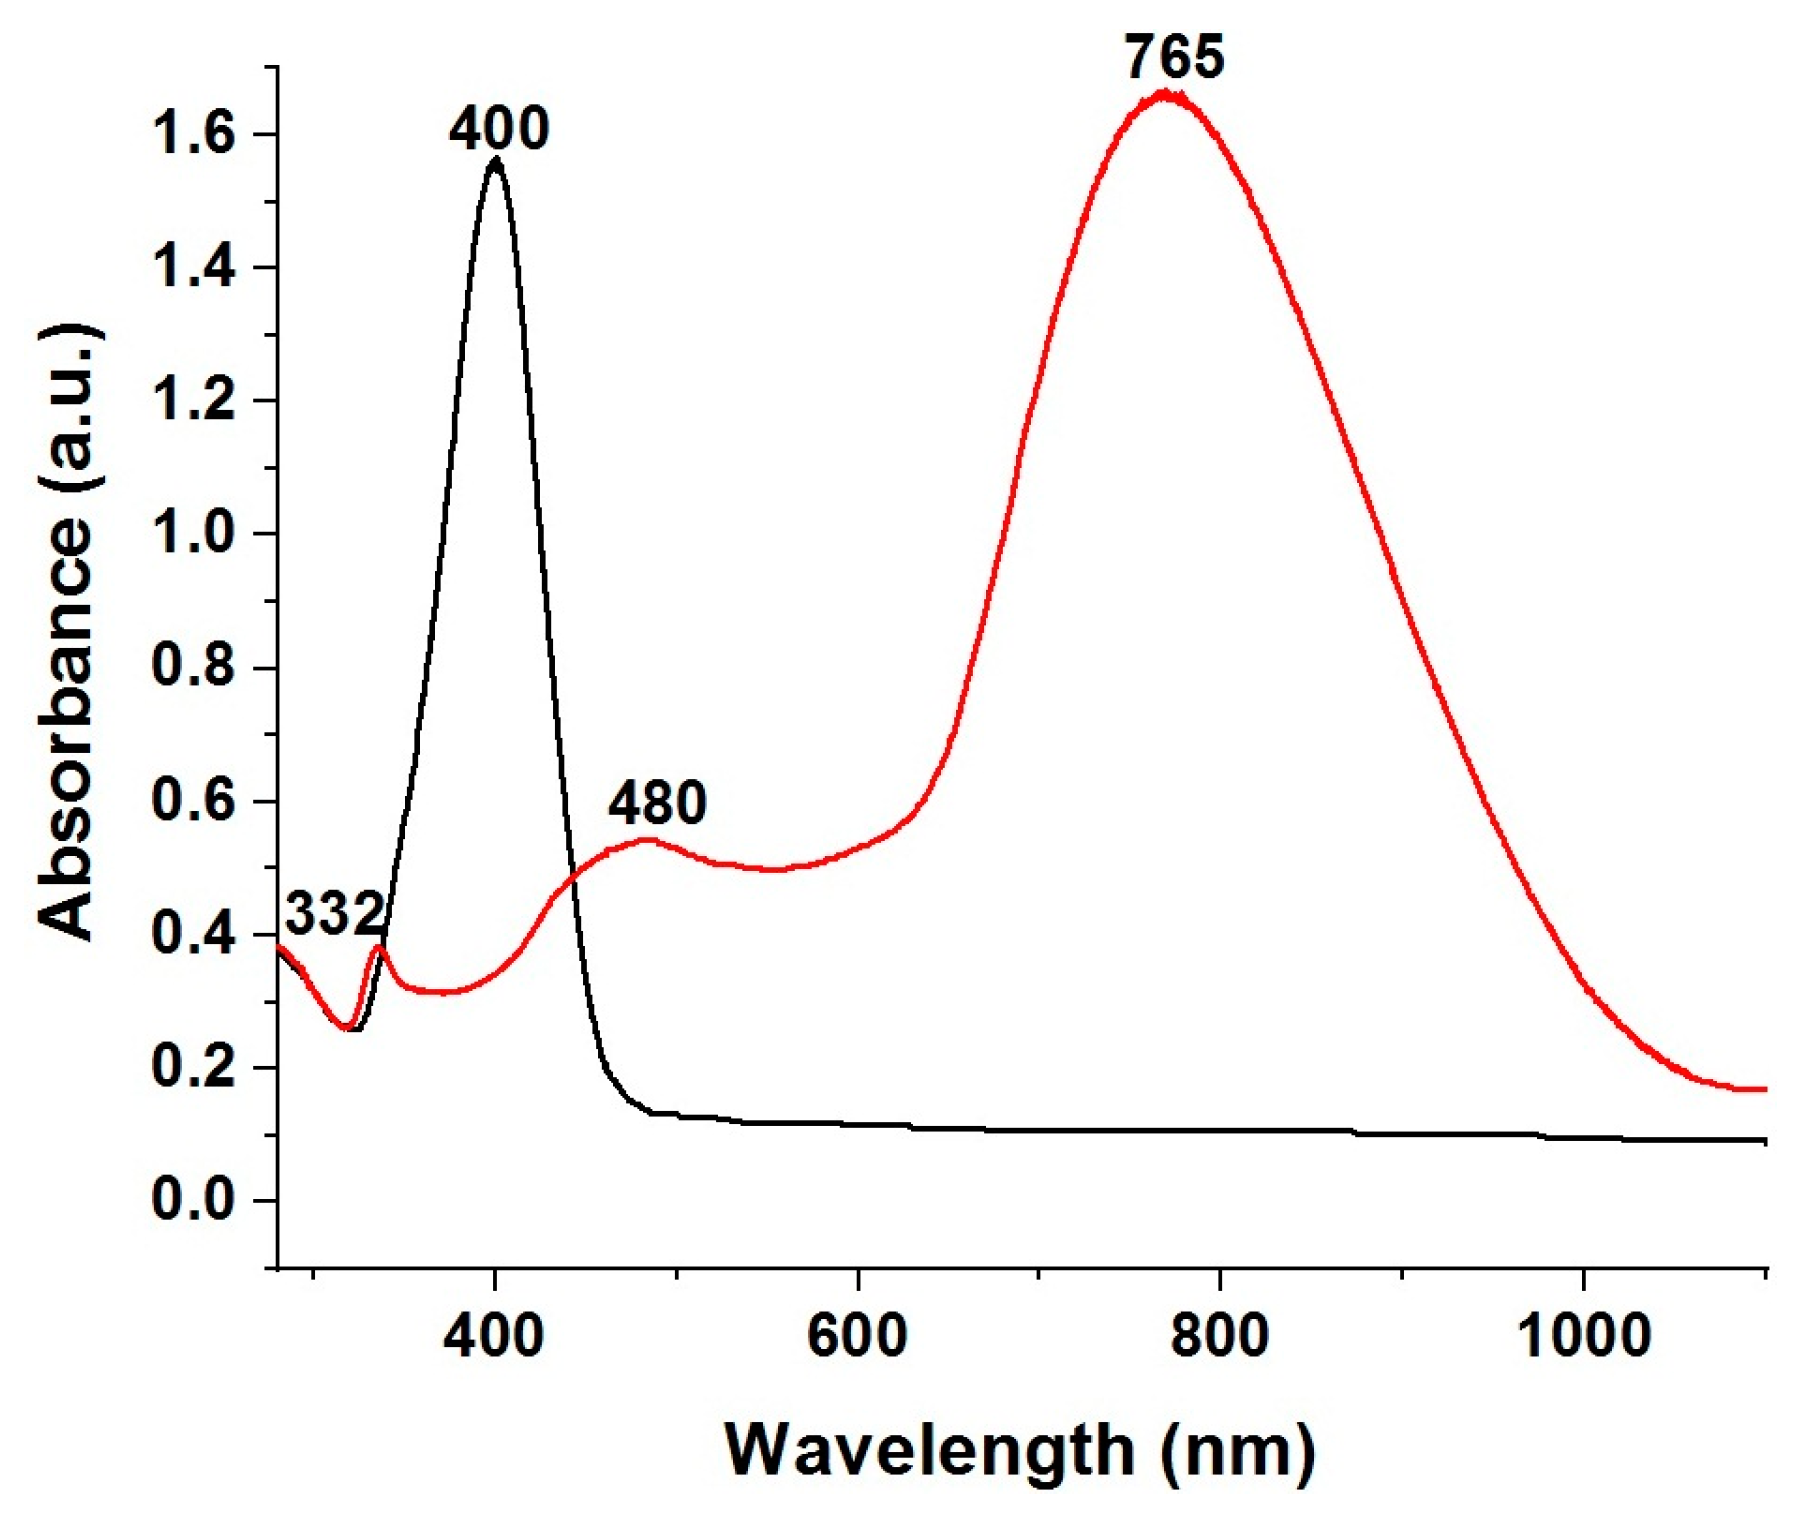
3.3. UV-Vis Spectroscopy of Silver Colloids

Figure 3 presents the UV-Vis absorption spectra of the synthesized colloids. The seed colloid exhibited a sharp absorption peak around 400 nm (Figure 3, black curve), typical of small spherical nanoparticles [19,48,49,50,51]. In contrast, the final colloid displayed a three-peak absorption pattern (Figure 3, red curve), with peaks at 332 nm, 480 nm and 765 nm, confirming the presence of AgTNPls [17,18,19,20,21,22]. These peaks correspond to the in-plane dipole and out-of-plane quadrupole resonances [18,20,52,53], confirming the formation of triangular nanoplate structures.

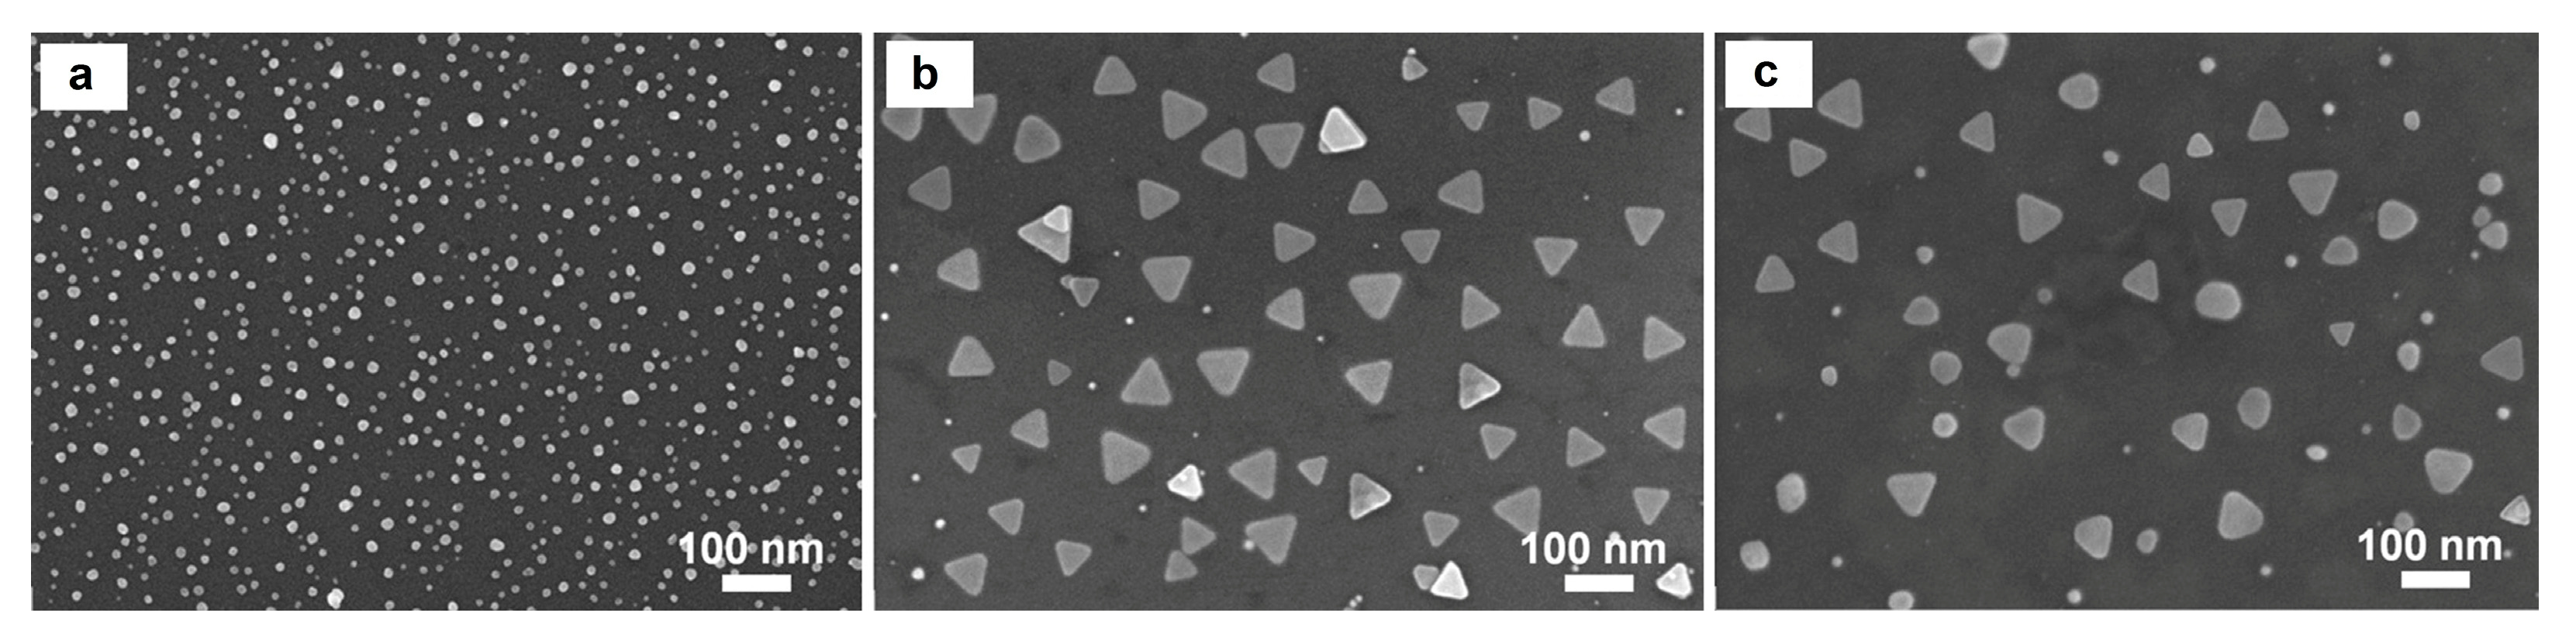
3.4. SEM Images of Synthesized AgNSs and AgTNPLs

SEM images (Figure 4) show that AgNSs, formed during the seeding step, are nearly spherical (Figure 4a), with sizes ranging from 10 to 25 nm. After the addition of H2O2, the particles transformed into triangular nanoplates (Figure 4b), with side lengths of 40–70 nm. These particles exhibited well-defined shapes and a narrow size distribution, contrasting with the mixture of AgTNPls and spherical particles produced when H2O2 was added before NaBH4 (Figure 4c). This comparison highlights the advantages of our method in producing high-quality AgTNPls.

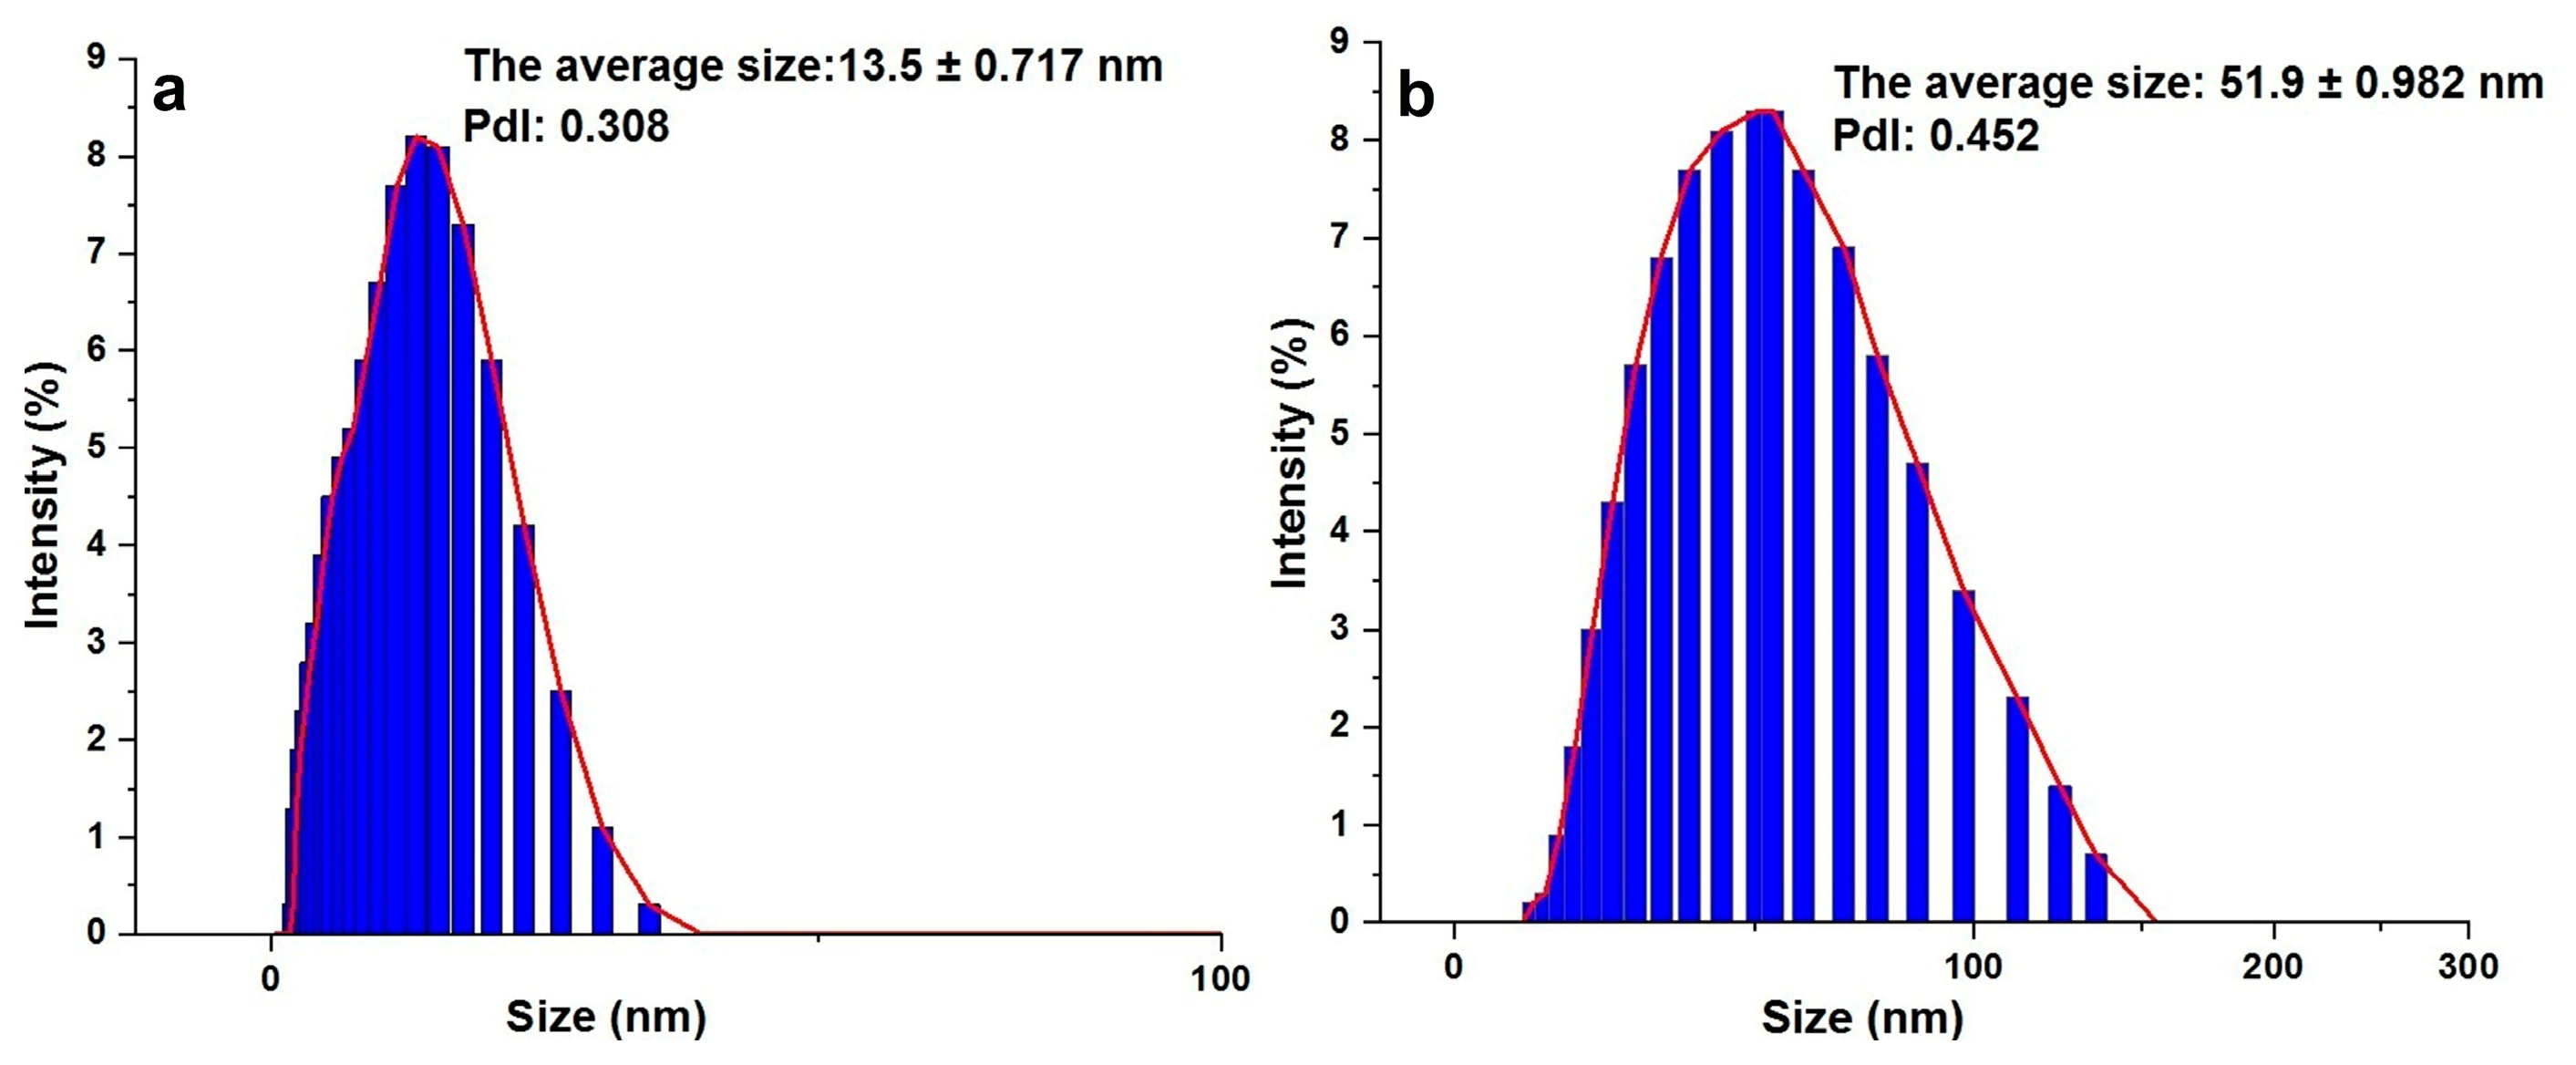
3.5. Size of the Synthesized AgNSs and AgTNPls

Dynamic light scattering (DLS) measurements (Figure 5a,b) revealed that the AgNSs had an average size of 13.5 ± 0.717 nm, with a polydispersity index (PdI) of 0.308, indicating a relatively narrow size distribution. The AgTNPls exhibited an average size of 51.9 ± 0.982 nm and a PdI of 0.452, consistent with the SEM results (Figure 4a,b). The narrow DLS peaks and low PdI values confirm that both AgNSs and AgTNPls are monodispersed [11].
The size of AgTNPls can be controlled by adjusting parameters such as the concentration of H2O2, the ratio of TSC to Ag+, and the reaction time. These factors influence the kinetics of oxidative etching and growth. For example, increasing the amount of H2O2 can accelerate etching and nucleation, promoting the growth of smaller plates, while decreasing it allows more extended growth, yielding larger plates. This mechanism is consistent with reports of the literature [19,23,24].

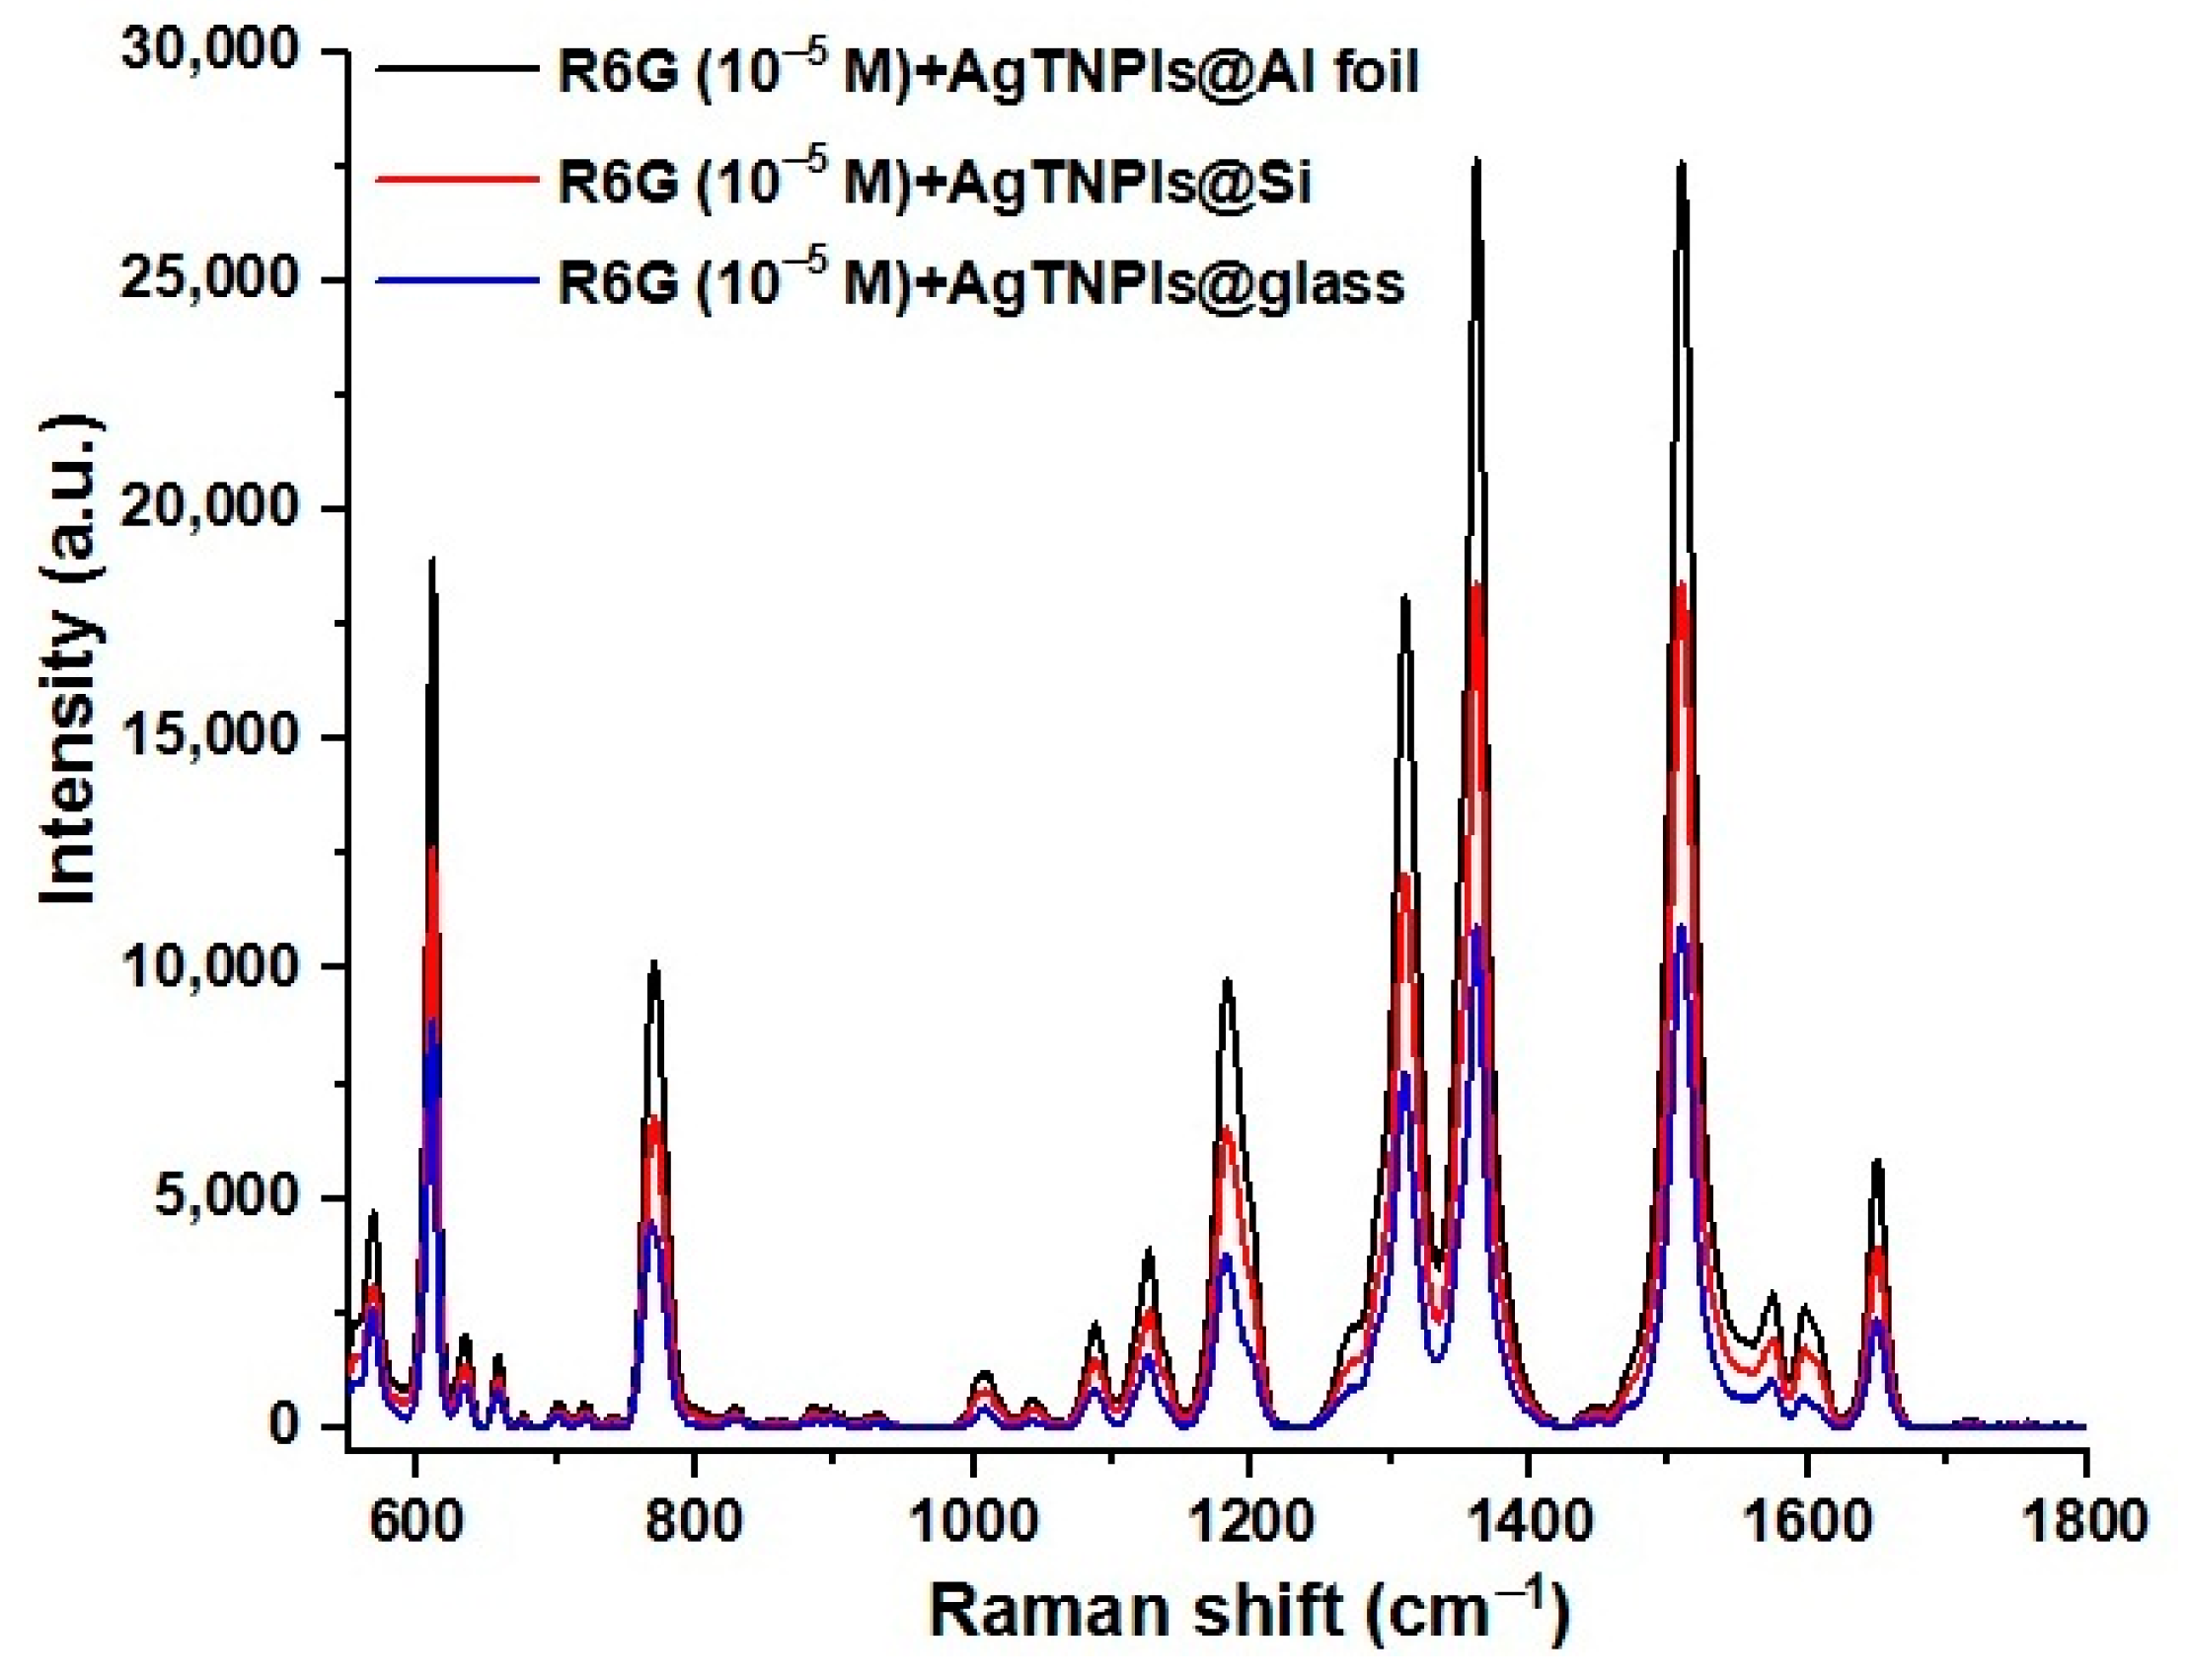
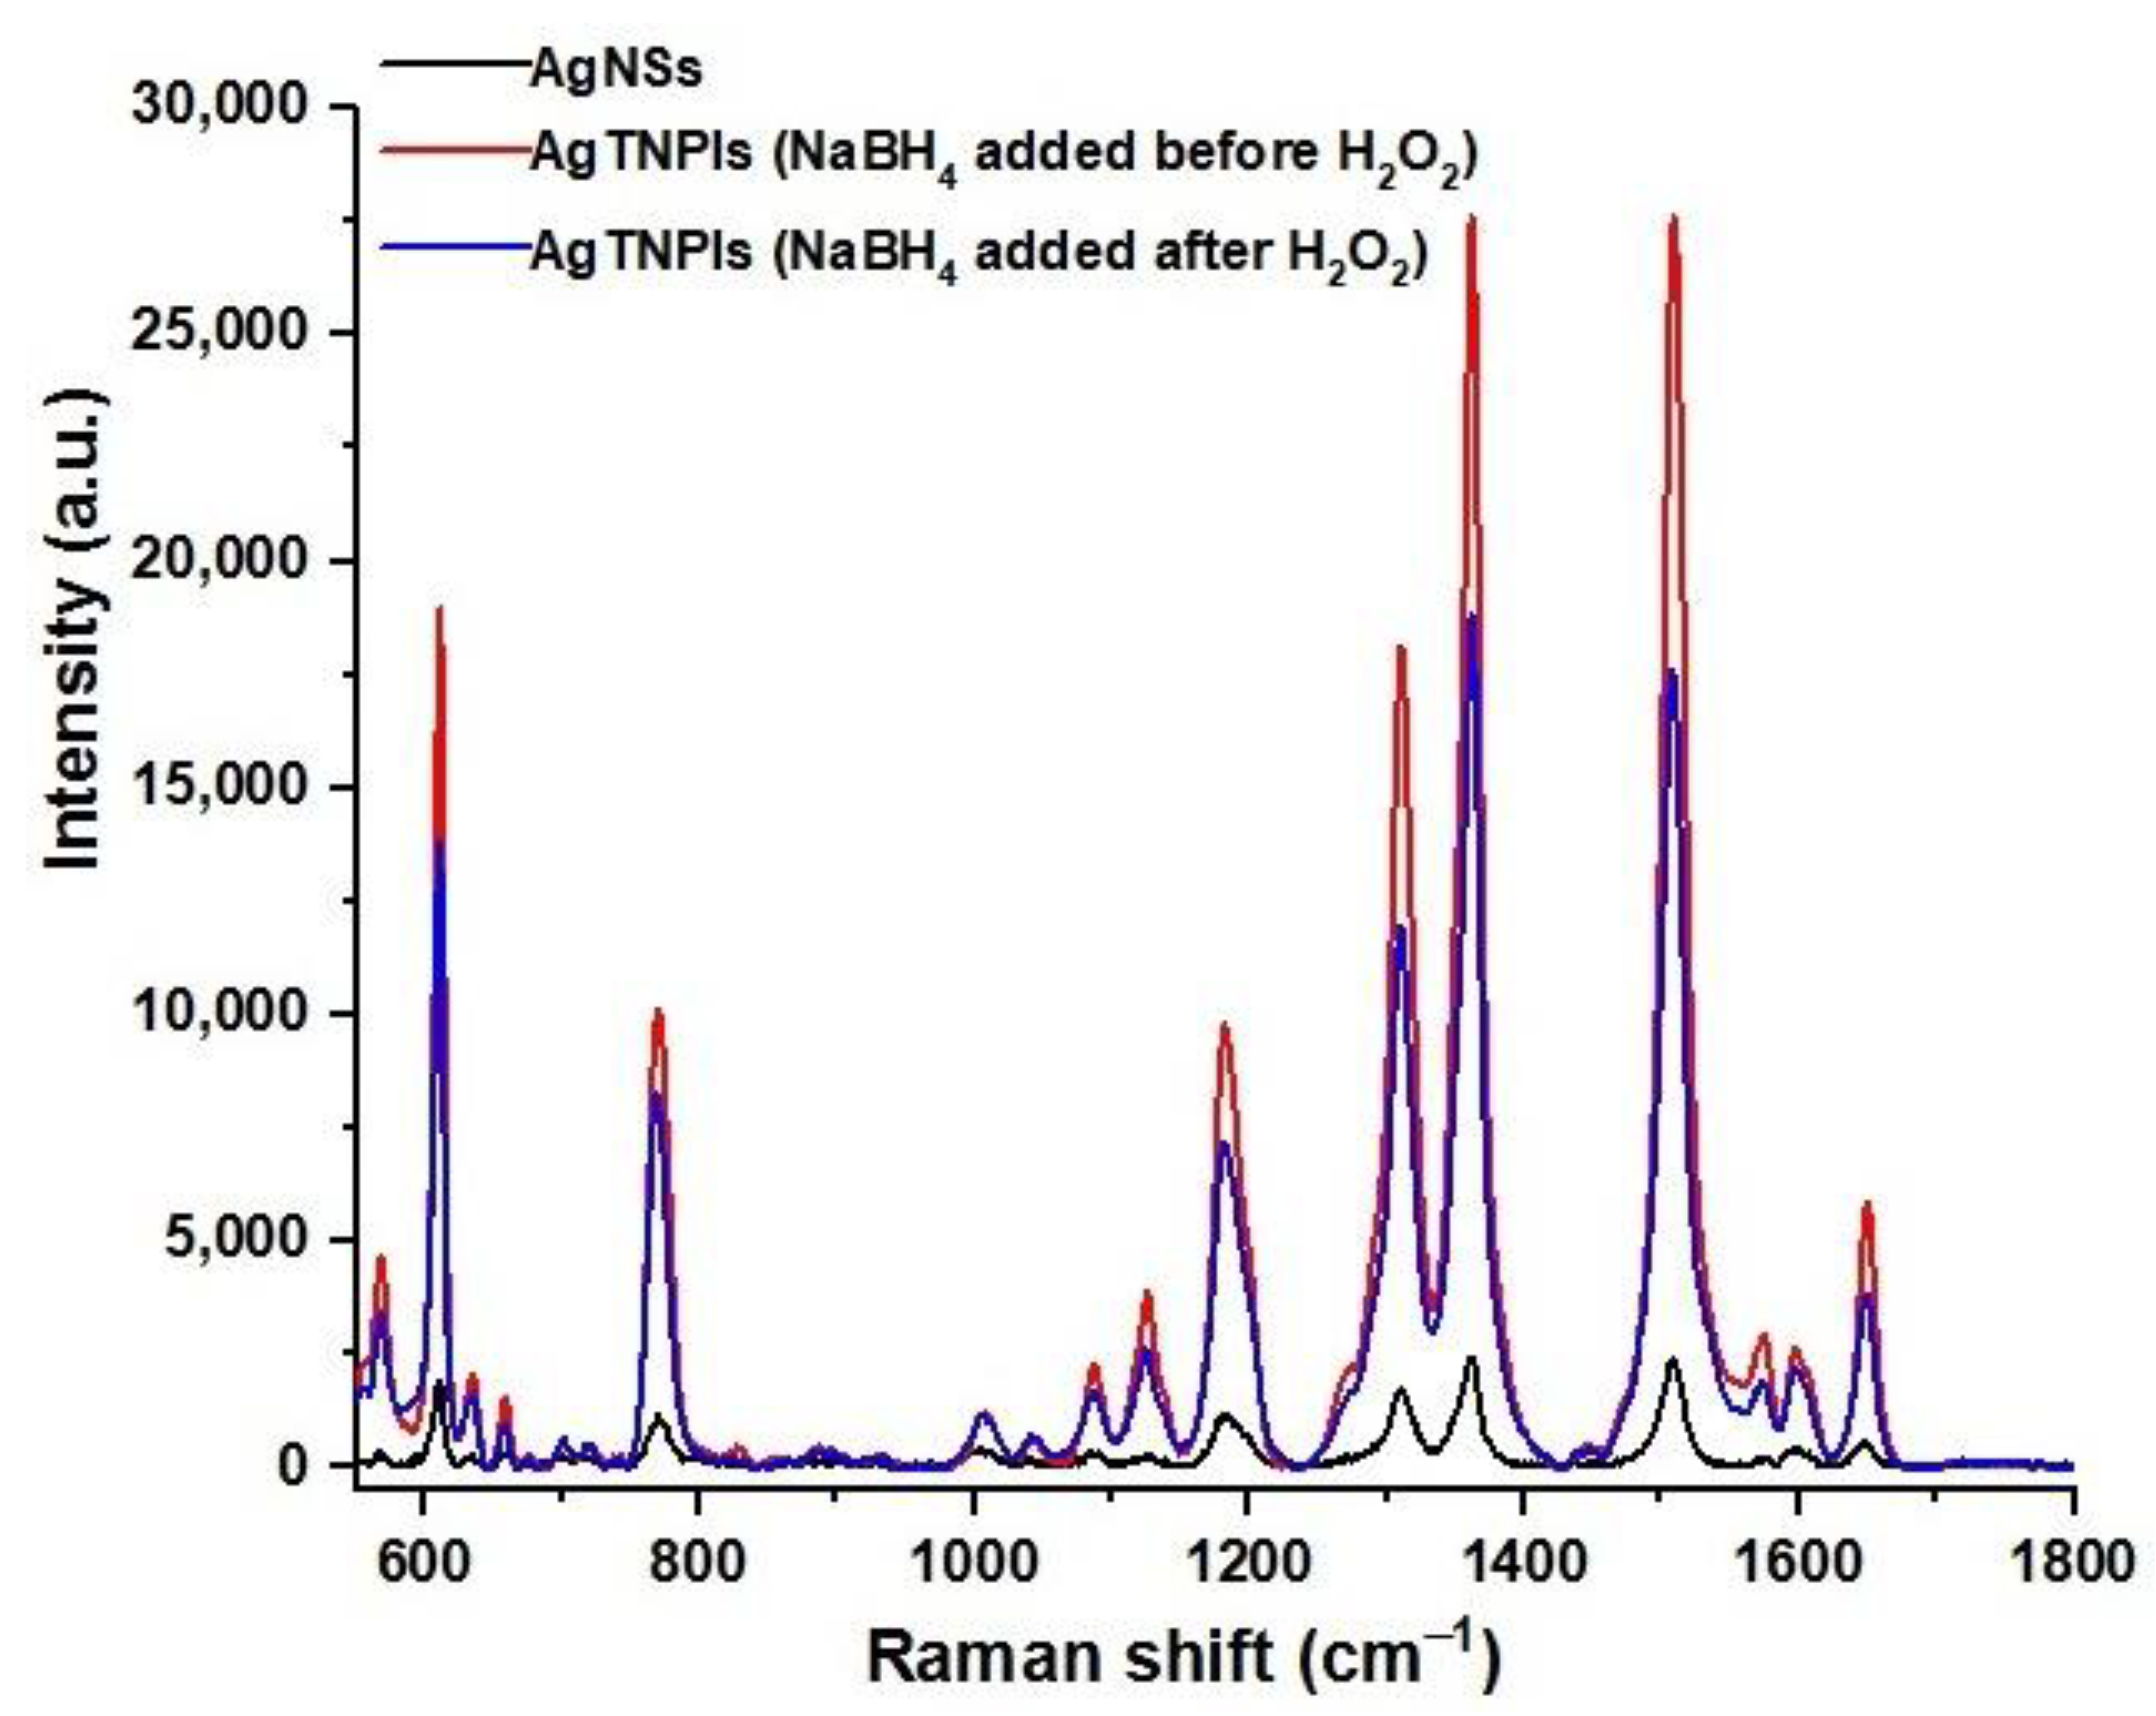
3.6. Recording the SERS Spectrum of R6G to Check the Quality of the SERS Substrate

SERS and Raman spectroscopy of R6G, a commonly used organic dye, were conducted to evaluate the quality of the SERS substrates prepared using AgTNPls. Figure 6 displays the SERS spectra of 10−5 M R6G recorded with AgTNPls substrates synthesized in this study and coated onto different materials: a microscope glass slide (blue curve), a silicon wafer (red curve), and an Al-foil (black curve). Among these, the substrate with AgTNPls on the glass slide exhibited the lowest enhancement factor, followed by the silicon wafer, while the Al-foil substrate provided the highest enhancement factor.
Further comparison, presented in Figure 7, shows the SERS spectra of 10−5 M R6G obtained using AgTNPls synthesized by our method and coated on Al-foil (red curve) versus substrates prepared using alternative methods. The blue curve represents a substrate made with AgTNPls synthesized by a conventional method involving the addition of H2O2 prior to NaBH4, while the black curve corresponds to a substrate made with AgNSs (produced during the seed fabrication step). The results indicate that the AgTNPls synthesized via our method achieved a significantly higher SERS enhancement factor due to the production of nearly pure triangular nanoplates. In contrast, the conventional method yielded a mixture of triangular nanoplates and spherical nanoparticles, reducing SERS efficiency. Substrates made from AgNSs, comprising predominantly spherical-shaped particles (Figure 4a), exhibited considerably lower SERS activity, further emphasizing the superior performance of AgTNPls for SERS detection.
To further demonstrate the benefits of using an Al-foil substrate, SERS spectra of R6G at lower concentrations were recorded with AgTNPls@Al-foil substrates synthesized in this study (Figure 8). The AgTNPls@Al-foil substrate enabled the detection of R6G at concentrations as low as 10−13 M, highlighting its remarkable sensitivity for trace-level detection.
The SERS enhancement factor (EF) of the AgTNPls@Al-foil and AgNSs@Al-foil substrates was then evaluated based on the Raman and SERS spectra of R6G. The EF was calculated using the following equation [54,55]:
E F = I S E R S C R S I R S C S E R S
where CRS and CSERS represent the concentrations of R6G on the non-SERS and SERS substrates at which Raman spectra can still be recorded, respectively, and ISERS and IRS are the Raman intensities of a characteristic R6G band under those conditions. The band at 1511 cm−1 of R6G was chosen for the calculation due to its sharpness, intensity, and reproducibility, especially at low concentrations.
For R6G deposited on a glass plate, CRS was 10−3 M, and IRS at 1511 cm−1 was approximately 377 in arbitrary unit (a.u.). For the AgTNPls@Al-foil SERS substrate, the lowest detectable R6G concentration was 10−13 M, with ISERS at 1511 cm−1 being about 120 in a.u., yielding an EF of 3.2 × 10⁹. In comparison, the AgNSs@Al-foil substrate achieved the lowest R6G concentration of 10−11 M, with ISERS at 1511 cm−1 being about 50 in a.u., resulting in an EF of 1.3 × 10⁷. These findings demonstrate the superior SERS enhancement provided by the AgTNPls@Al-foil substrate.

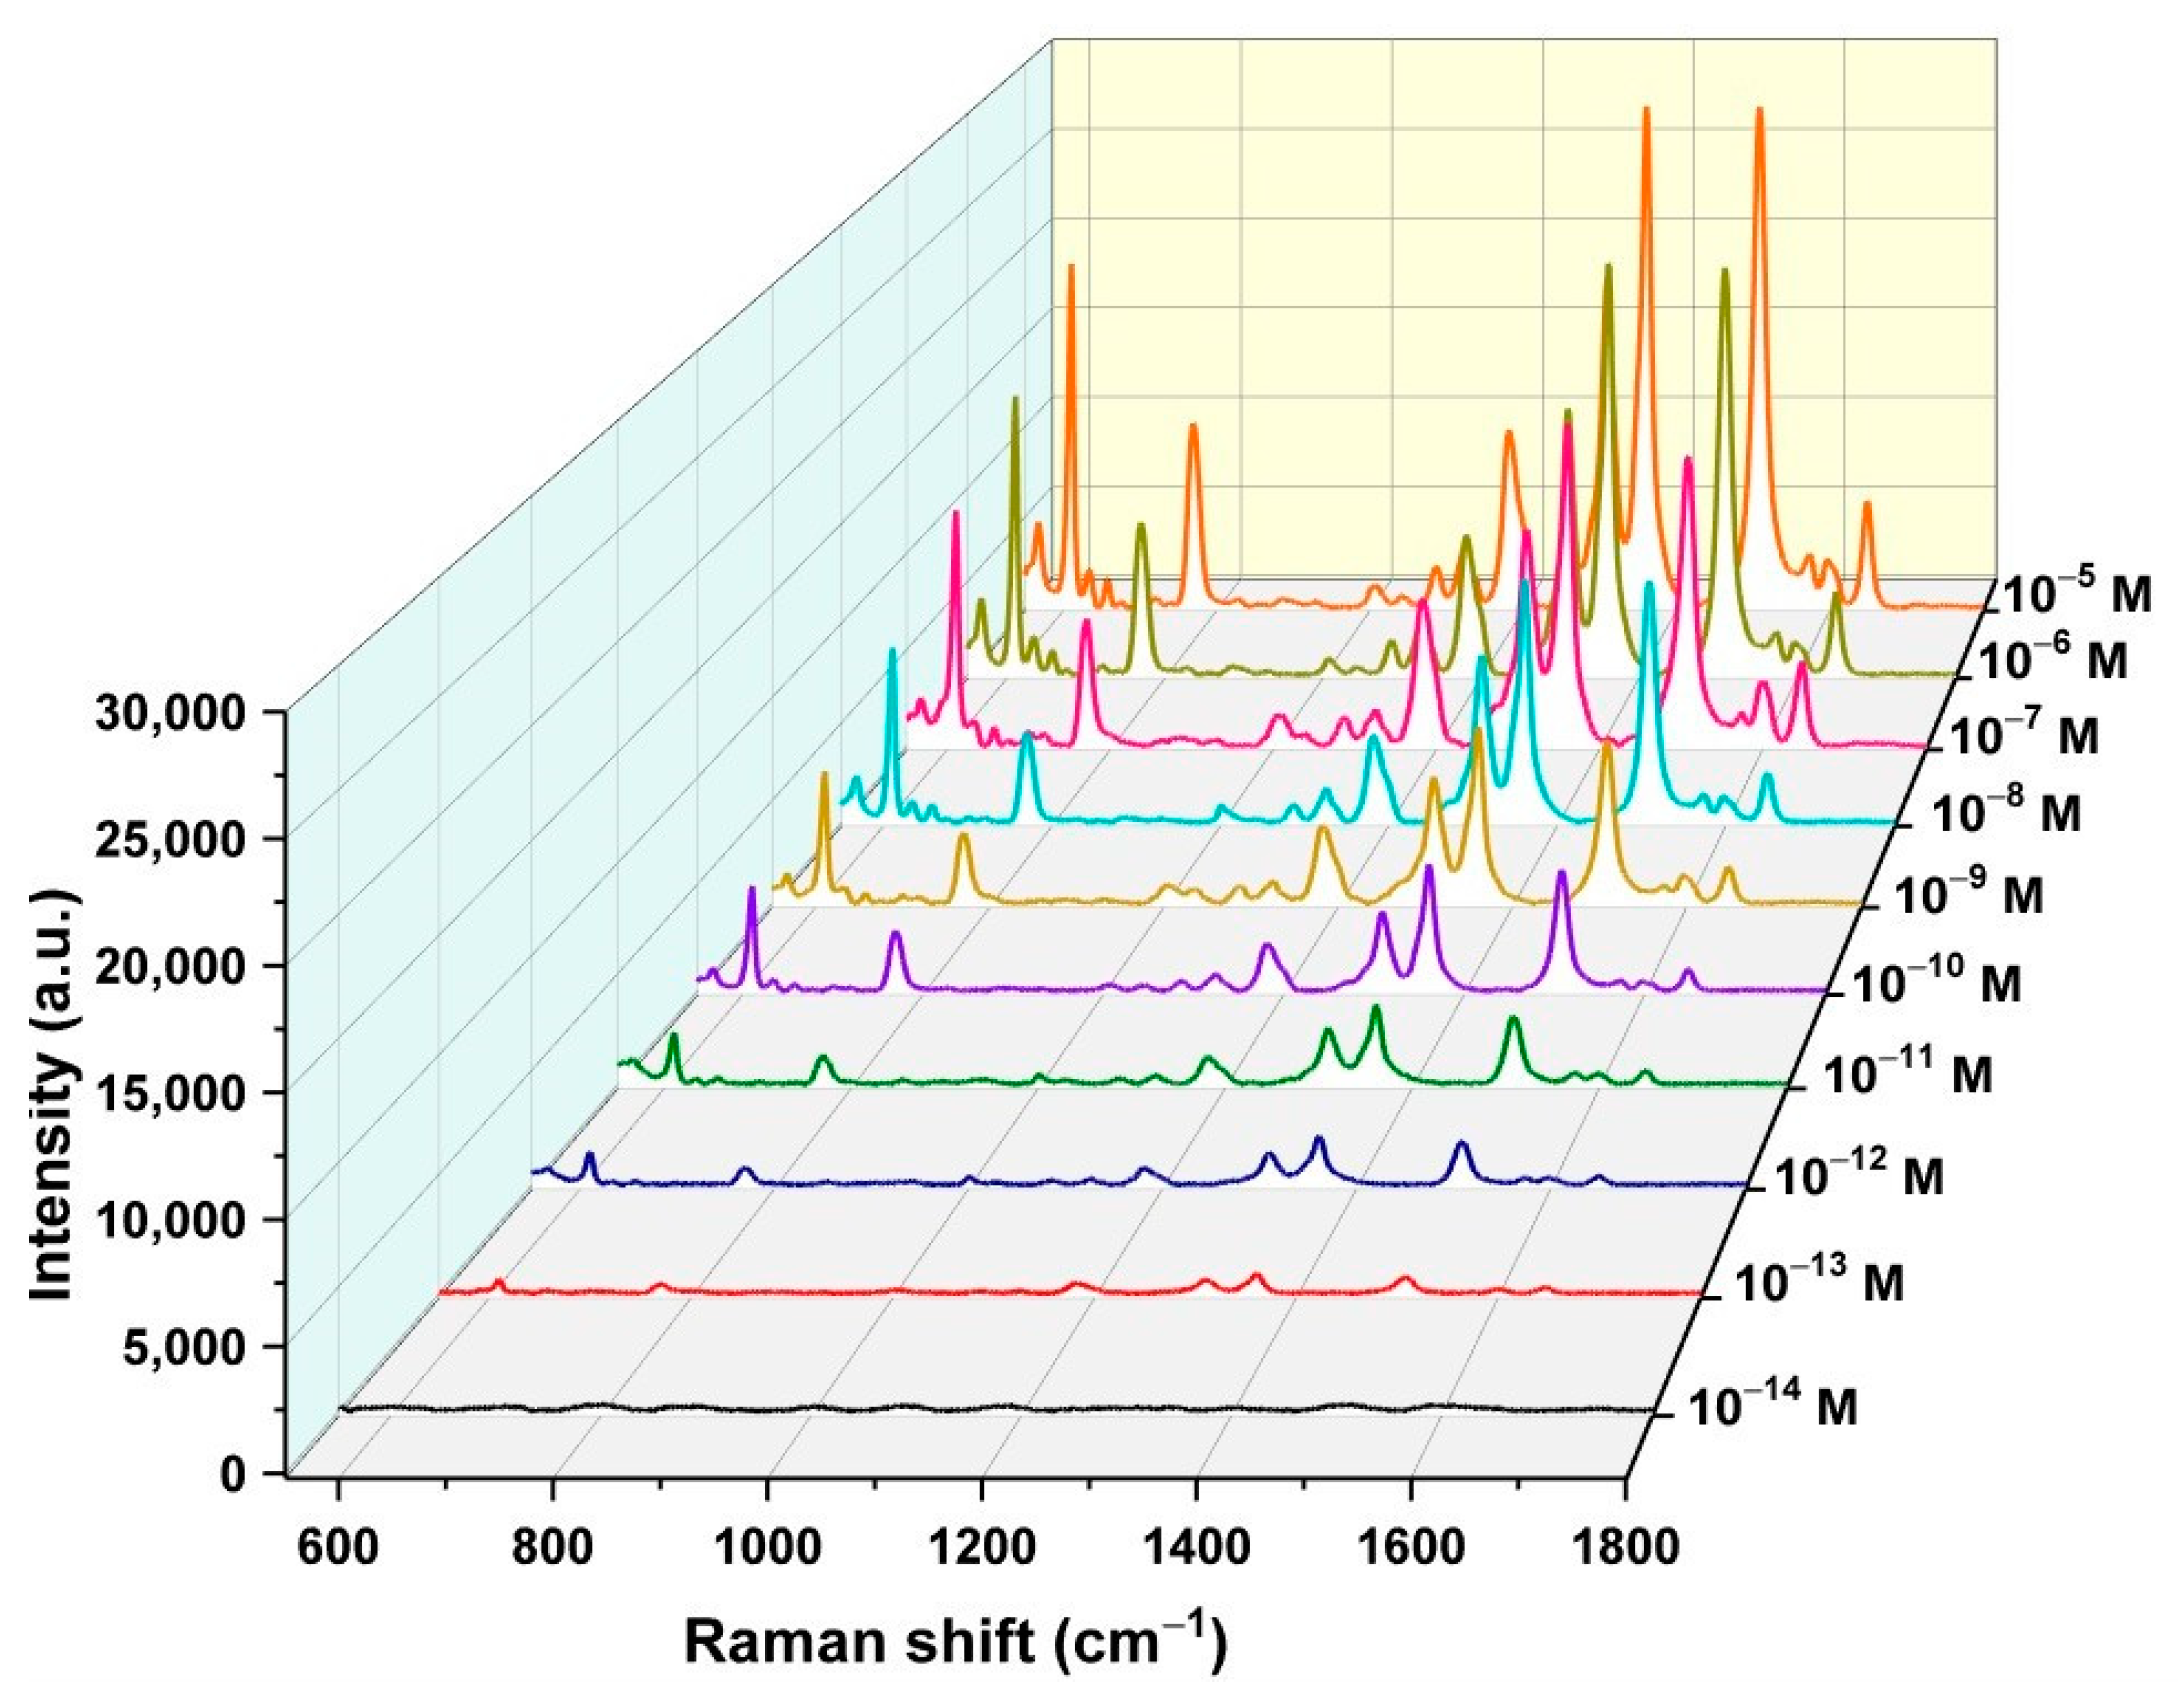
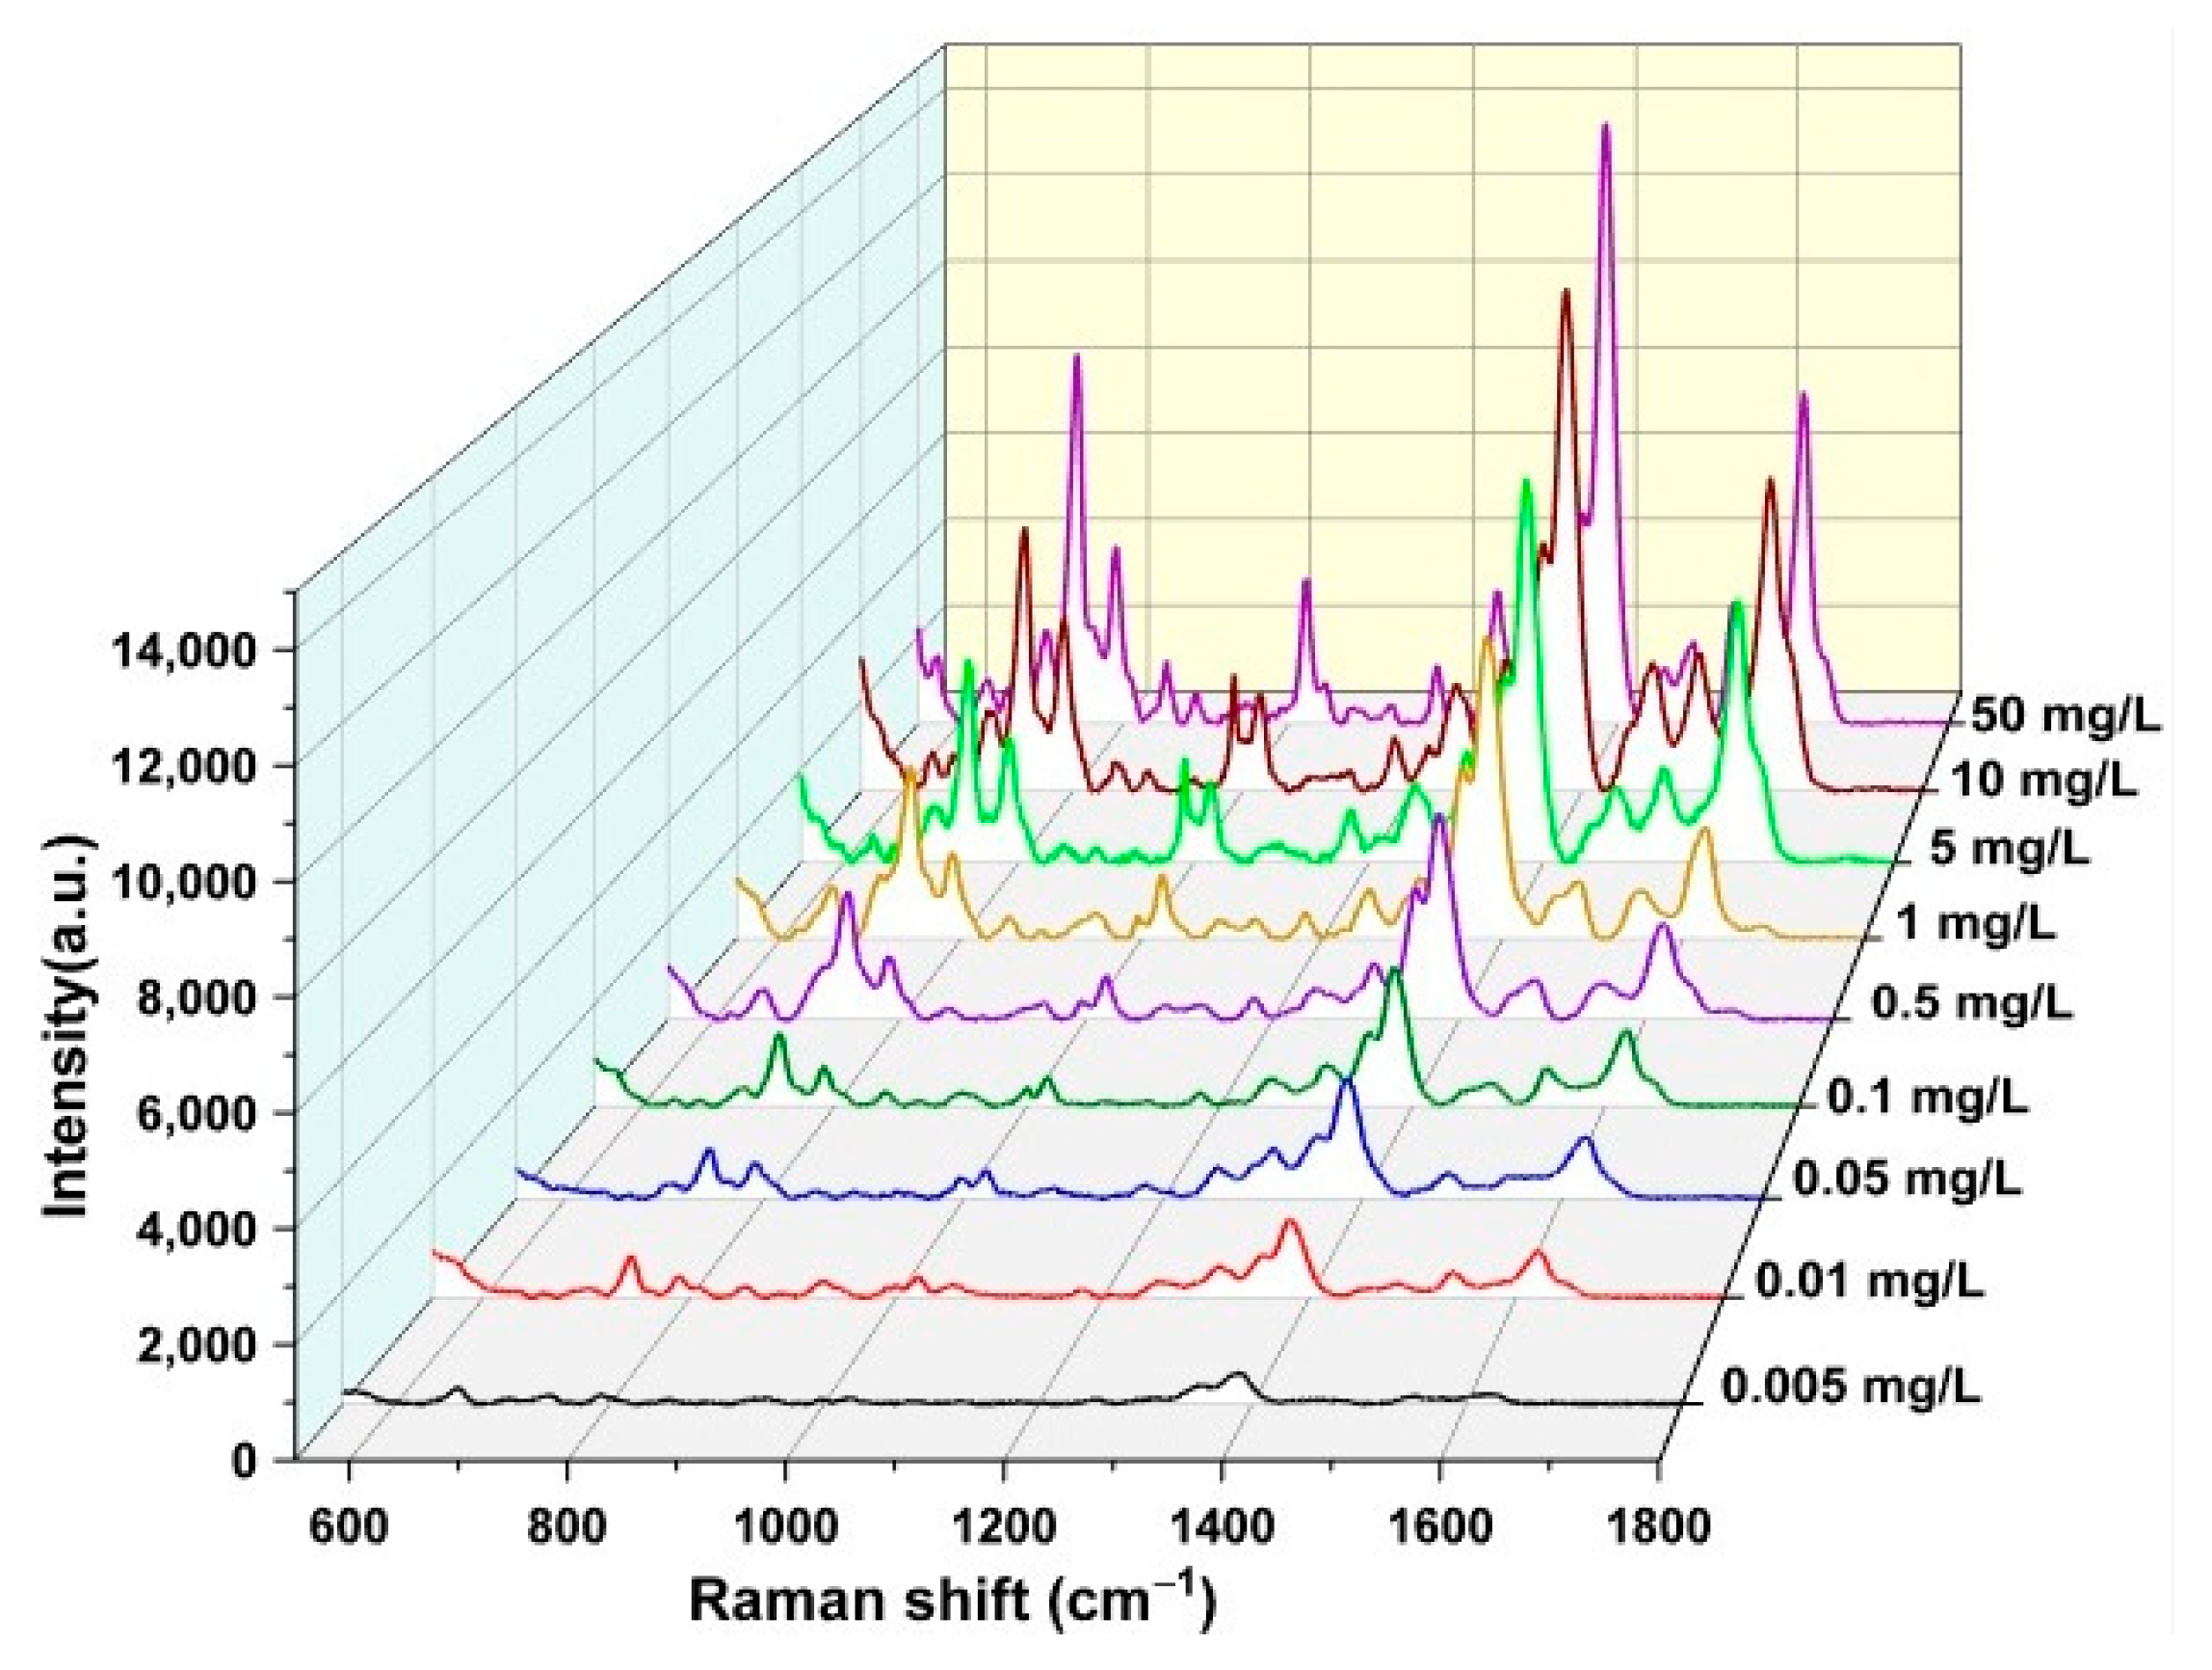
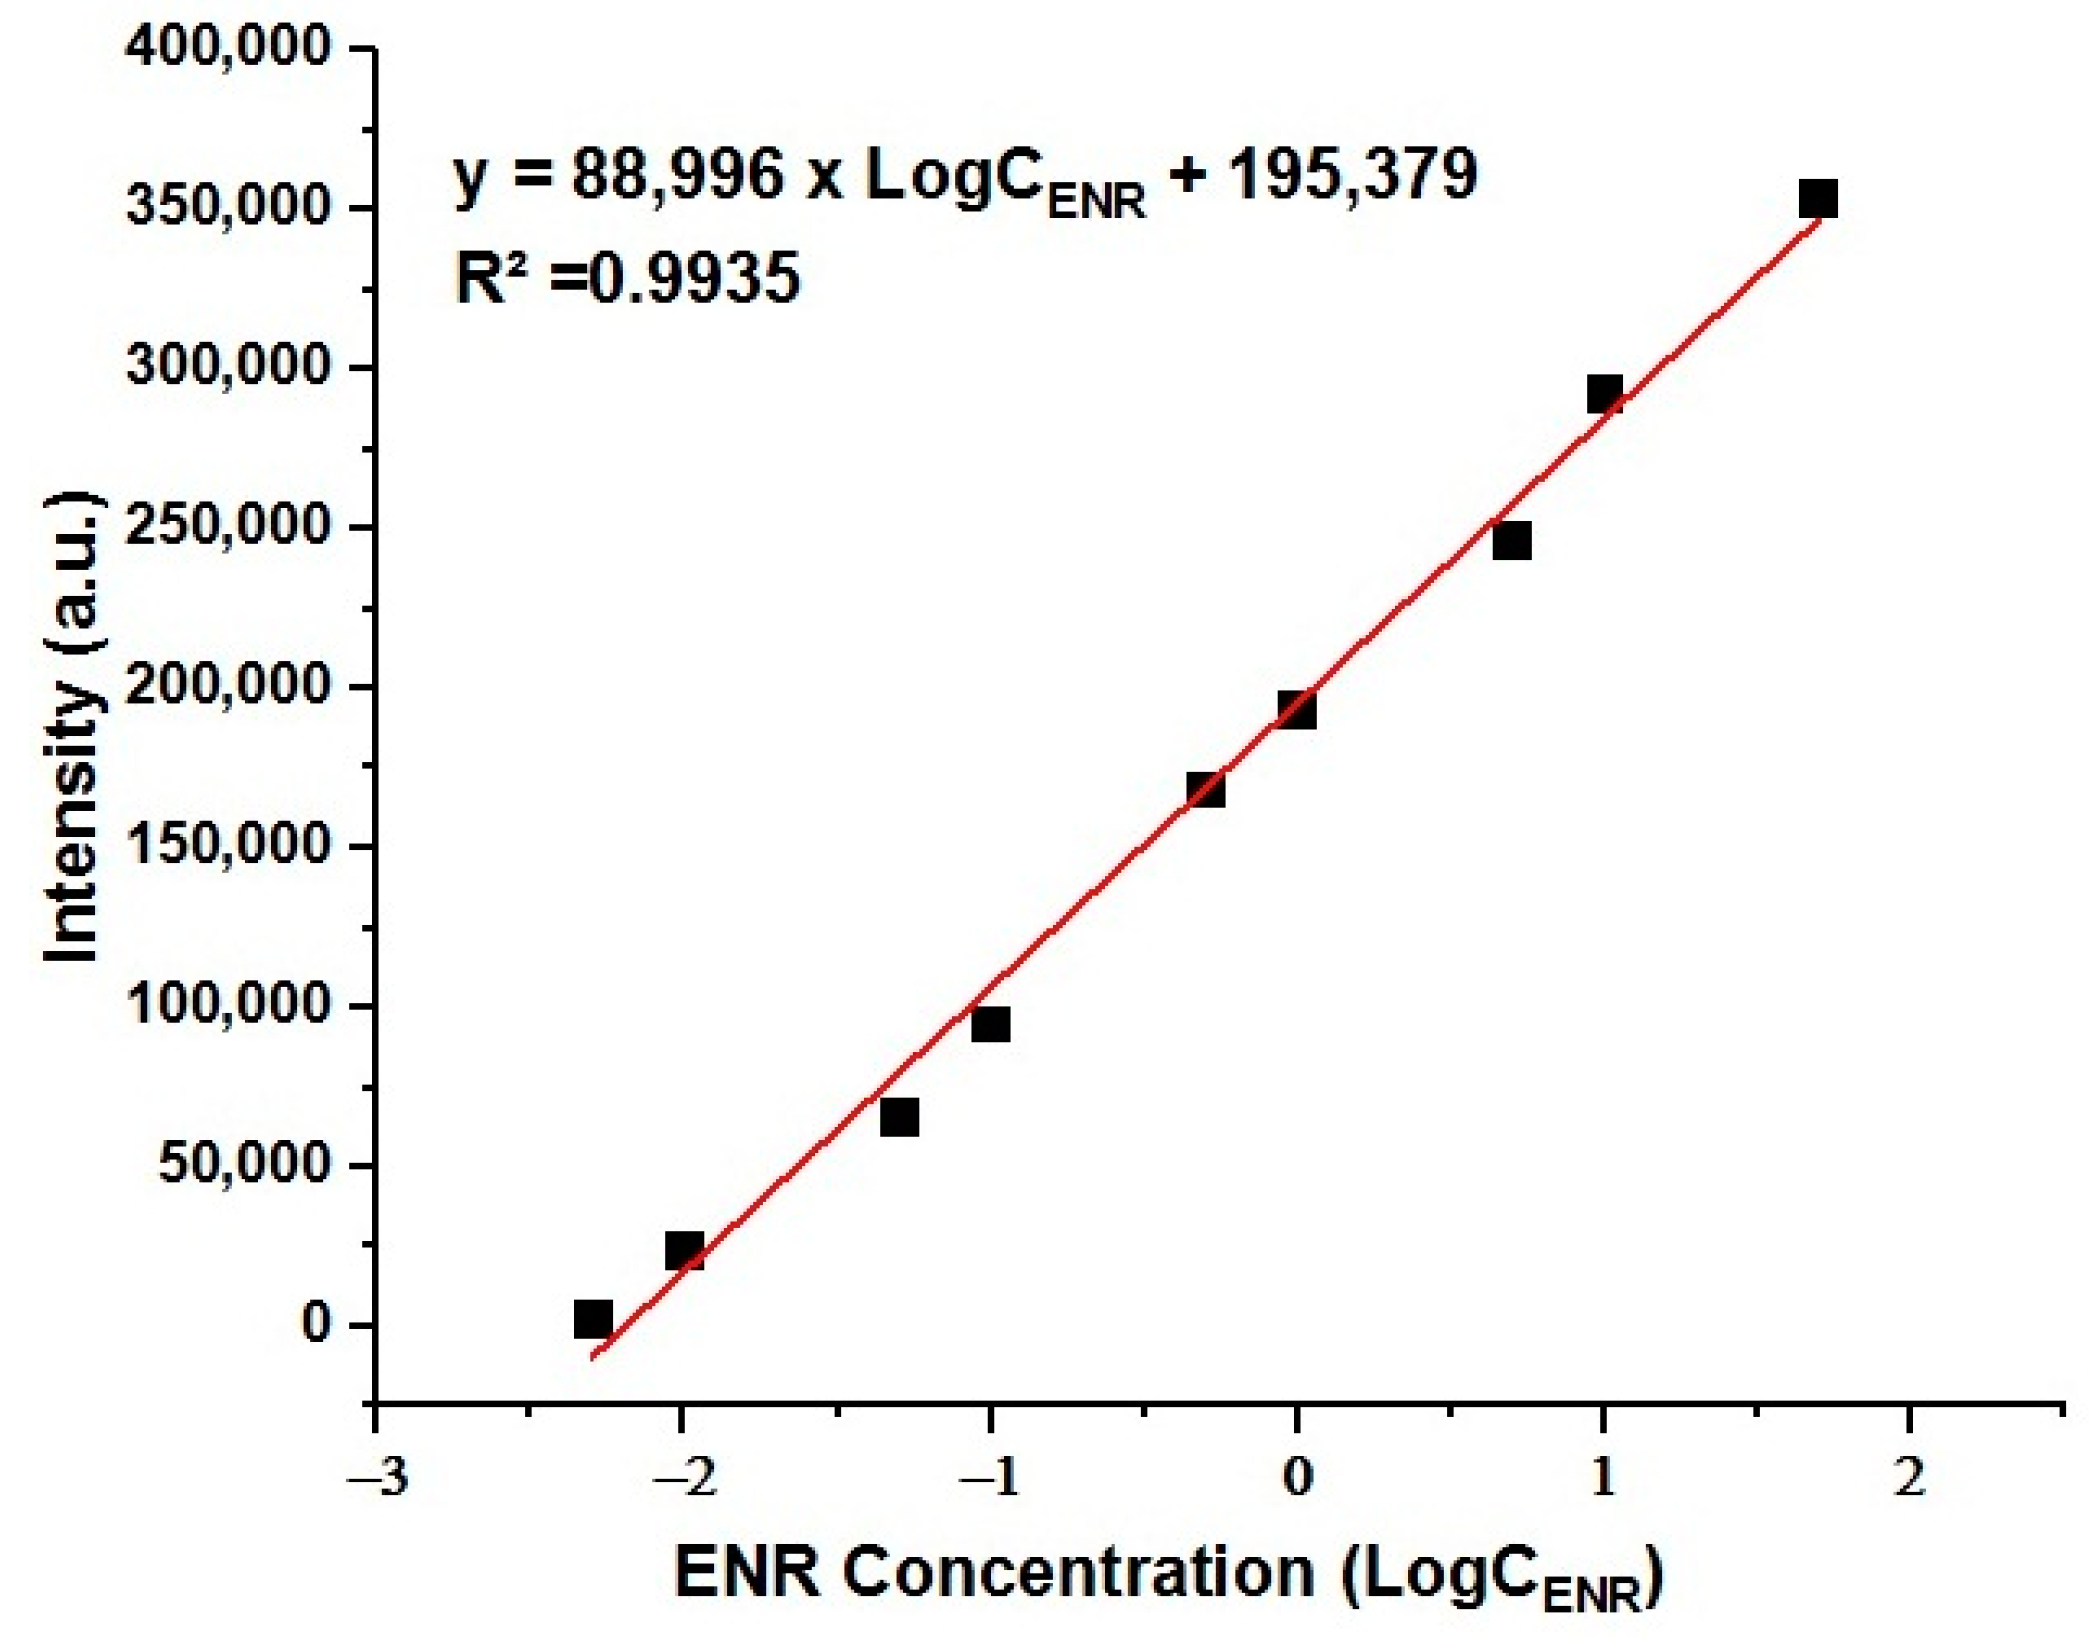
3.7. Recording the SERS Spectrum of ENR

ENR, a fluoroquinolone antibiotic commonly used in livestock and aquaculture, can accumulate in animal-derived food products, posing a significant risk to food safety and human health due to potential antibiotic resistance. To address the urgent need for effective monitoring methods, we tested our developed AgTNPls@Al-foil SERS substrate’s sensitivity towards ENR, specifically targeting concentrations relevant to food safety regulations. The SERS spectra of ENR at concentrations ranging from 50 mg/L to 0.005 mg/L (50–0.005 ppm) were recorded using AgTNPls@Al-foil substrates are presented in Figure 9. The main peaks of ENR, located at 752, 1390, 1476 and 1624 cm−1, can be assigned to the methylene rocking mode, O-C-O symmetric stretching vibration, benzene ring vibration and C=O stretching vibration, respectively [36,37,38,39,40,41], and remain clearly visible down to a concentration of 0.005 mg/L (ppm). The assignment of observed bands to various vibration modes of ENR is detailed in Table 1.
Such high sensitivity is particularly significant for detecting ENR residues in complex food matrices such as meat, fish, and milk, where residue levels must comply with strict regulatory thresholds (typically in the range of 100–300 µg/kg). The AgTNPls@Al-foil SERS substrate enables rapid, label-free screening of these matrices without the need for complex sample preparation, offering a viable alternative to conventional chromatographic techniques.
The calibration curve for the 1390 cm−1 of ENR (Figure 10) shows a strong linear relationship with ENR concentration in the range of 0.005–50 mg/L, with the regression equation of y = 88,996 × Log CENR + 195,379 (R2 = 0.9935). The 1390 cm−1 peak was chosen due to its prominence and consistency across varying concentrations of ENR. This peak exhibits high intensity and minimal interference, making it a reliable marker for quantitative analysis. The LOD value for ENR was 0.39 µg/L (ppb) (~1.1 × 10⁻⁹ mol/L), estimated using a signal-to-noise ratio of 3 (S/N = 3), demonstrating the excellent sensitivity of the AgTNPls@Al-foil substrate.

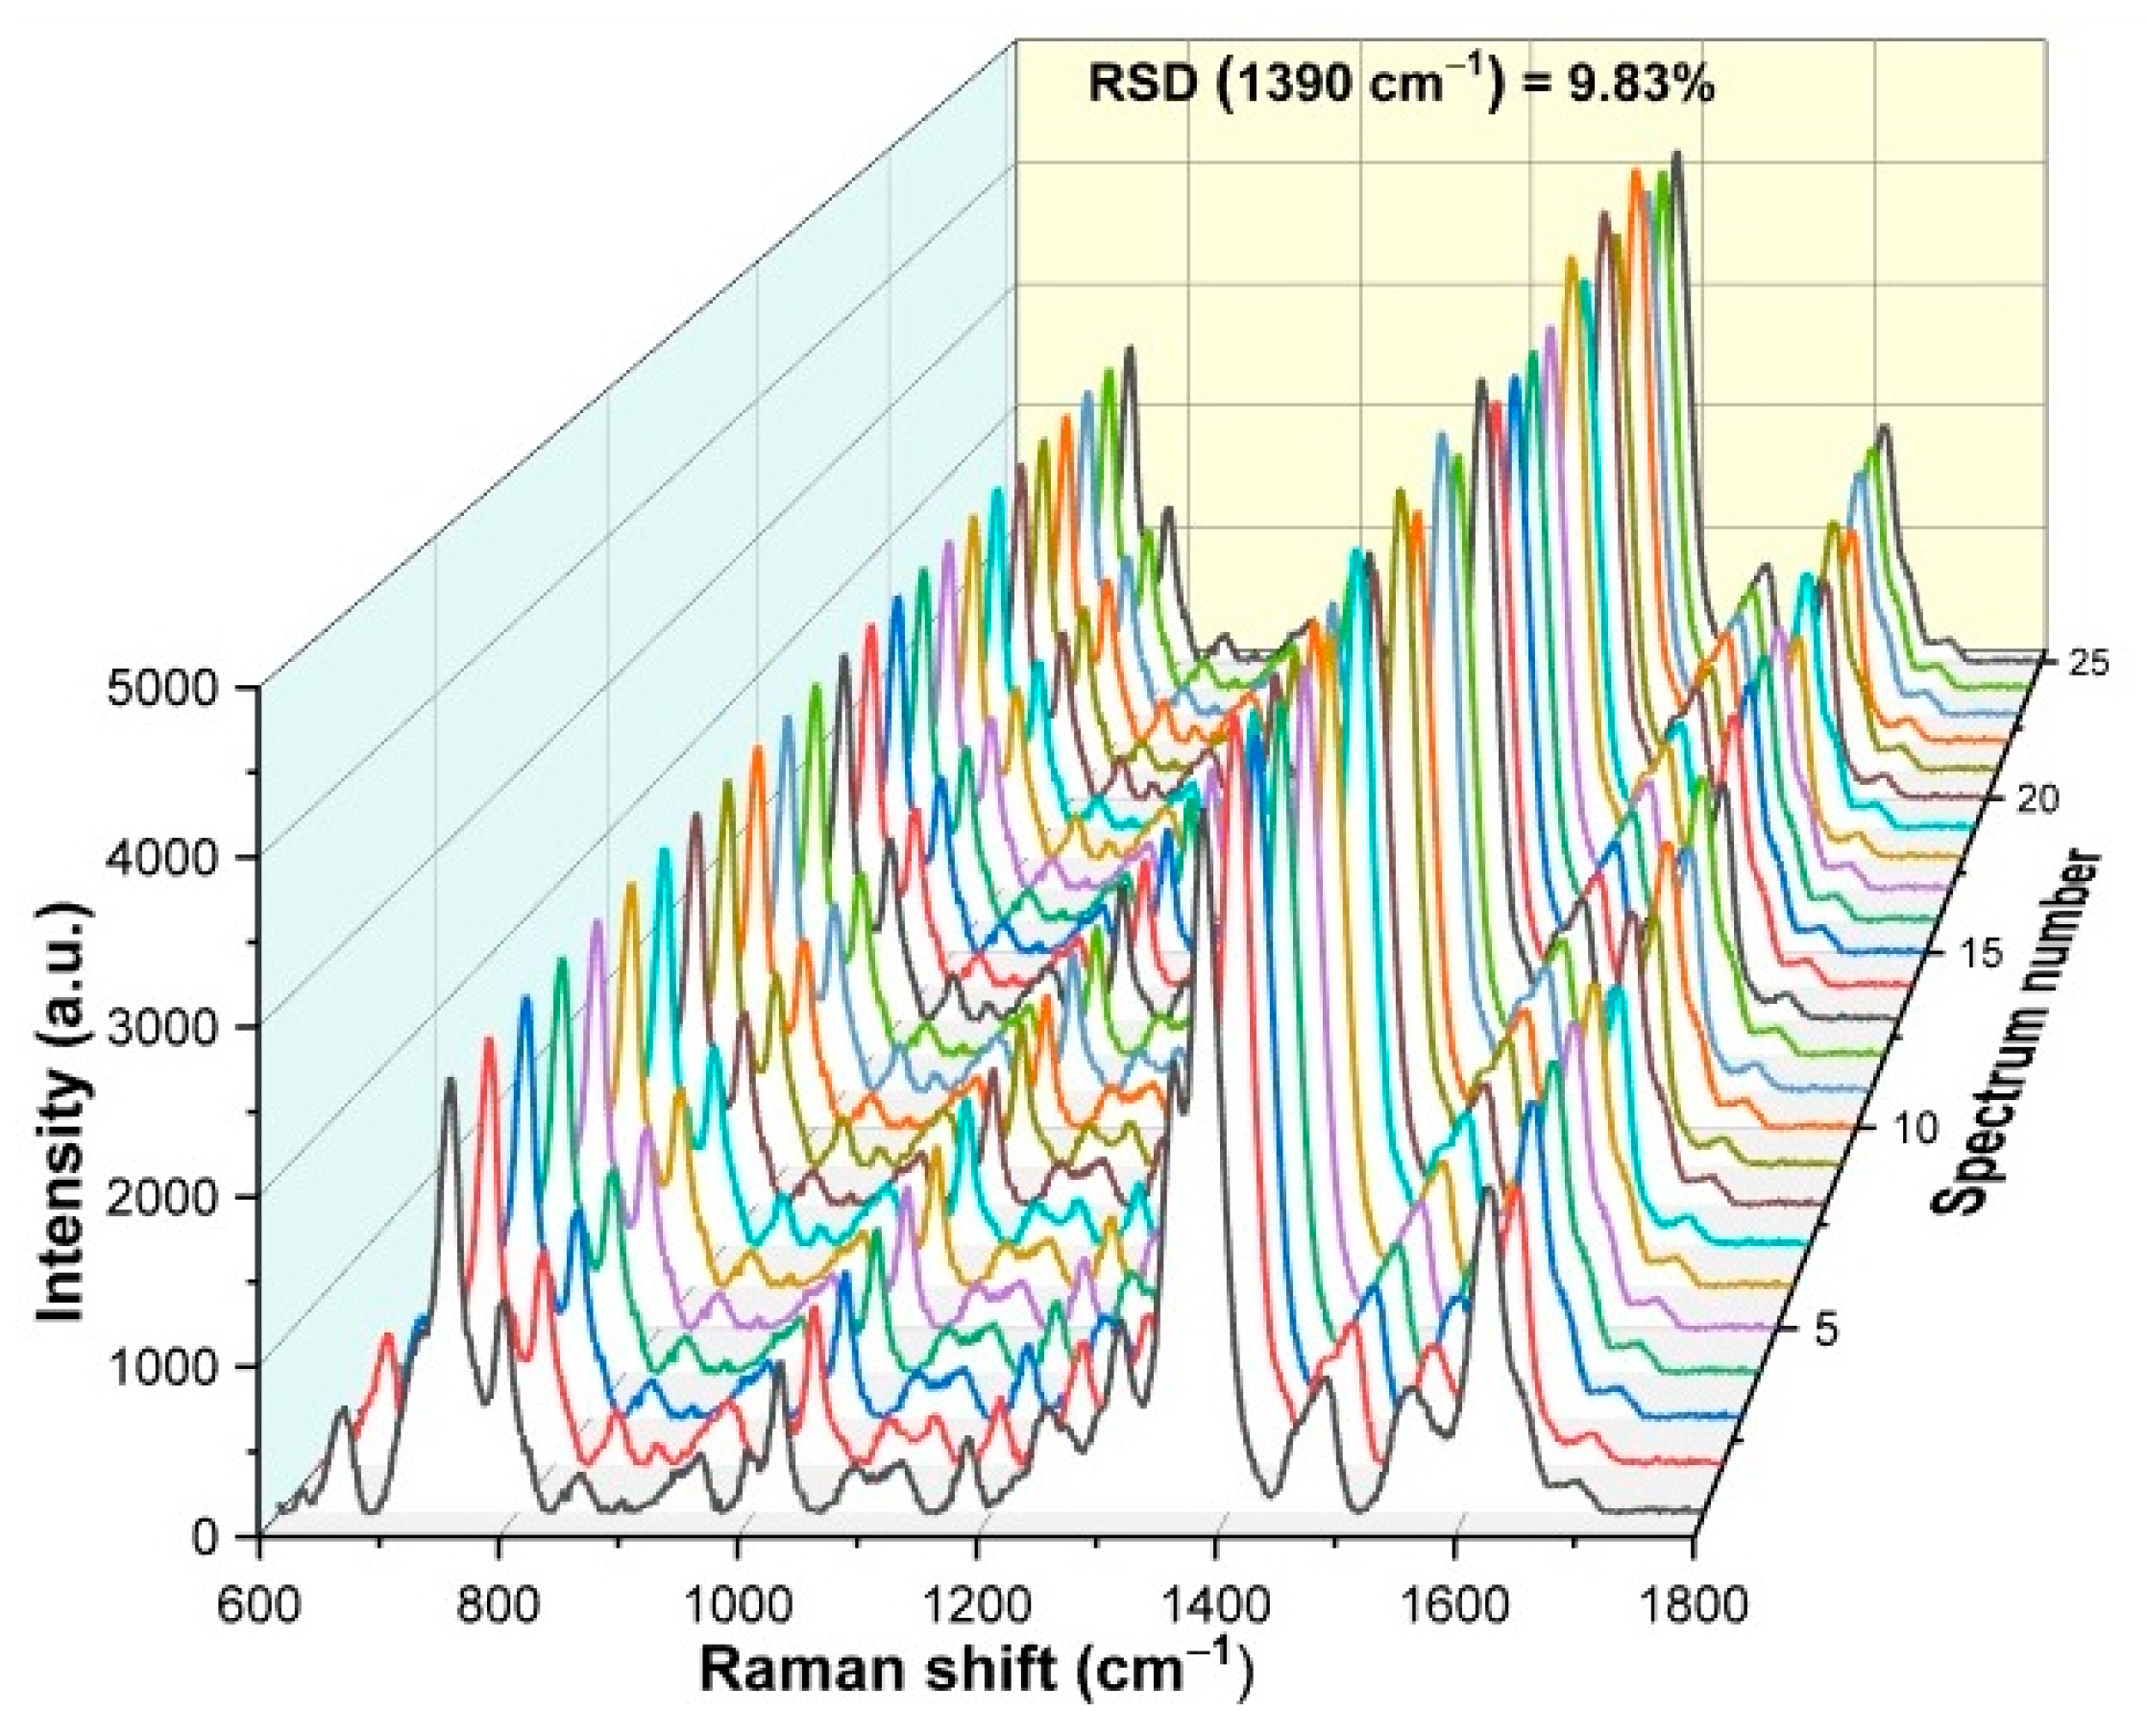
3.8. Uniformity of the SERS Substrate

The uniformity of the AgTNPls@Al-foil SERS substrate was evaluated by recording the SERS spectra at 25 random points on the same substrate of 0.1 mg/L ENR. The relative standard deviation (RSD) of the 1390 cm−1 peak intensity was calculated to be 9.83%, shown in Figure 11, indicating excellent uniformity and reproducibility, which is well within the acceptable range (RSD < 20%) for high-quality SERS substrates.

4. Conclusions

In conclusion, we successfully synthesized a colloid of silver triangular nanoplates (AgTNPls) with an edge length of approximately 52 nm using a straightforward process involving only four common chemicals—silver nitrate, trisodium citrate, sodium borohydride and hydrogen peroxide—at room temperature. By optimizing the sequence of chemical addition, specifically adding hydrogen peroxide after sodium borohydride, we achieved a colloid containing predominantly uniform AgTNPls. The sharp corners of the AgTNPls make them highly effective as SERS substrates, especially when combined with an aluminum foil, which naturally forms a thin layer of aluminum oxide on its surface. This approach enabled the fabrication of an AgTNPls@Al-foil SERS substrate with an enhancement factor of 3.2 × 10⁹. The substrate demonstrated excellent performance in the SERS detection of enrofloxacin (ENR), a commonly used antibiotic in livestock and aquaculture, achieving detection at concentrations as low as 5 µg/L, with a limit of detection of 0.39 µg/L (0.39 ppb). These results highlight the potential application of the developed SERS platform for the detection of antibiotic residues in food matrices, offering a valuable tool for ensuring food safety and supporting regulatory monitoring efforts.

Author Contributions

C.T.A.: investigation, methodology, formal analysis. D.T.C.: conceptualization, methodology, writing—review and editing, supervision, project administration. L.T.-Q.N.: writing—original draft, investigation, data curation, formal analysis. All authors have read and agreed to the published version of the manuscript.

Funding

This work was supported financially by the Institute of Materials Science, Vietnam Academy of Science and Technology (VAST), under project CSCL04.02/23-24.

Data Availability Statement

The data that support the findings of this study are available in this article.

Conflicts of Interest

The authors declare no conflicts of interest.

References

  1. Sur, U.K. Surface-enhanced Raman scattering (SERS) spectroscopy: A versatile spectroscopic and analytical technique used in nanoscience and nanotechnology. Adv. Nano Res. 2013, 1, 111–124. [Google Scholar] [CrossRef]
  2. Fleischmann, M.; Hendra, P.J.; McQuillan, A.J. Raman Spectra of Pyridine Adsorbed at a Silver Electrode. Chem. Phys. Lett. 1974, 26, 163–166. [Google Scholar] [CrossRef]
  3. Mock, J.J.; Barbic, M.; Smith, D.R.; Schultz, D.A.; Schultz, S. Shape effects in plasmon resonance of individual colloidal silver nanoparticles. J. Chem. Phys. 2002, 116, 6755–6759. [Google Scholar] [CrossRef]
  4. Cao, D.T.; Ngan, L.T.Q.; Anh, C.T.; Minh, K.N. Fabrication of silver nanostructures in the form of particles, dendrites and flowers on silicon for use in SERS substrates. Commun. Phys. 2022, 32, 201–212. [Google Scholar]
  5. Schwartzberg, A.M.; Grant, C.D.; Wolcott, A.; Talley, C.E.; Huser, T.R.; Bogomolni, R.; Zhang, J.Z. Unique gold nanoparticle aggregates as a highly active surface-enhanced Raman scattering substrate. J. Phys. Chem. B 2004, 108, 19191–19197. [Google Scholar] [CrossRef]
  6. Jiang, J.; Shen, Q.; Xue, P.; Qi, H.; Wu, Y.; Teng, Y.; Zhang, Y.; Liu, Y.; Zhao, X.; Liu, X. A highly sensitive and stable SERS sensor for malachite green detection based on Ag nanoparticles in situ generated on 3D MoS2 nanoflowers. Chem. Sel. 2020, 5, 354–359. [Google Scholar] [CrossRef]
  7. Zavaleta, C.L.; Smith, B.R.; Walton, I.; Doering, W.; Davis, G.; Shojaei, B.; Natan, M.J.; Gambhir, S.S. Multiplexed imaging of surface enhanced Raman scattering nanotags in living mice using noninvasive Raman spectroscopy. Proc. Natl. Acad. Sci. USA 2009, 106, 13511–13516. [Google Scholar] [CrossRef]
  8. Furletov, A.A.; Apyari, V.V.; Zaytsev, V.D.; Sarkisyan, A.O.; Dmitrienko, S.G. Silver triangular nanoplates: Synthesis and application as an analytical reagent in optical molecular spectroscopy. A review. TrAC-Trends Anal. Chem. 2023, 166, 117202. [Google Scholar] [CrossRef]
  9. Cheng, D.; He, M.; Ran, J.; Cai, G.; Wu, J.; Wang, X. Depositing a flexible substrate of triangular silver nanoplates onto cotton fabrics for sensitive SERS detection. Sens. Actuators B Chem. 2018, 270, 508–517. [Google Scholar] [CrossRef]
  10. Xu, R.; Yan, L. Preparation and SERS Study of Triangular Silver Nanoplates. IOP Conf. Ser. Mater. Sci. Eng. 2019, 678, 012007. [Google Scholar] [CrossRef]
  11. Zannotti, M.; Rossi, A.; Giovannetti, R. SERS activity of silver nanosphere, triangular nanoplates, hexagonal nanoplates and quasi-spherical nanoparticles: Effect of shape and morphology. Coatings 2020, 10, 288. [Google Scholar] [CrossRef]
  12. Weng, G.; Feng, Y.; Zhao, J.; Li, J.; Zhu, J.; Zhao, J. Size dependent SERS activity of Ag triangular nanoplates on different substrates: Glass vs. paper. Appl. Sur. Sci. 2019, 478, 275–283. [Google Scholar] [CrossRef]
  13. Kumar, G.; Soni, R.K. Trace-Level Detection of Explosive Molecules with Triangular Silver Nanoplates-Based SERS Substrates. Plasmonics 2022, 17, 559–573. [Google Scholar] [CrossRef]
  14. Fan, R.; Yang, Y.; Xue, J.; Zhang, F.; Sun, J.; Xu, H.; Jiang, T. Synthesis of Photothermal Stable Triangular Silver Nanoplates for SERS Application and Photokilling of Bacteria. Chem. Nano Mat. 2020, 6, 148–153. [Google Scholar]
  15. Xue, C.; Métraux, G.S.; Millstone, J.E.; Mirkin, C.A. Mechanistic study of photomediated triangular silver nanoprism growth. J. Am. Chem. Soc. 2008, 130, 8337–8344. [Google Scholar] [CrossRef] [PubMed]
  16. Dong, X.; Ji, X.; Jing, J.; Li, M.; Li, J.; Yang, W. Synthesis of Triangular Silver Nanoprisms by Stepwise Reduction of Sodium Borohydride and Trisodium Citrate. J. Phys. Chem. C. 2010, 114, 2070–2074. [Google Scholar] [CrossRef]
  17. Metraux, G.S.; Mirkin, C.A. Rapid thermal synthesis of silver nanoprisms with chemically tailorable thickness. Adv. Mater. 2005, 17, 412–415. [Google Scholar] [CrossRef]
  18. Torres, V.; Popa, M.; Crespo, D.; Moreno, J.M.C. Silver nanoprism coatings on optical glass substrates. Microelectron. Eng. 2007, 84, 1665–1668. [Google Scholar] [CrossRef]
  19. Zhang, Q.; Li, N.; Goebl, J.; Lu, Z.; Yin, Y. A systematic study of the synthesis of silver nanoplates: Is citrate a “magic” reagent? J. Am. Chem. Soc. 2011, 133, 18931–18939. [Google Scholar] [CrossRef]
  20. Pham, V.D.; Chu, H.H.; Le, T.B.; Kasbohm, J. Chemical synthesis and antibacterial activity of novel-shaped silver nanoparticles. Int. Nano Lett. 2012, 2, 9. [Google Scholar]
  21. Bakar, N.A.; Shapter, J.G.; Salleh, M.M.; Umar, A.A. Self-Assembly of High Density of Triangular Silver Nanoplate Films Promoted by 3-Aminopropyltrimethoxysilane. Appl. Sci. 2015, 5, 209–221. [Google Scholar] [CrossRef]
  22. Velgosova, O.; Macák, L.; Lisnichuk, M.; Vojtko, M. Synthesis and Analysis of Polymorphic Silver Nanoparticles and Their Incorporation into the Polymer Matrix. Polymers 2022, 14, 2666. [Google Scholar] [CrossRef] [PubMed]
  23. Li, N.; Zhang, Q.; Quinlivan, S.; Goebl, J.; Gan, Y.; Yin, Y. H2O2-Aided Seed-Mediated Synthesis of Silver Nanoplates with Improved Yield and Efficiency. Chem. Phys. Chem. 2012, 13, 2526–2530. [Google Scholar] [CrossRef] [PubMed]
  24. Parnklang, T.; Lertvachirapaiboon, C.; Pienpinijtham, P.; Wongravee, K.; Thammacharoen, C.; Ekgasit, S. H2O2-triggered shape transformation of silver nanospheres to nanoprisms with controllable longitudinal LSPR wavelengths. RSC Adv. 2013, 3, 12886–12894. [Google Scholar] [CrossRef]
  25. Parnklang, T.; Lamlua, B.; Gatemala, H.; Thammacharoen, C.; Kuimalee, S.; Lohwongwatana, B.; Ekgasit, S. Shape transformation of silver nanospheres to silver nanoplates induced by redox reaction of hydrogen peroxide. Mater. Chem. Phys. 2015, 153, 127–134. [Google Scholar] [CrossRef]
  26. Musino, D.; Rivard, C.; Novales, B.; Landrot, G.; Capron, I. Tuning of Ag Nanoparticle Properties in Cellulose Nanocrystals/Ag Nanoparticle Hybrid Suspensions by H2O2 Redox Post-Treatment: The Role of the H2O2/AgNP Ratio. Nanomaterials 2020, 10, 1559. [Google Scholar] [CrossRef]
  27. Hoppmann, E.P.; Yu, W.W.; White, I.M. Inkjet-Printed Fluidic Paper Devices for Chemical and Biological Analytics Using Surface Enhanced Raman spectroscopy. IEEE J. Sel. Top. Quantum Electron. 2014, 20, 195–204. [Google Scholar]
  28. Pham, T.T.H.; Dien, N.D.; Vu, X.H.; Tran, T.T.; Ca, N.X.; Nguyen, V.T.; Tan, P.M.; Van, H.T.; Phan, V.D. Synthesis and In-Depth Study of the Mechanism of Silver Nanoplate and Nanodecahedra Growth by LED Irradiation for SERS Application. J. Electron. Mater. 2020, 49, 5009–5027. [Google Scholar] [CrossRef]
  29. Lai, C.-H.; Wang, G.-A.; Ling, T.-K.; Wang, T.-J.; Chiu, P.-K.; Chou Chau, Y.-F.; Huang, C.-C.; Chiang, H.-P. Near infrared surface-enhanced Raman scattering based on starshaped gold/silver nanoparticles and hyperbolic metamaterial. Sci. Rep. 2017, 7, 5446. [Google Scholar] [CrossRef]
  30. Thu, V.T.; Cuong, N.M.; Cao, D.T.; Hung, L.T.; Ngan, L.T.-Q. Trace detection of ciprofloxacin antibiotic using surface-enhanced Raman scattering coupled with silver nanostars. Optik 2022, 260, 169043. [Google Scholar] [CrossRef]
  31. Martínez-Torres, P.G.; Martínez-García, M.M.; Cardoso-Ávila, P.E.; Pichardo-Molina, J.L. Facile Nanostructured Substrate Preparation Using Gold Nanocuboids for SERS. Nanomater. Nanotechnol. 2015, 5, 12. [Google Scholar] [CrossRef]
  32. Liu, X.; Wu, D.; Chang, Q.; Zhou, J.; Zhang, Y.; Wang, Z. Grooved Nanoplate Assembly for Rapidly Surface Enhanced Raman Scattering Detecting. Nanoscale 2017, 9, 15390–15396. [Google Scholar] [CrossRef] [PubMed]
  33. Gudun, K.; Elemessova, Z.; Khamkhash, L.; Ralchenko, E.; Bukasov, R. Commercial Gold Nanoparticles on Untreated Aluminum Foil: Versatile, Sensitive, and Cost-Effective SERS Substrate. J. Nanomater. 2017, 2017, 9182025. [Google Scholar] [CrossRef]
  34. Sergiienko, S.; Moor, K.; Gudun, K.; Yelemessova, Z.; Bukasov, R. Nanoparticle–nanoparticle vs. nanoparticle–substrate hot spot contributions to the SERS signal: Studying Raman labelled monomers, dimers and trimers. Phys. Chem. Chem. Phys. 2017, 19, 4478–4487. [Google Scholar] [CrossRef]
  35. Mukanova, Z.; Gudun, K.; Elemessova, Z.; Khamkhash, L.; Ralchenko, E.; Bukasov, R. Detection of Paracetamol in Water and Urea in Artificial Urine with Gold Nanoparticle@Al Foil Cost-efficient SERS Substrate. Anal. Sci. 2018, 34, 183–187. [Google Scholar] [CrossRef] [PubMed]
  36. Ha, M.S.; Chung, M.S.; Bae, D.H. Simple Detection of Residual Enrofloxacin in Meat Products Using Microparticles and Biochips. Food Addit. Contam.-Part A Chem. Anal. Control Expo. Risk Assess. 2016, 33, 817–823. [Google Scholar] [CrossRef]
  37. Aymard, C.; Kanso, H.; Serrano, M.J.; Pagán, R.; Noguer, T.; Istamboulie, G. Development of a New Dual Electrochemical Immunosensor for a Rapid and Sensitive Detection of Enrofloxacin in Meat Samples. Food Chem. 2022, 370, 131016. [Google Scholar] [CrossRef]
  38. Aslam, B.; Kousar, N.; Javed, I.; Raza, A.; Ali, A.; Khaliq, T.; Muhammad, F.; Khan, J.A. Determination of Enrofloxacin Residues in Commercial Broilers Using High Performance Liquid Chromatography. Int. J. Food Prop. 2016, 19, 2463–2470. [Google Scholar] [CrossRef]
  39. Fernandez-Torres, R.; Lopez, M.A.B.; Consentino, M.O.; Mochon, M.C. Simultaneous determination of selected veterinary antibiotics and their main metabolites in fish and mussel samples by high-performance liquid chromatography with diode array-fluorescence (HPLC-DAD-FLD) Detection. , Anal. Lett. 2011, 44, 2357–2372. [Google Scholar] [CrossRef]
  40. Xu, H.; Chen, L.; Sun, L.; Sun, X.; Du, X.; Wang, J.; Wang, T.; Zeng, Q.; Wang, H.; Xu, Y.; et al. Microwave-Assisted Extraction and in Situ Clean-up for the Determination of Fluoroquinolone Antibiotics in Chicken Breast Muscle by LC-MS/MS. J. Sep. Sci. 2011, 34, 142–149. [Google Scholar] [CrossRef]
  41. Mou, S.A.; Islam, R.; Shoeb, M.; Nahar, N. Determination of chloramphenicol in meat samples using liquid chromatography–tandem mass spectrometry. Food Sci. Nutr. 2021, 9, 5670–5675. [Google Scholar]
  42. Tang, Y.; Chen, X.; Lv, Y.; Wu, Z.; Chen, F.; Chen, Z. Excellent Surface Enhanced Raman Scattering of SiO2 Fiber Membrane Embedded with Ag Nanoparticles. J. Inorg. Organomet. Polym. Mater. 2018, 28, 251–257. [Google Scholar] [CrossRef]
  43. Teng, Y.; Wang, Z.; Ren, Z.; Qin, Y.; Pan, Z.; Shao, K.; She, Y.; Huang, W. Interface-Induced Ag Monolayer Film for SurfaceEnhanced Raman Scattering Detection of Water-Insoluble Enrofloxacin. Plasmonics 2021, 16, 349–358. [Google Scholar] [CrossRef]
  44. Chen, J.; Huang, M.; Kong, L. Flexible Ag/Nanocellulose Fibers SERS Substrate and Its Applications for in-Situ Hazardous Residues Detection on Food. Appl. Surf. Sci. 2020, 533, 147454. [Google Scholar] [CrossRef]
  45. Fu, X.; Wang, Z.; Li, J.; Ma, S.; Fu, G.; Jin, W.; Bi, W.; Dong, Y. Microcavity Fiber SERS Probe Coated With Ag Nanoparticles For Detecting Antibiotic in Milk. IEEE Photonics J. 2021, 13, 6800513. [Google Scholar] [CrossRef]
  46. Neng, J.; Wang, Y.; Zhang, Y.; Chen, P.; Yang, K. MIPs–SERS Sensor Based on Ag NPs Film for Selective Detection of Enrofloxacin in Food. Biosensors 2023, 13, 330. [Google Scholar] [CrossRef]
  47. Zhou, Y.; Wang, H.; Zhao, Z.; Luan, D.; Bian, X.; Lai, K.; Yan, J. Colloidal SERS measurement of enrofloxacin with petaloid nanostructure clusters formed by terminal deoxynucleotidyl transferase catalyzed cytosine-constituted ssDNA. Food Chem. 2023, 429, 136954. [Google Scholar] [CrossRef] [PubMed]
  48. Velgosova, O.; Macák, L.; Cižmárová, E.; Mára, V. Influence of Reagents on the Synthesis Process and Shape of Silver Nanoparticles. Materials 2022, 15, 6829. [Google Scholar] [CrossRef]
  49. Lee, P.C.; Meisel, D. Adsorption and surface-enhanced Raman of dyes on silver and gold sols. J. Phys. Chem. 1982, 86, 3391–3395. [Google Scholar] [CrossRef]
  50. Huang, T.; Xu, X.-H.N. Synthesis and Characterization of Tunable Rainbow Colored Colloidal Silver Nanoparticles Using Single-Nanoparticle Plasmonic Microscopy and Spectroscopy. Mater. Chem. 2010, 20, 9867–9876. [Google Scholar] [CrossRef]
  51. Zannotti, M.; Vicomandi, V.; Rossi, A.; Minicucci, M.; Ferraro, S.; Petetta, L.; Giovannetti, R. Tuning of hydrogen peroxide etching during the synthesis of silver nanoparticles. An application of triangular nanoplates as plasmon sensors for Hg2+ in aqueous solution. J. Mol. Liq. 2020, 309, 113238. [Google Scholar] [CrossRef]
  52. Xu, X.; Wang, Y.; Wang, H.; Su, H.; Mao, X.; Jiang, L.; Liu, M.; Sun, D.; Hou, S. Synthesis of triangular silver nanoprisms and studies on the interactions with human serum albumin. J. Mol. Liq. 2016, 220, 14–20. [Google Scholar] [CrossRef]
  53. Wijaya, Y.N.; Kim, J.; Choi, W.M.; Park, S.H.; Kim, M.H. A systematic study of triangular silver nanoplates: One-pot green synthesis, chemical stability, and sensing application. Nanoscale 2017, 9, 11705–11712. [Google Scholar] [CrossRef] [PubMed]
  54. Zhang, Y.; Teng, Y.; Qin, Y.; Ren, Z.; Wang, Z. Determination of Ciprofloxacin in Fish by Surface-Enhanced Raman Scattering Using a Liquid-Liquid Self-Assembled Gold Nanofilm. Anal. Lett. 2020, 53, 660–670. [Google Scholar] [CrossRef]
  55. Dies, H.; Siampani, M.; Escobedo, C.; Docoslis, A. Direct Detection of Toxic Contaminants in Minimally Processed Food Products Using Dendritic Surface-Enhanced Raman Scattering Substrates. Sensors 2018, 18, 2726. [Google Scholar] [CrossRef]
Figure 1. The colors of the colloid solution during the AgTNPls synthesis process, in which the pale yellow color of the left image (a) corresponds to the colloid after the complete addition of NaBH4, and the dark blue color of the right image (b) corresponds to the colloid after the addition of H2O2.
Colloids 09 00031 g001
Figure 2. A schematic diagram of the preparation process and SERS application of the AgTNPls.
Colloids 09 00031 g002
Figure 3. UV-Vis spectra of the silver colloid obtained after the complete addition of NaBH4 (black curve), and after the complete addition of H2O2 (red curve).
Colloids 09 00031 g003
Figure 4. SEM images of the silver colloid precipitate: after the addition of NaBH4 (for seeding) following the procedure of this study (with NaBH4 added before H2O2) (a); after the addition of H2O2 according to the procedure of this study (with NaBH4 added before H2O2) (b); and after the addition of both H2O2 and NaBH4 following the conventional Mirkin procedure (with H2O2 added before NaBH4) (c).
Colloids 09 00031 g004
Figure 5. DLS spectra of the colloidal solutions: the pale yellow colloid obtained after the complete addition of NaBH4 to the reaction solution (a), and the blue colloid obtained after completing the full synthesis process of AgTNPls according to this study (with NaBH4 added before H2O2) (b).
Colloids 09 00031 g005
Figure 6. SERS spectrum of 10−5 M R6G recorded using an SERS substrate made by coating AgTNPls (synthesized according to the procedure of this study) onto different solid plates: a microscope glass slide (blue curve), a silicon wafer (red curve) and a commercial Al-foil (black curve).
Colloids 09 00031 g006
Figure 7. SERS spectrum of 10−5 M R6G recorded using an SERS substrate made by coating on a commercial Al-foil with AgNSs obtained after the seed fabrication step (black curve), AgTNPls (and other shaped particles) synthesized by a conventional process in which H2O2 was added before adding NaBH4 (blue curve), and AgTNPls synthesized according to the procedure of this study (red curve).
Colloids 09 00031 g007
Figure 8. SERS spectra of R6G at different concentrations below 10−5 M, recorded using an SERS substrate made by AgTNPls (synthesized according to the procedure of this study) coated on a commercial Al-foil (AgTNPls@Al-foil substrate).
Colloids 09 00031 g008
Figure 9. SERS spectra of ENR at concentrations in the range 50–0.005 mg/L (ppm), recorded using an SERS substrate made by AgTNPls (synthesized according to the procedure of this study) coated on a commercial Al-foil (AgTNPls@Al-foil substrate).
Colloids 09 00031 g009
Figure 10. Relationship between the intensity of the ENR 1390 cm−1 peak and ENR concentration in the range of 0.005–50 mg/L.
Colloids 09 00031 g010
Figure 11. SERS spectra of 0.1 mg/L ENR, recorded from 25 random points on the same AgTNPls@Al-foil substrate.
Colloids 09 00031 g011
Table 1. Characteristic SERS peak assignments of enrofloxacin (ENR) [36,37,38,39,40,41].
Wavenumber (cm−1)Vibrational Mode Description
752CH2 rocking
1390Symmetric O–C–O stretching (carboxylate group)
1476Benzene ring breathing
1624C=O stretching (quinolone ring)
Disclaimer/Publisher’s Note: The statements, opinions and data contained in all publications are solely those of the individual author(s) and contributor(s) and not of MDPI and/or the editor(s). MDPI and/or the editor(s) disclaim responsibility for any injury to people or property resulting from any ideas, methods, instructions or products referred to in the content.

