Article

Structure and Potential Application of Surfactant-Free Microemulsion Consisting of Heptanol, Ethanol and Water

1
Department of Chemistry, Faculty of Science, University of Split, Ruđera Boškovića 33, 21000 Split, Croatia
2
Faculty of Mechanical Engineering, University of Maribor, Smetanova 17, 2000 Maribor, Slovenia
3
Faculty of Chemistry and Chemical Technology, University of Ljubljana, Večna pot 113, 1000 Ljubljana, Slovenia
4
Faculty of Chemistry and Technology, University of Split, Ruđera Boškovića 35, 21000 Split, Croatia
*
Author to whom correspondence should be addressed.
Colloids Interfaces 2024, 8(5), 53; https://doi.org/10.3390/colloids8050053
Submission received: 19 July 2024 / Revised: 6 September 2024 / Accepted: 10 September 2024 / Published: 14 September 2024
(This article belongs to the Special Issue Recent Advances on Emulsions and Applications: 2nd Edition)

Abstract

:
Microemulsions, which are thermodynamically stable and isotropic mixtures of water, oil, and surfactants, attract significant research interest due to their unique physicochemical properties and diverse industrial applications. Traditional surfactant-based microemulsions (SBMEs) stabilize the interface between two typically immiscible liquids, forming various microstructures such as oil-in-water (O/W) droplets, water-in-oil (W/O) droplets, and bicontinuous phases. However, the use of surfactants poses environmental concerns, cost implications, and potential toxicity. Consequently, there is increasing interest in developing surfactant-free microemulsions (SFMEs) that offer similar benefits without the drawbacks associated with surfactants. In this study, we explore the formation and characteristics of a new surfactant-free microemulsion in a ternary system comprising water, ethanol, and heptanol. Advanced techniques are employed to characterize the microstructures and stability of surfactant-free microemulsions. These include electrical conductivity measurements, surface tension analysis, dynamic light scattering (DLS), and Fourier transform infrared spectroscopy (FTIR). These methods have been extensively used in previous research on surfactant-free microemulsions (SFMEs) to reveal the properties and interactions within microemulsion systems. The area of interest is identified using these techniques, where silica nanoparticles are subsequently synthesized and then visualized using transmission electron microscopy (TEM).

1. Introduction

Microemulsions are the thermodynamically stable, isotropic mixtures of water, oil, and surfactants that are of significant interest in research due to their unique physicochemical properties and diverse industrial applications. Traditional or surfactant-based microemulsions (SBMEs) rely on surfactants to stabilize the interface between two typically immiscible liquids, forming various microstructures such as oil-in-water (O/W) droplets, water-in-oil (W/O) droplets, and bicontinuous phases [1,2,3,4]. However, the use of surfactants can create certain problems, including environmental concerns, cost implications, and potential toxicity [5,6]. Consequently, there has been growing interest in developing surfactant-free microemulsions (SFMEs) that offer similar benefits without the drawbacks associated with surfactants.
Some studies reported the creation of surfactant-free microemulsion-like systems for enzyme carriers, illustrating potential for biochemical applications. This research highlighted the possibility of using SFMEs in various fields, particularly where the presence of surfactants could interfere with biological processes. SFME systems show promise across various fields [7,8,9,10,11,12,13,14,15,16,17]. For instance, Drapeau et al. utilized SFMEs to develop effective insect repellent formulations, demonstrating the versatility of these systems [15]. Additionally, a novel green SFME drug carrier composed of eucalyptus oil, n-propanol, and water was created, significantly enhancing the solubility, stability, and oxidation resistance of all-trans retinoic acid (ATRA). This carrier system offers improved solubility of ATRA compared to water and some traditional microemulsions, with spontaneous solubilization driven by interactions between ATRA and eucalyptus oil [18]. Moreover, SFMEs composed of tripropylamine (TPA), ethanol, and water have exhibited a remarkable capacity for solubilizing crude oil, achieving over 80% oil removal in oil sand washing processes. These SFMEs, including both oil-in-water and bicontinuous types, can be reused at least three times with consistently high oil removal efficiency, highlighting their potential for sustainable industrial applications [19]. In another study, curcumin embedded in an SFME system showed significantly enhanced stability and antioxidant activity. The improved light, thermal, and storage stability of curcumin within the SFMEs underscores its practical applicability for delivering curcumin and similar biomolecules in pharmaceutical and nutraceutical formulations [20]. These diverse applications illustrate the broad potential of SFMEs in drug delivery, environmental remediation, and beyond.
The past decade has seen significant advancements in SFME research, from studies that demonstrated the formation of stable surfactant-free microemulsions using ionic liquids to studying of the effect “simple” electrolytes have on the weakly associated surfactant-free microemulsions [21,22,23]. Recent studies further advanced the field by investigating the influence of eutectic solvents on the stability of SFMEs [24,25,26,27]. Especially interesting for our research is the use of SFMEs for the synthesis of various nanoparticles, which offer excellent control over the size and morphology of the nanoparticles [28,29,30,31].
In this study, we explore the formation and characteristics of a new surfactant-free microemulsion in a ternary system comprising water, ethanol, and heptanol. Ethanol, an amphi-solvent, is capable of reducing the interfacial tension between water and heptanol, thereby facilitating the formation of a stable microemulsion [32,33,34]. Besides reducing the interfacial tension, ethanol causes the formation of microemulsions by aiding in the formation of microdomains within microemulsions; it facilitates the formation of nano-sized droplets, resulting in a clear and stable microemulsion [35,36]. Ethanol’s role as a co-solvent is utilized in nanomaterial synthesis and environmental remediation [17]. It has been effectively used in the green synthesis of silver nanoparticles, enabling precise control over their size and morphology [37].
Various advanced techniques are used to characterize the microstructures and stability of surfactant-free microemulsions. In this study, we used electrical conductivity measurements, surface tension, dynamic light scattering (DLS), Fourier transform infrared spectroscopy (FTIR) and transmission electron microscopy. These techniques have been used extensively in previous SFME research to illustrate the properties and interactions in microemulsion systems. Our results aim to improve the understanding of SFME systems and provide insights into their potential applications as environmentally friendly and cost-effective alternatives to conventional surfactant-based microemulsions.

2. Materials and Methods

2.1. Materials

Tetraethyl orthosilicate (TEOS, 99%) and 1-heptanol (98%) were purchased from Sigma-Aldrich (Burlington, MA, USA), ammonium hydroxide (25 wt%) was obtained from Thermo Scientific (Waltham, MA, USA), and ethanol was purchased from Honeywell (Charlotte, NC, USA). All used chemicals were of analytical grade and were used without further purification except 1-heptanol and ethanol, which were filtered through disposable syringe filters with a pore size of 0.20 µm (Chromafil Xtra PTFE). The ultrapure water used in this study was treated with the Elga Purelab flex water purification device.

2.2. Phase Diagram Construction

The phase diagram of water/1-heptanol/ethanol was created using the visual titration method. Different mass fractions of 1-heptanol and ethanol were prepared in vials, then ultrapure water was slowly added while the mixture was stirred on a magnetic stirrer. Water was added until the sample became turbid. The same procedure was repeated three times at the same temperature for each mixture. The visual titration method is a straightforward and commonly used technique for determining the binodal curve in a ternary phase diagram. The post-measurement procedure is also relatively simple, involving the averaging of mass fractions of all components used, followed by graph construction based on these values. No additional steps were taken during the measurement or plot construction. From the averaged mass fractions of ethanol, heptanol and water, a binodal curve was constructed using software OriginPro 8 [20,31].

2.3. Electrical Conductivity Measurements

The conductivity measurements were carried out at 25 ± 0.02 °C with an Orion immersion conductivity cell (model 018001) with two platinum electrodes. The conductivity cell was connected to a Wayne–Kerr precision component analyzer (model 6430A). The resistance (R) of the test solutions was measured at four frequencies f = 500, 800, 1000 and 2000 Hz. The test procedure starts with weighing a mixture of ethanol and heptanol with different mass ratios of ethanol to heptanol (RE/H, mass ratio of ethanol/heptanol) in a glass reaction cell. The reaction cell was covered with a Teflon lid and placed in a Thermo-Haake circulation thermostat. After reaching thermal equilibrium, the resistance was determined at four frequencies. Then, the known weight of water was added to the cell with a syringe and the resistance measurements were repeated. Between these two procedures, each test solution was homogenized by briefly rotating a Teflon magnetic stir bar activated by an immersible stirrer.

2.4. Determination of Surface Tension

A series of samples with an increasing mass fraction of heptanol, while maintaining a constant ratio of ethanol and water, were prepared for measuring surface tension. The measurements were performed using a digital tensiometer (K10T) equipped with a platinum plate (PL21). The measurement process involved pouring the prepared sample into the measuring cell and then thermostating it at 25 °C. To calculate the amount of heptanol in the solution, the density was determined using a density meter (DMA 5000 Density Meter—Anton Paar, Graz, Austria).

2.5. DLS Measurements

A 3D-DLS spectrometer (LS Instruments, Fribourg, Switzerland) equipped with a 35 mW He-Ne laser (λ = 632.8 nm), high-precision beam splitter, focusing entrance and collimating exit lens and two single-mode fiber-optic detectors with avalanche photodiodes (photo detection efficiency > 65%) was used in DLS measurements. Samples in scattering cells were immersed in a large-diameter thermostated bath (25 °C) of index-matching liquid (decalin). The instrument was used in a 3D-cross-correlation scheme. DLS measurements of 30 s each were collected, and at least 15 of them were averaged to obtain the final autocorrelation function [38,39].

2.6. FT-IR Measurements

Samples for FT-IR analysis were prepared by mixing ethanol and heptanol in constant mass ratios, with increasing masses of water added to each sample. FT-IR spectra were recorded using a Bruker Alpha II spectrometer. The liquid samples were carefully injected into a clean measuring cell for analysis. Baseline correction was applied to all spectra using the instrument’s software, and further data analysis was performed using Bruker’s software Opus Version 8.7.

2.7. Synthesis of Solid Silica Nanoparticles (SSNs)

SSNs were prepared with the method used in a research paper by Sun et al. [31]. A series of mixed solutions of water and ethanol with varying mass ratios were prepared. Calculated amounts of heptanol were then added to these systems and stirred at a moderate speed using a magnetic stirrer for 1 h at 25 °C to achieve the desired SFME compositions. Then, a specified volume of tetraethoxysilane (TEOS) was added dropwise to each mixture. After stirring for 1 h at 25 °C, the required volumes of 25 wt% ammonia hydroxide were slowly introduced into the mixtures. The hydrolysis and condensation process was maintained for 24 h at 25 °C. The resulting SSNs were separated using centrifugation and washed with ethanol to remove impurities.

2.8. The Preparation of Nanoparticle Samples for TEM Imaging

Nanoparticle powder was dispersed in ethanol and sonicated for 10–15 min to ensure a homogeneous suspension. A formvar/carbon-coated, 200-mesh copper TEM grid was placed on a clean piece of filter paper using tweezers. A small amount of the nanoparticle suspension was dropped onto the TEM grid and allowed to sit for a few hours to enable the nanoparticles to settle and dry. The samples were observed with a transmission electron microscope (TEM; JEOL JEM 1400 Flash, Tokyo, Japan).

3. Results and Discussion

3.1. Phase Behavior of the Heptanol/Ethanol/Water Ternary System

Figure 1 shows a ternary diagram of the different mass ratios of heptanol, ethanol and water, constructed at 25 ± 0.1 °C. The diagram shows two different areas: a clear one, which represents a single-phase region; and a shaded one, which represents a multi-phase region. The single-phase region accounts for more than 50% of the area and includes water-rich and oil-rich regions, indicating that the addition of the amphiphilic solvent ethanol stabilizes two normally immiscible components. The single-phase region is visually represented by clear, transparent, stable microemulsions, while the multiphase region shows cloudy ternary systems under stirring, which quickly separate into two phases when left to stand. Based on previous studies, SFMEs most likely form in the single-phase region.

3.2. Electrical Conductivity Analysis

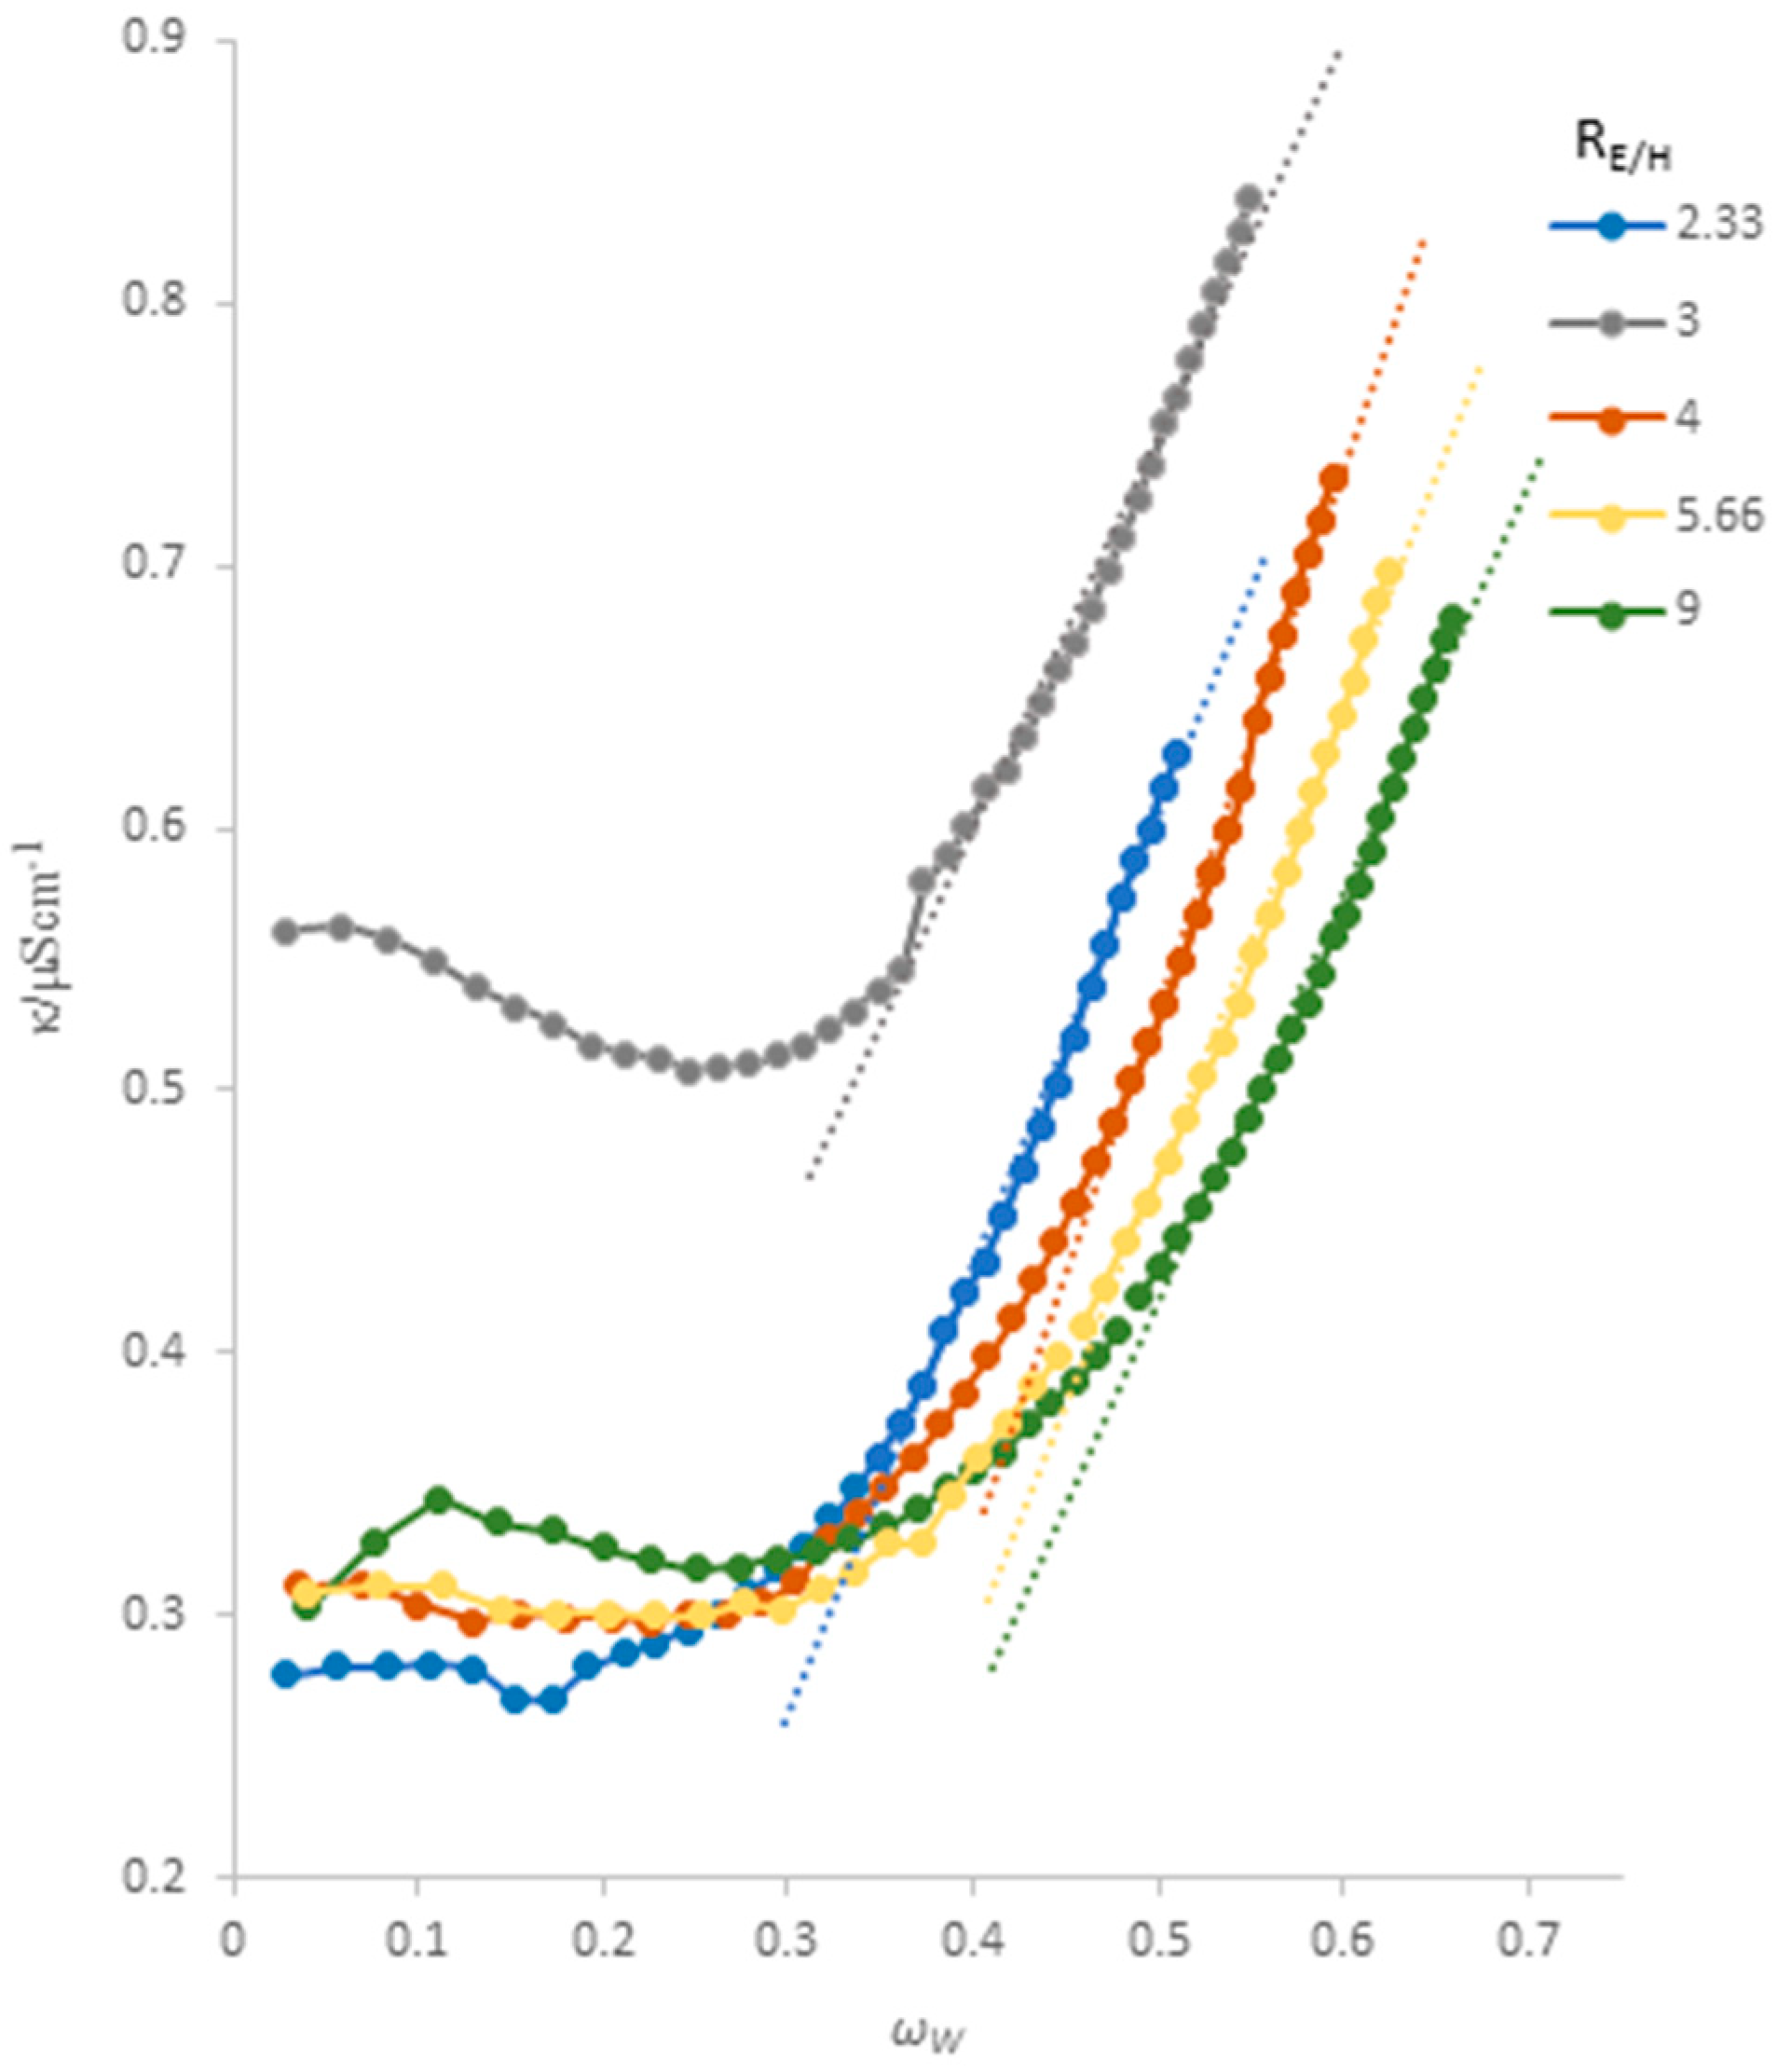
Electrical conductivity (κ) is a structure-dependent property, and its change with an oil or water mass fraction increase can provide information about the structural changes of microemulsions. Polar liquid (usually water) or apolar liquid (oil) can be added through titration to determine the change in κ. For a traditional SBME system in which a conductive water phase is dispersed in a non-conductive oil-continuous phase, Clausse et al. [40] have shown that the change in κ with ωw exhibits a percolation phenomenon, meaning that the κ value increases sharply when ωw passes a critical value called the percolation threshold. This sharp increase in κ can be attributed to connecting and clustering of water droplets. κ is small at water mass fractions lower than the percolation threshold and increases slowly and non-linearly with increasing ωw. This is due to the fact that the water droplets (or clusters) present in the non-conducting oil phase are isolated from each other, and the conductivity mainly results from the electrophoretic movements of the water droplets [10,36,41,42].
Percolative conduction was identified in SFMEs composed of conductive water phases and nonconductive oil phases, such as mixtures like furaldehyde–water–DMF, furaldehyde–water–ethanol, benzene–water–ethanol, and oleic acid–water–n-propanol. The observed percolation threshold (ϕp) in these SFME systems ranged from 0.2 to 0.4, aligning with results reported for SBMEs [10]. In our system, consisting of heptanol, ethanol, and water, we observed a percolation threshold within the range of 0.2 to 0.45.
The grey curve in Figure 2 differs from the others by approximately 2 × 10⁻⁷, which is considered a negligible difference; therefore, further measurements were deemed unnecessary.
Figure 2. Variation in the electrical conductivity (κ) with the water mass fraction (ωw) for the heptanol − water − ethanol microemulsion at different RE/H values.
Colloids 08 00053 g002

3.3. Surface Tension

In the study of ternary systems consisting of heptanol, ethanol, and water, understanding the behavior of critical aggregation concentration (CAC) is vital for insights into the formation of microemulsions and micellar structures. The CAC is a key parameter indicating the concentration at which heptanol molecules start to aggregate, forming micelle-like structures (aggregates). This analysis explores the CAC in relation to the composition of ethanol and water.
In a ternary system (Figure 3) of 55% water and 45% ethanol, the CAC for heptanol is given by ln c = −0.4, translating to a concentration of approximately 0.6703 mol/L. In a system with 50% water and 50% ethanol, ln c remains the same at −0.4. However, in a system with 45% water and 55% ethanol, the CAC shifts to ln c = −0.15, corresponding to a concentration of approximately 0.8607 mol/L. These concentrations are crucial as they mark the points where heptanol molecules transition from being predominantly monomeric to forming micellar aggregates. As the mass ratio of ethanol to water increases (i.e., more ethanol and less water), the CAC for heptanol also increases. This behavior can be explained by considering the role and interactions of ethanol with the other two components.
Ethanol, with its amphiphilic nature, acts as a co-solvent that reduces the interfacial tension between water and heptanol. This reduction in interfacial tension facilitates the solubilization of heptanol, enabling the formation of stable microemulsions. As the ethanol content increases, more ethanol molecules are available to mediate interactions between heptanol and water, thereby requiring a higher concentration of heptanol to reach the CAC. This role of ethanol in stabilizing microemulsions is supported by research indicating that ethanol can reduce the critical point pressure and improve the stability of microemulsions by modifying the interfacial properties and enhancing solubilization [43,44].
The change in slope observed in the conductivity and surface tension measurements reflects the onset of structuring and corresponds to the CAC in these surfactant-free microemulsions. We avoid using the term critical micelle concentration (CMC) as it is traditionally applied to systems containing surfactants. These findings are consistent with results from our previous study [36].

3.4. DLS

DLS measurements were performed following two different paths for the system. As shown in Figure 4, the mass percentage of the ethanol compound is constant along paths AB, B, and C, and the mass percentage of 1-heptanol is constant along paths D, E and F.
First of all, a common trend can be observed across all paths: the correlation becomes more and more pronounced the closer the formulation is to the left side and near the demixing boundary (Figure 5).
A pronounced and well-defined correlation function is a first hint at the presence of micelle-like structures.
If correlation functions are compared between each series, AB and B series presented more pronounced correlation functions with higher lag time in comparison to other series. These data confirm the formation of more stable aggregates near the phase separation border, which is consistent with the findings of Klossek et al. [45] and Zemb et al. [46]
For synthesis purposes, the hydrodynamic radii were measured for points closer to the phase separation border, which corresponded to more stable aggregates, particularly within the AB and B series as seen in Table 1. This is in correspondence with observed correlation functions [30,35,40].
In comparison, other studies using DLS on SFME systems report similar hydrodynamic radii. For example, systems with dimethyl sulfoxide (DMSO), n-butanol, and water show radii under 20 nm, while systems with water, ethanol, and octanol have radii between 1 and 10 nm [8,36]. Drapeu et al. measured radii around 10 nm in surfactant-free microemulsions, and Marcus et al. reported droplet sizes ranging from 1.50 to 2.64 nm in various fragrance tinctures [15,35]. Hou et al.’s review highlights that droplet radii in SFMEs typically range from 2 to 80 nm [10].

3.5. FT-IR Spectrum

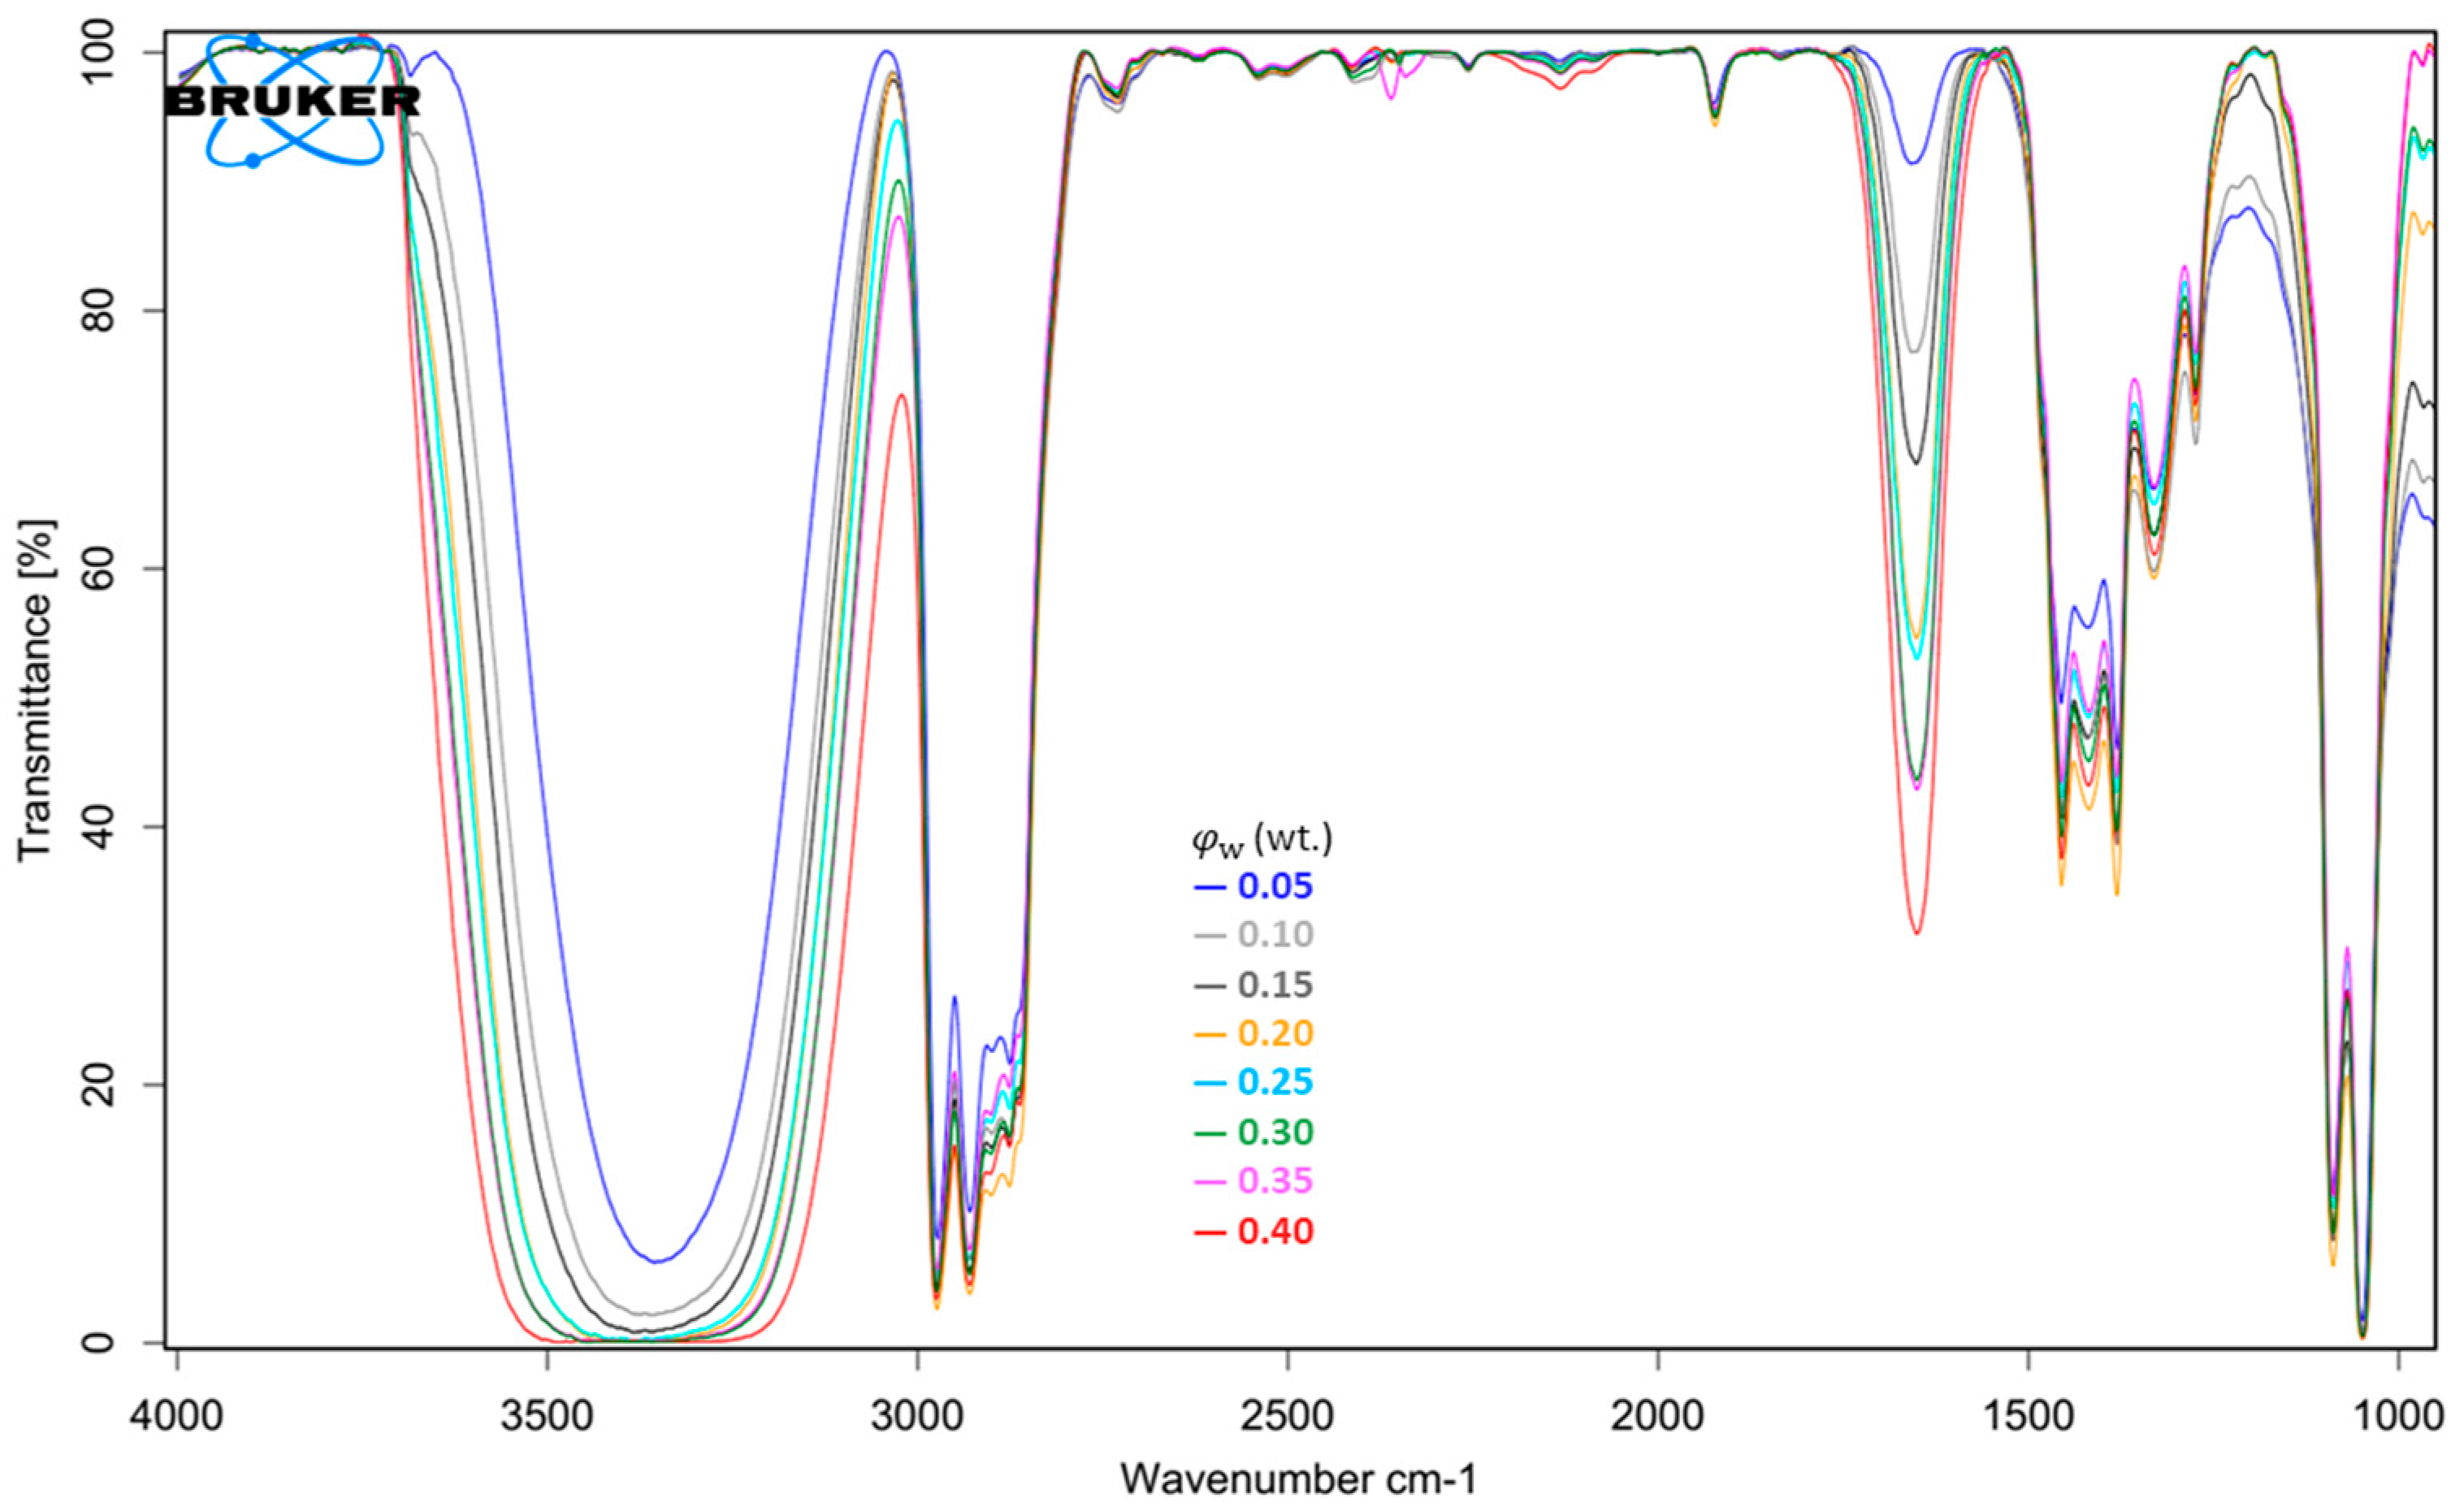
The FT-IR spectrum (Figure 6) for the ternary system of water, heptanol and ethanol shows several key features that indicate the molecular interactions and structural changes within the system. The OH stretching region, which extends from 3700 to 3200 cm−1, shows broad absorption peaks characteristic of hydrogen bonding. The broad and intense peak in this region indicates the strong hydrogen bonding network of the water molecules, with ethanol and heptanol also contributing to O-H stretching, albeit with slightly sharper peaks due to the less extensive hydrogen bonds compared to water. With increasing water content, this peak becomes broader and more pronounced, indicating the presence of hydrogen-bonded and free O-H groups. FTIR measurements of O-H stretching in surfactant-free microemulsions (SFMEs) can reveal the presence of “free” water inside droplets. The position and shape of the O-H stretching band in the FTIR spectrum indicate the hydrogen bonding environment of water. When water is mostly free, the band appears closer to that of pure water (around 3400–3500 cm−1), reflecting extensive hydrogen bonding similar to bulk water. Conversely, if water is primarily bound to the droplet interface, the band shifts to lower frequencies (around 3200 cm−1), indicating stronger interactions with other components like ethanol or oil. As the water content increases, more water remains free within the droplets, leading to a band closer to bulk water. This shift provides insights into the droplet size and the internal structure of the microemulsion, essential for understanding and optimizing the system.
The C−H stretching region between 3000 and 2850 cm−1 is dominated by C−H stretching vibrations of heptanol and ethanol. The peaks around 2950 cm−1 and 2870 cm−1 correspond to the asymmetric and symmetric stretching of the CH2 and CH3 groups, respectively. At higher water content, the intensity of these peaks can decrease due to the relative decrease in the concentration of the organic components.
The O−H bending region around 1640 cm−1 is primarily due to the bending vibrations of the O−H groups in water. As the water content increases, the intensity of this peak increases, which is due to the higher mass fraction of water molecules.
As the water content increases, the O−H stretching band not only becomes broader but also shifts to the entire range of 3700–3200 cm−1, indicating the presence of both free and hydrogen-bonded OH groups. At a low water content, the band is initially narrower and centered around lower frequencies (3100–3300 cm−1), which is due to the strong hydrogen bonding between water and ethanol molecules. As the water content increases, the band expands to higher frequencies (3600–3700 cm−1), indicating the presence of free water molecules that are not involved in hydrogen bonding.
At higher water concentrations, the system can form micelle-like structures in which the water molecules cluster together in the core and are surrounded by ethanol, which acts as a surfactant. The shift in the OH stretching band to higher frequencies indicates the formation of these structures, with the water at the interface contributing to the broader peak. This behavior is consistent with classical microemulsion systems in which the polar head of ethanol interacts with water, leading to a shift in the OH stretching frequencies.
In summary, the FT-IR spectrum effectively illustrates the effects of varying water content in the ternary system of water, heptanol and ethanol. The key regions of the spectrum—OH stretching and C-H stretching—are affected by the changing mass fractions of water. The observed trends, such as the broadening and shifting of the OH stretching band, are consistent with the formation of hydrogen-bonded networks and micelle-like structures in the system. This comprehensive analysis provides a detailed understanding of the molecular interactions and structural changes that occur at different water contents [41,47].

3.6. Synthesized SSNs

The synthesis of silica nanoparticles using a surfactant-free microemulsion (SFME) system, which includes heptanol, ethanol, water, and ammonia hydroxide as a catalyst, involves a well-coordinated sequence of steps. Initially, the system’s components—heptanol as the oil phase, ethanol as amphiphilic solvent, and water—are mixed with ammonia hydroxide acting as a catalyst. This mixture spontaneously forms a microemulsion. The microemulsion consists of nanoscale water droplets dispersed within the continuous oil phase (heptanol), with ethanol stabilizing these droplets. These droplets serve as tiny reaction vessels where the silica synthesis takes place. The process begins with the addition of tetraethyl orthosilicate (TEOS), the silica precursor, to the microemulsion. TEOS undergoes hydrolysis when exposed to water and the basic environment provided by ammonia hydroxide, resulting in the formation of silicic acid: Si(OH)4.
Following hydrolysis, the silicic acid molecules undergo condensation reactions, where they link together, forming siloxane bonds (Si-O-Si). This polymerization process gradually builds up the silica (SiO2), resulting in the formation of silica nanoparticles within the water droplets of the microemulsion. The synthesis of silica nanoparticles using surfactant-free microemulsions reveals distinct trends influenced by the ethanol and water compositions.
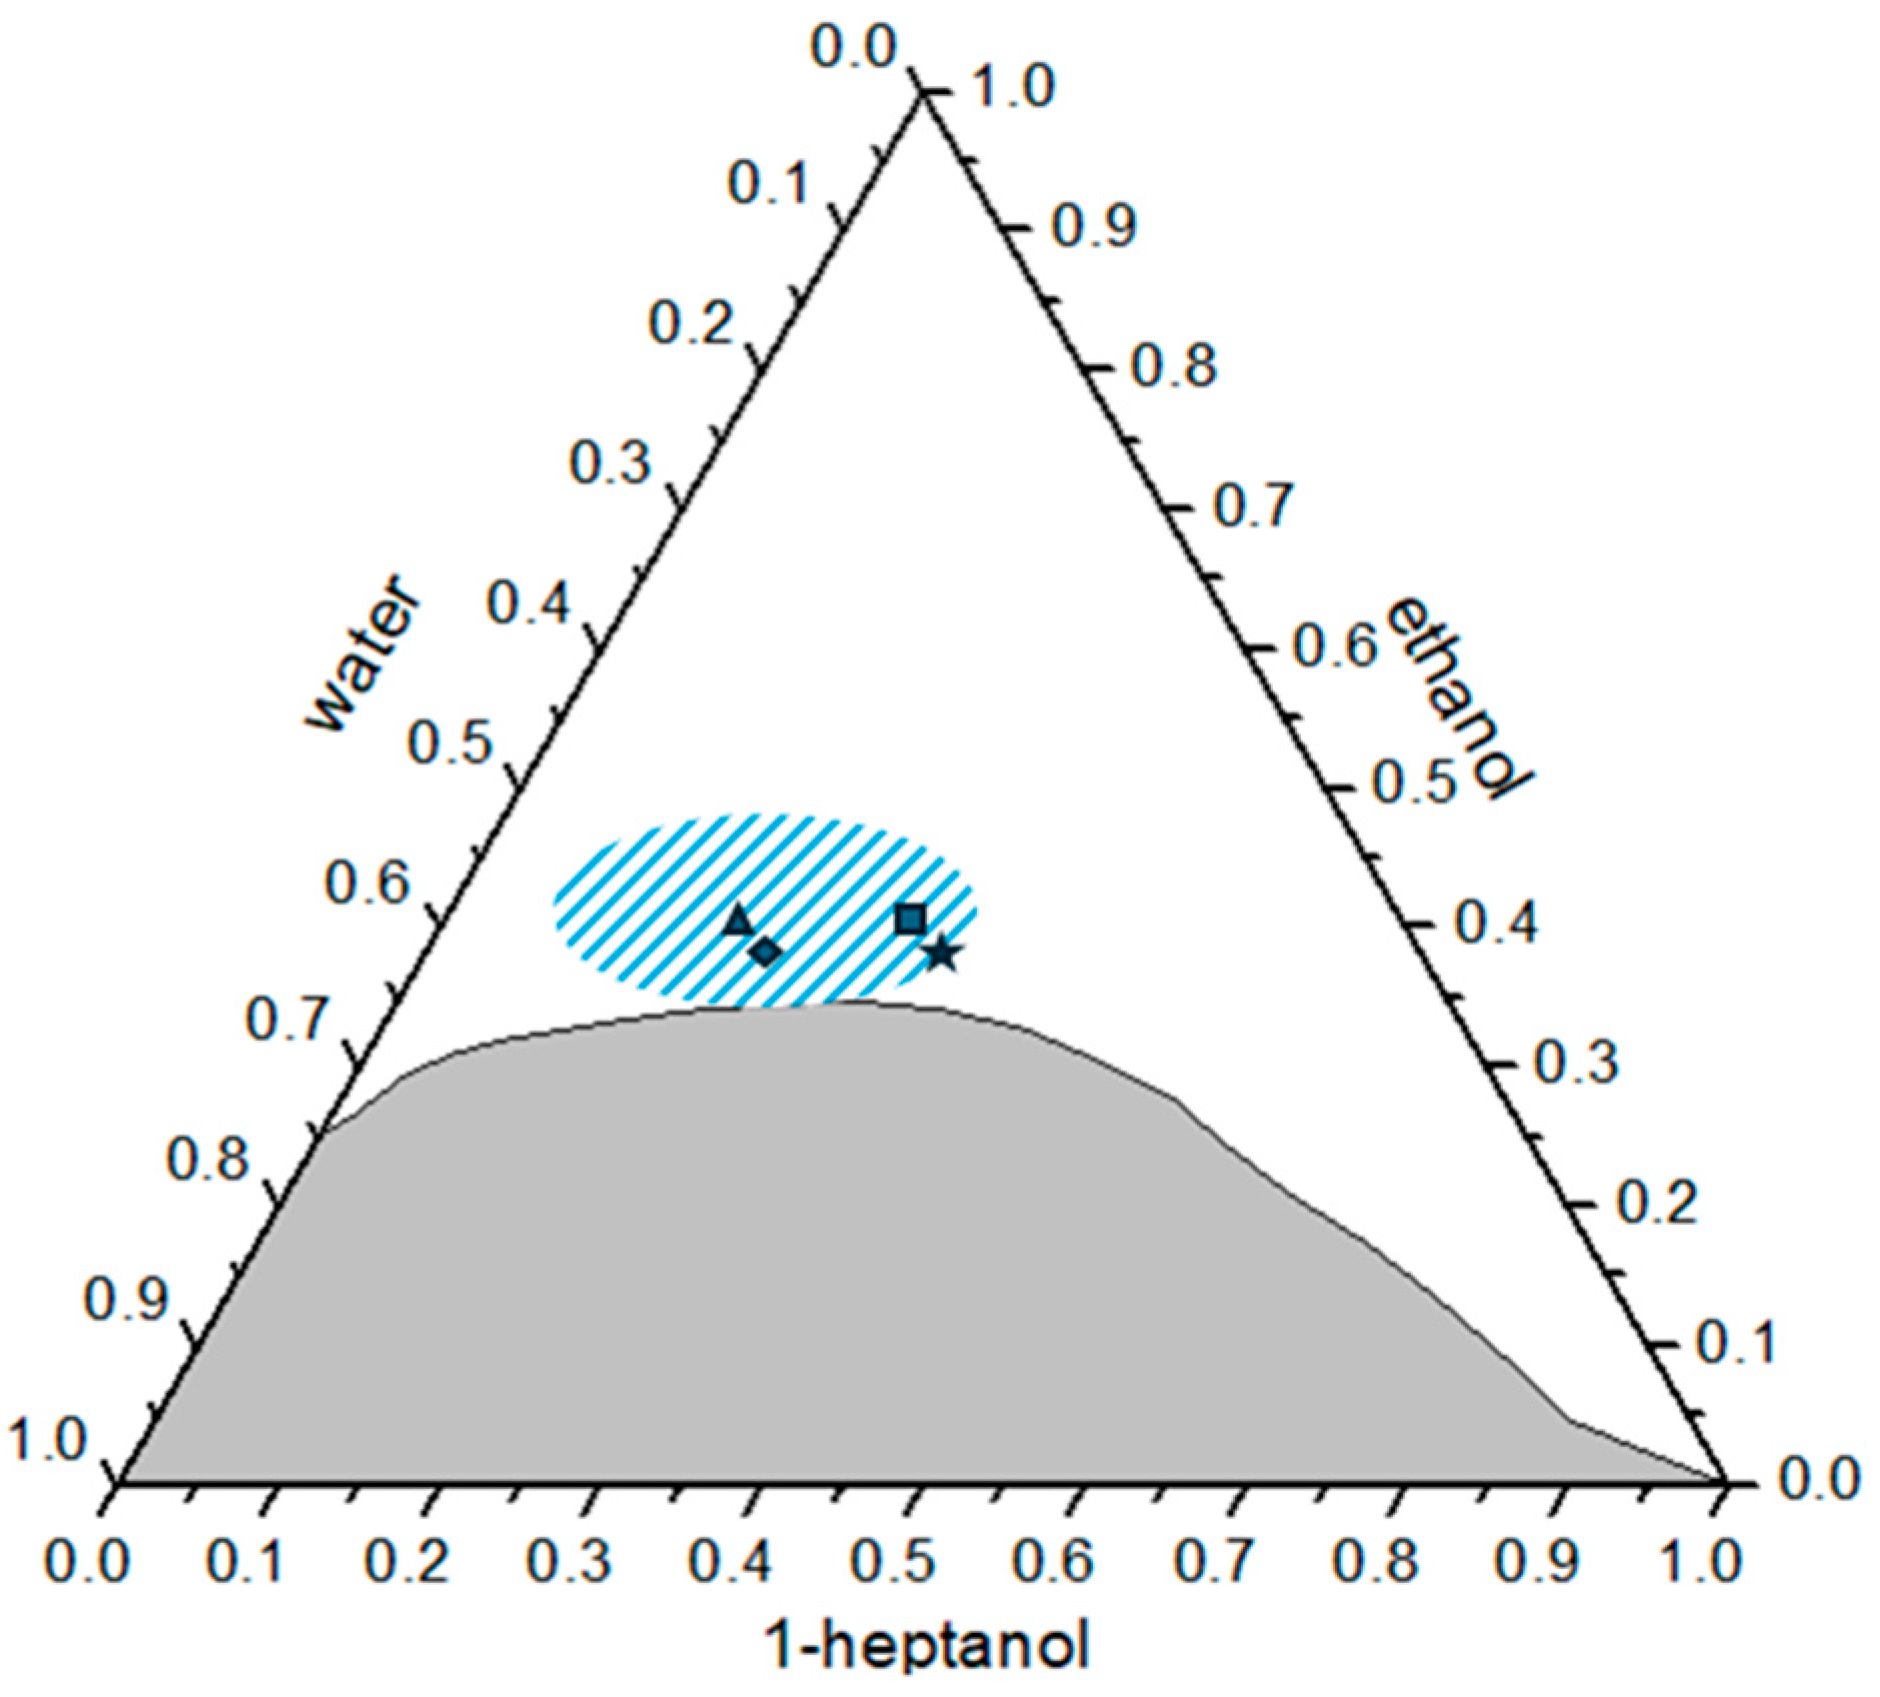
For Samples 1 (S1) and 2 (S2) (Figure 7 and Figure 8), despite having the same ethanol composition, the increase in water content for S2 results in larger nanoparticles (average 548 nm) compared to S1 (average 448 nm). This aligns with the findings from a previously published paper [48] that suggests that increased water content can lead to larger particle sizes up to a certain point, beyond which further increases in water can lead to a decrease in size due to aggregation and phase separation issues.
Similarly, for Samples 3 (S3) and 4 (S4) (Figure 7 and Figure 8), which also have the same ethanol composition, S4 with a higher water content results in smaller nanoparticles (average 667 nm) compared to S3 (average 764 nm). This suggests that the relationship between water content and particle size may depend on the specific ethanol concentration used. At higher ethanol concentrations, increased water may lead to aggregation, resulting in smaller particles.
Examining the impact of ethanol composition, Samples 1 (S1) and 3 (S3) have the same water composition, but S3 has a lower ethanol content. S3 results in significantly larger nanoparticles (764 nm) compared to S1 (448 nm). A lower ethanol content, while keeping the water content constant, promotes the growth of larger nanoparticles. This supports the hypothesis that a lower ethanol content favors larger particle formation due to reduced stabilization of smaller nuclei.
Similarly, for Samples 2 (S2) and 4 (S4) with the same water composition, S4 with a lower ethanol content results in larger nanoparticles (667 nm) compared to S2 (548 nm), reinforcing that a lower ethanol content promotes larger particle formation.
Silicon alkoxides like TEOS do not mix well with water, which is why alcohols are used to help them mix. With a low water content, the mixture is uniform, leading to a narrow range of particle sizes. At a higher water content, with the addition of TEOS, the mixture is not initially uniform and only becomes so after the reaction is underway. This non-uniformity can result in different growth conditions for particles, leading to a wider range of sizes. This is evidenced by the ranges of S2 (400–580 nm) and S4 (570–770 nm), where a higher water content results in more polydisperse particles compared to the more uniform sizes seen in S1 and S3. Thus, the initial uniformity of the mixture is crucial for determining the consistency and size of the particles produced [48].
From previously published papers, it is clear that many conditions can influence the synthesis of silica nanoparticles, such as concentrations of ammonia and TEOS, temperature, feed rate, and reaction temperature. Designing the desired size of nanoparticles requires a detailed study of these conditions in this system [49]. However, the goal of this study was to show how the initial ratio of microemulsion components, with all other conditions the same, can also influence the size of nanoparticles.
The process utilized in this synthesis method offers several advantages, including the absence of surfactants, which can otherwise lead to contamination and complicate the purification process. Moreover, the surfactant-free microemulsion (SFME) system allows for excellent control over particle size and morphology, making it a superior alternative to traditional microemulsion methods that involve surfactants [31].

4. Conclusions

The study successfully demonstrated that the surfactant-free microemulsion (SFME) system consisting of water, ethanol, and heptanol can form stable, nano-sized droplets. The advanced characterization techniques including electrical conductivity measurements, dynamic light scattering (DLS), and Fourier transform infrared spectroscopy (FTIR) provided comprehensive insights into the stability, structure, and molecular interactions within the SFME system. Electrical conductivity measurements revealed a distinct percolation threshold, indicating the formation of a connected network of water droplets and confirming the potential for stable microstructures without surfactants. DLS measurements showed that the hydrodynamic radius of the droplets varied with the composition of the ternary system with more stable aggregates forming near the phase separation boundary. FTIR spectra provided detailed insights into molecular interactions, revealing strong hydrogen bonding and the formation of hydrogen-bonded networks as the water content varied. These findings collectively indicate that the SFME system can achieve stability and precise control over droplet size and molecular interactions, making it a versatile and environmentally friendly alternative to traditional surfactant-based microemulsions, with potential applications across various industries. Ethanol, as a key component of heptanol, ethanol, and water SFME, enhances the solubility of compounds that are poorly soluble in water. This property makes microemulsion particularly promising for applications in drug delivery and cosmetics, where the effective delivery of active ingredients is crucial. Moreover, the ability to control the nanoparticle size within this microemulsion system opens significant potential in drug delivery. Nanoparticles synthesized in this SFME can be used for targeted drug delivery, improving bioavailability, and enabling controlled drug release. The use of relatively inexpensive and readily available components like heptanol, ethanol, and water also makes this SFME an attractive option for industrial applications. The cost-effectiveness, combined with the environmental benefit of avoiding traditional surfactants, positions this system as a sustainable choice for large-scale production.
However, before these applications can be fully realized, it is essential to conduct thorough research into the toxicity of the microemulsion on human cells and its transdermal absorption properties for topical applications. Ensuring safety and efficacy is paramount for products intended for human use. While heptanol–ethanol–water SFME shows promise in various applications, it does have limitations, particularly in the context of oil removal. Unlike CO2-responsive SFMEs, which can be easily switched between phases to facilitate oil recovery, this SFME lacks such responsiveness, potentially limiting its efficiency and flexibility in environmental remediation tasks like oil spill cleanup. Further research could explore modifications to enhance its performance in such applications.

Author Contributions

Conceptualization, P.B. and M.G.; methodology, A.P. and P.B.; software, M.G. and L.J.; validation, M.G., J.C. and M.T.; formal analysis, M.G., L.J. and M.K.; investigation, M.G., M.K. and P.B.; resources, P.B. and M.G.; data curation, A.P., P.B., M.T. and M.G.; writing—original draft preparation, M.G., P.B., A.P., L.J. and M.K.; writing—review and editing, P.B., M.G., J.C. and A.P. All authors have read and agreed to the published version of the manuscript.

Funding

M.T. and J.C. acknowledge the support from the Slovenian Research Agency (research core funding no. P1-0201 and project no. N1-0308 “Nanoplastics in aqueous environments: structure, migration, transport and remediation”).

Data Availability Statement

The original contributions presented in the study are included in the article, further inquiries can be directed to the corresponding author.

Acknowledgments

M. G. thanks CEEPUS for the grants CIII-SI 1312-2122-152741 in the frame of the network “Water—a common but anomalous substance that has to be taught and studied”.

Conflicts of Interest

The authors declare no conflicts of interest.

References

  1. Prince, L.M. Microemulsions versus Micelles. J. Colloid Interface Sci. 1975, 52, 182–188. [Google Scholar] [CrossRef]
  2. Paul, B.K.; Moulik, S.P. Microemulsions: An Overview. J. Dispers. Sci. Technol. 1997, 18, 301–367. [Google Scholar] [CrossRef]
  3. Masahiko, A. Macro- and Microemulsions. J. Jpn. Oil Chem. Soc. 1998, 47, 819–843. [Google Scholar]
  4. Solans, C.; García-Celma, M.J. Surfactants for Microemulsions. Curr. Opin. Colloid Interface Sci. 1997, 2, 464–471. [Google Scholar] [CrossRef]
  5. Han, Y.; Pan, N.; Li, D.; Liu, S.; Sun, B.; Chai, J.; Li, D. Formation Mechanism of Surfactant-Free Microemulsion and a Judgment on Whether It Can Be Formed in One Ternary System. Chem. Eng. J. 2022, 437, 135385. [Google Scholar] [CrossRef]
  6. Olkowska, E.; Polkowska, Z.; Namieśnik, J. Analytics of Surfactants in the Environment: Problems and Challenges. Chem. Rev. 2011, 111, 5667–5700. [Google Scholar] [CrossRef]
  7. Zhang, X.; Song, M.; Chai, J.; Cui, X.; Wang, J. Preparation, Characterization and Application of a Surfactant-Free Microemulsion Containing 1-Octen-3-Ol, Ethanol, and Water. J. Mol. Liq. 2020, 300, 112278. [Google Scholar] [CrossRef]
  8. Zhang, Y.; Chen, X.; Zhu, B.; Zhou, Y.; Liu, X.; Yang, C. Temperature-Switchable Surfactant-Free Microemulsion. Langmuir 2020, 36, 7356–7364. [Google Scholar] [CrossRef]
  9. Li, X.; Lu, H.; Wang, L.; Dai, S.; Wang, B.; Wu, Y. Oil Removal from Solid Surface by Using Surfactant-Free Microemulsion Regulated by CO2: A Sustainable Approach for Treating Oily Waste. J. Clean. Prod. 2022, 345, 130990. [Google Scholar] [CrossRef]
  10. Hankel, R.F.; Rojas, P.E.; Cano-Sarabia, M.; Sala, S.; Veciana, J.; Braeuer, A.; Ventosa, N. Surfactant-Free CO2-Based Microemulsion-like Systems. Chem. Commun. 2014, 50, 8215–8218. [Google Scholar] [CrossRef]
  11. Hou, W.; Xu, J. Surfactant-Free Microemulsions. Curr. Opin. Colloid Interface Sci. 2016, 25, 67–74. [Google Scholar] [CrossRef]
  12. Gudelj, M.; Šurina, P.; Jurko, L.; Prkić, A.; Bošković, P. The Additive Influence of Propane-1,2-Diol on SDS Micellar Structure and Properties. Molecules 2021, 26, 3773. [Google Scholar] [CrossRef]
  13. Krickl, S.; Jurko, L.; Wolos, K.; Touraud, D.; Kunz, W. Surfactant-Free Microemulsions with Cleavable Constituents. J. Mol. Liq. 2018, 271, 112–117. [Google Scholar] [CrossRef]
  14. Wang, A.; Liu, Z.; Xu, L.; Lou, N.; Li, M.; Liu, L. Controllable Click Synthesis of Poly(Ionic Liquid)s by Surfactant-Free Ionic Liquid Microemulsions for Selective Dyes Reduction. React. Funct. Polym. 2020, 147, 104464. [Google Scholar] [CrossRef]
  15. Mirhoseini, B.S.; Salabat, A. A Novel Surfactant-Free Microemulsion System for the Synthesis of Poly (Methyl Methacrylate)/Ag Nanocomposite. J. Mol. Liq. 2021, 342, 117555. [Google Scholar] [CrossRef]
  16. Drapeau, J.; Verdier, M.; Touraud, D.; Kröckel, U.; Geier, M.; Rose, A.; Kunz, W. Effective Insect Repellent Formulation in Both Surfactantless and Classical Microemulsions with a Long-Lasting Protection for Human Beings. Chem. Biodivers. 2009, 6, 934–947. [Google Scholar] [CrossRef] [PubMed]
  17. Zoumpanioti, M.; Karali, M.; Xenakis, A.; Stamatis, H. Lipase Biocatalytic Processes in Surfactant Free Microemulsion-like Ternary Systems and Related Organogels. Enzyme Microb. Technol. 2006, 39, 531–539. [Google Scholar] [CrossRef]
  18. Han, Y.; Liu, S.; Du, Y.; Li, D.; Pan, N.; Chai, J.; Li, D. A New Application of Surfactant-Free Microemulsion: Solubilization and Transport of Drugs and Its Transdermal Release Properties. J. Taiwan Inst. Chem. Eng. 2022, 138, 104473. [Google Scholar] [CrossRef]
  19. Song, L.; Jia, H.; Zhang, F.; Jia, H.; Wang, Y.; Xie, Q.; Fan, F.; Wang, Q.; Wen, S. Sustainable Utilization of Surfactant-Free Microemulsion Regulated by CO2 for Treating Oily Wastes: A Interpretation of the Response Mechanism. Langmuir 2024, 40, 960–967. [Google Scholar] [CrossRef]
  20. Liu, W.; Pan, N.; Han, Y.; Li, D.; Chai, J. Solubilization, Stability and Antioxidant Activity of Curcumin in a Novel Surfactant-Free Microemulsion System. LWT 2021, 147, 111583. [Google Scholar] [CrossRef]
  21. Zhang, Y.; Liu, D.; Dai, S.; Lu, H. Surfactant-Free Microemulsion Based on CO2-Induced Ionic Liquids. J. Phys. Chem. B 2019, 123, 9024–9030. [Google Scholar] [CrossRef]
  22. Xu, J.; Cui, Y.; Wang, R.; Shi, Z.; Wu, C.; Li, D. Mesoporous La-Based Nanorods Synthesized from a Novel IL-SFME for Phosphate Removal in Aquatic Systems. Colloids Surfaces A Physicochem. Eng. Asp. 2021, 624, 126689. [Google Scholar] [CrossRef]
  23. Marcus, J.; Touraud, D.; Prévost, S.; Diat, O.; Zemb, T.; Kunz, W. Influence of Additives on the Structure of Surfactant-Free Microemulsions. Phys. Chem. Chem. Phys. 2015, 17, 32528–32538. [Google Scholar] [CrossRef] [PubMed]
  24. Wu, Y.; Jing, J.; Li, X.; Yue, W.; Qi, J.; Wang, N.; Lu, H. CO2-Responsive Hydrophobic Deep Eutectic Solvent Based on Surfactant-Free Microemulsion-Mediated Synthesis of BaF2 Nanoparticles. Langmuir 2023, 39, 1181–1189. [Google Scholar] [CrossRef]
  25. Li, M.; Yuan, J.; Yang, Q.; Liu, Z.; Meng, S.; Wang, X.; Peng, C.; Yin, T. Therapeutic Deep Eutectic Solvents Based on Natural Product Matrine and Caprylic Acid: Physical Properties, Cytotoxicity and Formation of Surfactant Free Microemulsion. J. Drug Deliv. Sci. Tehnol. 2023, 90, 105177. [Google Scholar] [CrossRef]
  26. Anjali; Pandey, S. Formation of Ethanolamine-Mediated Surfactant-Free Microemulsions Using Hydrophobic Deep Eutectic Solvents. Langmuir 2024, 40, 2254–2267. [Google Scholar] [CrossRef] [PubMed]
  27. Huber, V.; Muller, L.; Degot, P.; Touraud, D.; Kunz, W. NADES-Based Surfactant-Free Microemulsions for Solubilization and Extraction of Curcumin from Curcuma Longa. Food Chem. 2021, 355, 129624. [Google Scholar] [CrossRef] [PubMed]
  28. Tarkas, H.; Rokade, A.; Upasani, D.; Pardhi, N.; Rokade, A.; Sali, J.; Patole, S.P.; Jadkar, S. Pioneering Method for the Synthesis of Lead Sulfide (PbS) Nanoparticles Using a Surfactant-Free Microemulsion Scheme. RSC Adv. 2024, 14, 4352–4361. [Google Scholar] [CrossRef]
  29. Tarkas, H.S.; Marathe, D.M.; Mahajan, M.S.; Muntaser, F.; Patil, M.B.; Tak, S.R.; Sali, J.V. Synthesis of Tin Monosulfide (SnS) Nanoparticles Using Surfactant Free Microemulsion (SFME) with the Single Microemulsion Scheme. Mater. Res. Express 2017, 4, 025018. [Google Scholar] [CrossRef]
  30. Cui, X.; Wang, J.; Zhang, X.; Wang, Q.; Song, M.; Chai, J. Preparation of Nano-TiO2 by a Surfactant-Free Microemulsion-Hydrothermal Method and Its Photocatalytic Activity. Langmuir 2019, 35, 9255–9263. [Google Scholar] [CrossRef]
  31. Sun, B.; Chai, J.; Chai, Z.; Zhang, X.; Cui, X.; Lu, J. A Surfactant-Free Microemulsion Consisting of Water, Ethanol, and Dichloromethane and Its Template Effect for Silica Synthesis. J. Colloid Interface Sci. 2018, 526, 9–17. [Google Scholar] [CrossRef] [PubMed]
  32. Qi, W.; Deng, Q.; Du, N.; Hou, W. Surfactant-Free Microemulsions of n-Butanol, Ethanol, and Water. J. Mol. Liq. 2023, 390, 122980. [Google Scholar] [CrossRef]
  33. Klemm, W.R. Biological Water and Its Role in the Effects of Alcohol. Alcohol 1998, 15, 249–267. [Google Scholar] [CrossRef] [PubMed]
  34. Zhang, Y.; Chen, X.; Liu, X. Temperature-Induced Reversible-Phase Transition in a Surfactant-Free Microemulsion. Langmuir 2019, 35, 14358–14363. [Google Scholar] [CrossRef]
  35. Marcus, J.; Klossek, M.L.; Touraud, D.; Kunz, W. Nano-Droplet Formation in Fragrance Tinctures. Flavour Fragr. J. 2013, 28, 294–299. [Google Scholar] [CrossRef]
  36. Bošković, P.; Sokol, V.; Zemb, T.; Touraud, D.; Kunz, W. Weak Micelle-Like Aggregation in Ternary Liquid Mixtures as Revealed by Conductivity, Surface Tension, and Light Scattering. J. Phys. Chem. B 2015, 119, 9933–9939. [Google Scholar] [CrossRef]
  37. Bao, Y.; He, J.; Song, K.; Guo, J.; Zhou, X.; Liu, S. Plant-Extract-Mediated Synthesis of Metal Nanoparticles. J. Chem. 2021, 2021. [Google Scholar] [CrossRef]
  38. Hassan, P.A.; Rana, S.; Verma, G. Making Sense of Brownian Motion: Colloid Characterization by Dynamic Light Scattering. Langmuir 2015, 31, 3–12. [Google Scholar] [CrossRef]
  39. Holthoff, H.; Egelhaaf, S.U.; Borkovec, M.; Schurtenberger, P.; Sticher, H. Coagulation Rate Measurements of Colloidal Particles by Simultaneous Static and Dynamic Light Scattering. Langmuir 1996, 12, 5541–5549. [Google Scholar] [CrossRef]
  40. Lagourette, B.; Peyrelasse, J.; Boned, C.; Clausse, M. Percolative Conduction in Microemulsion Type Systems. Nature 1979, 281, 60–62. [Google Scholar] [CrossRef]
  41. Bošković, P.; Sokol, V.; Touraud, D.; Prkić, A.; Giljanović, J. The Nanostructure Studies of Surfactant-Free-Microemulsions in Fragrance Tinctures. Acta Chim. Slov. 2016, 63, 138–143. [Google Scholar] [CrossRef]
  42. Ni, P.; Hou, W.-G. A Novel Surfactant-Free Microemulsion System: Ethanol/Furaldehyde/H2O. Chin. J. Chem. 2008, 26, 1985–1990. [Google Scholar] [CrossRef]
  43. Zhu, H.; Yin, J. Effect of Cosolvent Ethanol on Solubilization of Ionic Liquids in Supercritical CO2Microemulsions: Experiments and Simulations. J. Chem. Eng. Data 2021, 66, 347–359. [Google Scholar] [CrossRef]
  44. Magrode, N.; Poomanee, W.; Kiattisin, K.; Ampasavate, C. Microemulsions and Nanoemulsions for Topical Delivery of Tripeptide-3: From Design of Experiment to Anti-Sebum Efficacy on Facial Skin. Pharmaceutics 2024, 16, 554. [Google Scholar] [CrossRef] [PubMed]
  45. Klossek, M.L.; Touraud, D.; Zemb, T.; Kunz, W. Structure and Solubility in Surfactant-Free Microemulsions. ChemPhysChem 2012, 13, 4116–4119. [Google Scholar] [CrossRef]
  46. Zemb, T.N.; Klossek, M.; Lopian, T.; Marcus, J.; Schöettl, S.; Horinek, D.; Prevost, S.F.; Touraud, D.; Diat, O.; Marčelja, S.; et al. How to Explain Microemulsions Formed by Solvent Mixtures without Conventional Surfactants. Proc. Natl. Acad. Sci. USA 2016, 113, 4260–4265. [Google Scholar] [CrossRef]
  47. Xu, J.; Deng, H.; Song, J.; Zhao, J.; Zhang, L.; Hou, W. Synthesis of Hierarchical Flower-like Mg2Al-Cl Layered Double Hydroxide in a Surfactant-Free Reverse Microemulsion. J. Colloid Interface Sci. 2017, 505, 816–823. [Google Scholar] [CrossRef]
  48. Bourebrab, M.A.; Oben, D.T.; Durand, G.G.; Taylor, P.G.; Bruce, J.I.; Bassindale, A.R.; Taylor, A. Influence of the Initial Chemical Conditions on the Rational Design of Silica Particles. J. Sol-Gel Sci. Technol. 2018, 88, 430–441. [Google Scholar] [CrossRef]
  49. Park, S.K.; Do Kim, K.; Kim, H.T. Preparation of Silica Nanoparticles: Determination of the Optimal Synthesis Conditions for Small and Uniform Particles. Colloids Surfaces A Physicochem. Eng. Asp. 2002, 197, 7–17. [Google Scholar] [CrossRef]
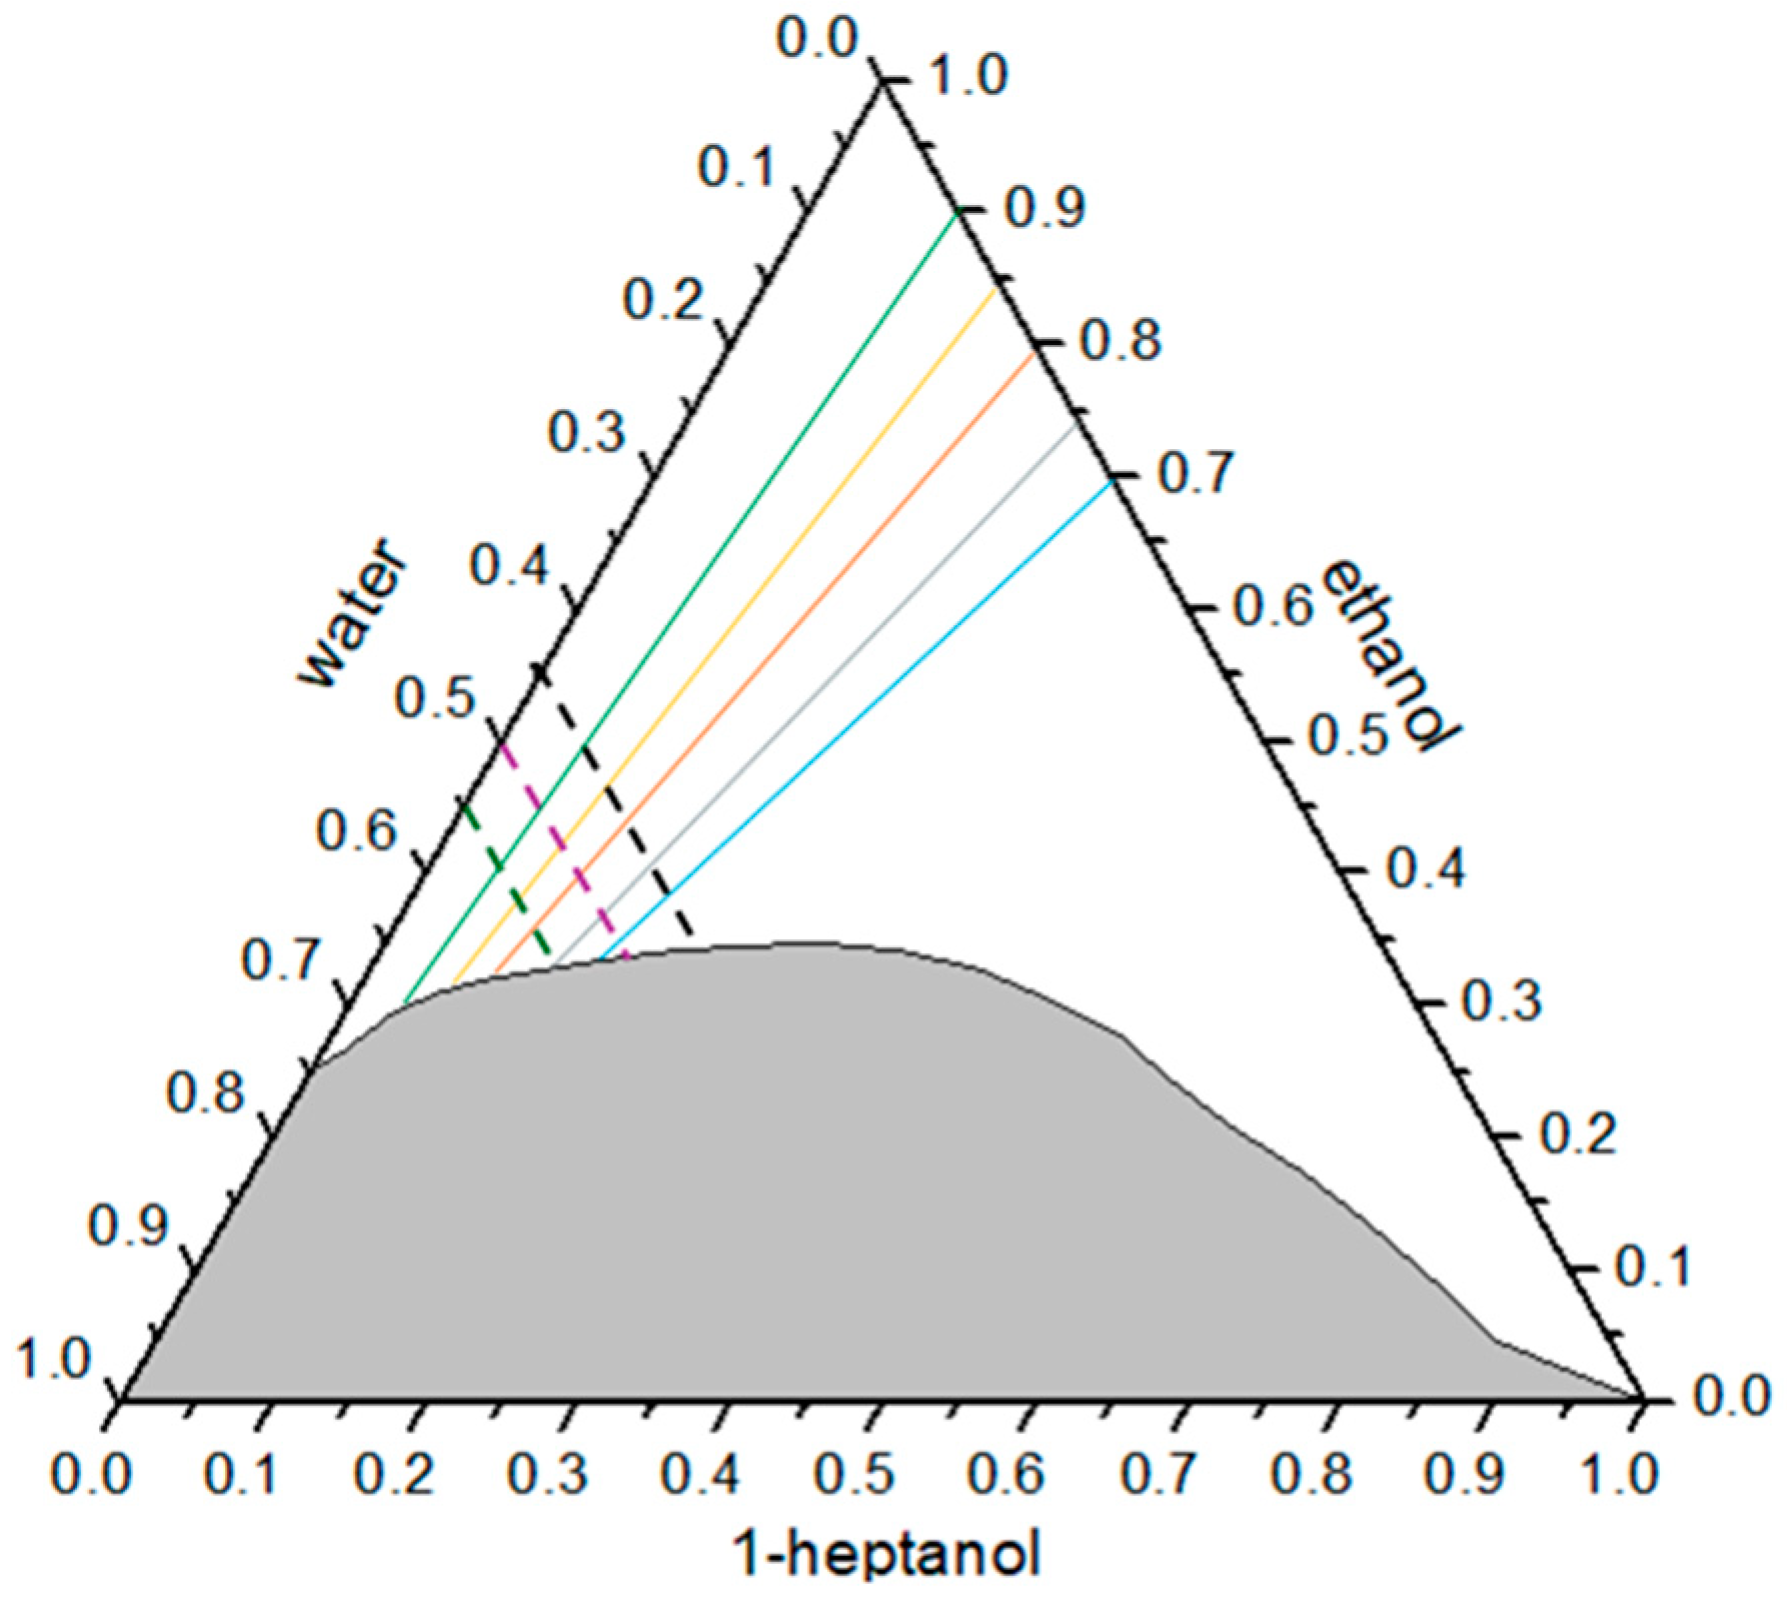
Figure 1. Phase diagram of the heptanol/ethanol/water system at 25 ± 0.02 °C. In this phase diagram, the single-phase region (clear area) indicates where the system forms a homogeneous microemulsion, appearing as a clear, isotropic mixture. The multiphase region (shaded area) represents the area of phase separation, resulting in distinct layers or emulsions. Multicolored solid lines represent different RE/H values from 9 to 2.33, along which the conductivity measurements were performed (Figure 2). Blue solid line also represents the E/H mass ratio along which the FT-IR spectrum was measured. Multicolored dashed lines represent different W/E mass ratios along which the surface tension was measured.
Colloids 08 00053 g001
Figure 3. The dependence of surface tension on the natural logarithm of the concentration of 1−heptanol in the ternary system water/ethanol/1−heptanol at 25 °C for: (a) a water/ethanol ratio of 55:45; (b) a water/ethanol ratio of 50:50; and (c) a water/ethanol ratio of 45:55.
Colloids 08 00053 g003
Figure 4. Ternary diagram depicting the compositions for which dynamic light scattering (DLS) measurements were made, represented by lines with black data points. These black data points indicate different mass ratios of 1-heptanol, ethanol, and water. The different lines are labeled AB, B, C, D, E, and F. Hydrodynamic radius was calculated for AB6 (37.5% ethanol, 32.5% heptanol, 30% water), AB8 (37.5% ethanol, 22.5% heptanol, 40% water), AB10 (37.5% ethanol, 12.5% heptanol, 50% water), and B8 (40% ethanol, 20% heptanol, 40% water).
Colloids 08 00053 g004
Figure 5. This set of correlation plots shows dynamic light scattering (DLS) measurements at 25 °C for different compositions of 1-heptanol, ethanol, and water. Each graph represents the correlation function for various mass fractions of the three components. The panels are labeled (af), corresponding to the different composition series (AB, B, C, D, E, F) from the Figure 4. Each curve in the plots represents specific points along these series, illustrating the dynamic behavior of particles in the mixtures based on their mass ratios.
Colloids 08 00053 g005
Figure 6. FT−IR spectrum of the ternary system of water, heptanol, and ethanol measured along the RE/H line with a value of 2.33 as shown in Figure 1. The FT−IR spectra display the characteristic absorption bands for functional groups present in the ternary system. The broad peak in the 3700− 3200 cm−1 region indicates O−H stretching vibrations, becoming more pronounced with increasing water content. Peaks in the 3000–2850 cm−1 range correspond to C−H stretching vibrations from heptanol and ethanol. The O−H bending peak around 1640 cm−1 increases in intensity with higher water content. This spectrum illustrates the molecular interactions and structural changes within the system as the mass fraction of water varies.
Colloids 08 00053 g006
Figure 7. The phase diagram displays the composition range of the heptanol/ethanol/water system used in the synthesis of silica nanoparticles, marked by the blue area. Within this area, four samples are represented by distinct shapes: ★—Sample 1 (S1), ◆—Sample 2 (S2), and ■—Sample 3 (S3), ▲—Sample 4 (S4). These shapes indicate the precise compositions in which silica nanoparticles are visualized by TEM (Figure 8).
Colloids 08 00053 g007
Figure 8. Figure shows transmission electron microscopy (TEM) images of silica nanoparticles synthesized from four different compositions in the heptanol/ethanol/water system. Each image corresponds to a specific sample from the phase diagram as shown in Figure 7.
Colloids 08 00053 g008
Table 1. Hydrodynamic radii of heptanol–ethanol–water aggregates at different mass ratios.
PointHydrodynamic Radii/nm
AB 65.31
AB 8 6.98
AB 106.39
B 87.38
Disclaimer/Publisher’s Note: The statements, opinions and data contained in all publications are solely those of the individual author(s) and contributor(s) and not of MDPI and/or the editor(s). MDPI and/or the editor(s) disclaim responsibility for any injury to people or property resulting from any ideas, methods, instructions or products referred to in the content.