Article

The Role of Adsorption Phenomena in ac Conductivity Measurements of Dielectric Nanoparticle Suspensions

1
LIONS, NIMBE, CEA, CNRS, Université Paris-Saclay, CEA Saclay, 91191 Gif-sur-Yvette, France
2
Institute for Superconductors, Innovative Materials, and Devices (CNR-SPIN), Via del Fosso del Cavaliere, 100, 00133 Rome, Italy
*
Author to whom correspondence should be addressed.
Colloids Interfaces 2024, 8(3), 34; https://doi.org/10.3390/colloids8030034
Submission received: 9 April 2024 / Revised: 8 May 2024 / Accepted: 22 May 2024 / Published: 28 May 2024

Abstract

:
The authors of numerous measurements of conductivity for suspensions of nanoparticles of various types carried out in the last decade came to the general conclusion that the well-known Maxwell’s theory is not applicable to quantitative explanation of the properties of such systems. In the present work, we demonstrate that the Maxwell’s theory can be still applicable even for such systems, but the specifics of the standard ac measurements have to be correctly taken into account. Namely, the dependence of the capacitance of “metal–electrolyte” cuvette boundaries on nanoparticle adsorption, which in its turn dramatically depends on nanoparticle concentration, has to be taken into account. The latter circumstance strongly (via the R C characteristic of the circuit) affects the results of conductivity measurements. We propose the new algorithm of the impedance measurement data analysis for the particles’ concentration dependence of conductivity σ ( ϕ ) (where ϕ is the volume fraction of nanoparticles in suspension) for the suspensions of the diamante nanoparticles in alcohol which demonstrates the adequate correspondence of the Maxwell’s theory to the available experimental findings.

1. Introduction

In the early 2000s, there was an increased interest in the conductive properties of electrolyte-based suspensions. It turned out that the introduction of small additives of nanoparticles of one or other type (metals, dielectrics, colloids) into a solvent (water, alcohol, stabilizing electrolytes) significantly, and in some cases dramatically, changes the transport properties of suspensions (see reviews [1,2,3]).
Let us begin with definitions. In 1892, Maxwell proposed [4] the formula for the conductivity of an inhomogeneous medium consisting of a matrix with conductivity σ 0 containing randomly located spherical inclusions with a conductivity of σ :
σ ( ϕ ) σ 0 = 1 + 3 ( σ / σ 0 1 ) ϕ σ / σ 0 + 2 ( σ / σ 0 1 ) ϕ .
The dimensionless concentration of colloidal suspension ϕ , or, in other words, the relative volume occupied by the inclusions, is defined as
ϕ = n λ 0 + R 0 3 1 ,
where n is the volume concentration of dissolved particles and R 0 is the radius of a bare nucleus (metallic, dielectric, or charged colloid). As for value λ 0 , it is the electric field screening length, which is different for different types of suspensions. For example, in the case of colloidal DLVO nanoparticles, it is the Debye length for the surrounding electrolyte. For a suspension of dielectric nanoparticles, which is the focus of our consideration below, it is the characteristic length of the occurrence of electrostatic image forces in the vicinity of the dielectric–electrolyte interface. Both R 0 and λ 0 are assumed to be much larger than the interatomic distances.
At low concentrations of inclusions, Equation (1) can explain the linearity on ϕ of the corresponding contribution to the conductivity for different types of suspensions. The slope in the concentration dependence is limited from above by three,
σ ( ϕ ) σ 0 m a x = 1 + 3 ϕ ,
for highly conducting inclusions ( σ / σ 0 1 ), and by 3 / 2 below,
σ ( ϕ ) σ 0 m i n = 1 3 ϕ / 2 ,
for dielectric inclusions ( σ / σ 0 0 ). Taking the dependencies of σ ( ϕ ) restricted by the sector between rays (3) and (4) as normal, we consider any significant deviation from these to be anomalous (naturally at concentrations that remain within the assumptions made above).
Let us analyze the results of conductivity measurements for the colloidal solutions [5] described by the DLVO theory [6,7]. Within the framework of the theory of Heissinger et al. [8], the expression for conductivity of suspension can be presented as
σ = σ 0 + σ H 2 O + σ B = n e Z eff ( μ p + μ H + ) + σ H 2 O + σ B ,
and it must be completed by the microscopic rules for the calculation of effective charges e Z eff [5]. Here, σ H 2 O is the conductivity of a pure solvent and σ B is the residual conductivity which does not depend on corrective additives (does not depend on n ).
Figure 1 demonstrates explicitly the difference between two alternative approaches based on Maxwell’s and modified Heissinger’s approximations (so-called MSA-formalism, see references [24–26] in Ref. [5]). The latter fits the experimental data with Equation (5) assuming a very special dependence of e Z eff vs. ϕ . At the output, the authors indeed find striking correspondence. As far as Maxwell’s theory is concerned, at the first glance, it has nothing in common with the experimental points.
The matter of fact is that the implementation of Maxwell’s formula (1) for the treatment of the conductivity of the cell (cuvette filled by the suspension containing inclusions of this or that nature) assumes the dc measurements of the latter. Yet, as a rule, the conductivity of suspensions is measured in the low-frequency ac mode which requires suitable R C data processing (see, for example, Ref. [9]).
As it was noted in [10], the value which is extracted as a result of impedance measurements of suspension conductivity is product R ( ϕ ) C ( ϕ ) . Both multipliers in the latter, the resistance of cuvette filled by electrolyte R ( ϕ ) and its capacitance C ( ϕ ) , depend on the concentration of inclusions. A direct confirmation of this fact can be found in [11] (Table 1). In order to separate R and C in such a situation, it is necessary to know the ϕ dependencies of both of them.
The concentration dependence of the resistance, the pivot on the chosen approach, is determined by either Equation (1) or Equation (5) and in any case is a relatively slow function of ϕ . As far as the capacitance of cuvette C ( ϕ ) is concerned, it is mainly determined by the properties of the metal–electrolyte interfaces, where the role of the metal is played by the gate electrodes of the cell with an electrolyte. This is why the capacitance dependence on the concentration of nanoinclusions turns out to be much more sophisticated. In standard data processing of impedance measurements, the cell capacity is taken as that of electrolytic capacitor C = c o n s t determined by the value of the corresponding Debye length, which defines the depth of electric field penetration in the electrolyte. In the case of electrolyte containing nanoparticles, it is essential to note that the presence of inclusions results in their adsorption at the metal–electrolyte interface. Such adsorption makes electrolytic cell capacitance dependent on inclusion concentration, in some cases dramatically increasing its value even at small changes in ϕ . The explicit expression for the latter is determined by the nature of inclusions. The specific case of colloidal solution described by DLVO theory [6,7] is considered in detail in Ref. [10].
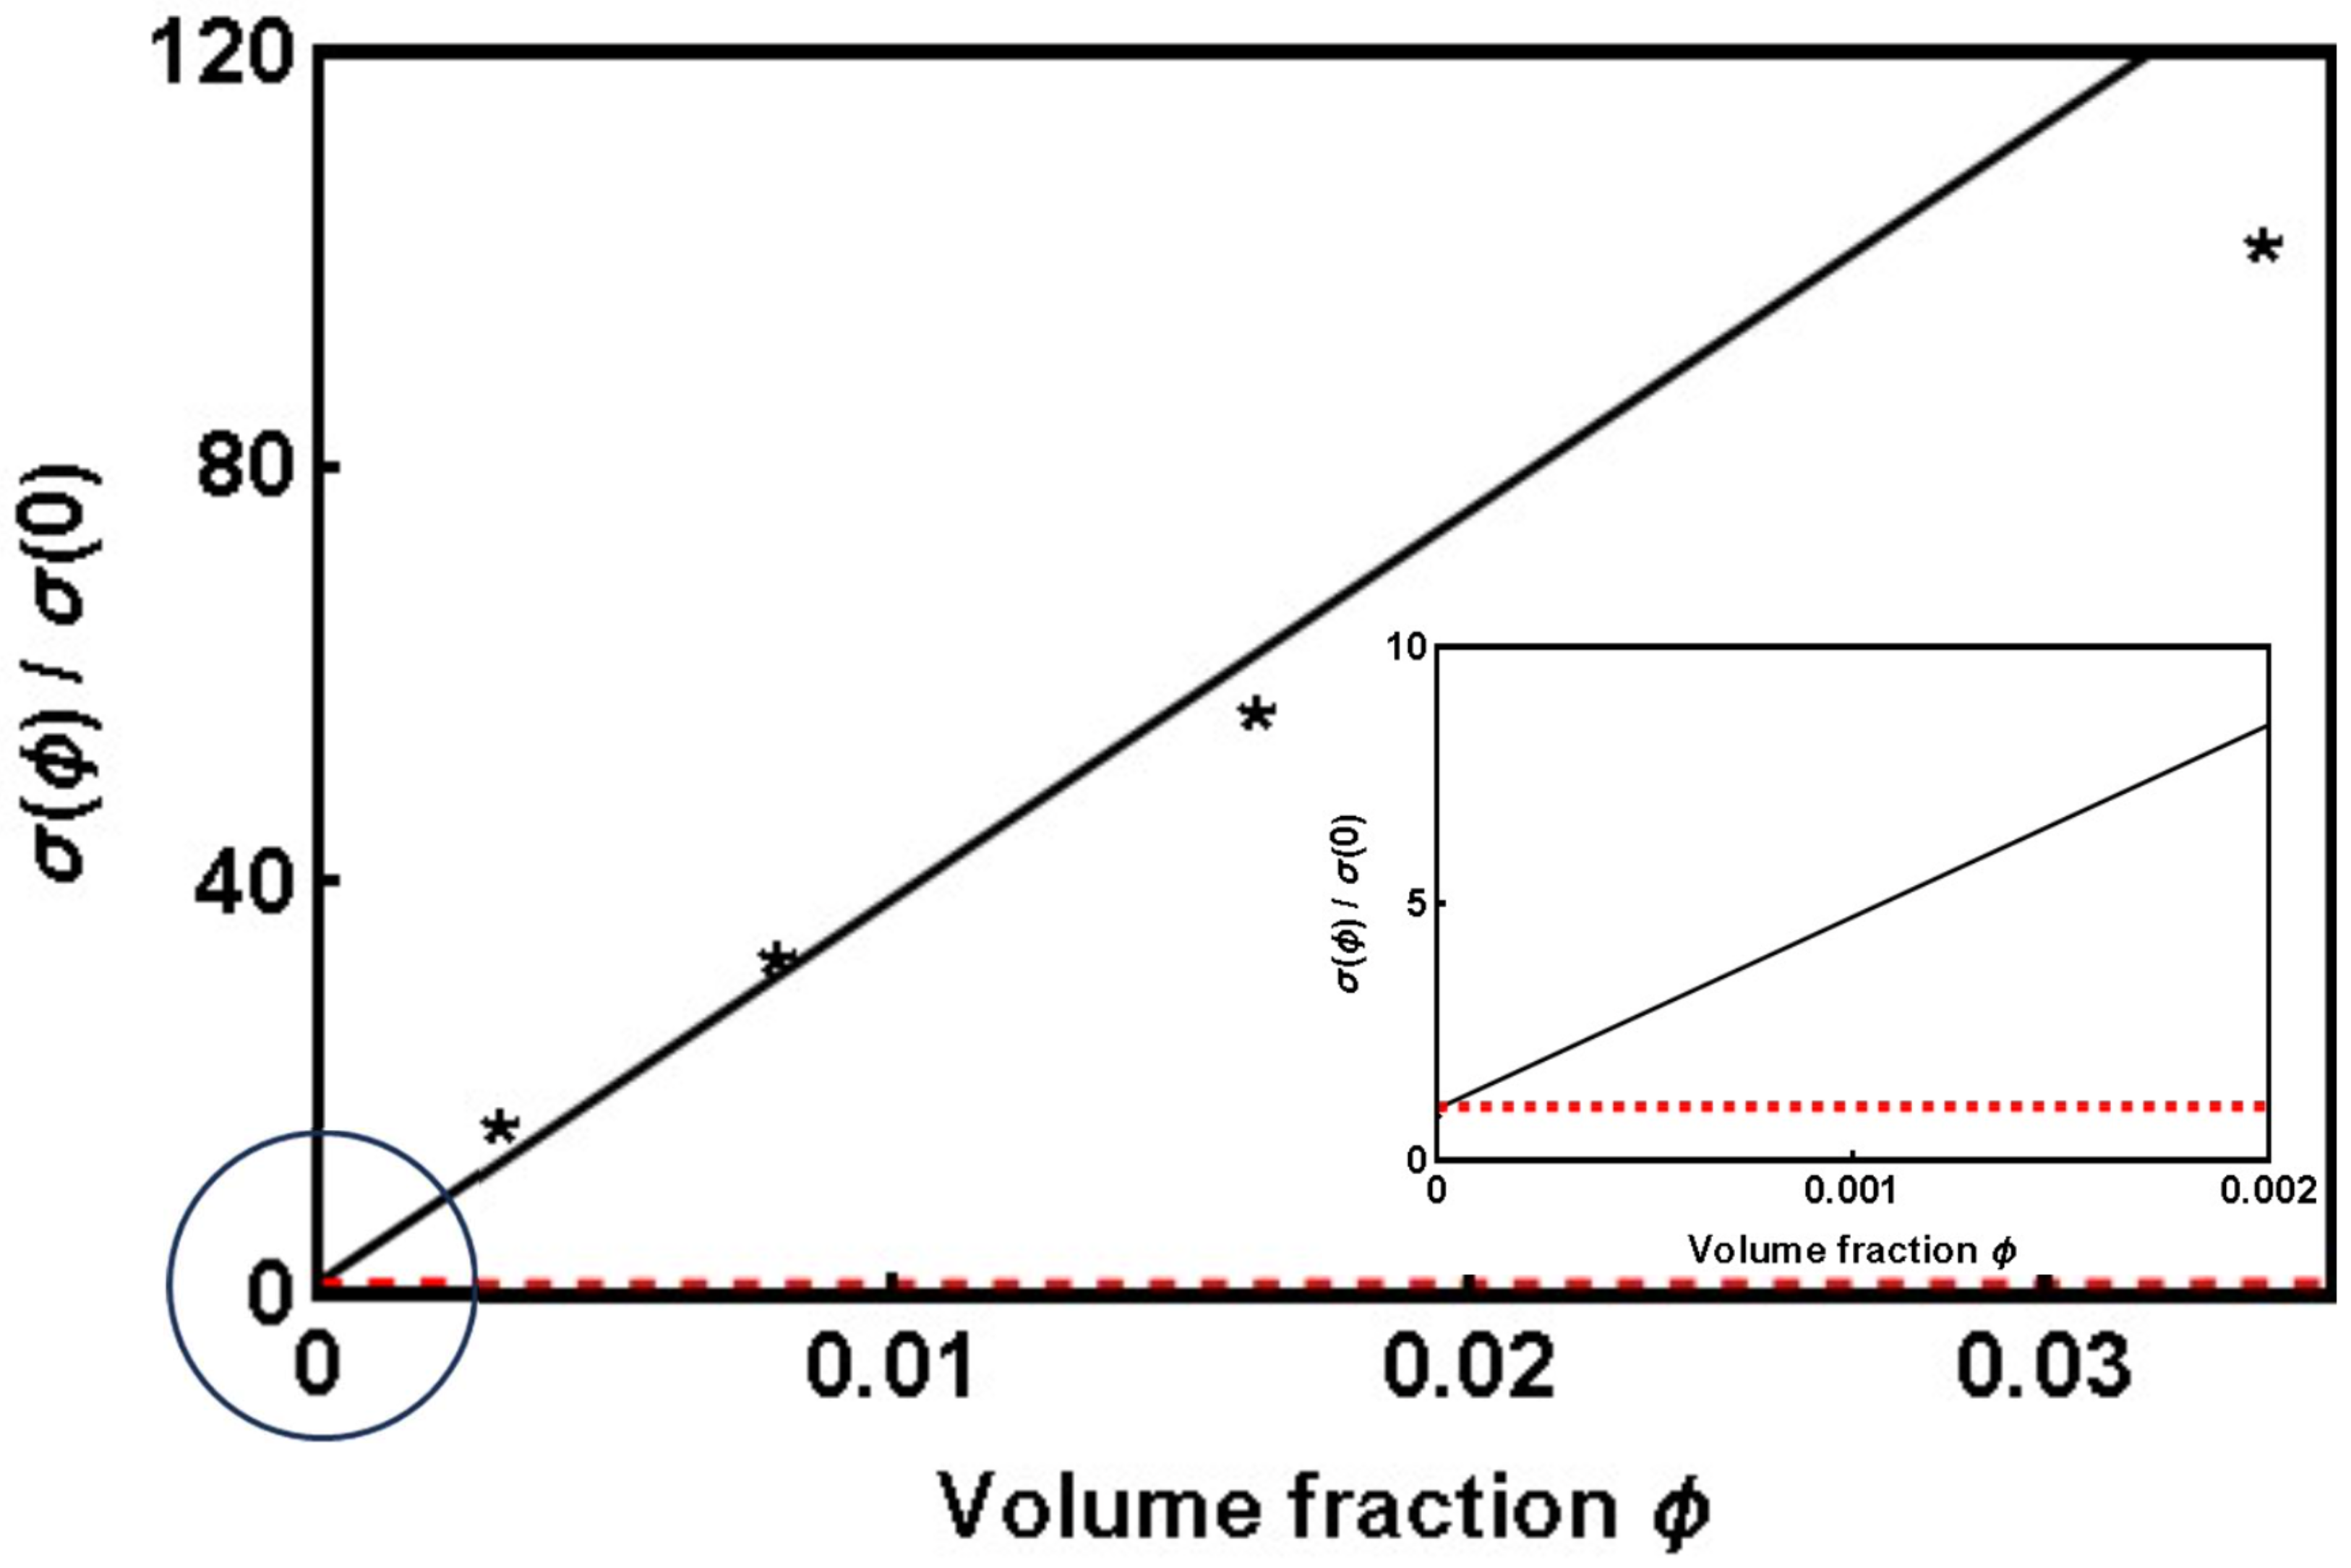
Let us return to the contradictions observed in experimental work [11] dealing with suspensions containing dielectric nanoparticles. Having at their disposal the RC information correctly extracted from the impedance measurements, the authors of [11] present the final results for conductivity σ ( ϕ ) ignoring the above-mentioned C ( ϕ ) dependence (see Figure 2, where σ ( ϕ ) / σ 0 for a suspension containing dielectric inclusions [11] is presented). Its contradiction to Equation (1) catches the eye. First of all, conductivity increases with the growth of inclusion concentration instead of decreasing as predicted by Equation (1). Second, this growth is inexplicably strong. According to Table 1, the R C combination monotonically and very quickly drops with increase in ϕ . This happens, as shown below, mainly due to the drop in capacitance C ( ϕ ) . However, if one attributes the entire change in the R C value to the drop in R ( ϕ ) , then, instead of a moderate decrease in conductivity with increase in inclusion concentration according to the asymptote (4), the rapid increase in it occurs as shown in Figure 2.
In addition to the examples discussed above, plenty of other evidence of anomalous behavior of suspension conductivity has been accumulated in the last two decades (see reviews [1,2,3]). As far as we know, there is no regular explanation for such anomalies, taking them beyond Maxwell’s formalism. Also, there was no understanding of general rules for processing the results of impedance measurements of conductivity of complex electrolytes; they were recently proposed in [10] applied to colloidal suspensions.
Below, the results of Ref. [10] are extended to the case of dilute suspensions containing dielectric inclusions, where the deviation of the ac measurements of conductivity from the predictions of Maxwell’s theory is particularly dramatic. We demonstrate that the screening properties of the metal–electrolyte boundaries confining the space filled by the suspension are crucial for the correct interpretation of the impedance measurements.

2. Electrolytic Capacitance of the Boundary “Metal–Solvent”

An electrolytic capacitor in radio engineering as a rule has flat geometry (a pair of metal strips wound into a coil with a narrow gap between them filled with a viscous electrolyte). Its properties are usually described in terms of the seminal works of Lewis and Randle [12], Debye and Hückel [13], where the screening length λ D , now called the Debye length, was introduced.
It should be noted that the electrical properties of dilute suspensions containing dielectric inclusions differ strikingly from the predictions of Maxwell’s theory for their pure solvents (water, alcohols). In particular, corresponding screening length λ a q λ D was consistently determined only recently [14].

2.1. Peculiarities of Screening in the Bulk of Dilute Electrolyte

In order to explain the difference between the latter and Debye length, we address the problem of Coulomb screening in a symmetrical (1:1) dilute electrolyte, which is the closest model for pure water. The electrochemical potentials for positive and negative ions μ ± can be presented in the form of [12,13]
μ ± ( z ) = η ± e φ ( z ) + k B T ln A ± ,
where e = | e | is the absolute value of the electron charge, η ± are the algebraic values of the corresponding ion charges expressed in units of e, T is the temperature, φ ( z ) is the local value of the electrostatic potential, while A ± are the so-called activities of the ions (with volume concentrations of N ± ( d ) ) resulting from the decay process ( A B A + + B ) of the dopant molecules (whose volume concentration is N ( d ) ).
The theory of Debye and Hückel [13] allows for us to find the explicit form of activities A ± in the case of complete decay of the dopant and when the average value of Coulomb interaction between ions V ¯ C k B T . It is also assumed that inequality e V k B T where V is the voltage applied to the cell is satisfied.
For a flat capacitor filled with a (1:1) electrolyte, the Poisson equation with corresponding boundary conditions takes the form of
φ ( z ) = 4 π e ϵ ± η ± N ± ( d ) ( z ) , φ ( z = 0 ) = V , φ ( z λ D ) 0 .
Here, ϵ is the dielectric constant of the solvent (water). Concentrations N ± ( z ) obey Boltzmann distribution
N ± ( d ) ( z ) = N 0 , ± ( d ) exp η ± e φ ( z ) k B T
with N 0 , ± ( d ) being the concentration of the corresponding ions of the (1:1) electrolyte far from the control electrodes, where the potential φ ( z ) 0 . Expanding Equations (7) and (8) with respect to e φ / k B T 1 , one arrives to the linearized Poisson–Boltzmann equation,
φ = κ D 2 φ ,
κ D 2 = 4 π e 2 ϵ k B T a N 0 , ± ( d ) η ± 2 ,
where κ D = λ D 1 is the inverse Debye length. The neutrality condition reads as
e ± η ± N 0 , ± = 0 .
According to Equations (9) and (10), not only constants N 0 , ± are involved in the formation of length λ D but also the distributions (8) determining the properties of ionic fractions of the dopant within the framework of Boltzmann statistics.
The dopant ion concentrations N ± introduced above can offer an idea of the properties of proton H + and hydroxyl O H fractions which occur in the solution due to reversible reaction H 2 O ( H + + O H ) . Yet, the product of their concentrations N + ( a q ) × N ( a q ) fulfills the following rule [15]:
N + ( a q ) × N ( a q ) K ( a q ) ( T ) ,
where K ( a q ) ( T ) is the so-salled ionic product of water. It is the equilibrium constant for the self-ionization reaction of water, which is the reaction between water molecules to form hydronium H 3 O + and hydroxide O H ions, K ( a q ) ( 25   ° C ) = 1.0 · 10 8 mol 2 · m 6 . As a consequence, the chemical parts of the electrochemical potential of protons and hydroxyls cannot be presented in the form of simple logarithmic functions of N ± ( a q ) , as it was achieved in Equation (6). Therefore, for pure water, the described scheme (7)–(11) is relevant for determination of screening length λ a q only qualitatively.
The role of water’s own ions in the external field screening can be consistently treated in the frameworks of the theory of reversible chemical reactions, often called the theory of “ionic equilibria” [16]. Its modification, outlined in [17,18] and allowing one to talk about the Fermi energy in the band gap of water E g , implies a deep analogy between the properties of dilute electrolytes and those of doped semiconductors [19].
Casting aside the details of calculus given in Ref. [14], we present the final results for screening length λ a q :
λ a q 2 = 4 π e 2 ϵ a q T ( N + ( a q ) × N ( a q ) ) 1 / 2 ,
N + ( a q ) × N ( a q ) = N 0 , + ( a q ) · N 0 , ( a q ) · exp ( E g k B T ) .
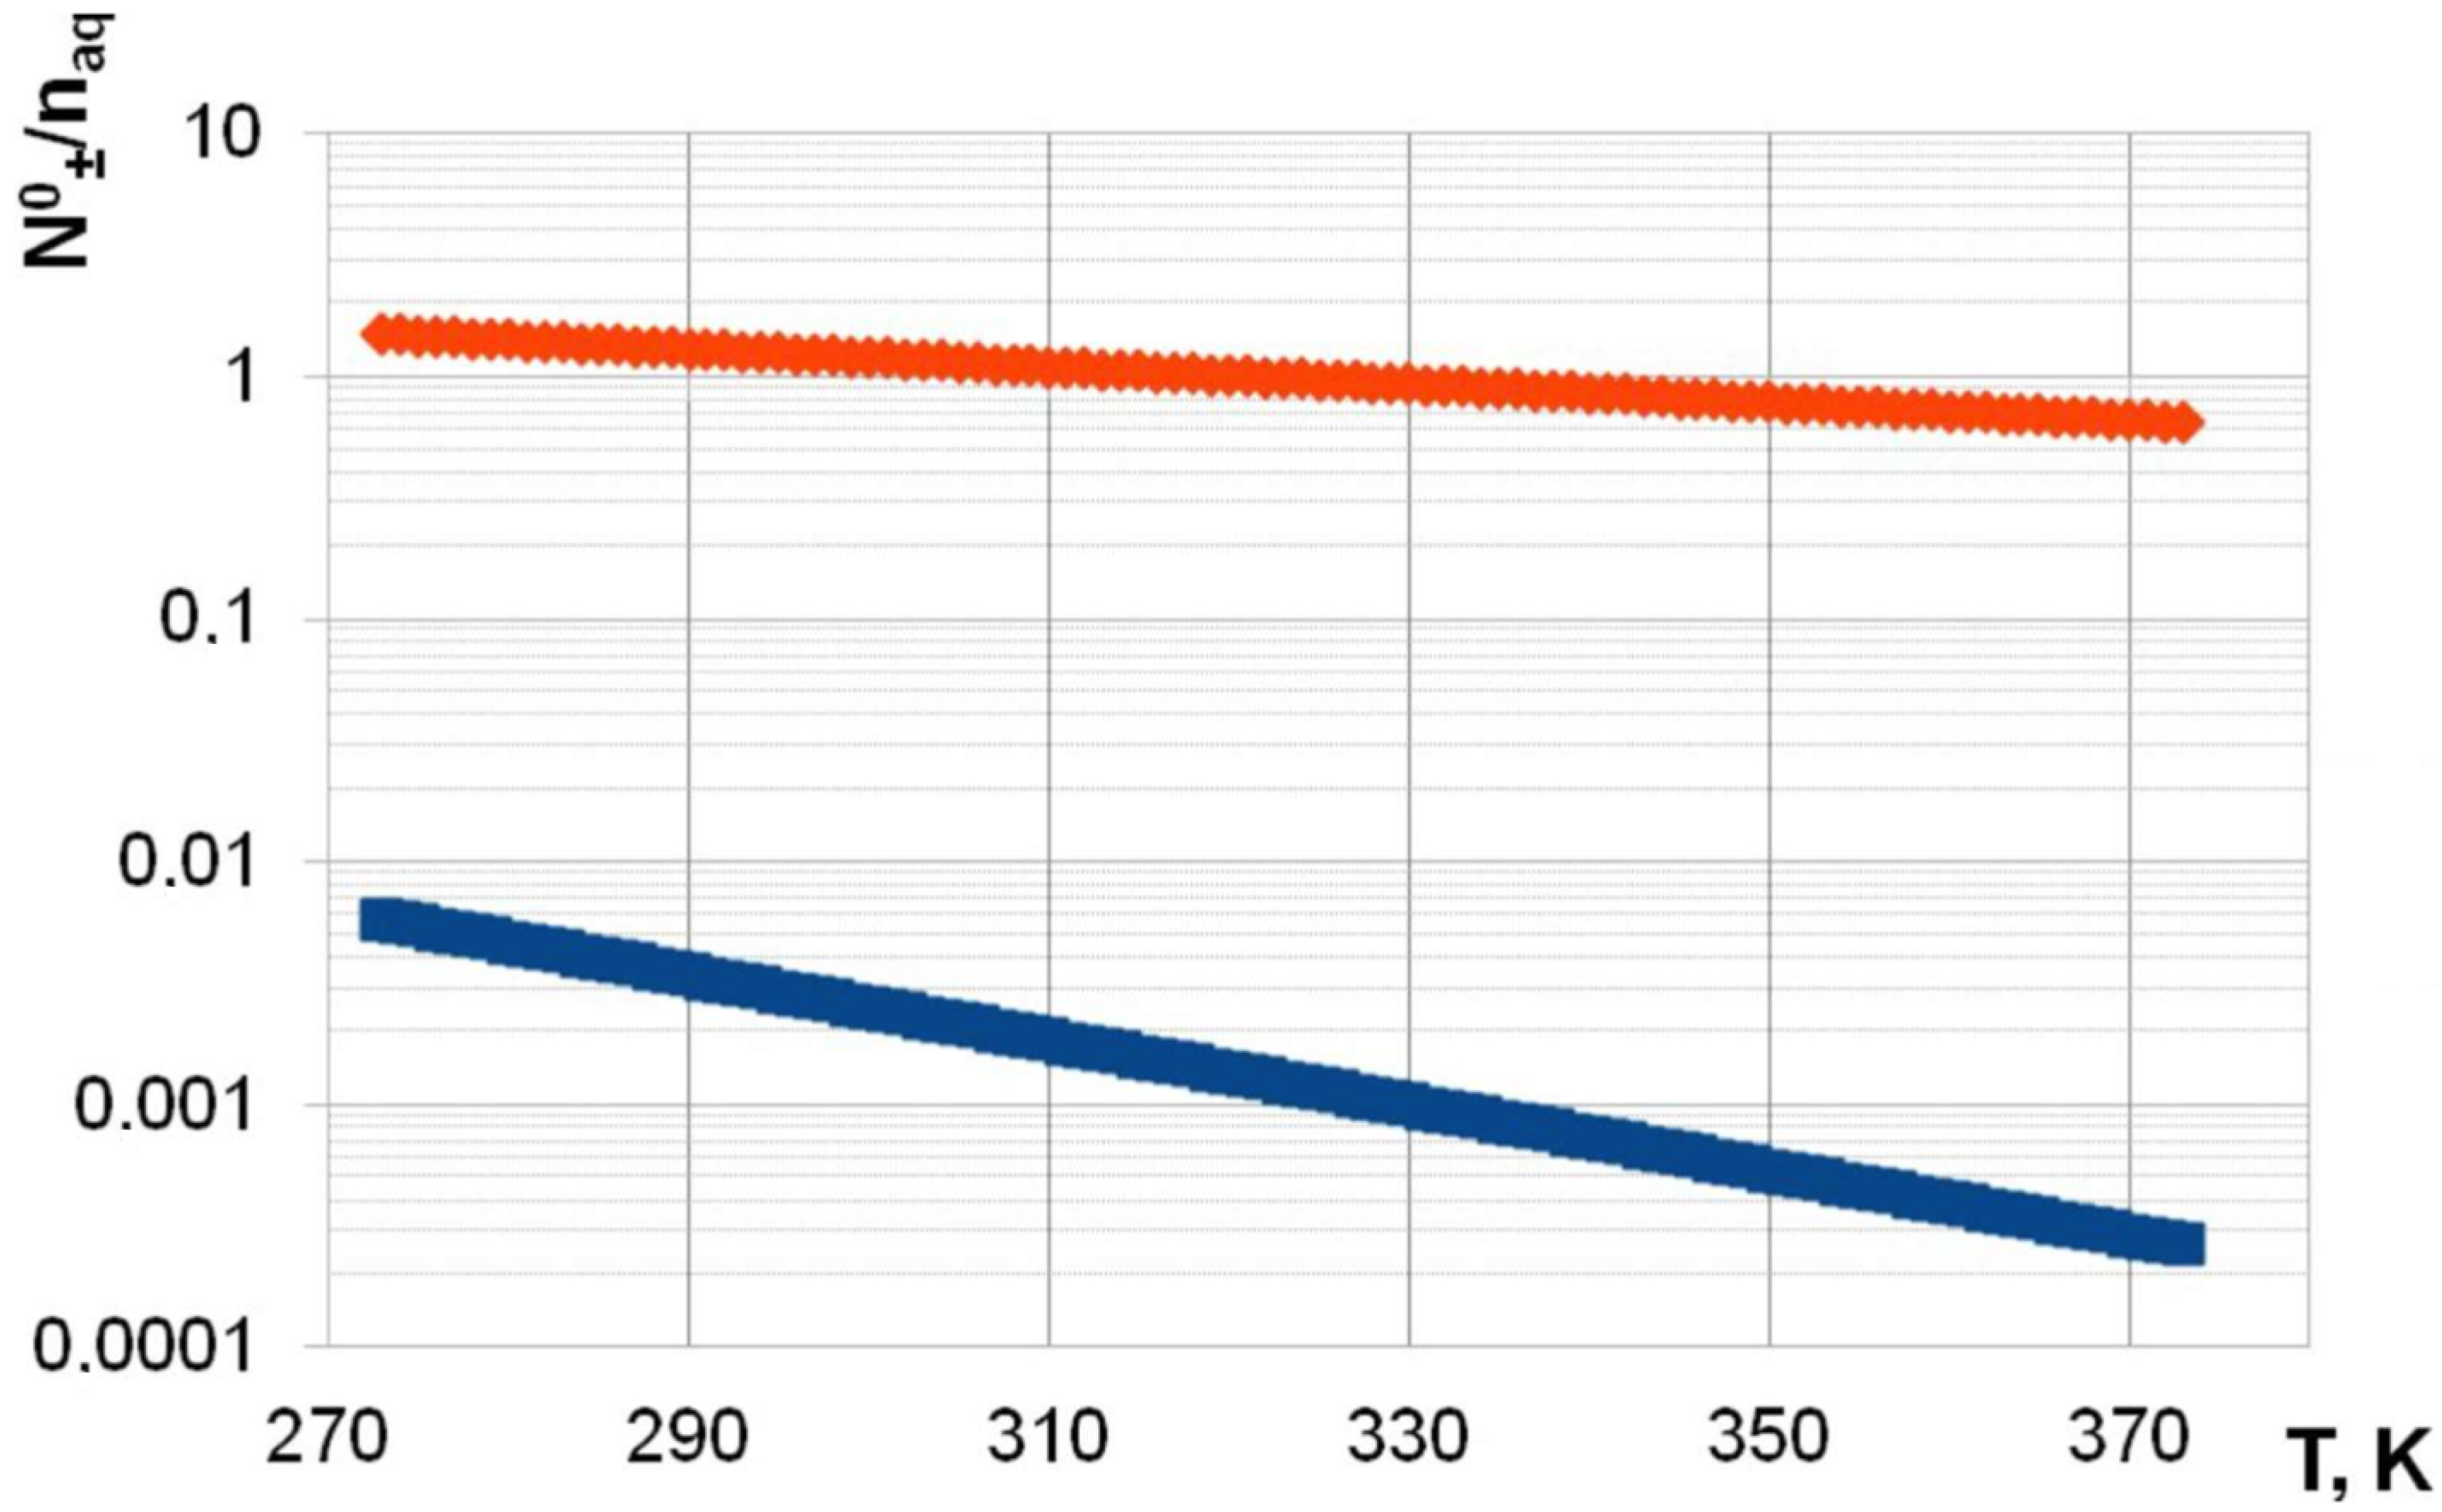
Equation (14) is obtained in the assumption of validity of the Boltzmann approximation (Equation (8)). The temperature dependencies of N 0 , + ( a q ) and N 0 , ( a q ) calculated in [18] based on the experimentally measured “ionic product of water” are presented in Figure 3.
To summarize, screening length λ a q , contrary to Debye length λ D , does not depend on dopant density (while, as it is seen from Equation (10), λ D 2 N 0 ( d ) ).
Coming back to the concentration dependence of cell capacitance C ( ϕ ) , it is obvious that in absence of inclusions, it is determined by the value of screening length λ a q :
C = ϵ a q S 8 π λ a q ,
where ϵ a q is the dielectric constant of water. Factor “8” instead of “4” reflects the presence of two plates in a cell. The same concerns properties of the single ions near the metal–electrolyte interface (see Refs. [20,21]).

2.2. Role of the Image Forces in the Formation of a n Adsorption Layer at the “Metal–Pure Water” Interface

Above, we considered the features of screening in the bulk of a (1:1) dilute electrolyte and in particular in the bulk of pure water. In the vicinity of the “metal–pure water” interface, the image forces arising from their interaction with a metal electrode act on the protons and hydroxyls present in the water. The presence of these forces leads to the formation of an adsorption layer in the vicinity of the interface of“metal–pure water” and significantly affects the value of the screening length, leading to its strong renormalization: λ a q * λ a q .
The concentration of the ions ( q ± = ± | e | ) in water at distance z from the interface in presence of the image electric field is governed by Boltzmann distribution:
N ± ( a q ) ( z ) = N 0 , ± ( a q ) exp U ( z ) k B T ,
U ( z ) = z F ( ϵ 1 , ϵ 2 , z ) d z ,
where N 0 , ± ( a q ) is the concentration of ions in the bulk of water. The electrostatic force acting on the charged particle close to the vicinity of the interface between two semi-spaces with dielectric constants ϵ 1 and ϵ 2 is always attractive and has the form of
F ( ϵ 1 , ϵ 2 , z ) = e 2 ( ϵ 1 ϵ 2 ) 4 ϵ 1 ( ϵ 1 + ϵ 2 ) z 2 .
In the case ϵ 1 = ϵ a q , ϵ 2 , which corresponds to the situation at the “pure water–metal” interface, the potential energy of the ion in the vicinity of the latter takes a simple Coulombian form:
U ( ϵ a q , , z ) = U ( z ) = e 2 4 z ϵ a q , z > 0 .
When the external electric field is applied (for simplicity, we assume it to be weak enough so that the local values of the total electric potential φ ( z ) at each point satisfy condition | e | φ / k B T 1 ), the Poisson equation can be linearized with respect to φ , and it reduces to
d 2 φ d z 2 exp U ( z ) k B T φ λ a q 2 , φ ( z ) 0 .
Since potential energy U ( z ) enters in total φ ( z ) , Equation (20) is hardly solvable exactly. This is the reason why we use below the method of subsequent approximations that allows for us to estimate the effect of image forces on the value of screening length without claiming quantitative results.
Let us integrate Equation (20) over the interval ( R ± , ) , where the lower limit R ± cuts off the singularity in U ( z ) . The physical meaning of these constants is discussed below. Taking into account boundary conditions φ ( z ) 0 , we arrive at
λ a q 2 d φ ( z ) d z z = 0 = R ± exp U ( z ) k B T φ ( z ) d z
On the right-hand side of this equation, let us substitute the potential φ ( z ) in its unperturbed Debye form, φ 0 ( z ) = φ ( 0 ) exp ( z / λ a q ) . Introducing screening length λ a q * , renormalized by image forces as ( λ a q * ) 1 = φ ( 0 ) / φ ( 0 ) , we find
( λ a q * ) 1 = 1 λ a q 2 R ± exp U ( z ) k B T z λ a q d z ,
the equation which relates λ a q * to λ a q . Substituting in it explicit Expression (17) and performing the integral, we find
λ a q * = λ a q λ a q R ± e 2 4 ϵ R ± k B T exp e 2 4 ϵ R ± k B T .
This value turns out to be exponentially small with respect to λ a q and length λ a q * 0 in limit R ± 0 .
The obtained result sheds light to the meaning of cut-off lengths R ± . An analogous problem already arose in the theory of 2 D charged systems [22] when the properties of free electrons at the surface of liquid helium were studied [23]. In this case, the singular image force, together with a high barrier preventing electrons from entering the liquid helium, leads to the formation of surface electronic states.
In contrast to the problem with electrons on the helium surface, which has quantum origin, the finiteness of R ± in the electrolyte–metal interface problem should have a classical origin. Among the possible candidates for the cut-off parameter R ± are the non-ideality of the metal–pure water interface, the presence of uncontrolled impurities that prevent water from being considered perfectly pure, etc. In any case, this fundamental divergence is clearly evident in the impedance interpretation of the conductivity anomalies in comparison to the predictions of Maxwell’s theory.
Electrolytic capacitance (15) should also be renormalized, respectively: the role of screening length λ a q in it passes to λ a q * , but we see below that this is not the final adjustment.

3. Impedance Measurements and Discrepancy of Their Results with Maxwell’s Theory

In order to understand the reason for the enormous discrepancy between the results of impedance conductivity measurements in suspensions and the predictions of Maxwell’s theory, let us turn to the details of data processing in the corresponding experiments.

3.1. Impedance Measurements and Their Subtleties

In the simplest case, impedance diagnostics deal with an RC circuit, where the time-dependent charge Q ( t ) at the plates of capacitor obeys equation [9,24]
R d Q ( t ) d t + Q ( t ) C = E ( t ) ,
where E ( t ) = E 0 cos ( ω t ) is the ac voltage applied to them. In our case, R = L / ( σ S ) is the resistance of the liquid between the flat electrodes, L is the distance between them (the length of the cuvette), σ is the conductivity of the electrolyte filling the cuvette, S is the area of the electrodes, C is the capacitance of the flat capacitor consisting of the electrodes and the electrolyte between them. As shown below, it is the latter parameter that requires special attention when working with electrolytic suspensions (see [10]). It is the failure to take into account the dependence of its value on the properties of the inclusions contained in the suspension that leads to the apparent contradiction between conductivity measurements and Maxwell’s theory.
Applying Equation (24) to the analysis of electrolyte conductivity impedance measurements, the authors usually make a series of assumptions.
  • On the left-hand-side of Equation (24), Maxwell’s formula (1) for conductivity is used. The latter accounts for the current which occurs as the response to the electric field applied but ignores the diffusion contribution related to chemical potential gradient ζ ( z ) [25] (similar to the thermoelectric contribution, but proportional to ζ instead of T ). It is not present in Definition (1) and, as a consequence, it is not required in Equation (24).
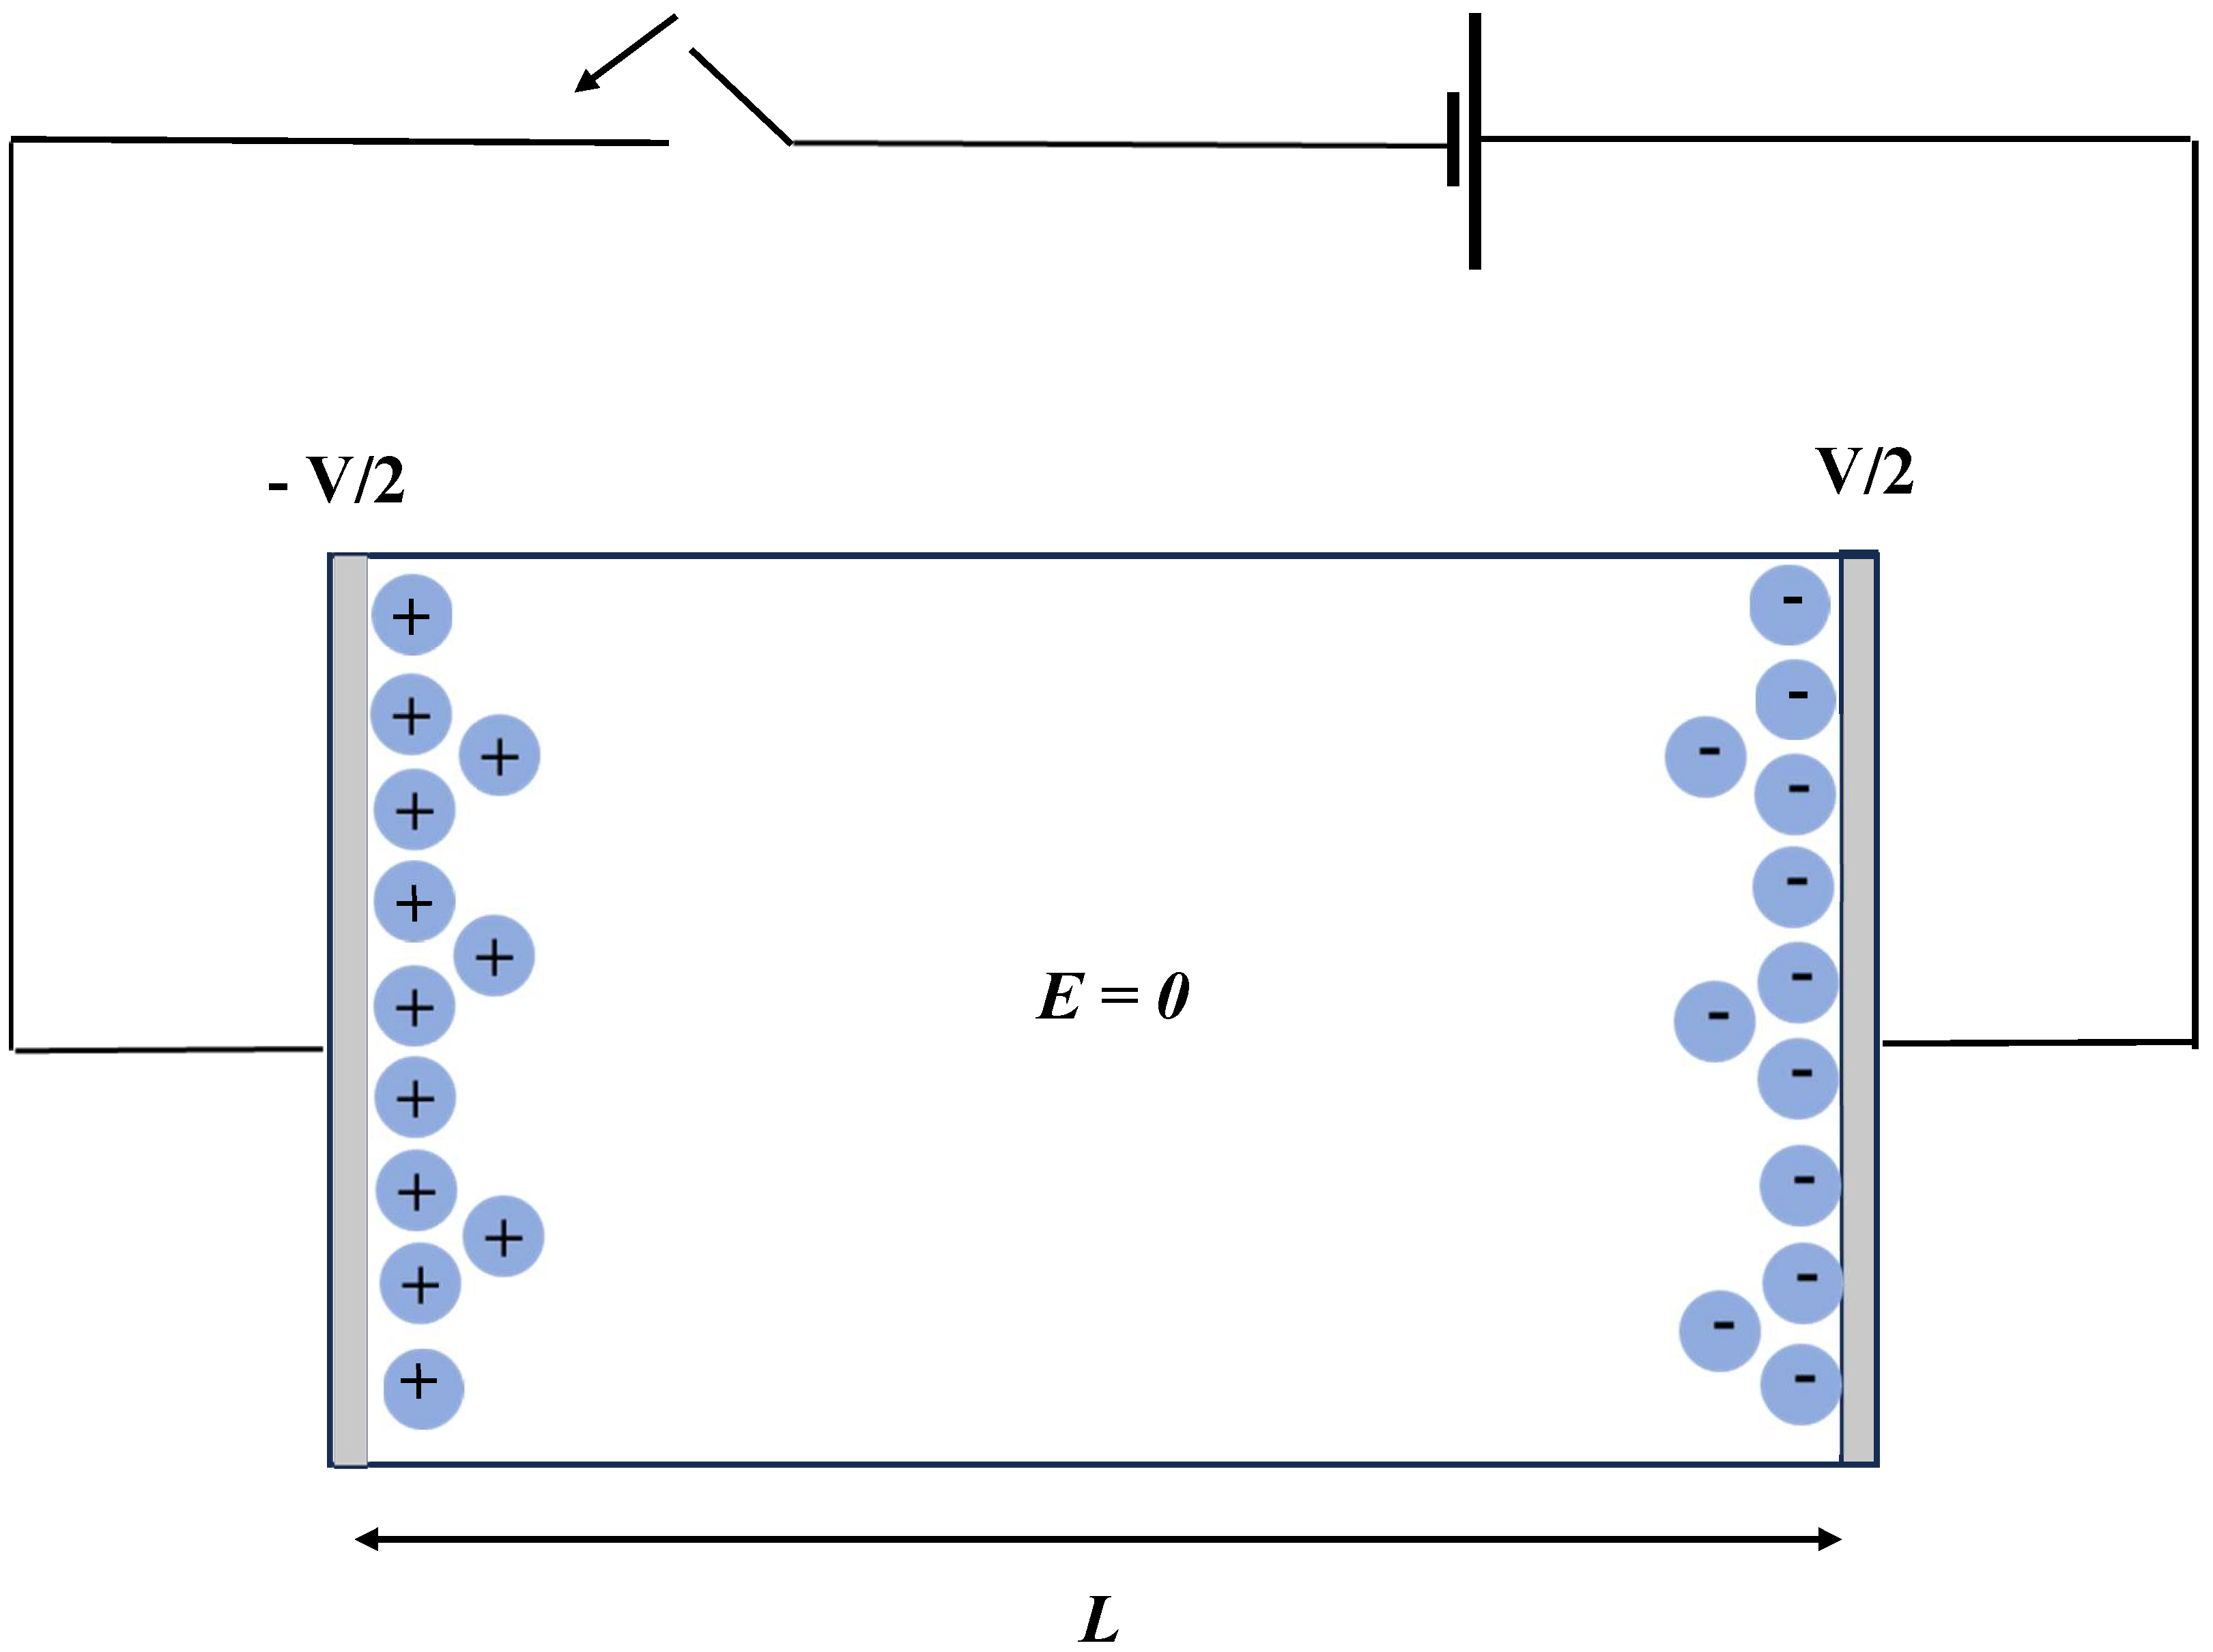
  • The second term of Equation (24) also needs a comment. Different realizations of impedance circuits (Winston bridges, etc., see [9,24]) may contain a number of capacitances performing different functions in the measurement circuit. It is usually assumed that the main contribution to the capacitance, which appears in Equation (24), comes from the electrolyte-filled cell capacitance C ( ϕ ) (schematically represented in Figure 4). In radio engineering, the value of such electrolytic capacitor is determined by the Debye length for the solvent (see, e.g., [24]).
We have already saw above how sharply this value can change due to the electrostartic image effects, when the electric field is concentrated in the very narrow domains near the electrodes; in the bulk of the cell it is zero. It is the thickness of these two domains, which we estimate below, that determines the value of capacitance C ( ϕ ) .
  • We note that capacitance C ( ϕ ) is also affected by the nature of ion motion in the measuring cell volume. Therefore, the properties of the accumulation layers leading to the main dependence of the cuvette capacitance on the inclusion concentration also depend on the abovementioned current generated by the gradient of ionic chemical potentials (see, for example, [24,26]). Nevertheless, in the following discussion, in the wake of other authors, we accept the value of capacitance C ( ϕ ) in its static limit using Equation (24) in the a c regime.

3.2. The Origin of Discrepancies

It is natural to separate the discussion of the origin of discrepancies between the measurement of suspension’s conductivity versus nanoinclusion concentration and predictions of Maxwell’s theory into two lines: well-conducting inclusions ( σ / σ 0 1 ) and dielectric ones ( σ / σ 0 1 ).
The properties of the suspensions of the first type hav been studied by the authors of [10] on the examples of colloidal solution described by the DLVO theory [6,7]. In the best of successful linear fittings of the observed σ ( ϕ ) , the slope of this dependence is positive, but it exceeds up to three orders the one allowed by Maxwell’s theory (which tends to three when σ / σ 0 1 ). This overwhelming inconsistency was explained by the formation of the accumulation layer of DLVO colloids at the “electrolyte–metal” interface which drastically decreases the effective screening length of the electric field.
The situation in suspensions containing dielectric inclusions is quite different. The anomaly here first implies a sign change in derivative d σ ( ϕ ) / d ϕ , which is not the case in DLVO colloidal solutions. In addition, the solvent of dielectric nanoparticle suspensions is generally purer than that in the case of colloidal solutions. The latter circumstance contributes to manifestation of the anomalously strong screening properties of the “metal–solvent” interface. The data of Ref. [11] for alcohol-based diamond powder suspensions reliably prove the above statements (Figure 2).
The appearance of a layer of neutral nanoparticles at the “metal-e-lectrolyte” interface radically changes its capacitance properties, especially if these are dielectric nanoparticles (for example, diamond powder). The presence of an adsorption layer of dielectric particles of effective thickness d ( ϕ ) increases the depth of penetration of the electric field into the cell. As a consequence, Equation (15) takes its final form:
C ( ϕ ) = ϵ a q ( ϕ ) S 8 π d ( ϕ ) + λ a q * ,
where λ a q * is determined by Equation (23) (or its analogue for alcohol), d ( ϕ ) 2 R 0 ψ s ( p ) (introduced after Equation (2), parameter R 0 here corresponds to the radius of the isolated dielectric nanoparticle).
Parameter ψ s ( p ) characterizes the effective filling of energetically advantageous sites on the solid substrate (adsorbent). It depends on partial pressure p arising due to the presence of nanoparticles.
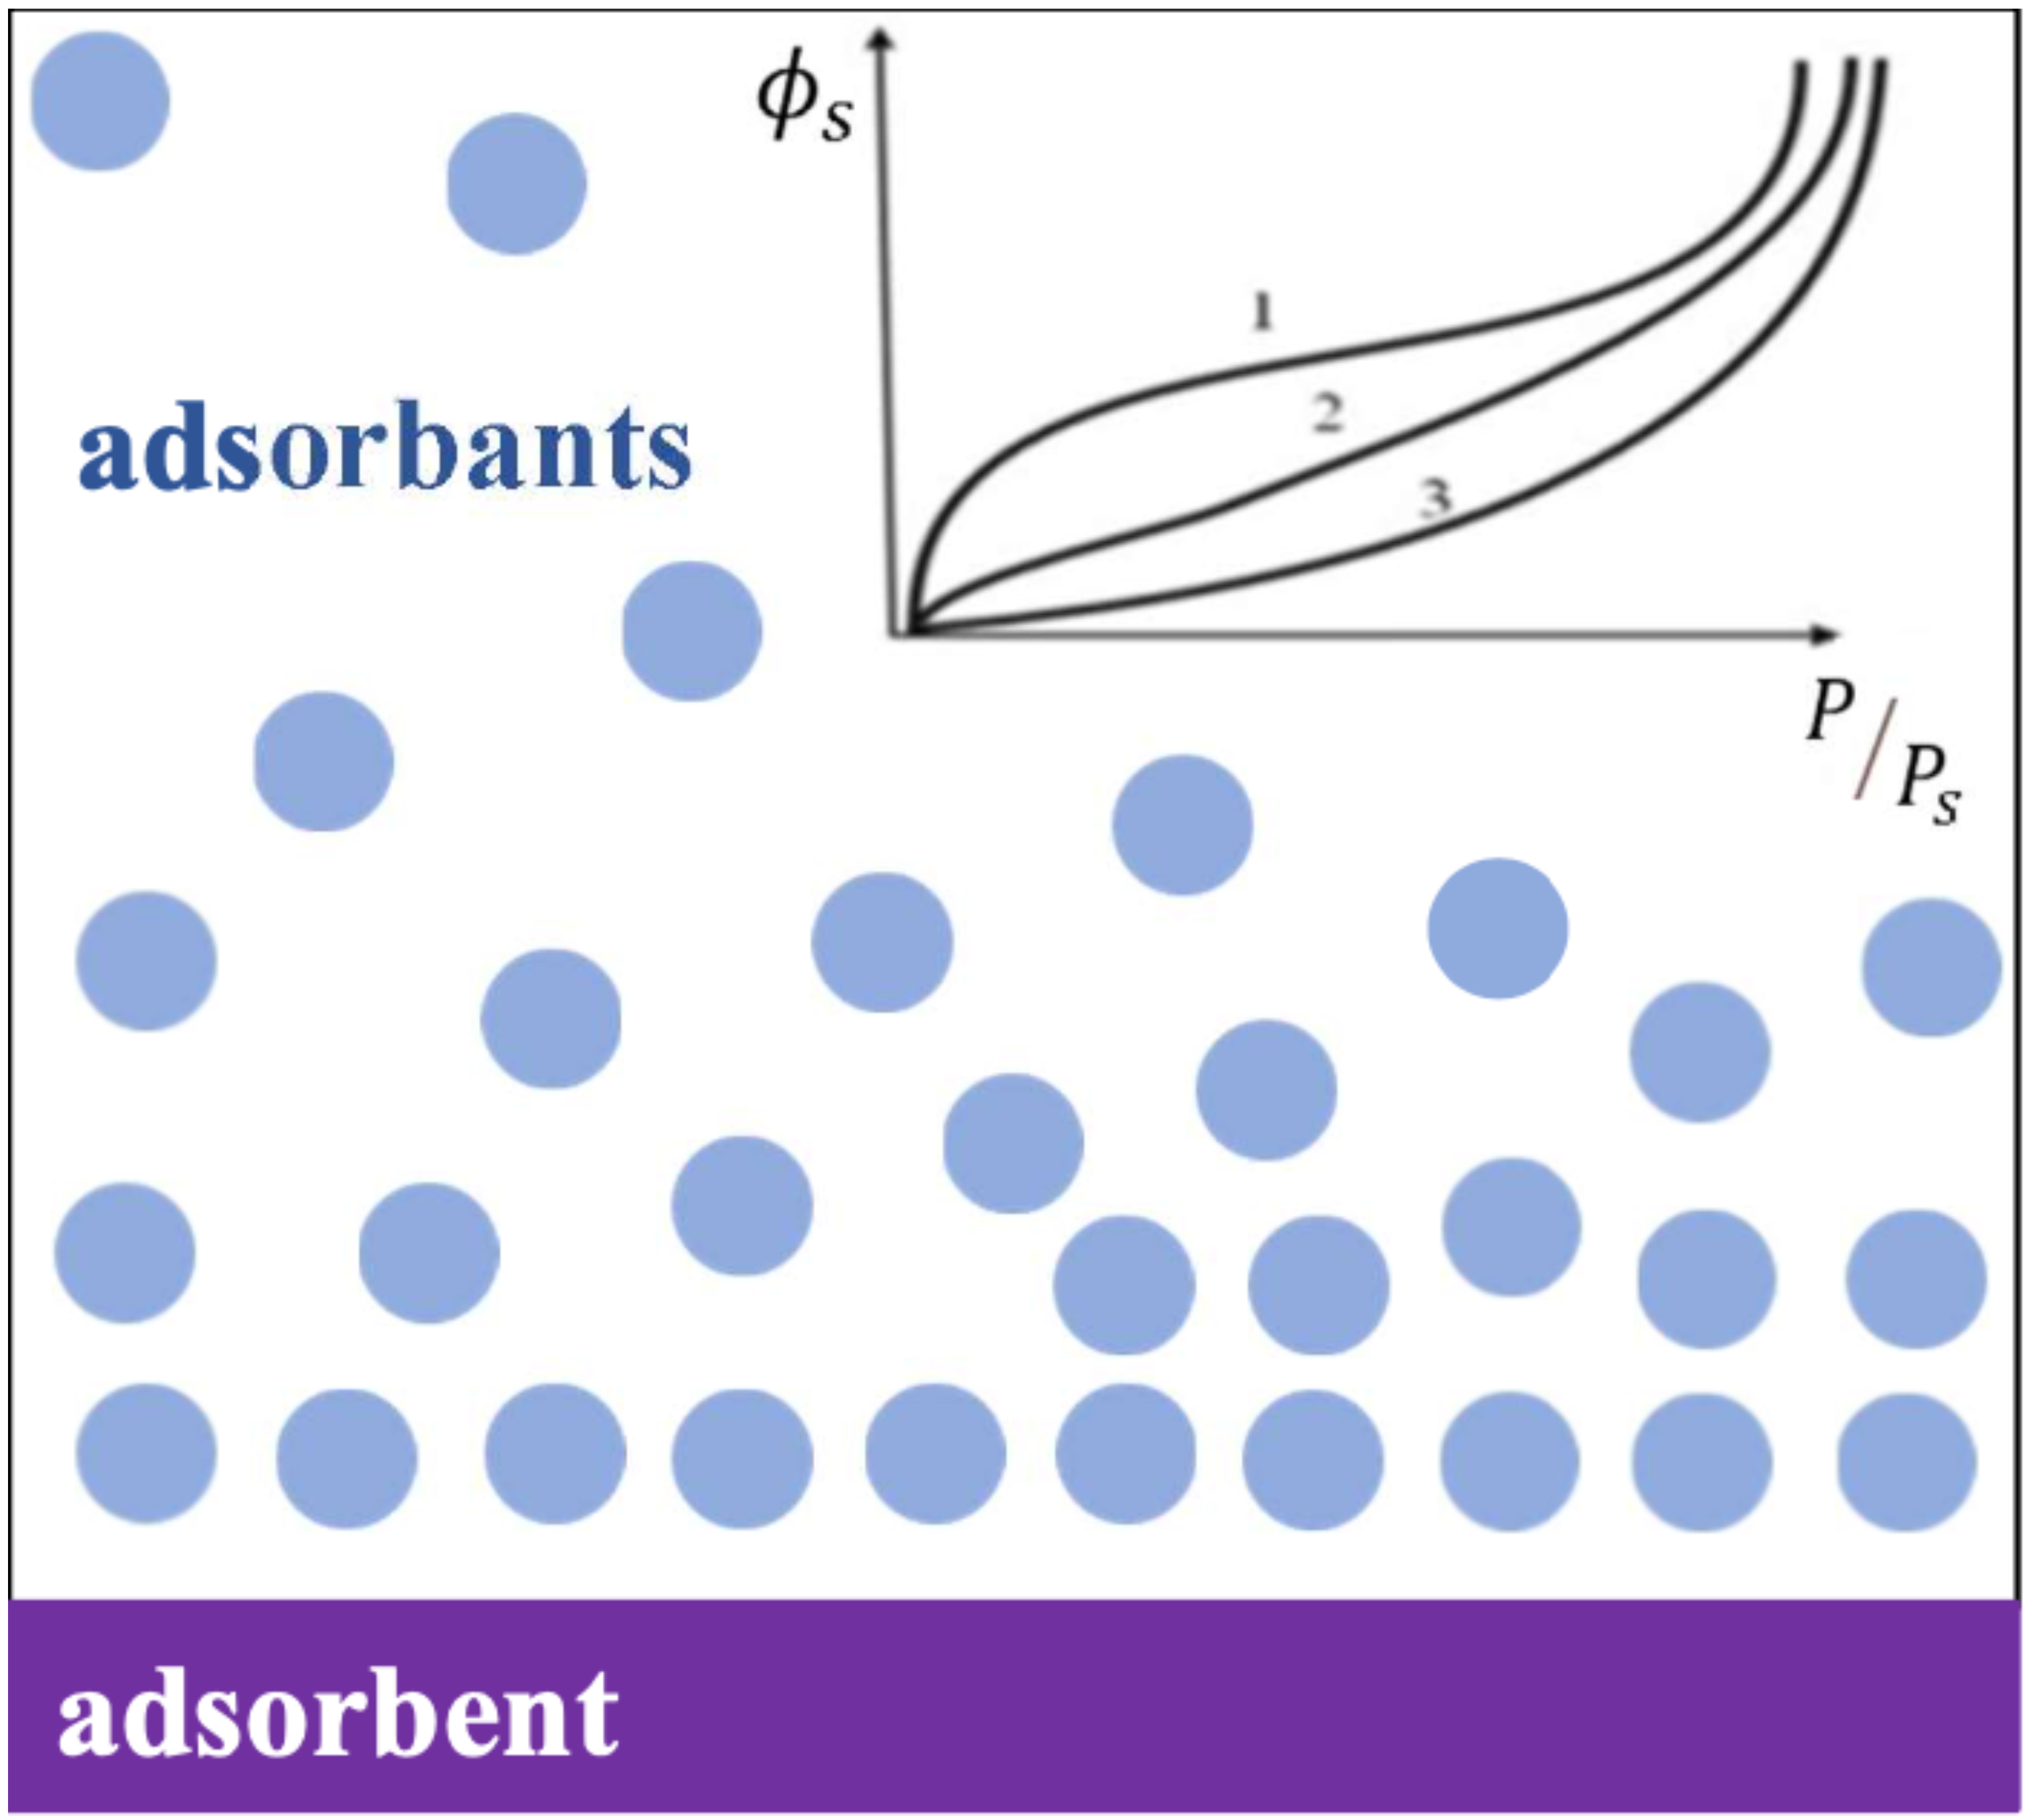
The scheme of multilayer adsorption is shown in Figure 5. Function ϕ s ( p ) , called the adsorption isotherm, for this case was calculated in Ref. [27],
ψ s ( p ) = γ × ψ s × p / p s ( 1 p / p s ) [ 1 + ( γ 1 ) p / p s ] ,
and it is called the Brunauer-Emmett-Teller isotherm. Here, ψ s corresponds to the maximum value of ψ s ( p ) , p s is the saturation pressure of the nanoparticles gas filling the electrolyte volume above the plane, γ is a numerical constant chosen from appropriate physical considerations (usually focusing on the explicit form of the adsorption isotherm). The influence of the constant γ on the overall structure of such isotherms can be seen in the inset of Figure 5.
The obtained Equation (25) presents the analogue of the expression for capacity of the cell filled by colloidal suspension renormalized by the accumulation layers formed in the vicinity of electrodes (see Formula (10) in Ref. [10]).

4. Analysis of the Experimental Results

The authors of Ref. [11] in their detailed work presented not only the results of measurements of the conductivity dependence on the nanodiamond volume fraction, but also plots of the dependence of the “loss factor” versus external frequency f for two different suspensions (see Figure 12 of Ref. [11]). They related position f max of the observed maximum in this dependence to the value of the “relaxation time” t r = 1 / ( 2 π f max ) , which decreases with growth of the concentration of nanodiamond particles suspended in ethylene glycol. Table 1 shows the values of relaxation times t r measured in this way as a function of the volume fraction of diamond nanoparticles for two different suspensions.
In the framework of impedance analysis (see Equation (24)), value t r 1 determines the position of the maximum of Fourier image of Q in its frequency dependence. At that, it is determined by the product of capacitance and resistance of the cell filled with the suspension: t r ( ϕ ) = R ( ϕ ) C ( ( ϕ ) (see Ref. [10]).
The analysis of the data of Table 1 performed in the assumption of C C ( ϕ ) = c o n s t indeed leads to the anomalous behavior of conductivity reported in Figure 2 with an unreasonably large increase in ratio σ ( ϕ ) / σ ( 0 ) .
However, the data on relaxation time t r collected in Table 1 can be interpreted differently. The validity of Maxwell’s formula (1) for the conductivity of a suspension of dielectric diamond nanoparticles is restored if we attribute the strong dependence t r on φ in the corresponding product R ( ϕ ) C ( ϕ ) not to R ( ϕ ) but to capacitance C ( ϕ ) (see Equation (25)).
Note that the assumption of the constancy R ( ϕ ) c o n s t is close to reality: according to Equation (1), σ ( ϕ ) / σ ( 0 ) 1 3 ϕ / 2 . Then, the data from Table 1 line up dependence R ( 0 ) C ( 0 ) / R ( ϕ ) C ( ϕ ) presented in Figure 6 and correlate well with Equation (25) for C ( ϕ ) .
The data presented in Figure 6 unambiguously confirm the validity of the hypothesis [10] about the importance of taking into account the properties of multiplier C ( ϕ ) in product R ( ϕ ) C ( ϕ ) to explain the anomalous conductivity growth compared to the predictions of Maxwell’s theory. They allow for a consistent interpretation based on Equations (1)–(25) for cuvette capacitance C ( ϕ ) , which indicates its marked decrease with increasing ϕ due to the adsorption processes of nanoparticles at the metal–electrolyte interface.
It is worth to note the high technological level of conductivity measurements of the suspensions containing insulating nanoparticles. In the work of Zyla et al. [11], their size reaches R 0 4 nm. Today, it sets a record in research of the effect of diminishing nanoparticle size on the increase in conducting properties of such solutions. Such tendency is still recognized by the authors of Ref. [28] where reduction in the size of insulating nanoparticles is suggested in order to increase their effect on suspension conductivity. The physical understanding of this tendency is still absent, raising additional interest for the development of Maxwell’s theory which in its classic form does not answer these appeals.

5. Conclusions

As was mentioned in the Introduction, the main goal of this work is to extend the approach proposed in Ref. [10] to suspensions containing dielectric nanoparticles. Staying within the framework of Maxwell’s theory, such an extension apparently should not cause any special problems. The intrinsic conductivity of dielectric nano-particles is zero. This means (according to Formula (4)) that the effective conductivity of such a suspension should decrease with increasing nanoparticle concentration. In practice, as follows from Figure 2, the effect turns out to be directly opposite in sign and colossal in its magnitude. The value of σ ( ϕ ) shown in this figure exceeds σ 0 by orders of magnitude. We managed to resolve this paradox by applying the data analysis method proposed in [10].
We demonstrated that the treatment of ac measurements of suspension conductivity has to be performed with caution due to enormous dependence of cuvette capacitance on the concentration of nanoinclusions. The variation in the latter strongly affects the thickness of the adsorption layers occurring in the vicinity of the electrodes, which results in corresponding changes in total cuvette capacitance. It is the R C product which is in reality measured by the impedance technique. Consequently, in order to correctly extract from it the R ( ϕ ) dependence, which then needs to be compared with the predictions of Maxwell’s theory, nontrivial dependence C ( ϕ ) , which takes into account the adsorption of nanoparticles, must be taken into account.
The original part of our work was devoted namely to this problem. The final answer was provided in the text by Equation (23)) which is simple in appearance, physical in content, and very nontrivial in its mathematical derivation. It is necessary to stress the fundamental difference between the adsorption mechanisms in the case of conducting colloidal particles considered in Ref. [10] and the dielectric nanoinclusions discussed in this article.
Another important feature of this work was the discussion of the specific details of the experimental results of Ref. [11]. Such detailed presentation of the experimental procedures cannot be found in reviews [1,2,3]. The authors of Ref. [11] directly state that it is the R C which is measured in the experiment as the function of nanoparticle concentration. Then, dependence R ( ϕ ) is extracted from the latter to be compared with Maxwell’s theory assuming that the capacity of the cuvette is calculated in the standard way, also assuming C = c o n s t with the Debye length of the pure solvent in the denominator. Namely, this ignoring of the tremendous increase in cuvette capacitance in the presence of dielectric nanoinclusions due to their adsorption at the metal–electrolyte interface were the origin of the three-order discrepancy between the naive application of Maxwell’s theory and experimental finding. It is this enormous increase in capacitance that is attributed to resistance.
The experimental data from Ref. [11], necessary for comparison of two different ways of the their processing, are presented in Table 1.

Author Contributions

I.C.: Methodology, Formal analysis, Writing—review and editing, Visualization, Analysis of experimental data. A.V.: Methodology, Formal analysis, Writing—review and editing, Visualization. All authors have read and agreed to the published version of the manuscript.

Funding

This research was supported by the European Union’s Horizon 2020 Research and Innovation Programme: Under the grant agreement No. 731976 (MAGENTA).

Data Availability Statement

Data sharing is not applicable to this article as no new data were created or analyzed in this study.

Acknowledgments

The authors are grateful to Valeriy Shikin for valuable discussions and permanent interest to this work. A.V. is grateful to Xiamen University for hospitality.

Conflicts of Interest

The authors declare no conflicts of interest.

References

  1. Minea, A. A Review on Electrical Conductivity of Nanoparticle-Enhanced Fluids. Nano Mater. 2019, 9, 1592–1613. [Google Scholar] [CrossRef] [PubMed]
  2. Geng, Y.; Khodadadi, H.; Karimipour, A.; Safaei, M.R.; Nguyen, T.K. A comprehensive presentation on nanoparticles electrical conductivity of nanofluids: Statistical study concerned effects of temperature, nanoparticles type and solid volume concentration. Physica A 2020, 542, 123432. [Google Scholar] [CrossRef]
  3. Poongavanam, G.; Duraisamy, S.; Vigneswaran, V.S.; Ramalingam, V. Review on the electrical conductivity of nanofluids: Recent developments. Mater. Today Proc. 2021, 39, 1532–1537. [Google Scholar] [CrossRef]
  4. Maxwell, J. A Treatise of Electricity and Magnetism, 3rd ed.; Part II; Oxford University Press: London, UK, 1892; Volume 1. [Google Scholar] [CrossRef]
  5. Lucas, I.T.; Durand-Vidal, S.; Bernard, O.; Dahirel, V.; Dubois, E.; Dufrêche, J.F.; Gourdin-Bertin, S.; Jardat, M.; Meriguet, G.; Roger, G. Influence of the volume fraction on the electrokinetic properties of maghemite nanoparticles in suspension. Mol. Phys. 2014, 112, 1463. [Google Scholar] [CrossRef]
  6. Derjaguin, B.V.; Landau, L.D. Theory of the stability of strongly charged lyophobic sols and of the adhesion of strongly charged particles in solutions of electrolytes. Acta Phys. Chem. URSS 1941, 14, 633–662. [Google Scholar] [CrossRef]
  7. Verwey, E.; Overbeek, J. Theory of the Stability of Lyophobic Colloids; Elsevier: Amsterdam, The Netherlands, 1948. [Google Scholar]
  8. Heissenger, D.; Evers, M.; Palberg, T. Independent ion migration in suspensions of strongly interacting charged colloidal spheres. Phys. Rev. E 2000, 61, 5493. [Google Scholar] [CrossRef] [PubMed]
  9. Sommerfeld, A. Electrodynamics (Lectures on Theoretical Physics); N.Y Academic Press Inc.: New York, NY, USA, 1952; Volume 3. [Google Scholar]
  10. Chikina, I.; Nakamae, S.; Varlamov, A. On the ac Measurements of the Electrical Conductivity of Dilute Colloidal Electrolytes. Colloids Surfaces 2023, 7, 58. [Google Scholar] [CrossRef]
  11. Zyla, G.; Vallejo, J.P.; Fal, J.; Lugo, L. Nanodiamonds—Ethylene Glycol nanofluids: Experimental investigation of fundamental physical properties. Int. J. Heat Mass Transf. 2018, 121, 1201–1213. [Google Scholar] [CrossRef]
  12. Lewis, G.; Randall, M. Thermodynamics and the Free Energy of Chemical Substances; McGrow-Hill: New York, NY, USA; London, UK, 1923. [Google Scholar]
  13. Debye, P.; Hückel, E. The theory of electrolytes. I. Lowering of freezing point and related phenomena. Phys. Z. 1923, 24, 185–206. [Google Scholar]
  14. Shikin, V. Screening Properties of Pure Water and Dilute Aqueous Solutions. JETP Lett. 2023, 118, 343. [Google Scholar] [CrossRef]
  15. Robinson, R.; Stokes, R. Electrolyte Solutions; Butterworths Scientific Publications: London, UK, 1959. [Google Scholar]
  16. Butler, J. Ionic Equilibrium; Addison-Wesley: Reading, MS, USA, 1964. [Google Scholar]
  17. Levchenko, A.; Meghov-Deglin, L.; Chikina, I.; Shikin, V. Capacitance-voltage characteristics of metal-insulator-semiconductor structures (Review article). Low Temp. Phys. 2019, 45, 823. [Google Scholar] [CrossRef]
  18. Chikina, I. Phenomenological Statistics of Diluted Charge d Solutions. Low Temp. Phys. 2022, 48, 594–611. [Google Scholar] [CrossRef]
  19. Blakemore, J. Semiconductor Statistics; Pergamon Press: Oxford, UK; London, UK; New York, NY, USA; Paris, France, 1962. [Google Scholar]
  20. Onsager, L.; Samaras, N. The Surface Tension of Debye-Hückel Electrolytes. J. Chem. Phys. 1934, 2, 528–536. [Google Scholar] [CrossRef]
  21. Wagner, C. Die Oberflchenspannung verdnnter Elektrolytlsungen. Phys. Z. 1924, 25, 474–477. [Google Scholar]
  22. Ando, T.; Fauler, A.; Stern, F. Electronic properties of two-dimensional systems. Rev. Mod. Phys. 1982, 54, 437. [Google Scholar] [CrossRef]
  23. Shikin, V.; Monarcha, Y. Two-Dimensional Charged Systems in Helium; Nauka: Moscow, Russia, 1989. [Google Scholar]
  24. Martin, Z.B.; Thornton, K.; Ajdari, A. Diffuse-charge dynamics in electrochemical systems. Phys. Rev. E 2004, 70, 021506. [Google Scholar] [CrossRef] [PubMed]
  25. Landau, L.D.; Lifshitz, E.M. Electrodynamics of Continuous Media; Elsevier: Amsterdam, The Netherlands, 2013. [Google Scholar]
  26. Chikina, I.; Shikin, V. Accumulation layers in cryogenic electrolytes. Low Temp. Phys. 2020, 46, 1108–1113. [Google Scholar] [CrossRef]
  27. Brunauer, S.; Emmett, P.H.; Teller, E. Adsorption of Gases in Multimolecular Layers. J. Am. Chem. Soc. 1938, 60, 309–319. [Google Scholar] [CrossRef]
  28. Kalpana Sarojini, K.G.; Manoj Siva, V.; Singh Pawan, K.; Pradeep, T.; Das Sarit, K. Electrical conductivity of ceramic and metallic nanofluids. Colloids Surfaces A Physicochem. Eng. Asp. 2013, 417, 39–46. [Google Scholar] [CrossRef]
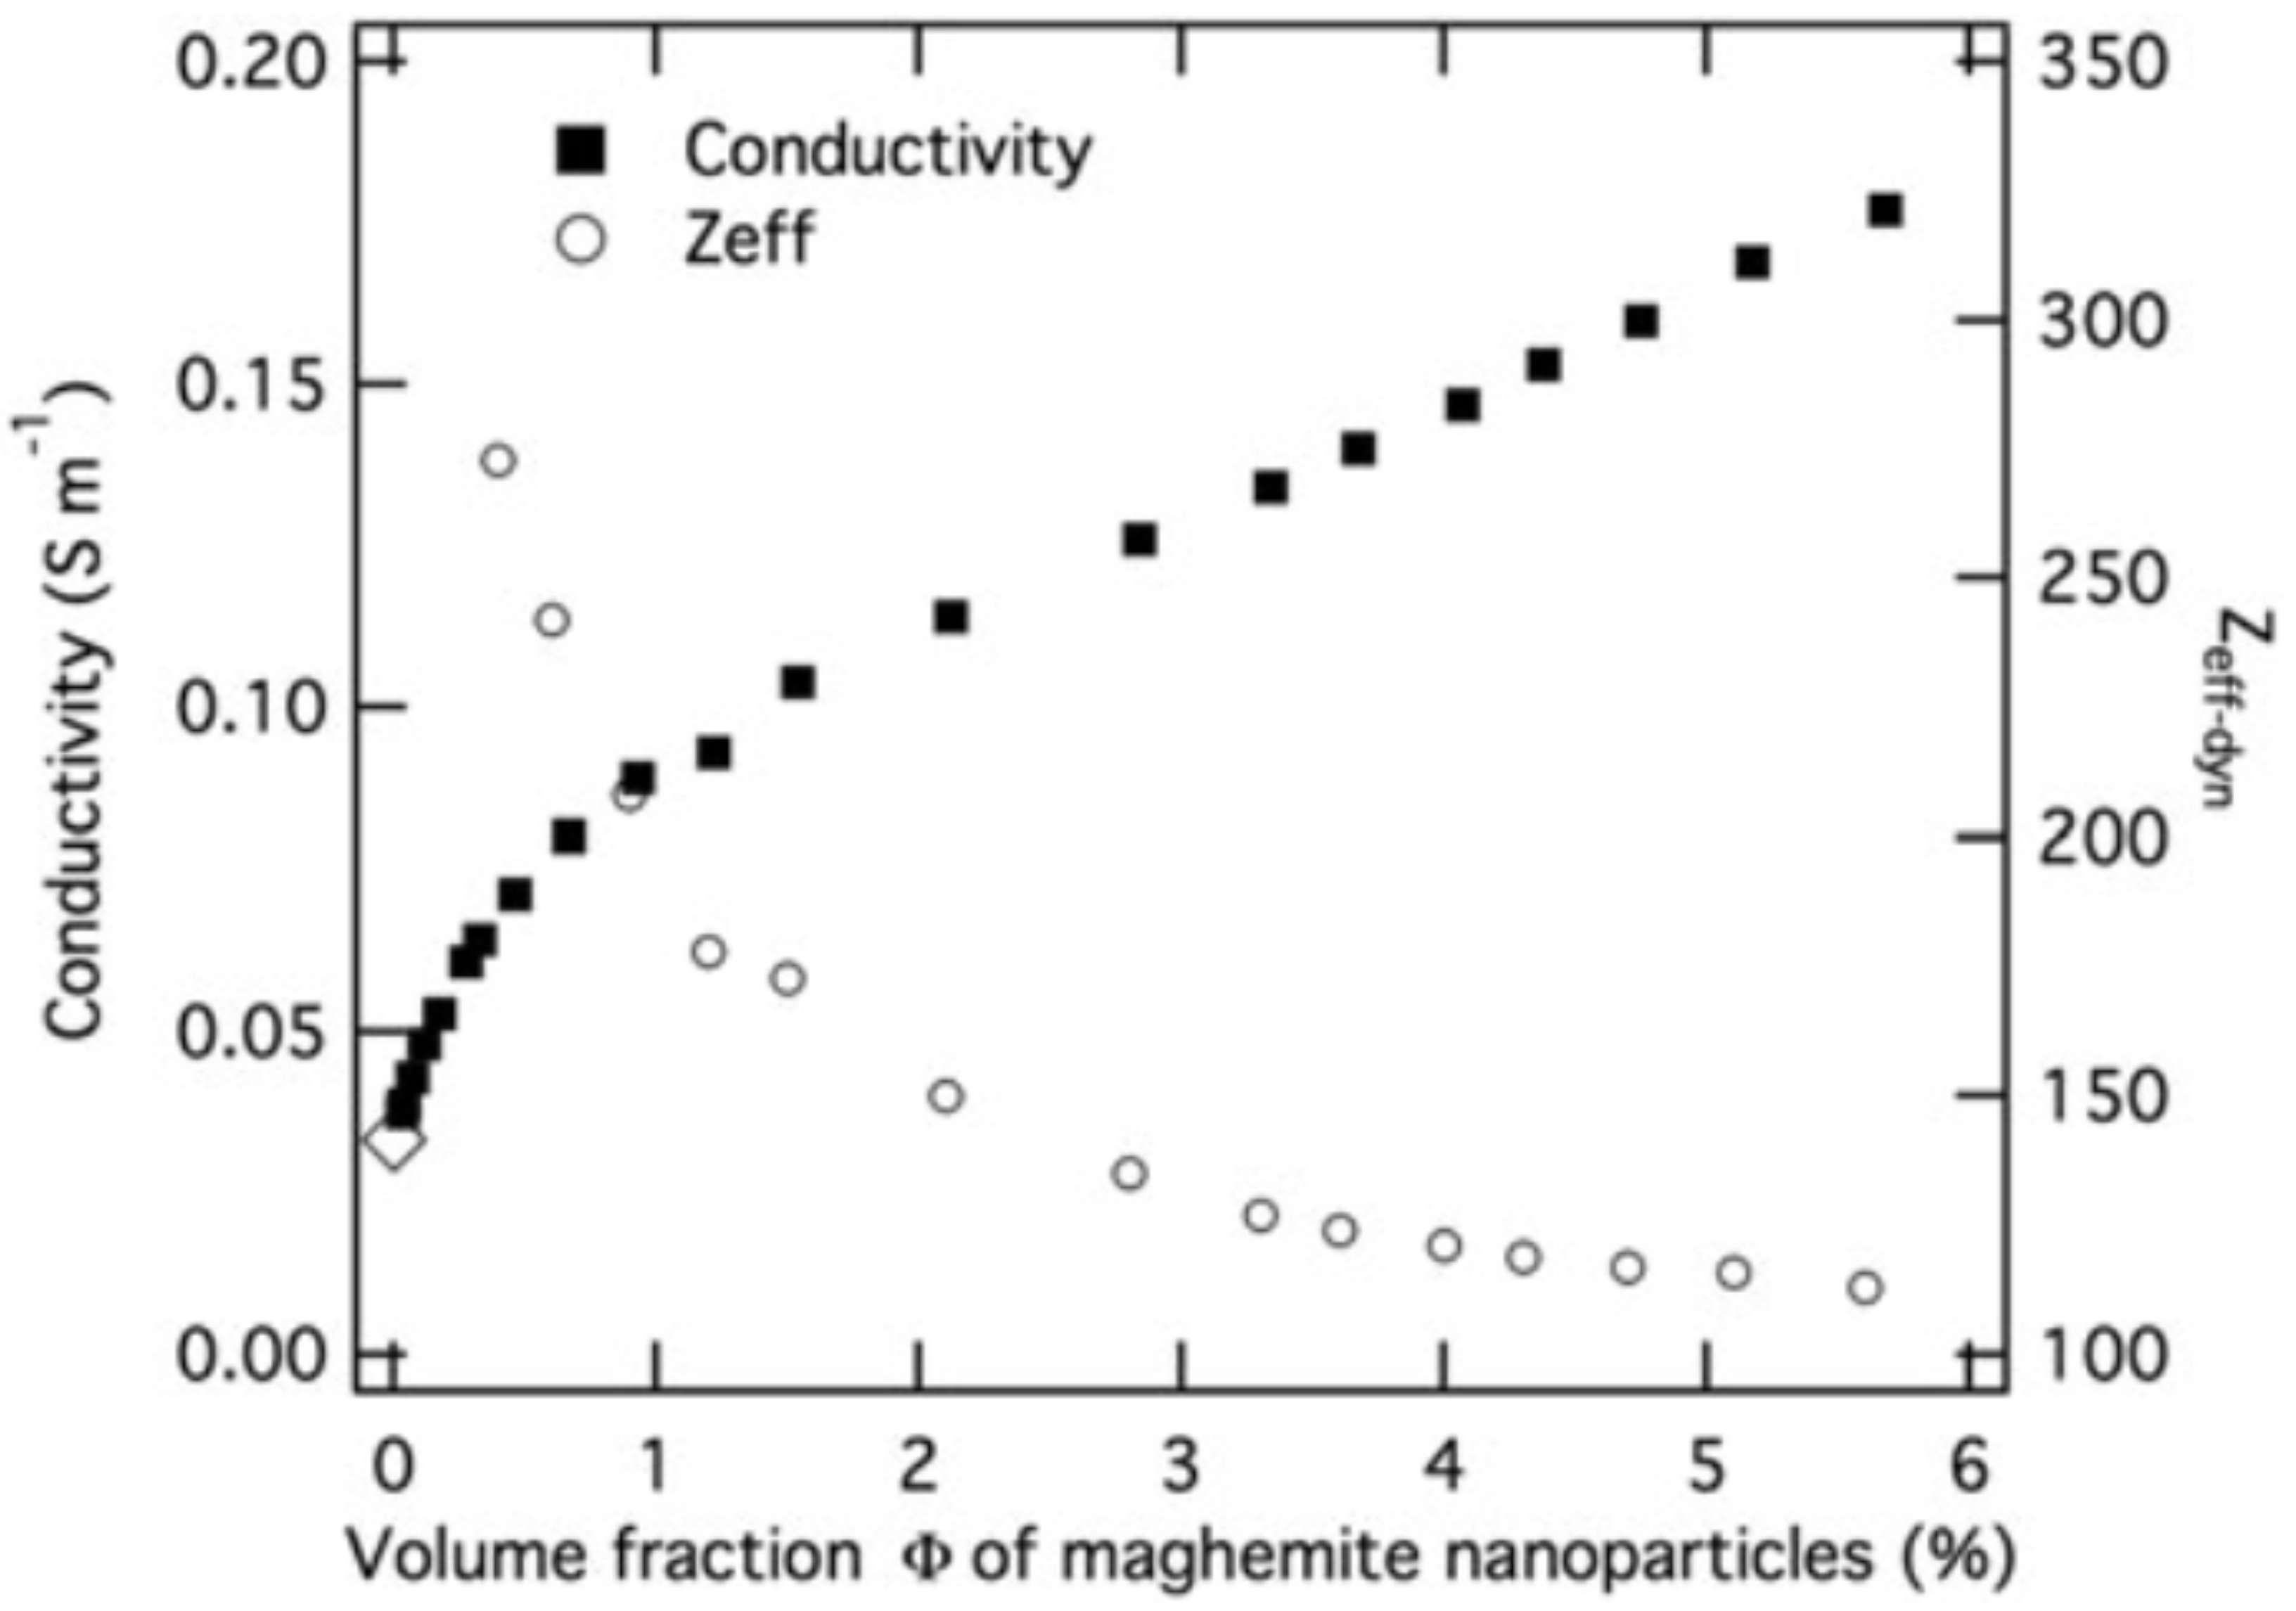
Figure 1. Conductivity of samples of maghemite nanoparticle colloidal solution prepared in H N O 3 at p H = 3.1 as a function of the volume fraction of nanoparticles (left scale). Dynamic effective charge e Z eff of maghemite nanoparticles as determined from a fitting procedure by using the MSA-transport theory to account for the experimental conductivity (right scale). Asymptote σ m a x ( ϕ ) (3) of Equation (1) would be presented here by the almost horizontal straight line at the height 0.04 S/m. The figure is taken from Ref. [5] and we are grateful to Taylor & Francis Ltd. (https://ww.tandfonline.com) for permission to use it.
Colloids 08 00034 g001
Figure 2. Conductivity enhancement of nano-diamand nanofluid at 298.15 K [11]. Black dots represent the result of measurements, dashed line represents the prediction of linear Maxwell’s theory σ ( ϕ ) / σ 0 = 1 3 ϕ / 2 (see Equation (4)). The solid line is the fitting of experimental results according to formula σ ( ϕ ) / σ 0 = 1 + 3734 ϕ . For better visibility, the relative positions of the solid line and the dashed line in the vicinity of the origin, indicated by a circle, is shown in the inset. The latter allows to better recognize the striking divergence between the observed values of conductivity and its predictions based on immediate application of Maxwell’s formula.
Colloids 08 00034 g002
Figure 3. The concentrations N 0 , + ( T ) red line, and N 0 , ( T ) blue line, calculated in Ref. [18]. Here, n a q is the concentration of water molecules.
Colloids 08 00034 g003
Figure 4. The sketch of a circuit. Voltage V is applied to suspension between parallel-plate electrodes separated by distance L.
Colloids 08 00034 g004
Figure 5. Details of the mechanism of reversible multilayer adsorption (Brunauer–Emmett–Teller adsorption) defined by Equation (26). The inset shows the effective thickness of the adsorbed layer at different variants of interaction between adsorbed particles and the substrate. Their structure to great extent depends on the constant γ , which is sensitive to the details of adsorbant–adsorbent and adsorbant–adsorbant interactions. If adsorbant–adsorbent interaction prevails in the system, a filled monolayer is first formed on the adsorbent surface, and then the following layers are filled. Such order of filling leads to the appearance of an S-shaped adsorption isotherm (Curve 1 in the inset). This isotherm shape is formed at γ > 20 . When γ 1 , the following layers start to form even before the complete filling of the first monolayer (Curve 3 in the inset). The interval of values 1 γ 20 is obviously intermediate (Curve 2 in the inset).
Colloids 08 00034 g005
Figure 6. Combination R ( 0 ) C ( 0 ) / R ( ϕ ) C ( ϕ ) based on the data for N D 97 E G (red circles) and for N D 87 E G (blue squares) in the assumption that R ( ϕ ) σ 1 ( ϕ ) with σ ( ϕ ) determined by Equation (1). The non-exponential character of the observed dependence leads to the conclusion that adsorption at the metal–electrolyte interface in the experiments [11] is of the multilayer nature and it follows according to scenario “2” (see the inset in Figure 5).
Colloids 08 00034 g006
Table 1. The values of t r ( ϕ ) for a cell filled with two different nanodiamond suspensions [11] (ND97-EG—Nano.Diamond 97-EthilenGlycol; ND87-EG—Nano.Diamond 87-EthilenGlycol). The two sets of diamond powders in the table have approximately the same nanoparticle size (∼4 nm) but different diamond contents: 97 % for ND 97 and 87 % for ND 87.
ϕ ND97-EG t r ( s ) ND87-EG t r ( s )
0.0000 1.07 · 10 2 1.07 · 10 2
0.0032 2.64 · 10 4 2.64 · 10 4
0.0080 9.63 · 10 5 1.89 · 10 4
0.0163 6.68 · 10 5 9.63 · 10 5
0.0338 2.51 · 10 5 9.63 · 10 5
Disclaimer/Publisher’s Note: The statements, opinions and data contained in all publications are solely those of the individual author(s) and contributor(s) and not of MDPI and/or the editor(s). MDPI and/or the editor(s) disclaim responsibility for any injury to people or property resulting from any ideas, methods, instructions or products referred to in the content.