Article

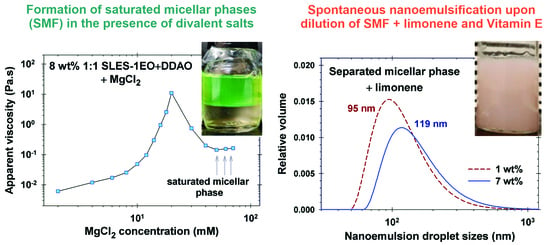
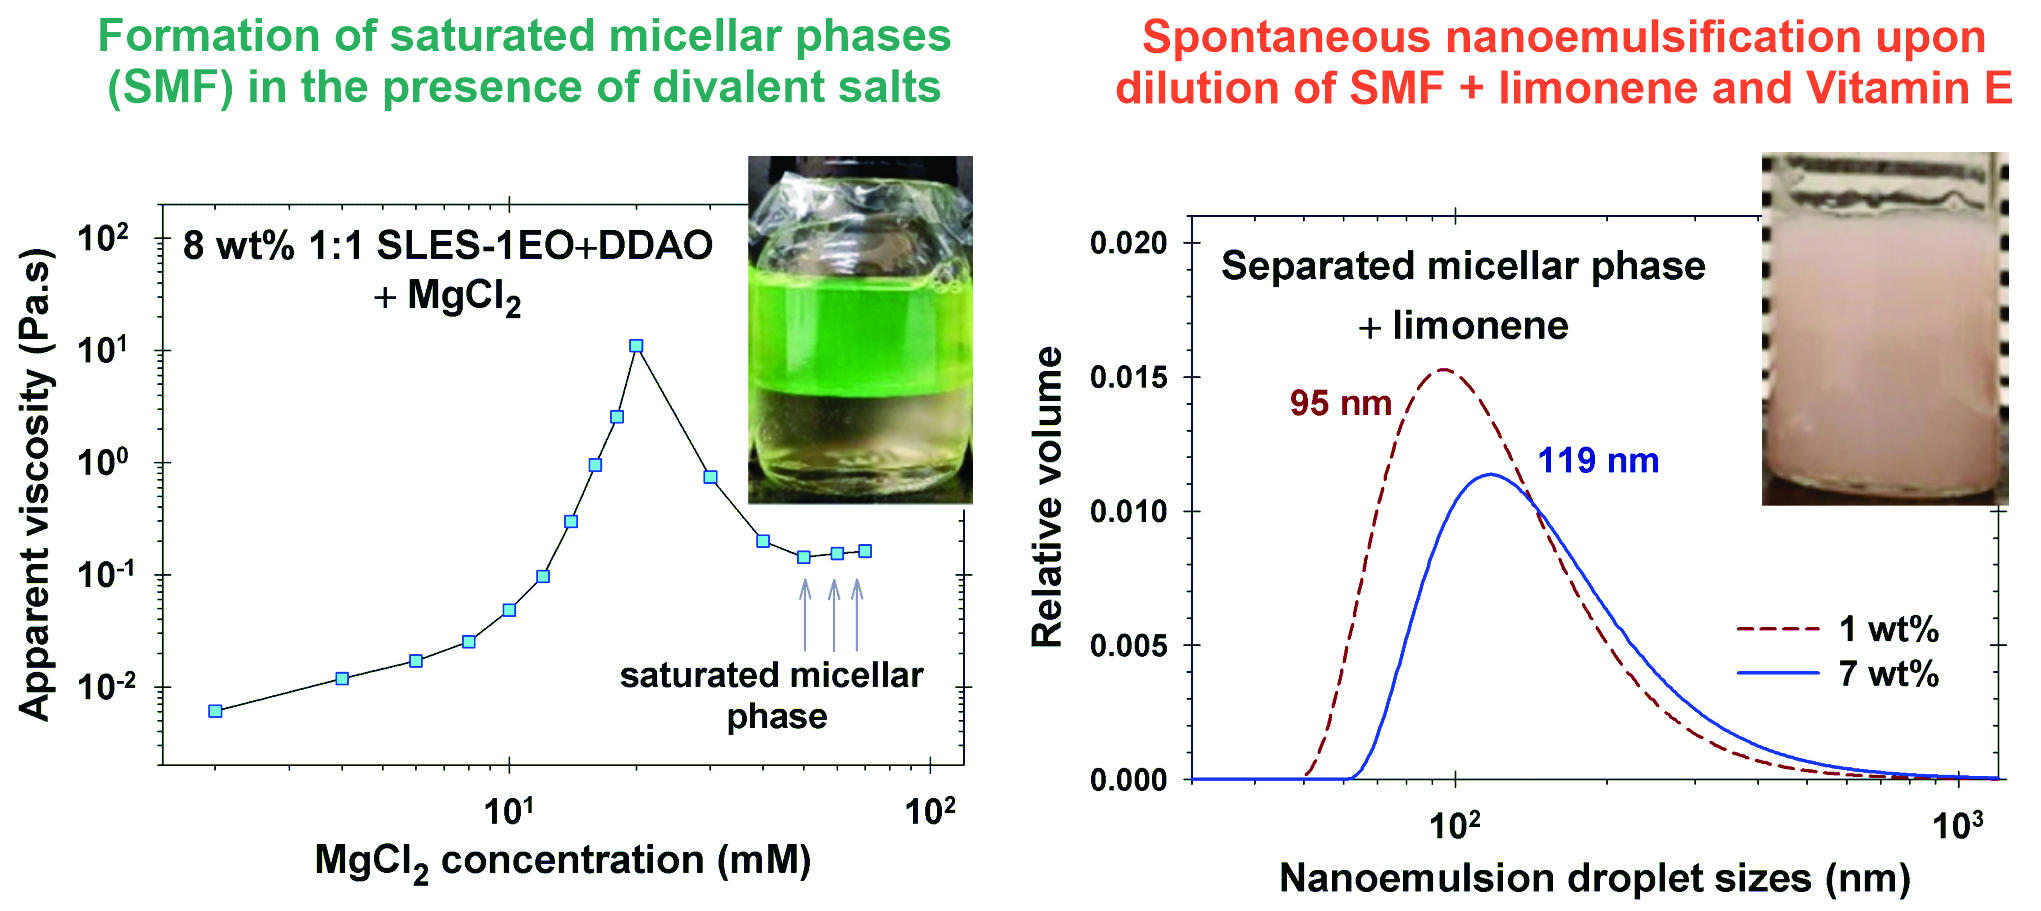
Saturated Micellar Networks: Phase Separation and Nanoemulsification Capacity

by
Tatiana G. Slavova
,
Gergana M. Radulova
and
Krassimir D. Danov
*
Department of Chemical and Pharmaceutical Engineering, Faculty of Chemistry & Pharmacy, Sofia University, 1164 Sofia, Bulgaria
*
Author to whom correspondence should be addressed.
Colloids Interfaces 2024, 8(1), 11; https://doi.org/10.3390/colloids8010011
Submission received: 15 December 2023 / Revised: 19 January 2024 / Accepted: 29 January 2024 / Published: 2 February 2024
(This article belongs to the Special Issue Recent Advances on Emulsions and Applications: Volume II)

Abstract

:
Different oils can be homogeneously dispersed in the network junctions of the separated bicontinuous micellar phases. Upon dilution, these dispersions spontaneously form nanoemulsions. The possibility of a micellar sponge phase formation in the case of mixtures with three anionic and two zwitterionic surfactants in the presence of divalent and monovalent salts is studied. The best results are obtained using sodium lauryl ether sulfate with 1 ethylene oxide group (SLES-1EO) and both cocamidopropyl betaine (CAPB) or N,N-dimethyldodecylamine N-oxide (DDAO) in the presence of an appropriate small amount of MgCl2 and CaCl2. Bicontinuous micellar phases can be produced also in high-salinity NaCl solutions. The bulk properties of these phases are independent of the concentration of the initial solutions from which they are separated, and their Newtonian viscosities are in the range from 0.3 Pa·s to 0.8 Pa·s. Both 8 wt% CAPB- and DDAO-containing sponge phases engulf up to 10 wt% limonene and spontaneously form nanoemulsion upon dilution with droplet sizes of 110–120 nm. Vitamin E can be homogeneously dispersed only in CAPB-containing saturated micellar network, and upon dilution, these dispersions spontaneously form nanoemulsions with smaller droplet sizes of 66 nm for both 8 diastereomers and 2 diastereomers mixtures of vitamin E.

Graphical Abstract

1. Introduction

The addition of salts to ionic and mixed surfactant micellar solutions leads to a dependence of the viscosity on the salt concentration with a maximum known in the literature as “salt curve” [1,2,3,4,5,6]. This behavior of the micellar solution is due to the growth of wormlike micelles with the rise of salt concentration and the formation of branched micelles. The subsequent increase in the salt concentration leads to a decrease in the viscosity, an increase in the degree of cross-linking in the branched micelles, and eventually, the formation of a saturated micellar network [7,8,9,10,11,12,13]. At high salt concentrations, the ionic surfactants are salted out and the solutions are phase separated.
Appel and Porte [14] have observed phase separations of isotropic micellar phases in solutions of cationic surfactants, cetylpyridinium bromide, and cetyltrimethylammonium bromide in the presence of electrolytes (NaClO3 and NaNO3). Porte et al. [7] suggested that the reason for the observed “L1/L1 phase separation” (with L1 one denoting the isotropic micellar phase) is the formation of infinite clusters of branched cylinders. Theoretical analysis [8] of the occurrence of crosslinks in semi-dilute solutions of giant wormlike micelles leads to the conclusion that it is possible to form a large saturated network from interconnected wormlike micelles, which results in a phase separation of the micellar network. Due to the disappearance of the endcaps of the wormlike micelles as they become energetically unfavorable in certain conditions (for example, in high salt concentrations in the case of ionic surfactant), the wormlike micelles are transformed into branched micelles. The formation of the multiconnected phase is the final state in the self-assembly of ionic surfactants with the increase in salt concentration: wormlike micelles → branched micelles → saturated micellar network [8,9,10,11,12,15].
Formation of branched micellar aggregates and saturated networks is observed not only for ionic surfactants at high salt concentrations but also for nonionic surfactants, such as polyoxyethylene alkyl ethers, with the rise in temperature (close to the cloud point) [16,17,18], and for alkyl glucosides, with the increase in surfactant concentration [19].
The interconnection of the branched micelles in a large saturated network leads to a phase separation [6,7,8,13,20,21,22]. In the recent study [23], the authors reported a phase separation of saturated micellar phase (bicontinuous micellar phase) from mixed solutions of sodium lauryl ether sulfate with 1 ethylene oxide group (SLES-1EO, Figure 1b) and cocamidopropyl betaine (CAPB, Figure 1d) in the presence of divalent salts (MgCl2, CaCl2, and ZnCl2). These divalent ions promote the formation of a separate phase due to the coalescence of the fluid aggregates (“drops”) from the saturated micellar network. The separated micellar phase is clear with a slight opalescence and a viscosity in the interval between 0.3 and 0.6 Pa·s. When put in contact with small fragrance molecules (limonene, linalool, citronellol, and benzyl salicylate), the separated micellar phase easily engulfs the oils and, upon dilution, forms nanoemulsions with droplet sizes of around 130 nm. The authors hypothesize that the oil is solubilized in the junctions of the saturated micellar network. As a result, the energy needed for the formation of nanoemulsions upon dilution of the solubilized oils in the multiconnected network is considerably less in comparison with the conventional methods that use a mechanical drop breakup. The small droplet size implies that the saturated micellar networks could find an application in pharmaceutics as vehicles for drug delivery [24,25,26,27,28,29,30].
In the literature [31], it is reported that mixtures of 1:1 amine oxide and alcohol ethoxylate show synergistic interactions with regards to cleaning performance when tested on vinyl floor tiles soiled with oil and particle soil. Combinations of amine oxides (dodecyldimethylamine oxide or tetradecyldimethylamine oxide) and anionic surfactants (sodium dodecyl sulfate or sodium dodecylbenzensulfonate) have a maximum in the pH of the solutions at 1:1 mole ratio [32,33], which is indicative of the formation of mixed micelles. The interaction between dodecyldimethylamine oxide (DDAO) and sodium dodecyl sulfate (SDS) molecules (in the presence and absence of NaCl) has been studied and a strong synergistic effect from the addition of the anionic surfactant has been reported in Refs. [34,35,36,37,38,39,40,41,42,43,44]. In Ref. [38], the authors found a strong interaction at pH = 8, which is evidenced by the reduction in the surface tension and the critical micelle concentration (CMC) of the mixed micellar solutions. The CMC vs. the mole fraction of SDS+DDAO mixtures has a minimum at the equimolar ratio [41]. Investigations of the crystallization and the composition of crystals formed in the mixed SDS+DDAO micellar systems have been performed in Ref. [44]. The authors reported that at low pH (pH = 2), the crystals contain both surfactants, while at alkaline pH (pH = 9), only SDS is present in the crystals. A mixture of the zwitterionic tetradecyldimethylamine oxide and the anionic dihydroperfluorooctanoic acid produces five phases with different microstructures—L1 phase, viscous L1 phase, two-phase L1/Lα regions, and slightly viscoelastic Lα phase [45]. The ternary phase diagram of DDAO–hexanol–water passes through six different regions, one of which is the L3 phase from a mixture containing amine oxide [46]. The freeze-fracture electron micrograph shows that the structure of the L3 is a connected bilayer-type structure. Both water and the bilayer form a multiconnected network, called therein the sponge phase. This phase is optically isotropic, with low viscosity and slightly turbid.
The interactions between SLES and DDAO molecules are less studied in the literature. The effect of adding DDAO to a ternary SLES/AOS/CAPB has been investigated in [47]. The addition of DDAO lowers the surface tension and the CMC and enhances the foaming properties of the surfactant mixture. The lower CMC of the anionic/zwitterionic/nonionic mixture has high cleaning performance, even at low concentrations. The presence of branched micelles in DDAO+SLES-1EO solutions is confirmed by cryo-transmission electron microscopy observations [48]. These micelles form an interconnected micellar network (at high pH values and salt concentration), which is similar to the bilayer structures in the bicontinuous (L3) phase. The branched micelles demonstrate a weak viscoelastic behavior while the dense micellar network exhibits a Maxwellian rheological behavior.
The aim of the present study is to obtain a wider set of anionic and zwitterionic surfactant combinations, which in the presence of inorganic salts form saturated micellar phases with a good nanoemulsification capacity. We have used anionic surfactants sodium dodecyl sulfate (SDS, Figure 1a), SLES-1EO, and sodium lauryl ether sulfate with three ethylene oxide groups (SLES-3EO) and zwitterionic surfactants CAPB and dodecyldimethylamine oxide (DDAO, Figure 1c). All these surfactants have broad applications in the products for personal care [3]. Moreover, DDAO has antimicrobial activity against Staphylococcus aureus and Escherichia coli [49], low potential for bioaccumulation in aquatic organisms, and bioconcentration in terrestrial organisms. The amine oxides are easily removable from wastewater by conventional sewage treatment and are nonvolatile and easily biodegradable under aerobic and anaerobic conditions [50]. The amine oxide-based surfactants in aerobic conditions are rapidly and easily converted into CO2, water, and biomass [51].
The structure of this paper is as follows. The materials and methods used are described in Section 2. In Section 3, we investigate the formation, separation, and rheological properties of saturated micellar phase formed from mixtures of zwitterionic (DDAO and CAPB) and anionic (SDS, SLES-1EO, and SLES-3EO) surfactants in the presence of different electrolytes (NaCl, MgCl2, CaCl2, and ZnCl2). The nanoemulsification properties and capacities of branched micellar structures and separated micellar networks in the presence of limonene (Figure 1e) and vitamin E (Figure 1f) are described in Section 4. The main conclusions are summarized in Section 5. In the literature, the authors have used “saturated micellar network”, “multiconnected micellar phase”, and “sponge micellar phase” as synonyms, and below, we follow this terminology.

2. Materials and Methods
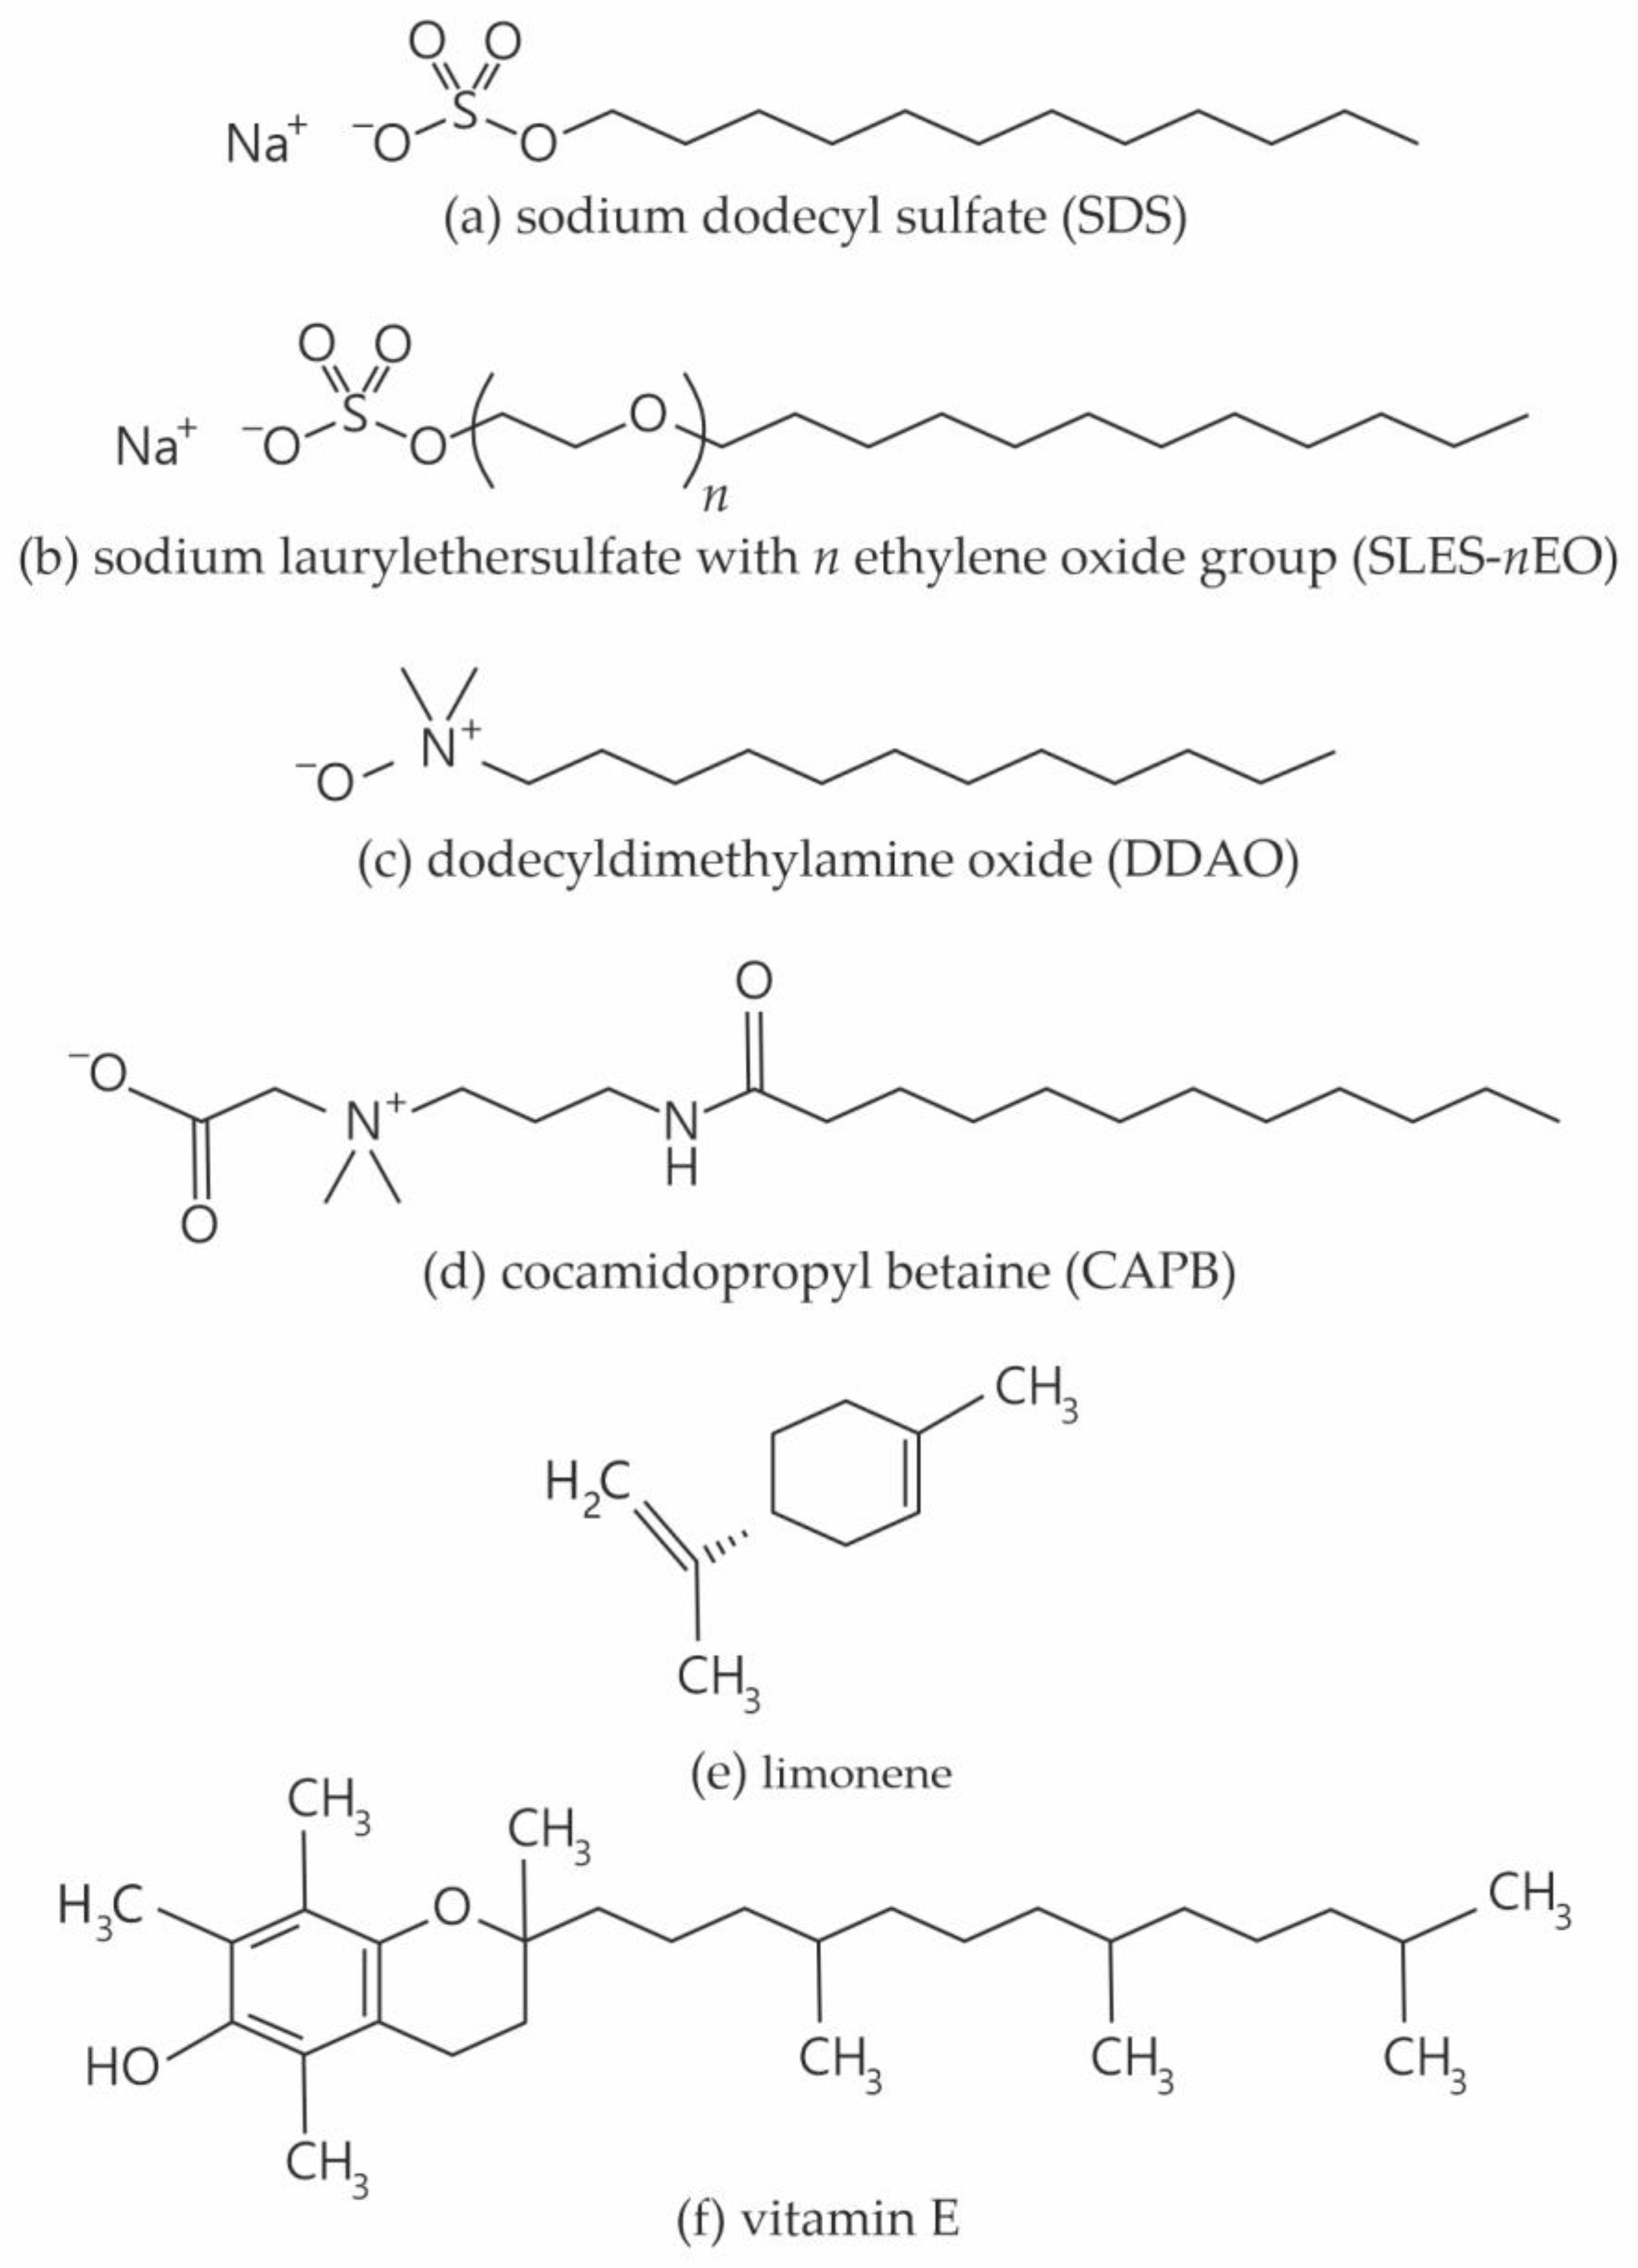
2.1. Materials

The following anionic surfactants were used: (i) sodium dodecyl sulfate (SDS), a product of Sigma-Aldrich, active substance 100% (Figure 1a); (ii) sodium lauryl ether sulfate with 1 ethylene oxide group (SLES-1EO), product of Stepan with a trade name of STEOL CS170, active substance 70% (Figure 1b); (iii) sodium lauryl ether sulfate with 3 ethylene oxide groups (SLES-3EO), product of Kapachim S.A., Alkolet L703 High pH, active substance 70% (Figure 1b). The zwitterionic surfactants were as follows: (i) N,N-dimethyldodecylamine N-oxide (DDAO), a product of Sigma-Aldrich, active substance 30% (Figure 1c); (ii) cocamidopropyl betaine (CAPB), a product of Evonik, Essen, Germany, Tego Betain F 50, active substance 37.8% (see Figure 1d). The used CAPB sample is a mixture of zwitterions with a different number of carbon atoms in the hydrocarbon chains (from C8 up to C16, of which 48% is C12) and NaCl (not specified by the manufacturer). By conductometry, we established that 100 mM of the used CAPB contains an admixture of 118 mM NaCl [5]. To study the effect of added inorganic salts, we added NaCl, MgCl2, CaCl2, and ZnCl2, products of Sigma-Aldrich, Chem-Lab, and Fluka, respectively, to the mixed micellar solutions. In the literature, the most pronounced synergistic mixing of surfactants is observed for the equimolar ratio between them, so the ratio between the different pairs of surfactants in our study was fixed at 1:1.
The oily substances, which were incorporated in the saturated micellar phases to produce nanoemulsions, were (R)-(+)-Limonene (limonene, Figure 1e), a product of Sigma-Aldrich, and DL-a-tocopherol (vitamin E, Figure 1f). We used vitamin E from two suppliers, Sigma-Aldrich and TCI Chemicals, Tamil Nadu, India. The difference between the two samples is that the first one is a mixture of all eight diastereomers and the latter is a mixture of two diastereomers.
We used different dyes (lipophilic and hydrophilic), all of them products of Sigma-Aldrich, to visualize the properties of different phases. The lipophilic dyes were Difluoro{2-[1-(3,5-dimethyl-2H-pyrrol-2-ylidene-N)ethyl]-3,5-dimethyl-1H-pyrrolato-N} boron or BODIPY for short, and Sudan III. The hydrophilic dye was methylene blue.
Deionized water from the Millipore system, Burlington, MA, USA, (Milli-Q purification system) was used to prepare all solutions in the present study.

2.2. Methods

First, an aqueous solution of the two surfactants with a total surfactant concentration of 8 wt% and a ratio of 1:1 is prepared. The necessary amount of the inorganic salt is added, and the mixture is placed on a magnetic stirrer. The surfactant + salt mixture is stirred for one hour at 70 °C. The solutions are left overnight in a separation funnel to separate the saturated micelle network (if any). Next, the lower phase is carefully poured into a beaker, and the upper phase is transferred into another beaker, thus separating the two phases. All subsequent measurements are carried out at 25 °C. Note that it is not necessary to heat the surfactant mixtures and salts during stirring for the formation of saturated micellar phases. In all cases, they are formed, but the subsequent process of separation of the two phases is considerably slower for the unheated solutions.
For optical observations, we used an optical microscope AxioImager M2m (Zeiss, Oberkochen, Germany) equipped with fluorescence assay to distinguish between the two phases. The lipophilic BODIPY is an oil-soluble dye, which colors only the micellar (bicontinuous) phase yellow-green. This dye is a fluorescent marker with an excitation maximum of 502 nm and an emission maximum of 510 nm—on the micrographs, the saturated micellar phase should be green. Methylene blue is a water-soluble dye, which colors the water phase blue. The dyes are added in very small amounts (a very small mass) that cannot be detected by a weighing balance. For that reason, the color shades in the bottles are slightly different. Some of the experiments were performed under a cross-polarized white light with the λ-compensator plate placed after the observed sample and before the analyzer at a 45° angle with respect to both the polarizer and analyzer.
To confirm the optical observations, we also used small-angle X-ray scattering (SAXS) system Xeuss 3.0 (SAXS/WAXS System, Xenocs, Grenoble, France) with a CuKa X-ray source (λ = 0.154 nm, Xeuss 3.0 UHR Dual source Mo/Cu, Xenocs, Sassenage, France), and Eiger2 4 M detector (Dectris Ltd., Baden Deattwil, Switzerland) with slit collimation. The apparatus was operated at 50 kV and 0.6 mA. The sample-to-detector distance of 1000 mm and 3000 mm allowed us to access the Q-range of 0.01–0.5 Å−1. Data acquisition time was 30 min. Samples were enclosed into vacuum seal thin borosilicate capillaries with an outer diameter of 1 mm and thickness of 10 µm. The scattered intensity was normalized to the incident intensity and corrected for the background scattering from the capillary. It was calibrated to an absolute scale. The measurements were performed at 25 °C.
Rotational rheometer Bohlin Gemini (Malvern Instruments, Worcestershire, UK) equipped with cone-plates CP 2/60 and CP 4/40 was applied to measure the rheological response of the micellar solutions. We measured the apparent viscosity as a function of the shear rate in the range from 0.001 to 1000 s−1. The temperature of 25 °C was controlled with a thermostat and the evaporation of water from the sample was prevented with the use of a solvent trap.
For measuring the size distribution of emulsion drops in the nanoemulsions and of the swollen micelles, we used dynamic light scattering (DLS) apparatus LS Spectrometer™ from LS Instruments AG, Fribourg, Switzerland. The angle of the measurements is fixed at 90° and the temperature is 25 °C.

3. Formation and Rheological Properties of Saturated Micellar Phases

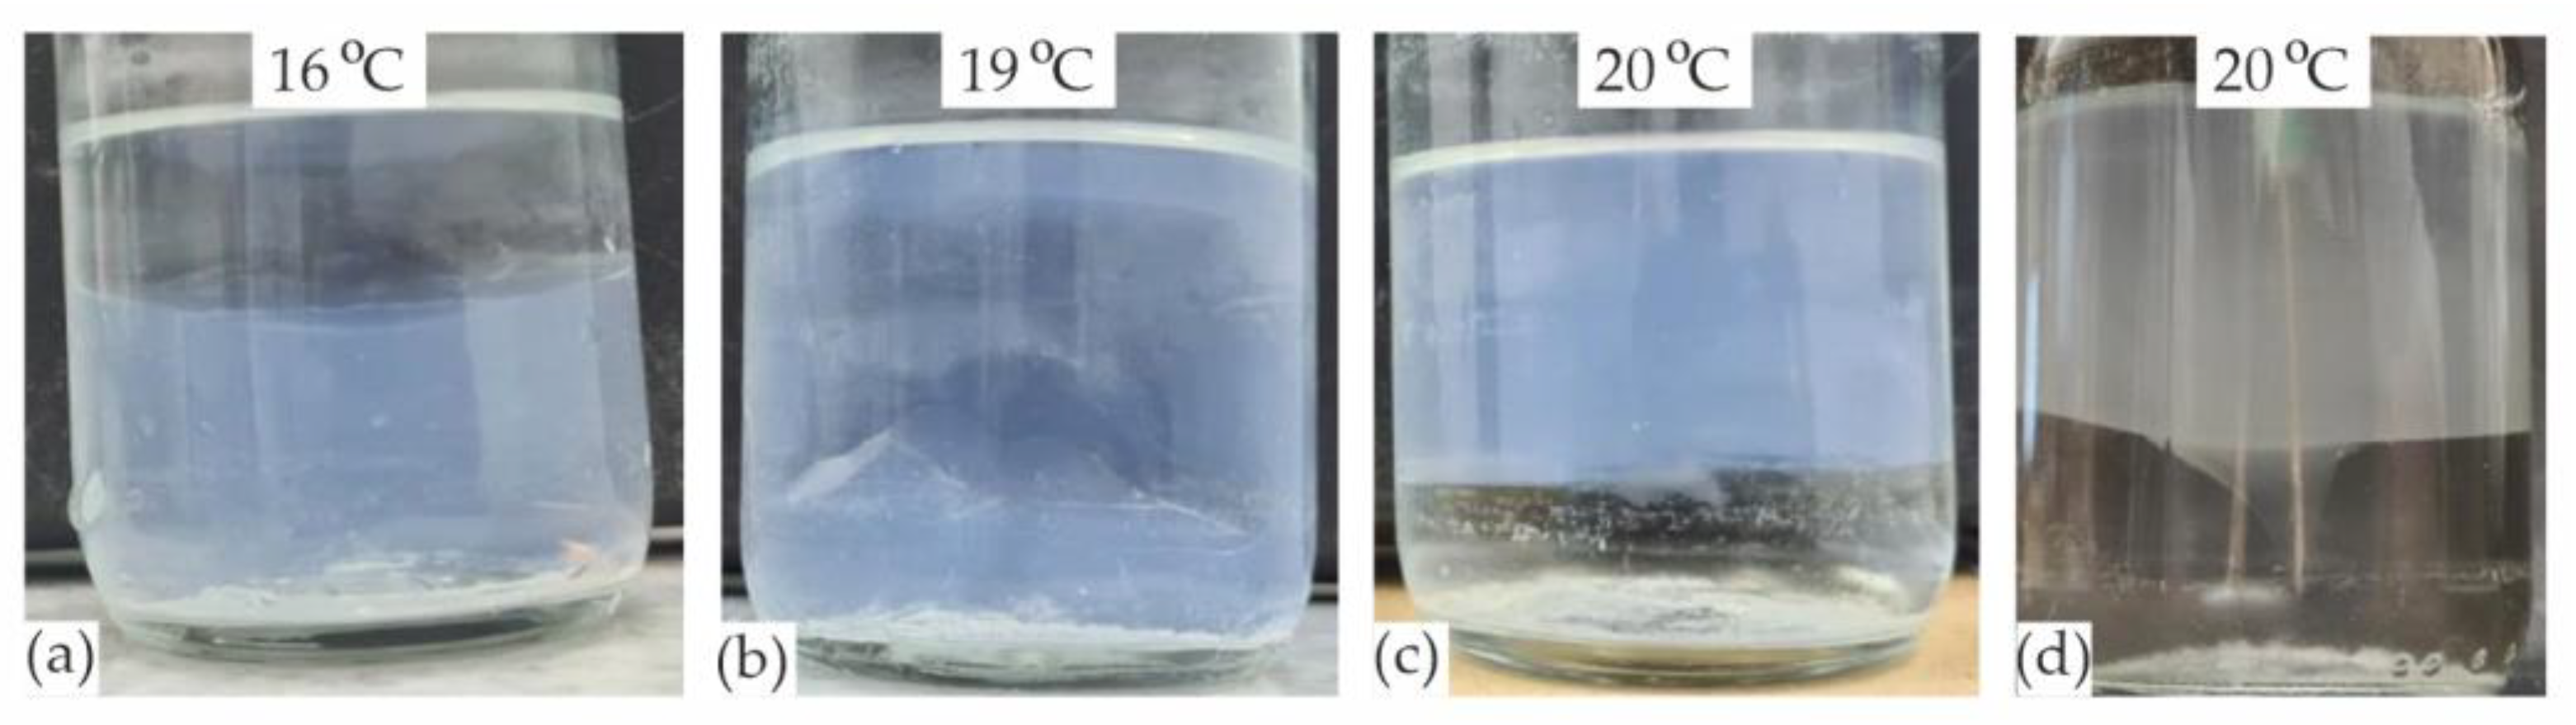
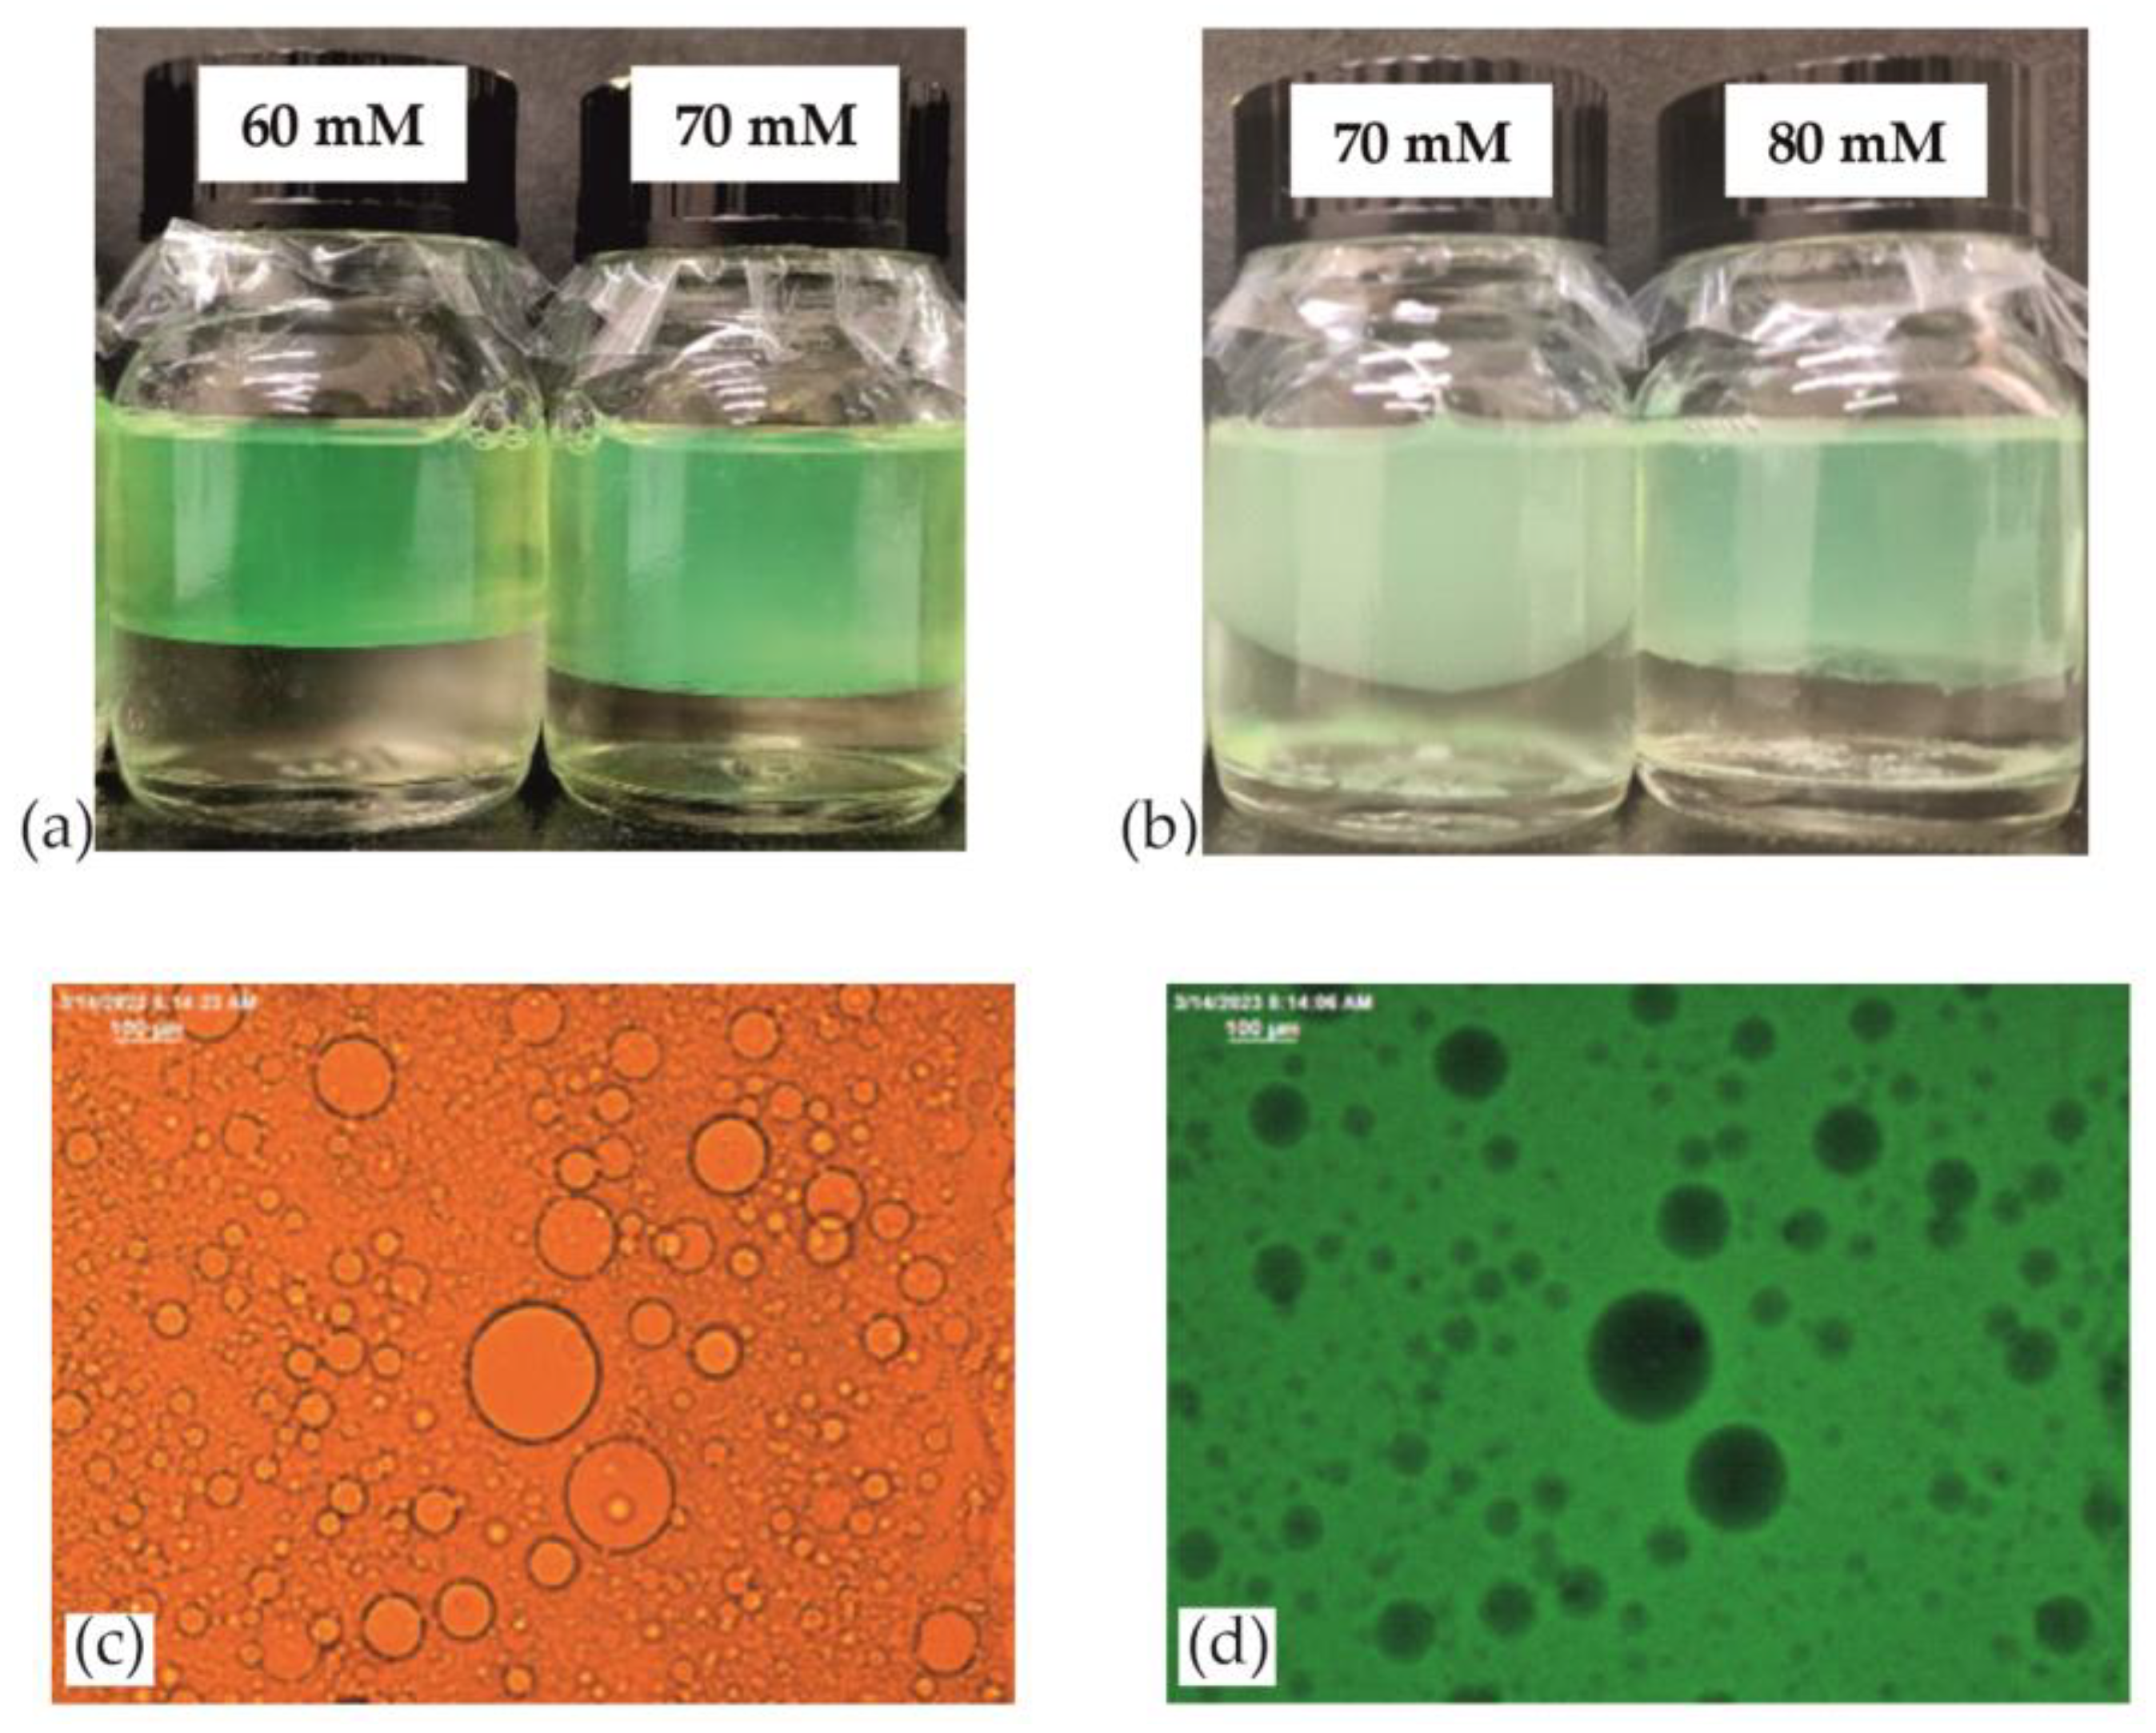
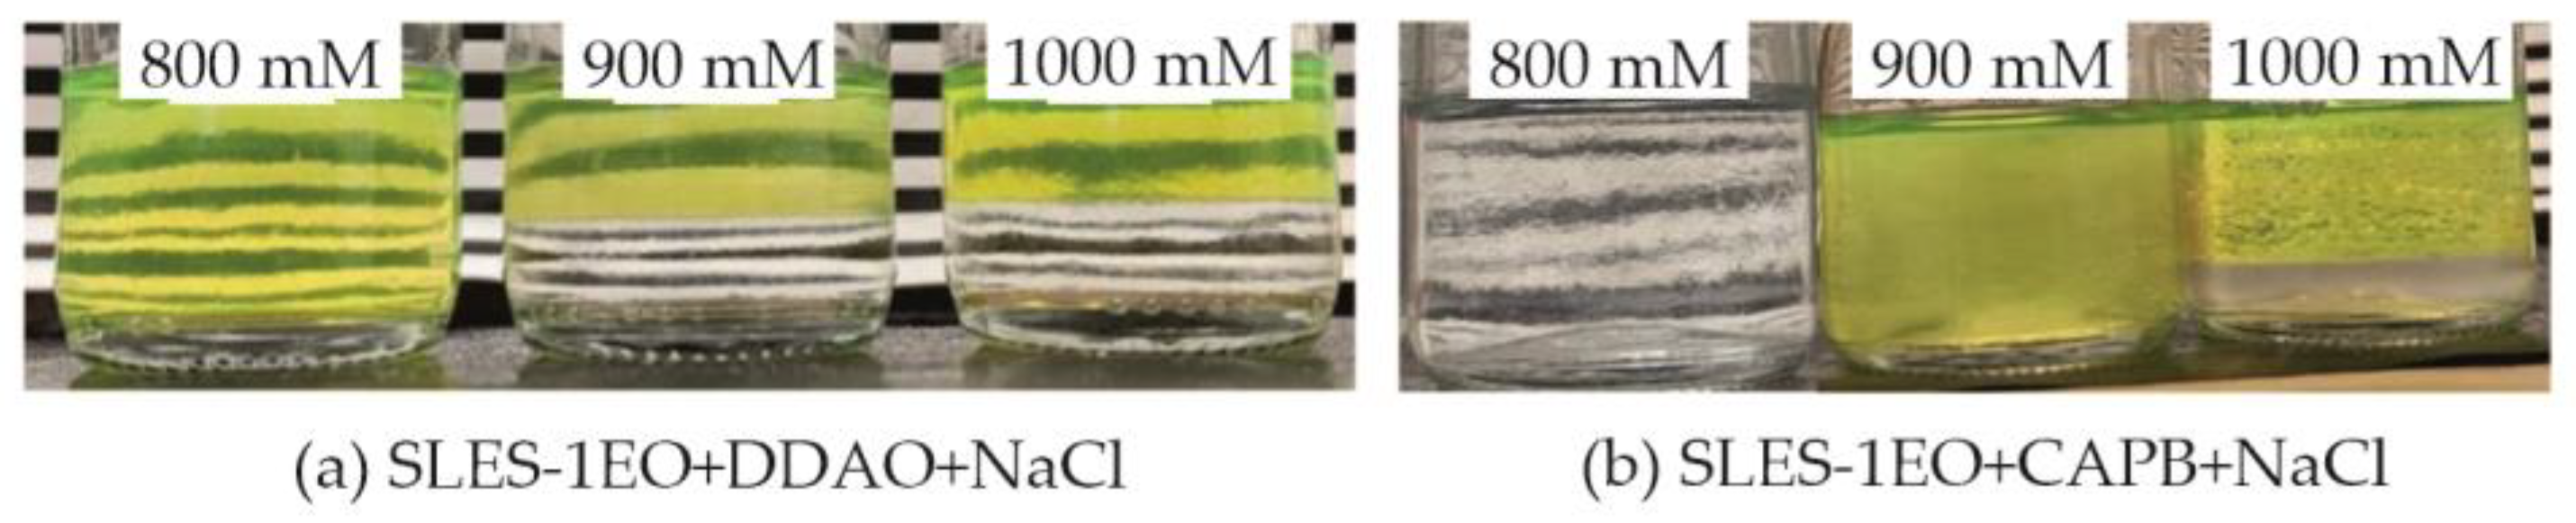
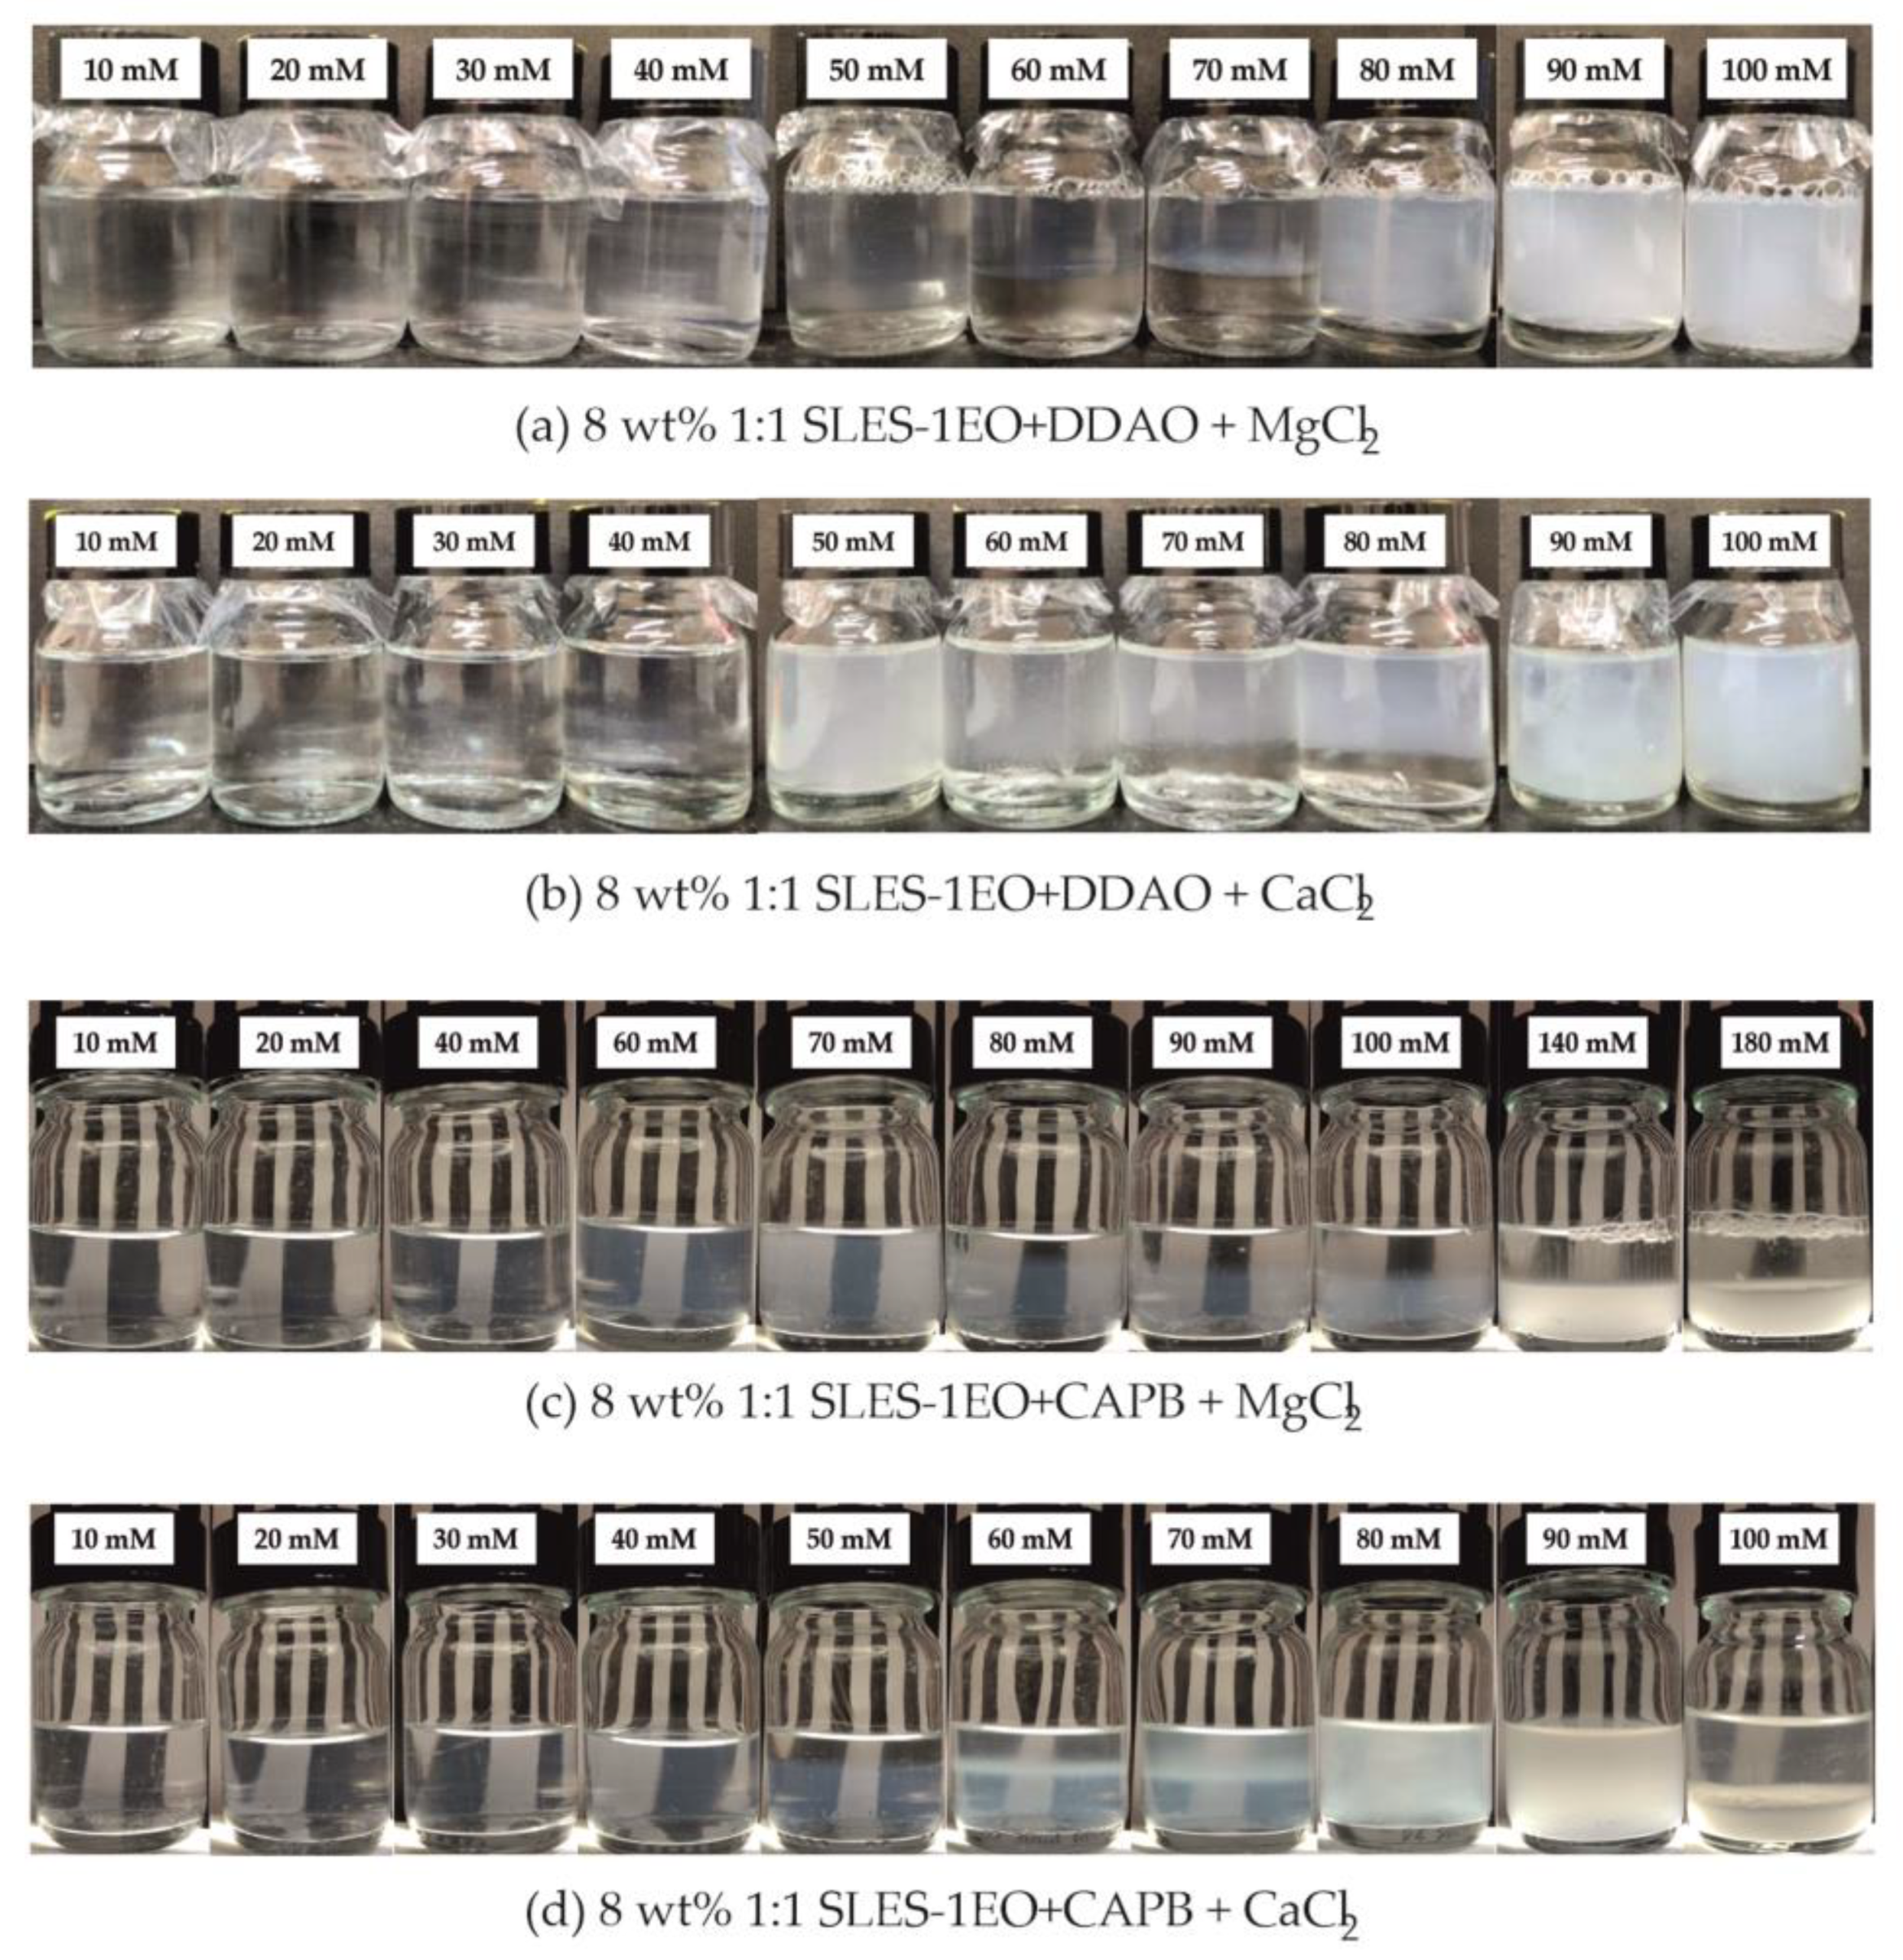
3.1. Formation of Saturated Micellar Phase

In order to clarify the effect of the number of ethylene oxide groups in ionic surfactants on the formation of saturated micellar phases, we studied the binary surfactant mixtures of a zwitterionic surfactant (DDAO and CAPB) and an anionic surfactant (SDS, SLES-1EO, and SLES-3EO). The addition of MgCl2 to mixed 1:1 SDS+DDAO solutions with a total surfactant concentration of 8 wt% leads to transparent solutions up to 40 mM added MgCl2, and the surfactant mixtures are salted out for concentrations above 50 mM MgCl2 (Figure S1a). The salting-out effect of CaCl2 is more pronounced—all solutions contain crystals for concentrations of added CaCl2 above 20 mM (Figure S1b). In contrast, all 8 wt% 1:1 SLES-3EO+DDAO solutions with added MgCl2 up to 350 mM are clear, their viscosities considerably increase with the increase in salt concentrations, and the salting out of the surfactants is not observed even at 350 mM added MgCl2. The addition of CaCl2 with a concentration above 10 mM makes the respective surfactant solutions turbid with precipitates (Figure S2). In the case of 1:1 SLES-1EO+DDAO, there are intervals of divalent (MgCl2 and CaCl2) salt concentrations in which saturated micellar phases are formed (Figure 2a,b).
For 8 wt% 1:1 SLES-3EO+CAPB, we varied the concentration of added divalent salts (MgCl2 and CaCl2) from 0 up to 450 mM. All solutions are transparent and very viscous without the formation of a saturated micellar phase. If the number of ethylene oxide groups is lower, i.e., SLES-1EO + CAPB, there are intervals of added divalent salts in which the respective micellar phases are formed, as shown in Figure 2c,d. The experimental results for 8 wt% 1:1 SDS+CAPB in the presence of divalent salts are shown in Figure S3. For both MgCl2 and CaCl2, saturated micellar phases are formed in the concentration intervals from 60 mM to 90 mM for MgCl2 and from 40 mM to 70 mM CaCl2 (see Table S2). In all studied cases, the addition of ZnCl2 leads to turbid solutions without the possibility of separating the saturated micellar phase, if any.
If the concentration of individual surfactant solutions is 4 wt%, the addition of MgCl2 or CaCl2 up to 120 mM does not change the turbidity of all surfactant solutions (they are transparent) except for SDS (Table S1). In the case of SDS, the crystallites are observed for concentrations above 50 mM added MgCl2 and even at 50 mM added CaCl2. It is well known that the counterion binding energy (Mg2+ and Ca2+) to the ionic surfactant headgroups decreases with the rise in the number of ethylene oxide groups. For that reason, the lowest counterion binding energy to SLES-3EO leads to the growth of wormlike mixed micelles and the monotonous increase in the viscosity of solutions up to 350 mM added MgCl2 in both cases of SLES-3EO+DDAO and SLES-3EO+CAPB. The highest energy of counterion binding to SDS leads to the salting out of surfactants for low concentrations of added divalent salts. The following general conclusions can be drawn. The increase in the number of ethylene oxide groups in ionic surfactants prevents the transition of the branched micelles to a multiconnected micellar phase in the presence of divalent salts.
Figure 2a illustrates the behavior of 8 wt% 1:1 SLES-1EO+DDAO with the increase in added MgCl2 concentration. Three regions are distinguished: (i) clear solutions; (ii) separation of saturated micellar phase; and (iii) salting out of the surfactants. Transparent solutions are observed for MgCl2 concentrations up to 40 mM. The viscosity of these solutions goes through a maximum (see Section 3.2). The formation of saturated micellar phases is observed in the narrow concentration interval from 50 mM to 70 mM MgCl2. The formation of two different phases (the upper phase is opalescent and the lower one is transparent) is visible directly after the solution preparation. Leaving the mixtures overnight at room temperature allows the phases to be fully separated. The addition of more than 80 mM MgCl2 leads to the salting out of the surfactants and to quite turbid solutions with crystallites. The effect of added CaCl2 is shown in Figure 2b. The behavior of this system is analogous to that in the presence of MgCl2. The solutions for concentrations up to 40 mM CaCl2 are clear with a maximal viscosity at 30 mM CaCl2 (see Section 3.2). Turbid salted-out solutions with precipitates are observed for CaCl2 concentrations above 90 mM. The saturated micellar phases are separated from 60 mM to 80 mM added CaCl2. Note that 8 wt% 1:1 SLES-1EO+DDAO + 50 mM CaCl2 solution is quite turbid. In this case, the saturated micellar phase appears as very small fluid aggregates, which do not coalesce to a large uniform layer on the top of the vial, even after 24 h.
Figure 2c,d shows the visual appearance of 8 wt% SLES-1EO+CAPB solutions in the presence of different concentrations of MgCl2 and CaCl2. The behavior of the solutions is similar to that illustrated in Figure 2a,b. The main difference is in the intervals of concentrations in which saturated micellar phases are formed: (i) from 60 mM to 160 mM for added MgCl2 and (ii) from 50 mM to 70 mM for added CaCl2. Thus, the type of zwitterion is also important for the formation of the sponge phases (see Section 3.2 for additional discussions).
In the case of SLES-1EO+CAPB, the formed saturated micellar phases sediment at the bottom of the vials at room temperature [23,52]. If CAPB is replaced by DDAO, then these phases appear at the top of the vials (see Figure 2). The density difference between both phases is very small, but the dependencies of their densities on the temperature are different (Figure 3). For example, the positions of phases formed from 8 wt% 1:1 SLES-1EO+DDAO in the presence of 70 mM CaCl2 at 16 °C look like those for SLES-1EO+CAPB at room temperature: the micelle-rich (opalescence) solution is at the bottom, while that with a lower amount of surfactant (transparent) is at the top (Figure 3a). When the temperature increases to 19 °C, the densities of both phases become approximately equal and they start to move and penetrate each other (Figure 3b). The subsequent increase in the temperature to 20 °C leads to the separation of phases and they change their positions—the saturated micellar phase becomes lighter (Figure 3c). The interface between both phases has peculiar physicochemical properties. It is characterized by a low interfacial tension and a well-pronounced elasticity. We tried several times to suck out the lower phase with a syringe and observed that the needle cannot go through the boundary between the two phases—instead of penetrating, the needle bends the interface and easily deforms the boundary between the phases (Figure 3d). Thus, the interface behaves as an elastic membrane that is very flexible to bending (low interfacial tension). The measurements of the interfacial tension were impossible using the drop shape analysis and the spinning drop method. The isolated saturated micellar phase forms a jet and flows in the water-rich phase without a drop formation.
To visualize the distribution of surfactants in both phases, we used lipophilic dye BODIPY, which is dissolved in the surfactant solution and solubilized in the micelles. Figure 4 shows photographs of 8 wt% 1:1 SLES-1EO+DDAO solutions in the presence of 60 mM and 70 mM MgCl2 (Figure 4a) and 70 mM and 80 mM CaCl2 (Figure 4b). It is well illustrated that the opalescence layers in the respective vials shown in Figure 2 are colored yellow-green and the transparent layers remain uncolored. Thus, the saturated micellar phase contains practically the whole amount of surfactants. We shake the phase-separated solution illustrated in Figure 4a and take a sample for the microscopic observations shown in Figure 4c in transmitted light and in Figure 4d in fluorescent mode. In transmitted light, several fluid aggregates appear in the form of “droplets” dispersed in the continuous phase (no color is detected due to the fact that the hydrophobic dye is fluorescent). In fluorescence mode, it is proved that the continuous phase (the background of the picture) is the saturated micellar phase (due to the intense green color from the hydrophobic dye dissolved in it), and the dark “droplets” are from the water-rich phase.
To confirm the bicontinuous structure of the micellar network, we used BODIPY and water-soluble methylene blue dyes. The photograph of the vial containing 8 wt% 1:1 SLES-1EO+DDAO + 70 mM CaCl2 shows that both dyes (lipophilic and hydrophilic) color the upper phase, which is an intense blue-green color (Figure S4a). The intensity of the blue color of the lower phase is low. Thus, the upper phase contains enough water to dissolve the methylene blue and to turn blue-green. After dispersing the aqueous phase in the dark-blue phase, “droplets” are again seen in transmitted light (Figure S4b). In a fluorescence mode, the same “droplets” are dark, while the background is green (Figure S4c). This fact, combined with the lack of birefringence in polarized light (Figure S10) and the shape of the SAXS diffraction spectrum, which does not correspond to any ordered liquid-crystal phase (Figure S4d), proves that the upper phase represents a multiconnected micellar network. Analogous SAXS diffraction spectrums are reported in the literature [53,54,55,56,57], and the authors attributed the respective shapes of the SAXS curves to the presence of a saturated micellar (or sponge) phase.
An unexpected experimental observation is that the saturated micellar phase can also be obtained in the presence of NaCl. All mixed 8 wt% 1:1 SLES-1EO + zwitterionic surfactants (DDAO and CAPB) exhibit typical behavior in the presence of up to 800 mM NaCl: the solutions are transparent and their viscosity dependence on the added salt concentration follows a typical “salt curve” (see Section 3.2). The further increase in NaCl concentration leads to a phase separation (Figure 5). The NaCl threshold concentration for the formation of saturated micellar phase is 900 mM in the case of DDAO and 1 M in the case of CAPB. In the literature [6], the authors reported that 2:1 SLES-1EO+CAPB solutions are transparent up to 1.2 M added NaCl without phase separation. Thus, the monovalent salt also can promote the formation of a bicontinuous micellar phase but at an appropriate choice of the molar ratio between the ionic and zwitterionic surfactants. The main difference is that the needed monovalent salt concentration is significantly higher (0.66 wt/wt NaCl/surfactants) than the respective concentrations of divalent salts (MgCl2 and CaCl2), which are sufficiently low (0.060 wt/wt MgCl2/surfactants and 0.083 wt/wt CaCl2/surfactants).

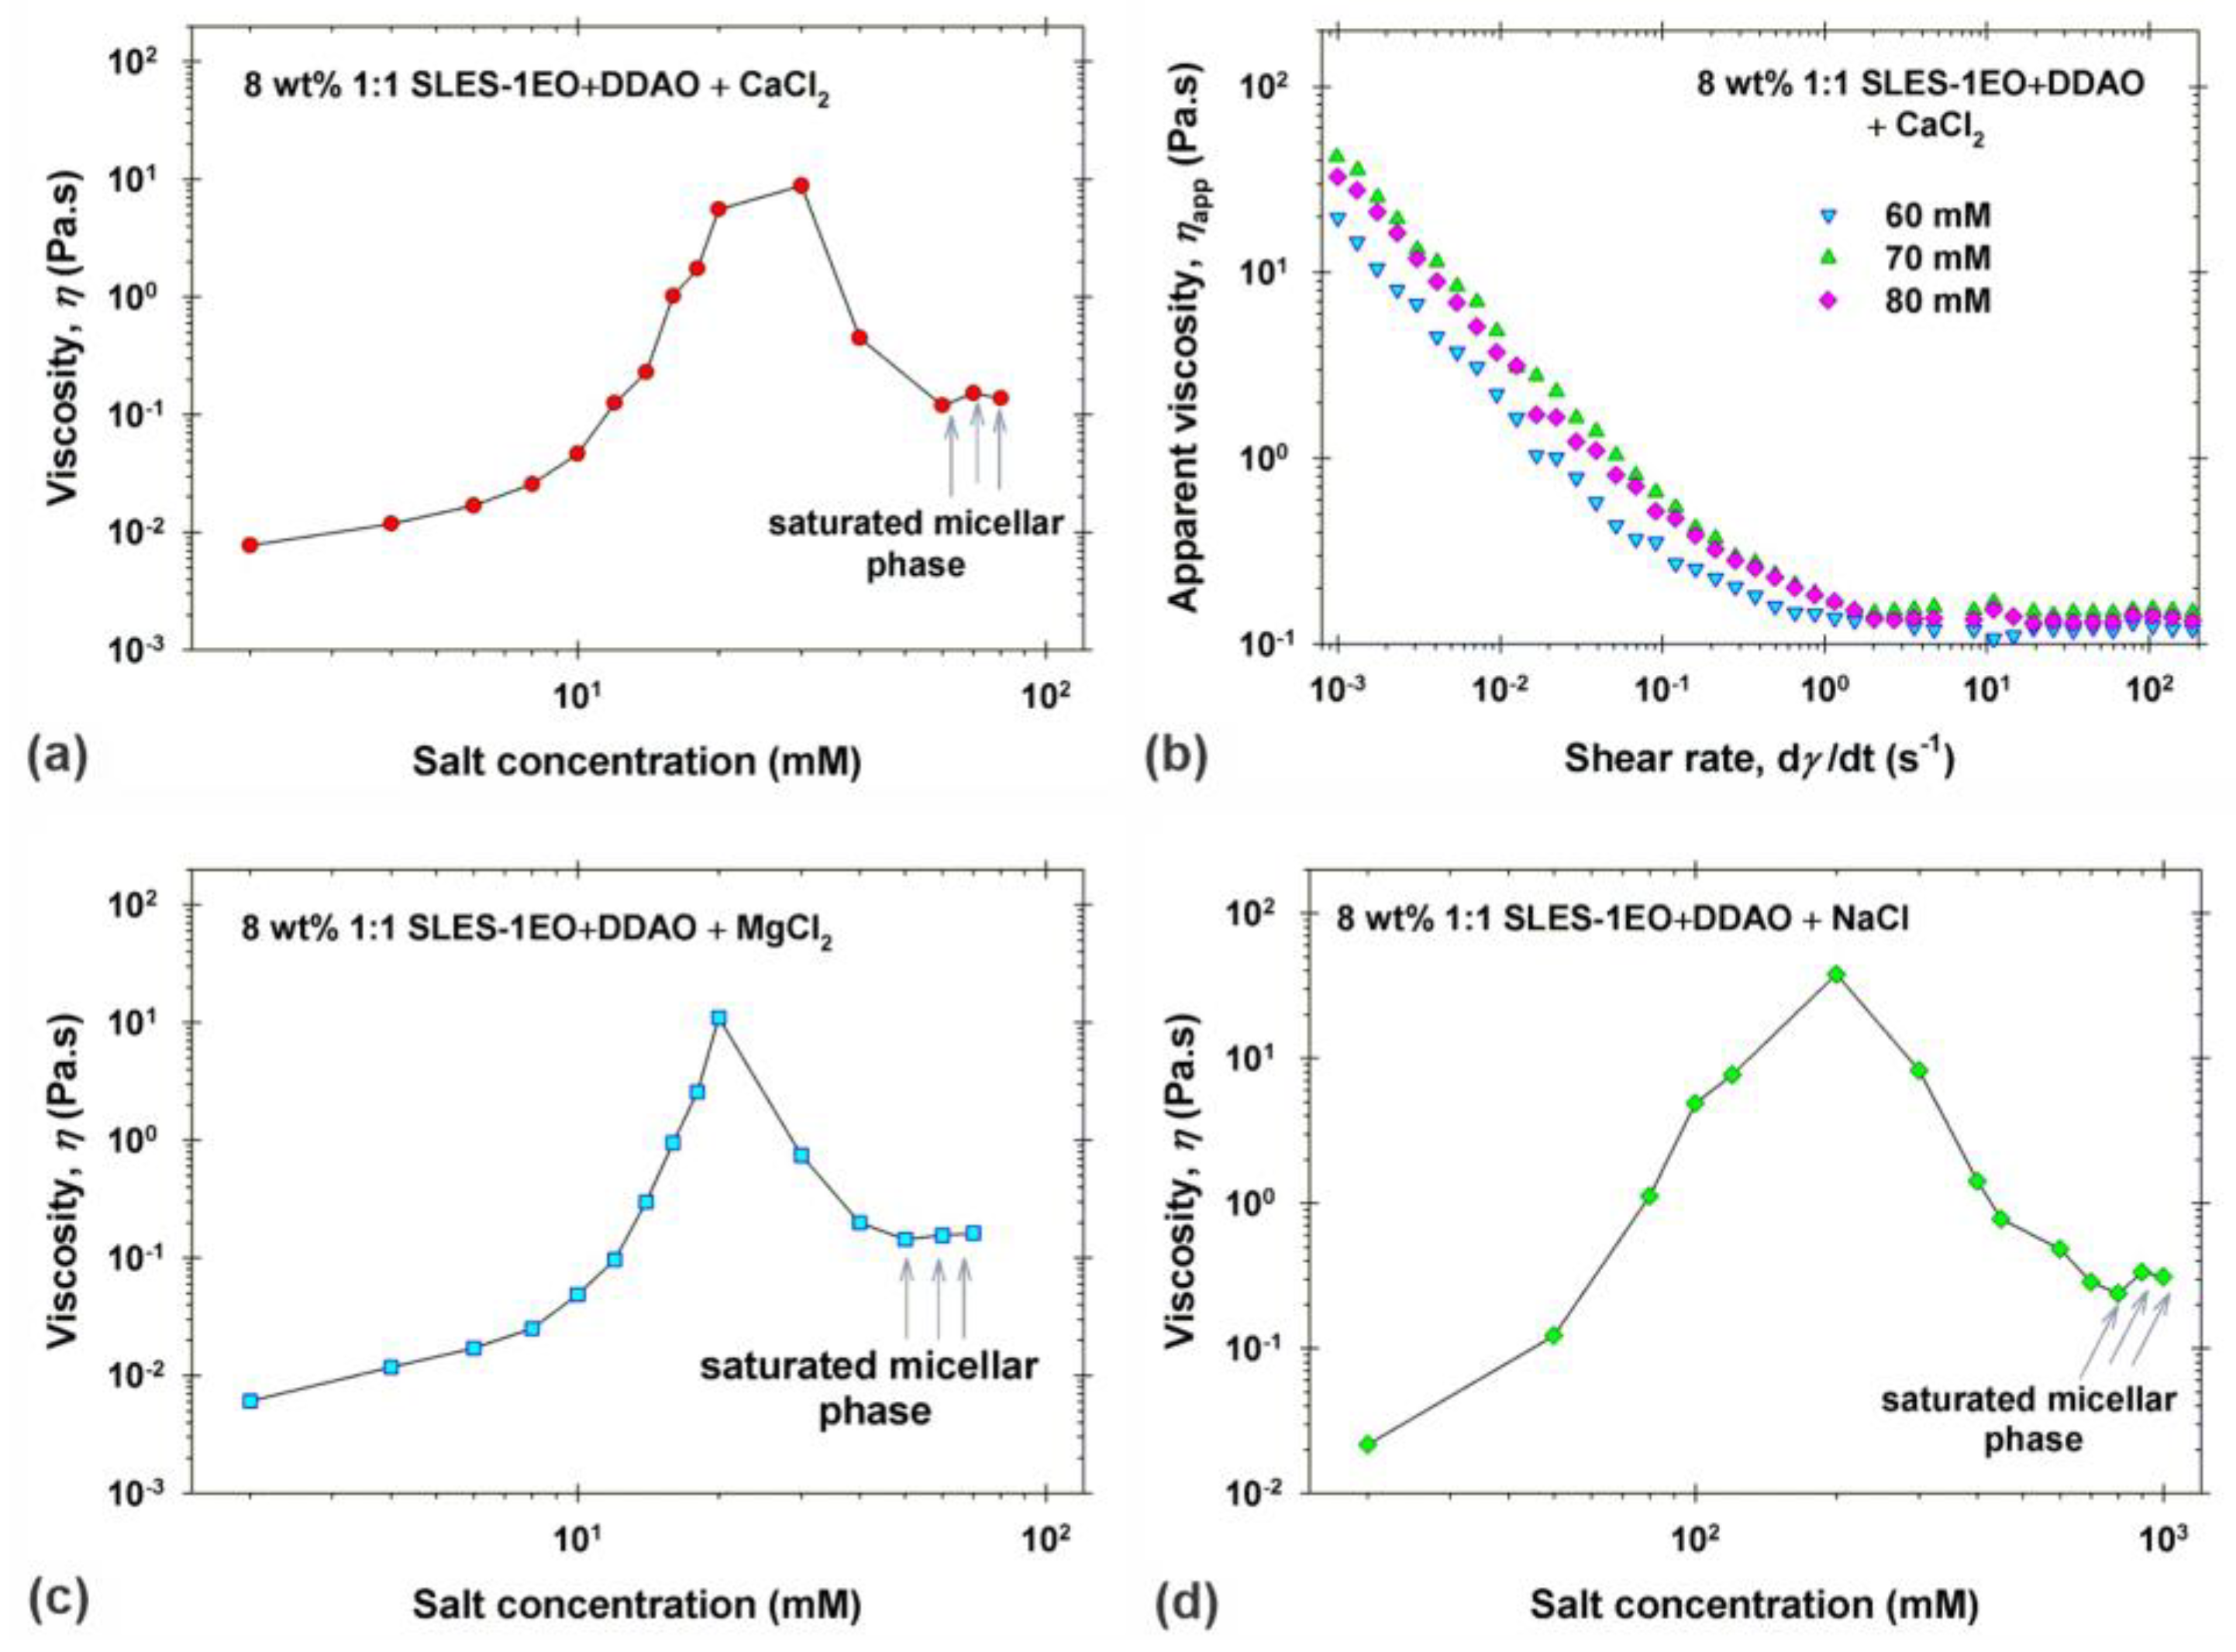
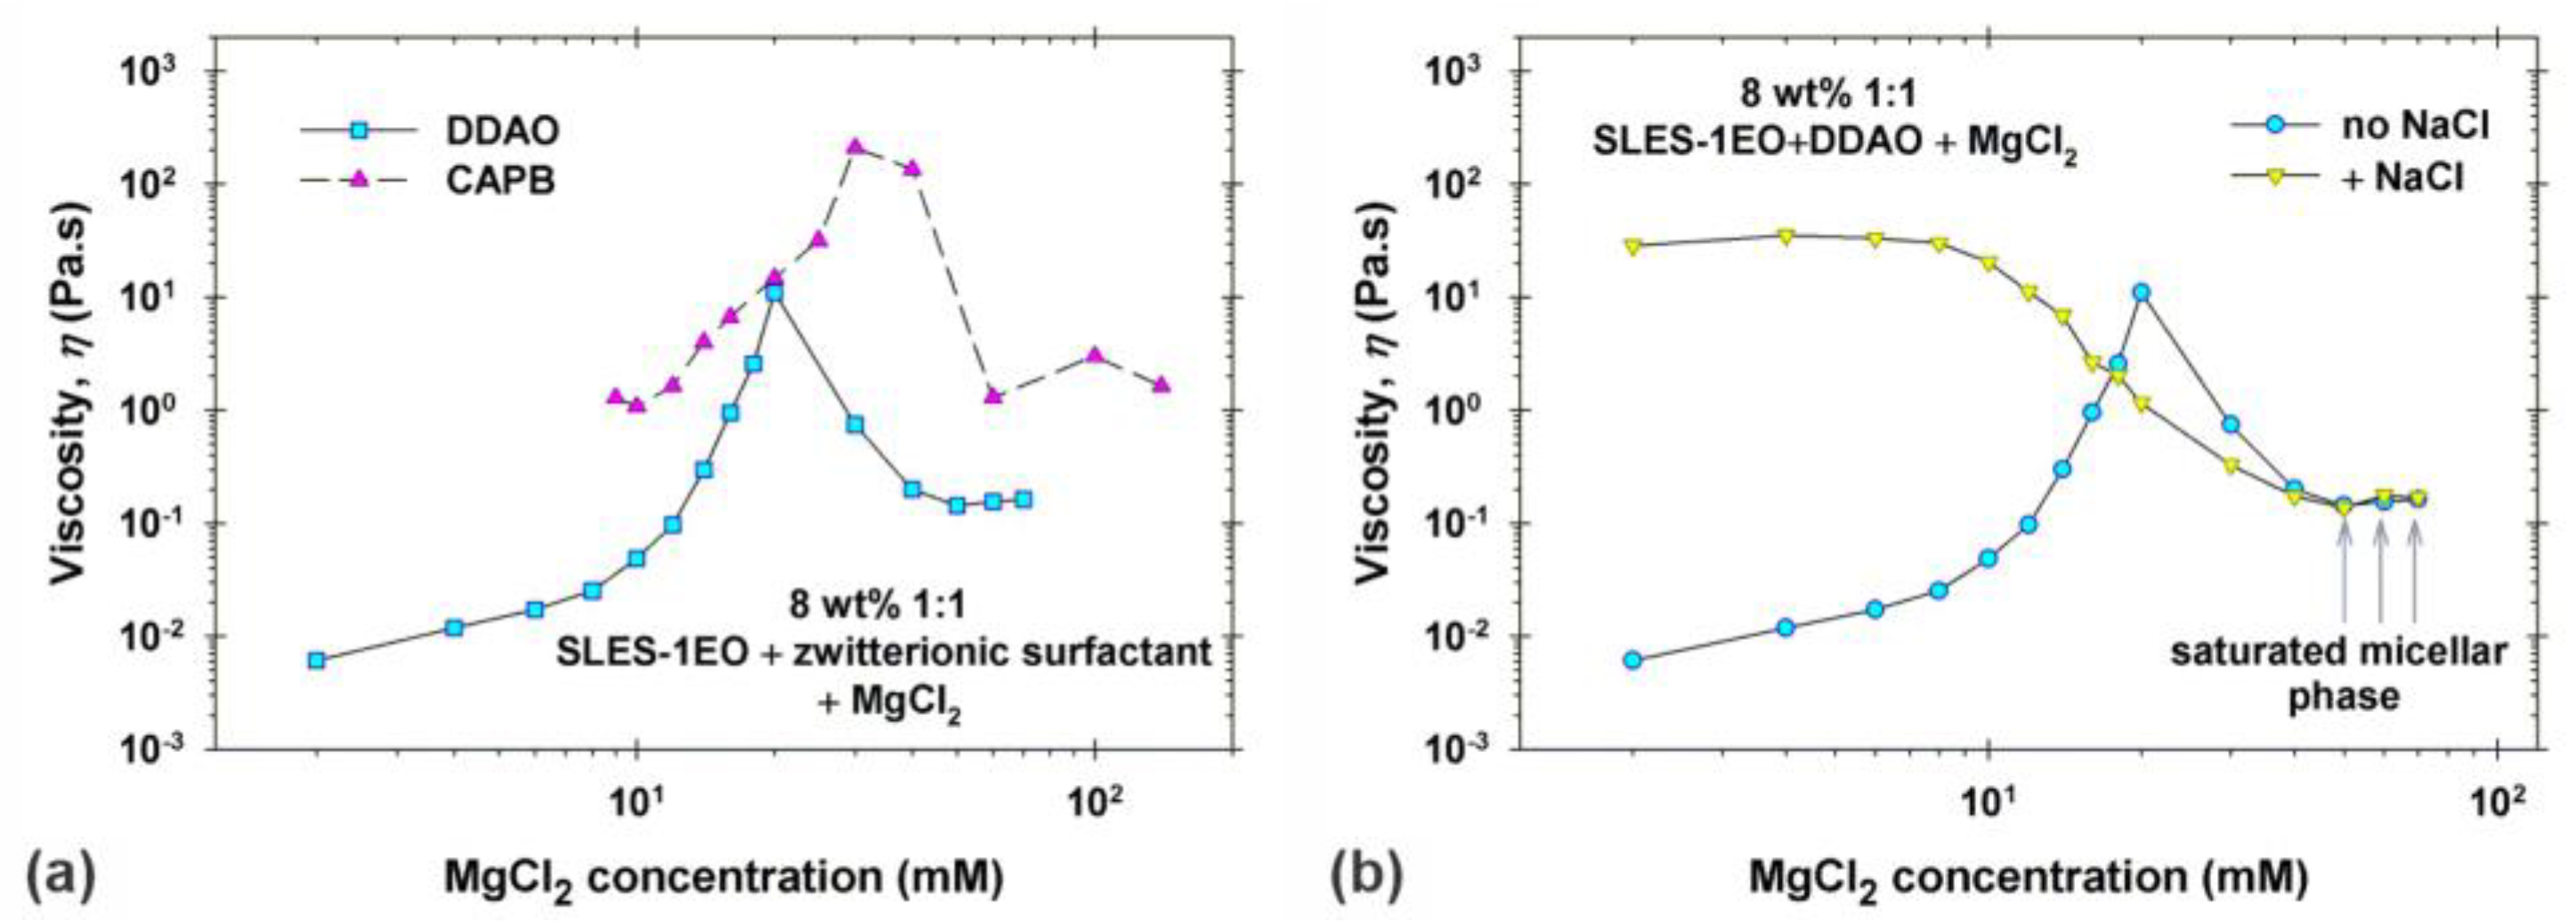
3.2. Rheology of Micellar Surfactant Solutions in the Presence of Monovalent and Divalent Salts

The detailed rheological study of the mixed SLES-1EO and CAPB solutions in the presence of MgCl2 is reported in Ref. [52]. Below, we summarize our experimental results for SLES-1EO+DDAO in the presence of salts (Figure 6) and compare them with those for SLES-1EO+CAPB (Figure 7). The original experimental flow curves (apparent viscosities, ηapp, vs. the applied shear rate, dγ/dt) are summarized in Figures S5 and S6. They illustrate the typical rheological behavior of the studied solutions for concentrations below the phase separation. At low shear rates, the apparent viscosity is constant (quasi-Newtonian regime). These values of the viscosity are called in the literature the zero-shear viscosities and they are plotted in the “salt curves” illustrated in Figure 6 and Figure 7. The quasi-Newtonian regime takes place up to the threshold shear rates and the subsequent increase in dγ/dt leads to the shear thinning behavior—the apparent viscosity decreases with dγ/dt. At high enough shear rates, the apparent viscosity again is constant, which corresponds to Newtonian fluids. Note that for SLES-1EO+DDAO in the presence of low concentrations of divalent salts, the apparent viscosity is constant for all studied shear rates so that these solutions behave as Newtonian fluids.
Figure 6a,c shows the dependencies of the viscosities of SLES-1EO+DDAO solutions on the concentrations of added CaCl2 and MgCl2, respectively. As it should be, these dependencies have the shape of a typical salt curve with a maximum of the viscosity [3,4,5]. The interpretation of such curves is well known in the literature [3,4,5,8,9,10,11,12,13]: (i) to the left of the maximum, the viscosity increases due to the growth and entanglement of the wormlike micelles; (ii) to the right of the maximum, the viscosity decreases because of the branching of micelles and the increase in the junctions between them. The Cates theory [5,6,7,8,9,10,11,12,13], known as “the reptation-reaction model” for living polymers, describes the relationships between the size, shape, and self-organization of micelles and the rheological behavior of the respective solutions. For example, when the branched micelles are formed, the endcaps of the wormlike micelles are transformed into junctions in the branched structure. These junctions are mobile and they can slide along the linear part of the micelles, thus decreasing the viscosity of the surfactant solutions. The maximal viscosities are 8.8 Pa·s at added 30 mM CaCl2 and 11 Pa·s at 20 mM MgCl2. At a given divalent salt concentration, the phase separation takes place. We isolated the bicontinuous phases and measured their rheological behavior (see, for example, Figure 6b) to show that the flow curves for the isolated phases are quite similar and are independent of the added CaCl2 concentrations. Nevertheless, the dependencies of the ηapp on dγ/dt are considerably different than those illustrated in Figures S5 and S6. At lower shear rates, dγ/dt, the apparent viscosity decreases with the rise in the shear rate—the shear-thinning behavior is observed even at dγ/dt = 10−3 s−1. At higher shear rates, the apparent viscosities are approximately equal (0.15 Pa·s) and almost constant—a Newtonian behavior takes place. The last three experimental points in Figure 6a,c correspond to the Newtonian viscosity of the isolated saturated micellar phases observed at high shear rates.
The effect of added NaCl on the rheology of SLES-1EO+DDAO solutions is illustrated in Figure 6d. The behavior of the salt curve is quite similar to those in the presence of divalent salts. The main difference is that the maximal viscosity (28 Pa·s) is measured at a considerably higher added NaCl concentration (200 mM) and the Newtonian viscosity of the isolated saturated micellar phases is 0.30 Pa·s. Both values of the viscosities are approximately two times greater than those obtained in the presence of divalent salts. The comparison between DDAO and CAPB-containing systems is summarized in Table S2.
The effect of the zwitterionic surfactants in the surfactant mixtures with added MgCl2 on the rheological behavior of the micellar solutions is illustrated in Figure 7a. The salt curves have similar shapes with a considerable difference in the values and positions of the maximal viscosities: (i) 11 Pa·s at 20 mM MgCl2 in the case of DDAO; (ii) 210 Pa·s at 30 mM MgCl2 in the case of CAPB. The Newtonian viscosity of isolated bicontinuous phases in the case of CAPB is approximately 10 times higher than that in the case of DDAO.
The reported differences between DDAO- and CAPB-containing solutions need a deeper explanation. There are three main differences between the used zwitterionic surfactants. First, the CAPB sample contains NaCl while the DDAO sample is salt-free (see Section 2). To clarify the effect of NaCl available in the CAPB sample, we prepared mixtures of DDAO and NaCl (100 mM CAPB contains 118 mM NaCl) that mimic the used CAPB sample. The whole experimental procedure was repeated using these mixtures of 8 wt% 1:1 SLES-1EO+DDAO and 138 mM NaCl instead of DDAO alone. In the presence of NaCl, the saturated micellar phases are obtained in the case of added 50, 60, and 70 mM MgCl2 (see Figure S8a)—exactly the same interval of MgCl2 concentrations as illustrated in Figure 2a. Thus, this admixture of NaCl (138 mM) does not affect the formation of the respective bicontinuous micellar phases. Nevertheless, the monovalent salt affects the rheological behavior of the transparent micellar solutions, as seen in Figure 7b and Figure S8b. Wormlike micellar solutions with approximately equal viscosities of about 30 Pa·s are observed at concentrations of added MgCl2 below 10 mM and even without added MgCl2. The subsequent increase in the divalent salt concentration leads to the formation of branched micelles and a decrease in the viscosity. Thus, the dependence of the viscosity vs. MgCl2 concentration does not have a typical shape of the salt curves. All experimental results show that the energy of counterion binding of Mg2+ and Ca2+ to the micelles is larger than that of Na+ ions. For that reason, 50 mM Mg2+ ions added in the solution are capable of displacing bound Na+ ions to micelles (138 mM added bulk concentration of NaCl + 142 mM Na+ ions from the dissociation of SLES-1EO = 280 mM Na+ ions). Nevertheless, the zero-shear viscosities again are lower than the maximum of the ηapp shown in Figure 7a for CAPB-containing solutions.
Second, the composition of CAPB is different—it is a mixture of zwitterions with a various number of carbon atoms in the hydrophobic chains (from C8 to C16, in which 48% are C12), while DDAO is a zwitterion with 12 carbon atoms in the hydrophobic chain. The longer lengths of the CAPB hydrophobic chains lead to the easier formation of wormlike micelles and promote micelle growth with the rise in the added salt concentration. This is the most probable explanation for the higher viscosities of the CAPB-containing solutions.
Third, the dipole length of CAPB is higher than that of DDAO (Figure 1). In the micelles, the negative surfactant head of SDS is close to the positive charge of the DDAO and CAPB dipole head. Because of the higher dipole length of CAPB, the CAPB molecules in the mixed micelles shield the charge of the respective SDS molecules in the mixed micelles more effectively than the DDAO molecules. As a result, SDS+CAPB can form a saturated micellar phase, while SDS+DDAO solutions precipitate for the concentration of added divalent salts above 25 mM (see Table S2).

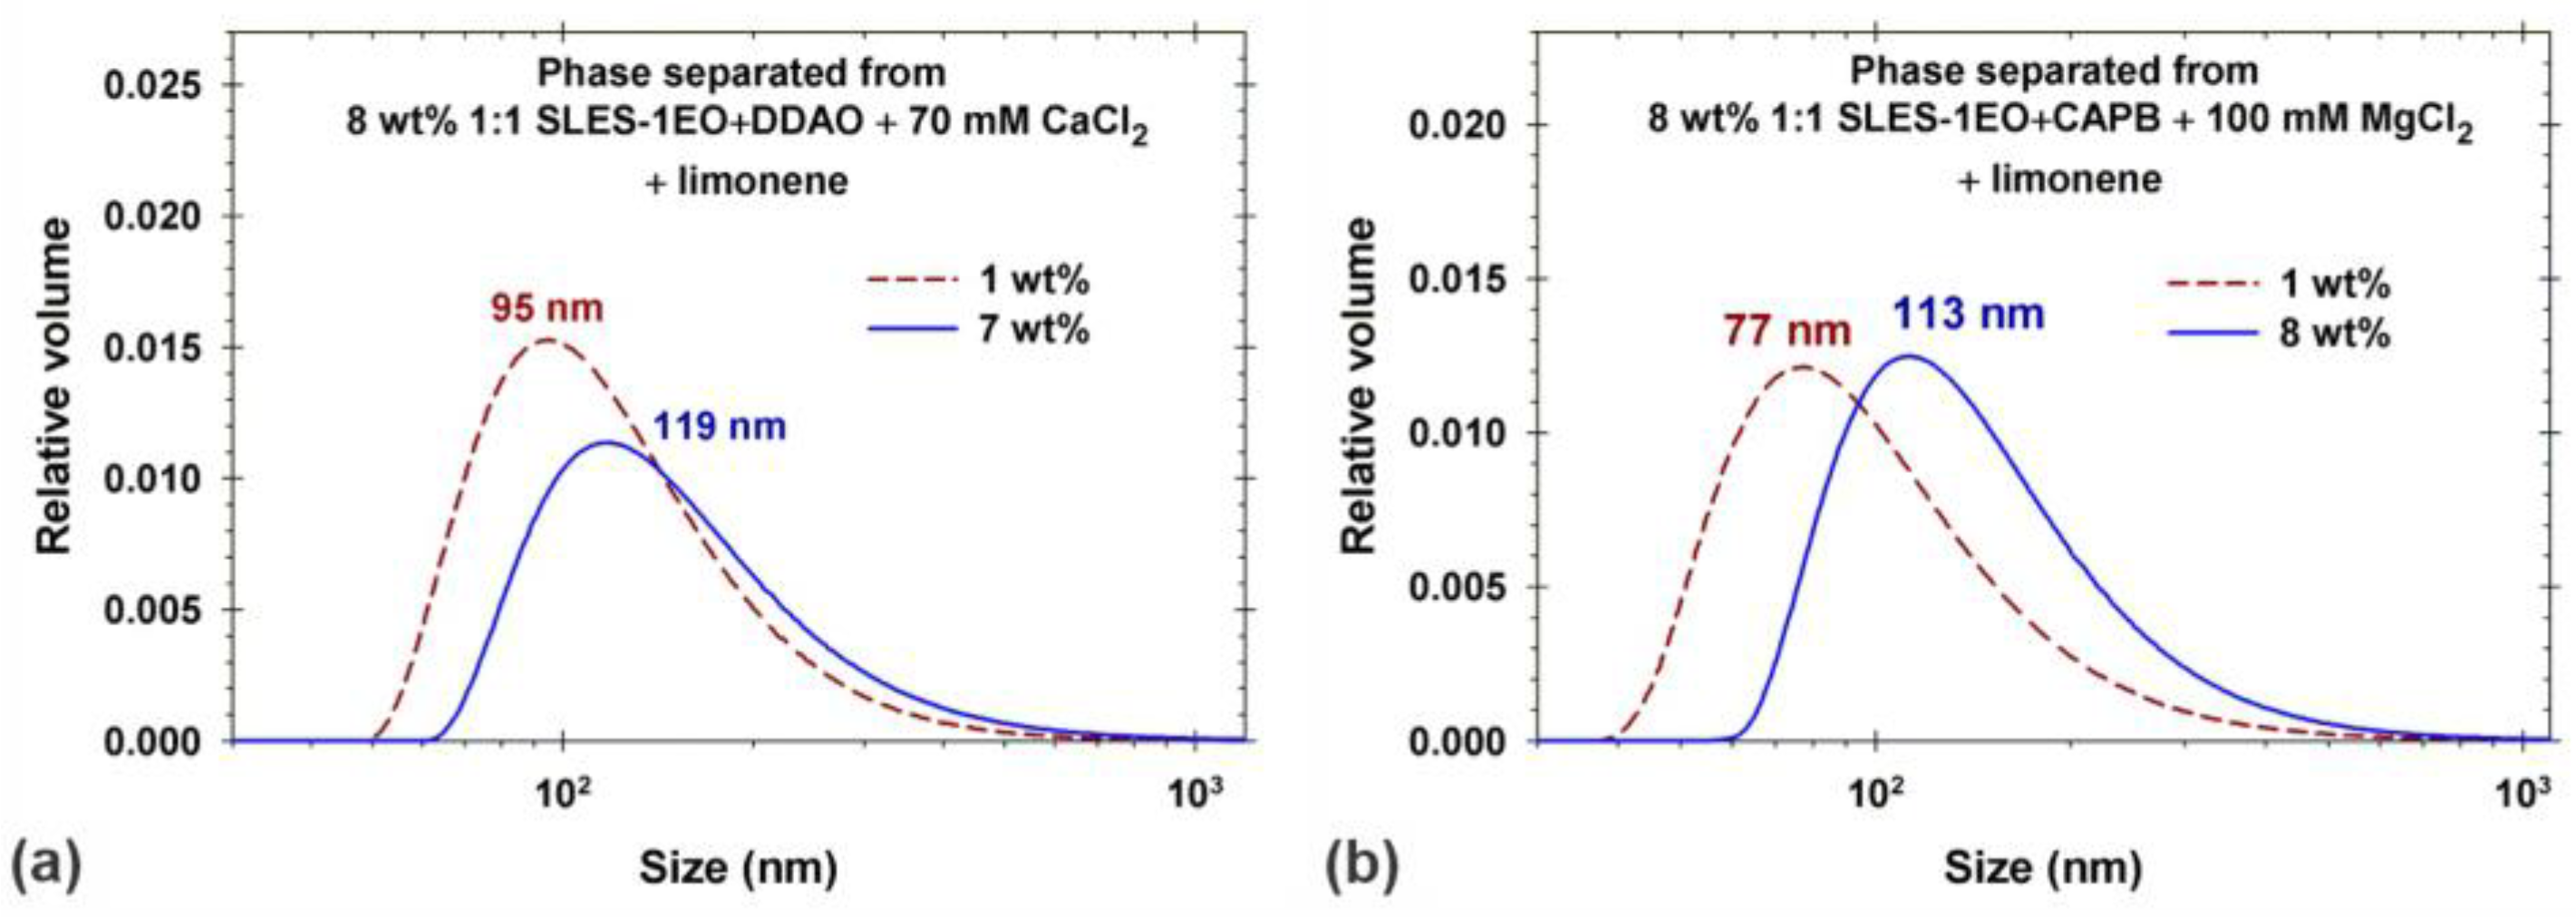
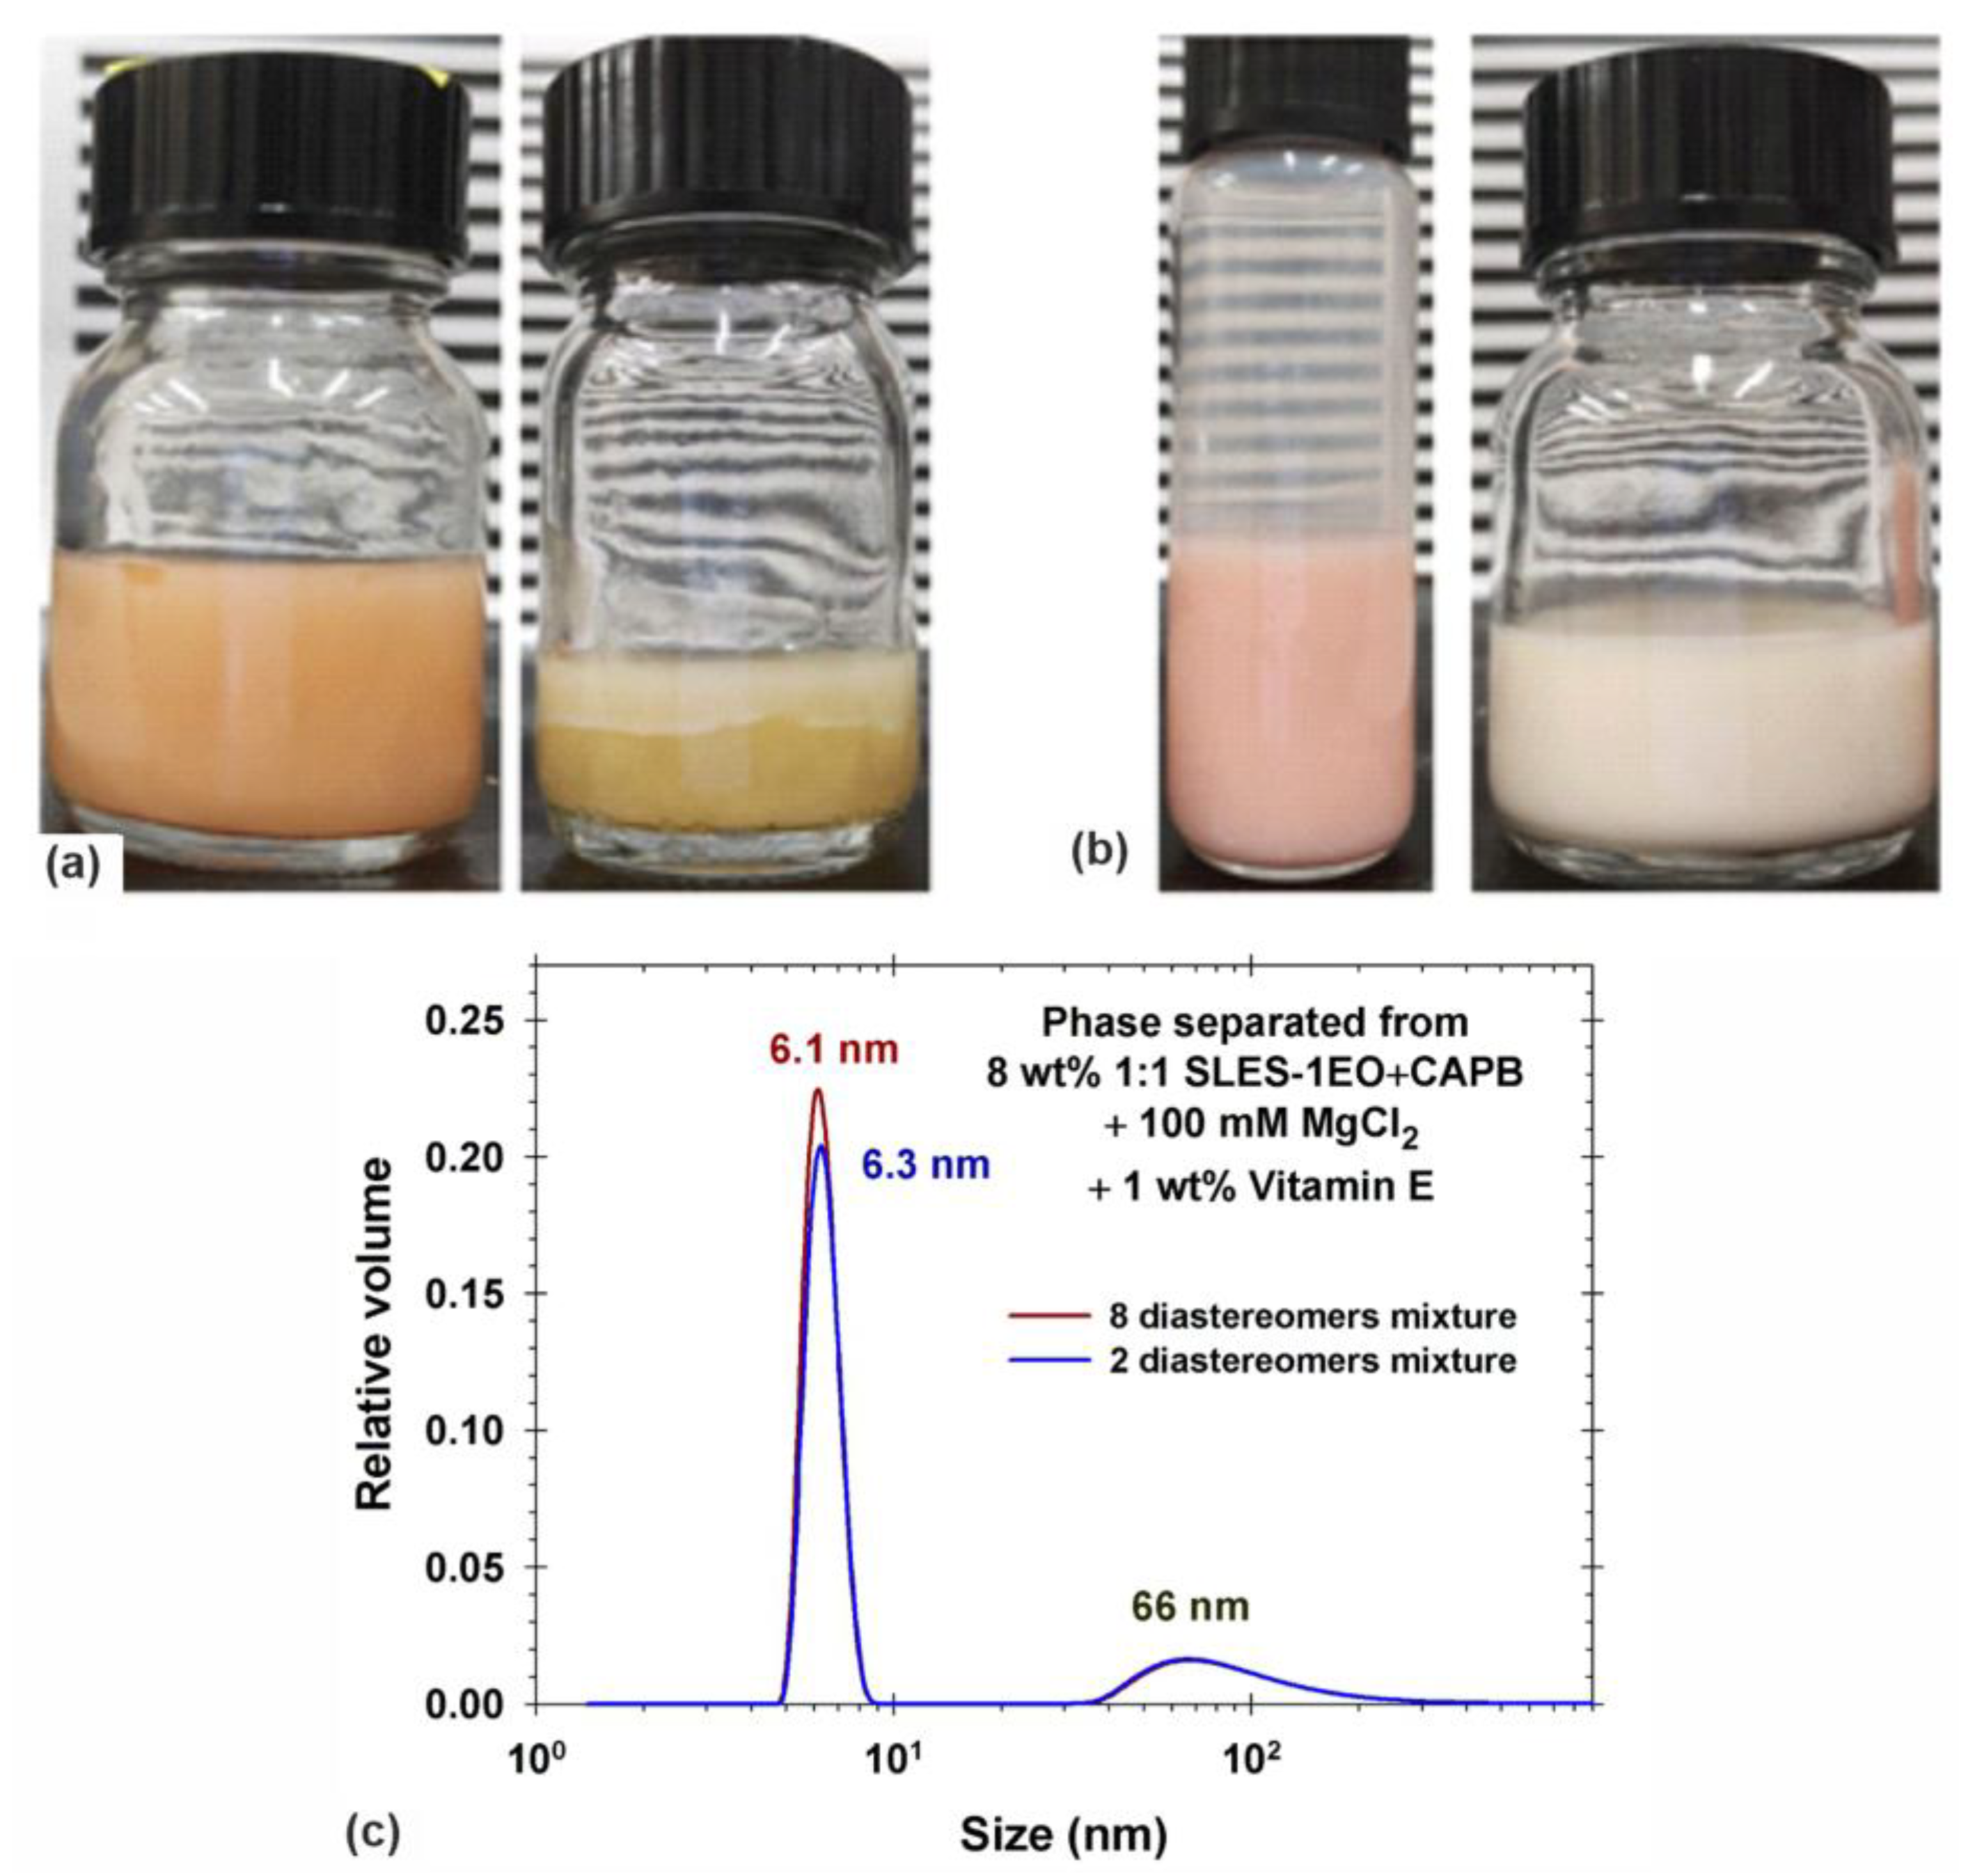
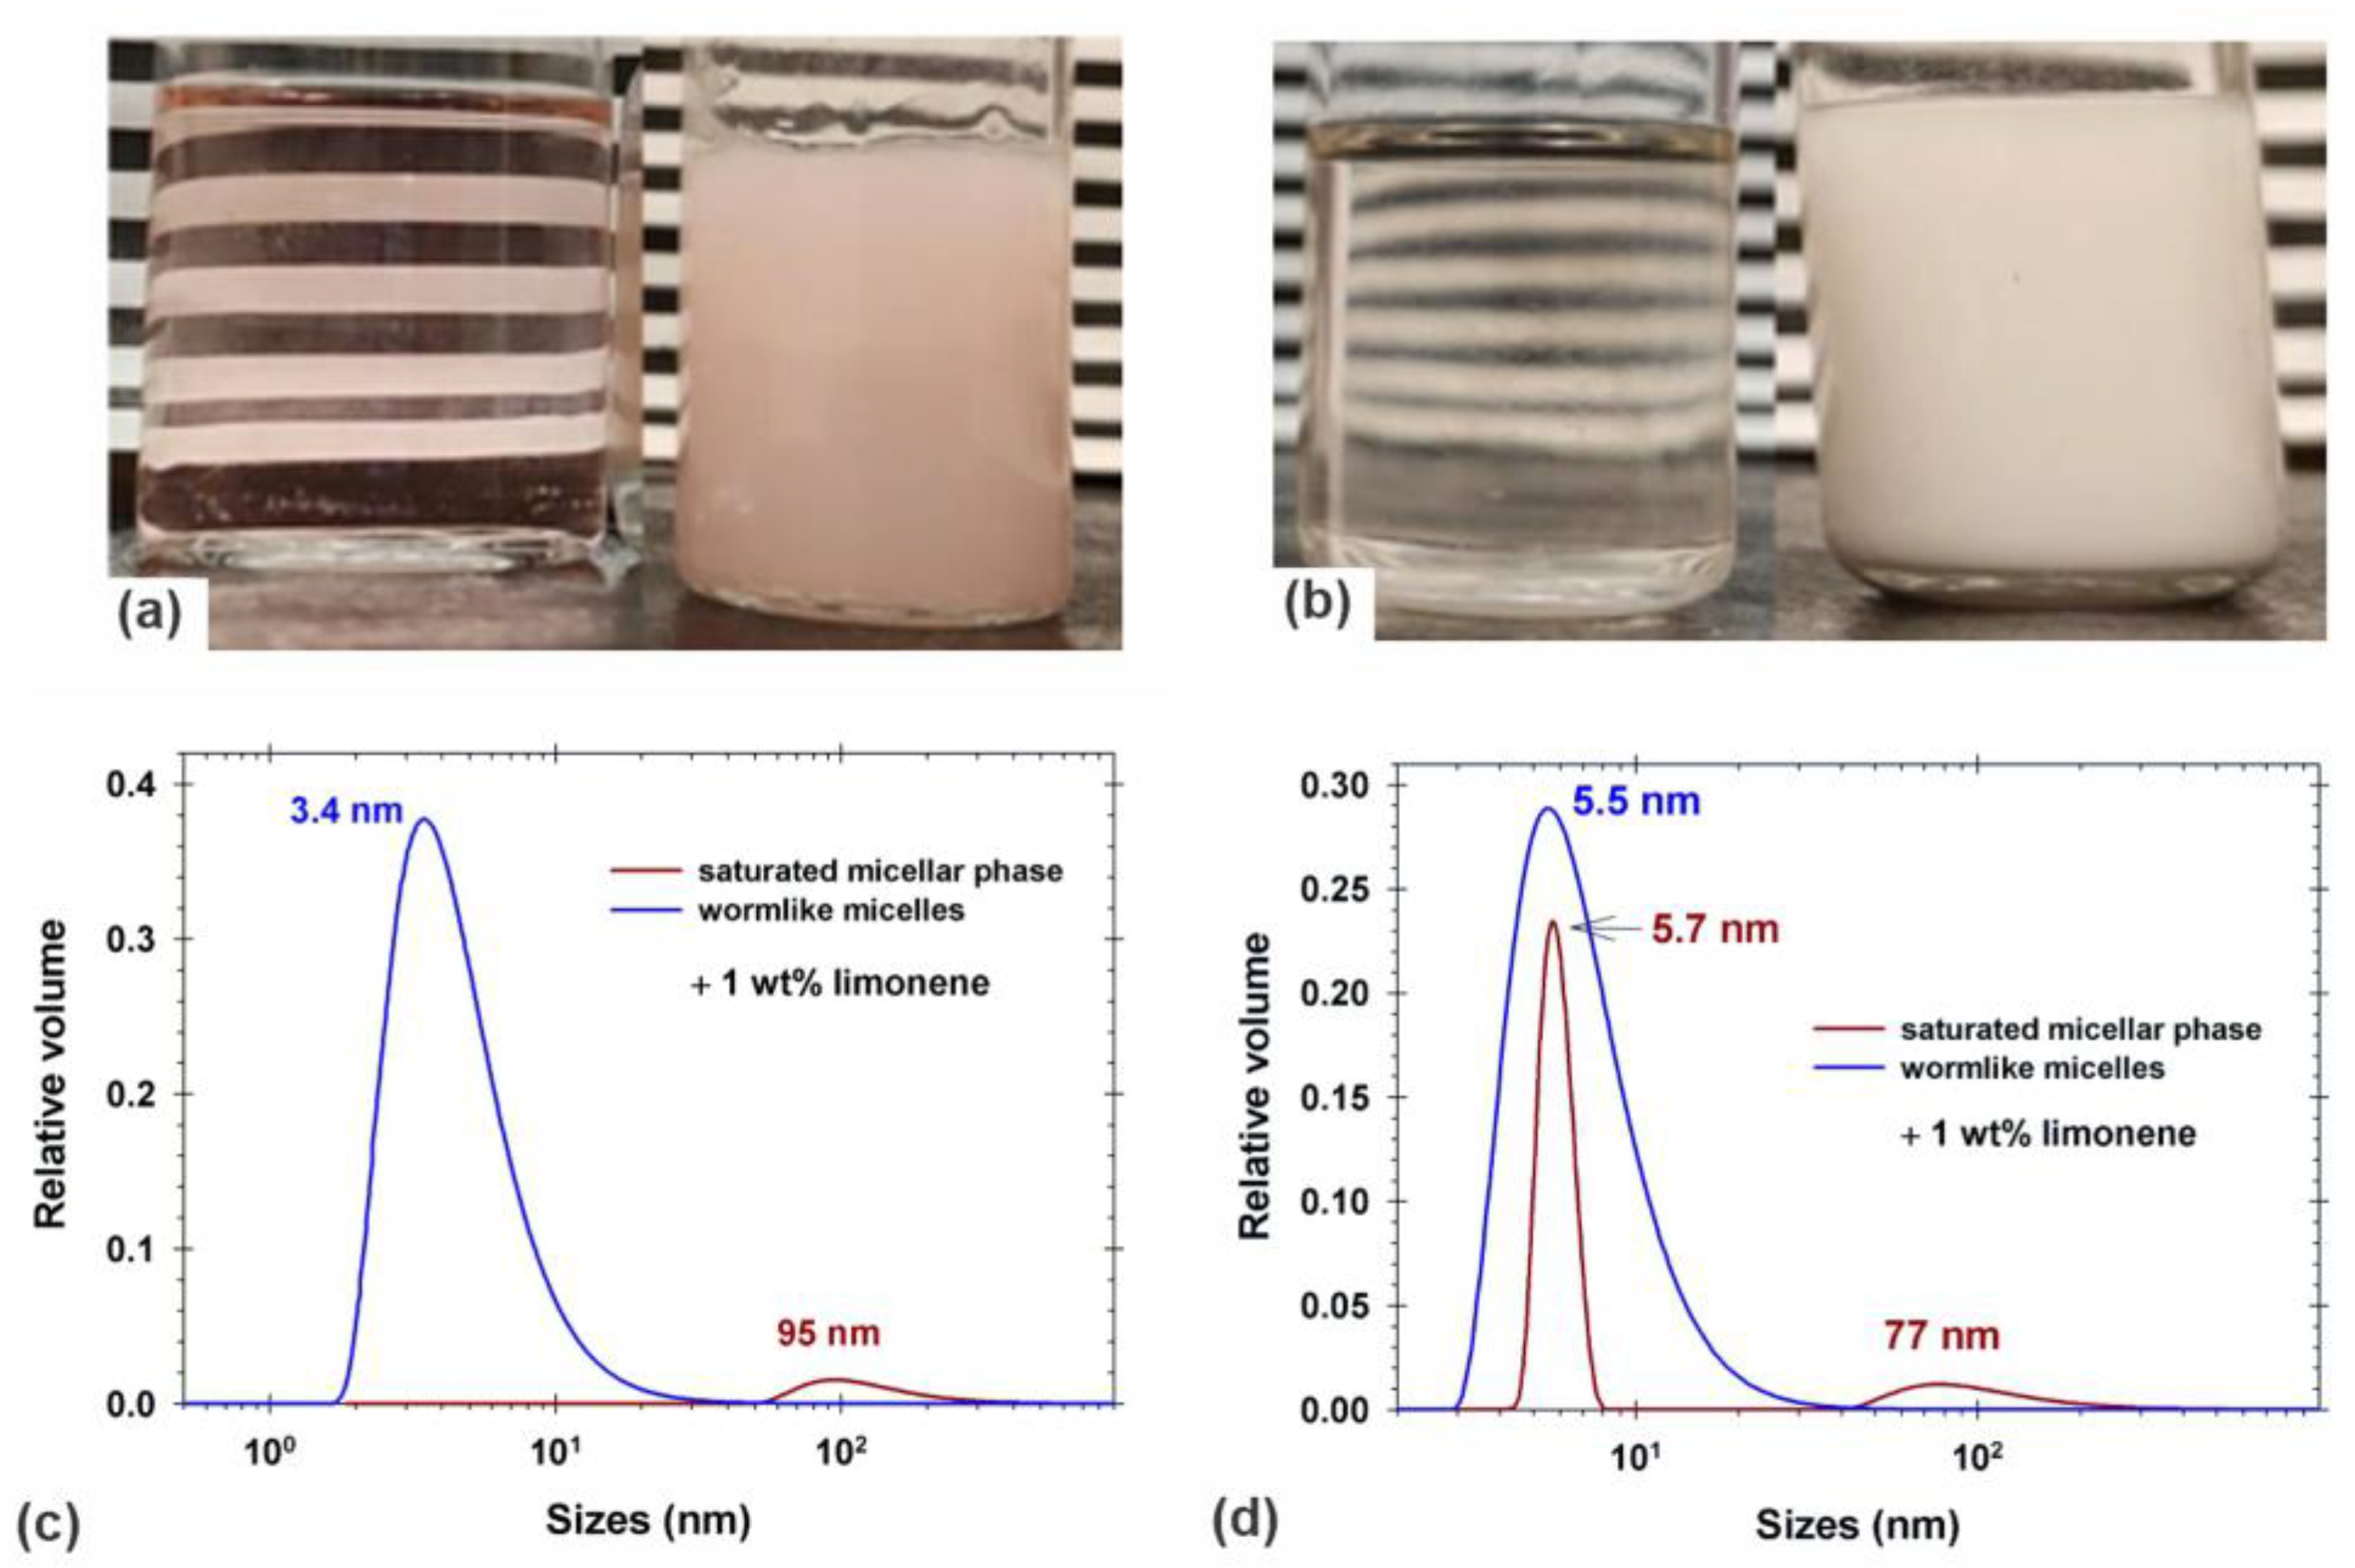
4. Nanoemulsification of Limonene and Vitamin E

One of the important properties of the isolated saturated micellar phase from SLES-1EO+CAPB is its possibility to easily engulf small fragrance molecules (e.g., limonene) and to form nanoemulsions upon dilution [23]. To obtain the total surfactant concentration in the separated saturated micellar phase from 8 wt% 1:1 SLES-1EO+DDAO, we placed the sample in an oven at 50 °C and left it there for several days. During this period of time, the petri dish was regularly taken out of the oven and weighed until the weight of the petri dish + saturated micellar phase reached a constant value. From the weight of the initial (wet) sample of the saturated micellar phase and the respective final constant weight of the dried sample, we observed that the total surfactant concentration was 12 wt% (442 mM).
To distinguish the difference between the wormlike micellar solutions and the isolated phase, oil-soluble dye (Sudan III) is added to the limonene in order to visualize the location of the oil. The colored limonene is added to the isolated micellar phase and 12 wt% 1:1 SLES-1EO+DDAO (without added salt), and the respective mixtures are stirred by a magnetic stirrer at room temperature for one hour. The concentration of added limonene is 1 wt% in both bottles. The obtained solutions are shown in Figure 8a. The wormlike solution (the left picture in Figure 8a) is transparent and it does not form an emulsion in the presence of limonene—the oily substances are solubilized inside the micelles. This is evidenced by the homogeneous pale red color of the solution. In the isolated saturated micellar phase (the right picture in Figure 8a), the limonene is dispersed into droplets and the solution is very turbid. The turbidity is due to the solubilized limonene in the junctions of the micellar network.
For the DLS measurements of the size distribution, we took a small sample of the solutions and diluted it 100 times with water. Figure 8c shows the obtained results from both dispersions containing SLES-1EO and DDAO. Because of the dilution for the DLS experiments, the total surfactant concentration in both solutions is 4.4 mM. In the case of 12 wt% 1:1 SLES-1EO+DDAO (without added salt), micelles with a lognormal size distribution and a mean size of 3.4 nm are observed in the diluted solution—there are no emulsion droplets. In the case of the isolated micellar phase, the nanoemulsion is observed with a mean droplet size of 95 nm.
The effect of the type of zwitterionic surfactant is illustrated in Figure 8. The addition of 100 mM MgCl2 to 8 wt% 1:1 SLES-1EO+CAPB leads to phase separation of the mixed micellar solution (Figure 2c). This scenario is analogous to the experiments with DDAO. The dried sample of the isolated bicontinuous phase contains 15 wt% surfactants, which corresponds to 445 mM total surfactant concentration. Note that the total molar surfactant concentrations in the isolated phases in the case of DDAO and CAPB are approximately equal. The colored limonene is added to 15 wt% 1:1 SLES-1EO+CAPB without added MgCl2 (the left picture in Figure 8b) and in the isolated saturated micellar phase (the right picture in Figure 8b). The turbidities of the obtained dispersions are analogous to that shown in Figure 8a. The wormlike micellar solution is transparent and that with an isolated micellar phase is quite turbid. The DLS measurements of the size distribution of dilute solutions are summarized in Figure 8d. In the case of 15 wt% 1:1 SLES-1EO+CAPB (without added salt), the limonene is solubilized in the micelles with a mean size of 5.5 nm—there are no emulsion droplets. This illustrates the formation of slightly smaller, compared with the case of DDAO, nanodroplets with a mean size of 77 nm in the case of the bicontinuous micellar phase. The main difference is that the nanoemulsion droplets coexist with mixed swollen micelles. The mean size of the swollen micelles is 5.7 nm, which is larger than the typical size of mixed 1:1 SDS+CAPB and 1:1 SLES-3EO+CAPB micelles of 4.8 nm [58].
To characterize the nanoemulsification capacity of the saturated micellar phases with respect to added limonene, we prepared large amounts of 8 wt% 1:1 SLES-1EO+DDAO + 70 mM CaCl2 and 8 wt% 1:1 SLES-1EO+CAPB + 100 mM MgCl2 and left them to rest for the complete phase separation. We divided the isolated phases into equal portions and added different concentrations of colored limonene. The vials are stirred for 1 h at room temperature and after that are left for at least one week at rest. The photographs of the bottles with dispersions are shown in Figure S9. Note that both isolated micellar phases contain about 450 mM total surfactant concentrations. This illustrates that the DDAO phase engulfs up to 8 wt% limonene and the CAPB phase has a higher capacity—up to 10 wt%. limonene The DLS measurements of the diluted samples from DDAO-containing nanoemulsions (Figure 9a) show that with the increase in the limonene weight fraction, the sizes of nanoemulsion droplets slightly increase (from 95 nm in the case of 1 wt% limonene to 119 nm in the case of 7 wt% limonene). The obtained size distributions of nanoemulsion droplets in the case of CAPB are shown in Figure 9b. The increase in limonene weight fraction results in a more pronounced increase in the sizes of nanoemulsion droplets (from 77 nm in the case of 1 wt% limonene to 113 nm in the case of 8 wt% limonene). Note that the addition of 8 wt% limonene leads to the disappearance of the peak corresponding to swollen micelles, which is measured in the presence of 1 wt% added limonene (see Figure 8d). Because of the considerably larger number of droplets, the needed surfactants for the stabilization of nanoemulsion increase, and the number of swollen micelles becomes negligible.
The second oily substance that we tried to emulsify with the saturated micellar phase is vitamin E and the results are illustrated in Figure 10a,b. Figure 10a shows the results for the addition of 1 wt% vitamin E to the isolated bicontinuous phase from 8 wt% 1:1 SLES-1EO+DDAO in the presence of 70 mM CaCl2: vitamin E in the left vial is a mixture of eight diastereomers, while in the right one, it is a mixture of two diastereomers. In the left vial, the oily substance, which is homogenously dispersed in the saturated micellar phase, is seen and, also, several drops of non-dispersed vitamin E can be seen. In the right bottle, we observed phase separation of the added vitamin E. Thus, both samples of vitamin E cannot be completely dispersed in 1:1 SLES-1EO+DDAO + 70 mM CaCl2 saturated micellar phase, even at such low concentration (1 wt%).
In contrast, 1 wt% of both 8-diastereomer and 2-diastereomer mixtures of vitamin E are completely engulfed by the saturated micellar phase separated from 8 wt% 1:1 SLES-1EO+CAPB micellar solution in the presence of 100 mM MgCl2. Figure 10b shows pictures of respective micellar phases with vitamin E taken after more than two months. In both cases, a homogeneous distribution of the oily substance is well illustrated—non-dispersed drops of vitamin E and/or phase separation are not observed.
Figure 10c shows the DLS results for the size distribution of emulsions obtained upon the dilution of dispersions obtained in the case of CAPB. For both samples of vitamin E, the mean sizes of nanoemulsion droplets are equal—66 nm. These droplets coexist with swollen micelles of mean sizes 6.1 nm and 6.3 nm, respectively. Thus, the CAPB-containing saturated micellar phase has different properties than the DDAO-containing phase with respect to the possibility of being used for nanoemulsification of vitamin E. Note that with respect to limonene, both kinds of zwitterionic surfactants have quite similar properties (see Figure 9).
The nanoemulsification capacity of SLES-1EO+CAPB saturated micellar phases decreases with the rise in the van der Waals volume of the oil molecule and does not correlate with its lipophilicity characterized by logP [23]. In our case, the van der Waals volume of limonene is 154.7 Å3 and that of vitamin E is in the order of 430 Å3 [59]. This explains the lower nanoemulsification capacity observed in the case of vitamin E.
It is important to note that all isolated saturated micellar phases and the respective obtained nanoemulsions (Figure 8, Figure 9 and Figure 10) are thermodynamically stable. There were no phase separation or oil lenses seen and no change of the size distributions for at least three months.

5. Conclusions

The properties of the saturated micellar (sponge) phase, which can be isolated from SLES-1EO+CAPB mixed micellar solutions in the presence of divalent salts, are studied in the literature [23,52]. Here, we extended the range of surfactants and investigated the mixtures of ionic (SDS, SLES-1EO, and SLES-3EO) and zwitterionic (CAPB and DDAO) surfactants in the presence of divalent salts (MgCl2, CaCl2, and ZnCl2) and NaCl. The general conclusion is that the increase in the number of ethylene oxide groups in ionic surfactants prevents the transition of the branched micelles to a multiconnected micellar phase in the presence of salts—mixtures with SLES-3EO do not form bicontinuous micellar phases. SDS can be used to produce this kind of phase but with an appropriate zwitterionic surfactant (with CAPB, the sponge phase was obtained, while with DDAO, it was not). The best choice is to use SLES-1EO as an anionic surfactant in the case of both CAPB and DDAO.
The saturated micellar phases are formed in a narrow range of added divalent (MgCl2 and CaCl2) salt concentrations from about 40-50 mM to 70-80 mM and, also, in the presence of considerably larger NaCl concentrations from 0.9 M to 1.0 M. Thus, the addition of monovalent salts can lead to phase separation at a high salinity of the micellar solutions. The bicontinuous structure of the sponge phases is proved by using lipophilic and hydrophilic dyes and SAXS measurements. The interfaces between saturated micellar phases and water-rich phases behave as flexible membranes with low interfacial tension and pronounced elasticity. The bulk properties of the isolated sponge phases (i) are independent of the concentration of the initial solution from which they are separated; (ii) show shear-thinning rheological response; (iii) have Newtonian behavior at high enough shear rates with Newtonian viscosities in the range of 0.3 Pa·s to 0.8 Pa·s.
The main advantage of the separated saturated micellar phases is their ability to engulf small fragrance molecules and vitamin E, which are homogeneously dispersed in the junctions of the micellar networks. Upon dilution, these dispersions spontaneously form nanoemulsions. For example, the capacity of the sponge phases isolated from 8 wt% 1:1 SLES-1EO+DDAO and 8 wt% 1:1 SLES-1EO+CAPB in the presence of divalent salts to engulf limonene is from 8 wt% to 10 wt% limonene, respectively. The ability of nanoemulsification in the case of vitamin E depends on the type of zwitterion—CAPB-containing saturated micellar phases can be used to produce vitamin E nanoemulsion, while even 1 wt% vitamin E is not fully dispersed in DDAO-containing sponge phases.

Supplementary Materials

The following supporting information can be downloaded at: https://www.mdpi.com/article/10.3390/colloids8010011/s1. Figure S1: Photographs of 8 wt% 1:1 SDS+DDAO solutions in the presence of (a) MgCl2; (b) CaCl2. Figure S2: Photographs of 8 wt% 1:1 SLES-3EO+DDAO solutions in the presence of CaCl2. Figure S3: Photographs of 8 wt% 1:1 SDS+CAPB solutions in the presence of (a) MgCl2; (b) CaCl2. Figure S4: Confirmation of the bicontinuous nature of the obtained micellar phase in the case of 8 wt% 1:1 SLES-1EO+DDAO + 70 mM CaCl2. Figure S5: Apparent viscosity as a function of the shear rate for the system 8 wt% 1:1 SLES-1EO+DDAO in the presence of different concentrations of CaCl2. Figure S6: Apparent viscosity as a function of the shear rate for the system 8 wt% 1:1 SLES-1EO+DDAO in the presence of different concentrations of MgCl2. Figure S7: Apparent viscosity as a function of the shear rate for the system 8 wt% 1:1 SLES-1EO+DDAO in the presence of different concentrations of NaCl. Figure S8: Phase separation (a) and apparent viscosity as a function of the shear rate (b) for the system 8 wt% 1:1 SLES-1EO+DDAO + NaCl in the presence of different concentrations of MgCl2. Figure S9: Photographs of the vials containing different concentrations of limonene in the saturated micellar phases separated from a solution of (a) 8 wt% 1:1 SLES-1EO+DDAO + 70 mM CaCl2; (b) 8 wt% 1:1 SLES-1EO+CAPB + 100 mM MgCl2. Figure S10. Microscopic images of 8 wt% 1:1 SLES-1EO+DDAO + 70 mM CaCl2 solution obtained in polarized and transmitted light using optical microscope AxioImager M2m. Table S1. Turbidity and pH of 4 wt% individual surfactant solutions in the presence of divalent salts. Table S2. Main properties of 8 wt% 1:1 ionic+zwitterionic surfactants in the presence of divalent salts.

Author Contributions

Investigation, methodology, data curation, T.G.S.; data curation, writing—original draft preparation, G.M.R.; supervision, writing—review and editing, K.D.D. All authors have read and agreed to the published version of the manuscript.

Funding

This research was funded by the National Science Fund of Bulgaria, Grant No. KП-06-ПH 49/5.

Data Availability Statement

The data from this study are available upon request made to the corresponding author.

Acknowledgments

The authors are grateful to M.T. Georgiev for the useful discussions of the obtained experimental results.

Conflicts of Interest

The authors declare no conflicts of interest.

References

  1. Cappelaere, E.; Cressely, R. Rheological behavior of an elongated micellar solution at low and high salt concentrations. Colloid. Polym. Sci. 1998, 276, 1050–1056. [Google Scholar] [CrossRef]
  2. Cappelaere, E.; Cressely, R. Influence of NaClO3 on the rheological behavior of a micellar solution of CPCl. Rheol. Acta 2000, 39, 346–353. [Google Scholar] [CrossRef]
  3. Nicolas-Morgantini, L. Giant micelles and shampoos. In Giant Micelles. Properties and Application; Zana, R., Kaler, E.W., Eds.; Taylor and Francis: Boca Raton, FL, USA, 2007; pp. 493–514. ISBN 1420007122, 978-1420007121. [Google Scholar]
  4. Parker, A.; Fieber, W. Viscoelasticity of anionic wormlike micelles: Effects of ionic strength and small hydrophobic molecules. Soft Matter 2013, 9, 1203–1213. [Google Scholar] [CrossRef]
  5. Yavrukova, V.I.; Radulova, G.M.; Danov, K.D.; Kralchevsky, P.A.; Xu, H.; Ung, Y.W.; Petkov, J.T. Rheology of mixed solutions of sulfonated methyl esters and betaine in relation to the growth of giant micelles and shampoo applications. Adv. Colloid. Interface Sci. 2020, 275, 102062. [Google Scholar] [CrossRef]
  6. Mitrinova, Z.; Alexandrov, H.; Denkov, N.; Tcholakova, S. Effect of counter-ion on rheological properties of mixed surfactant solutions. Colloids Surf. A 2022, 643, 128746. [Google Scholar] [CrossRef]
  7. Porte, G.; Gomati, R.; El Haitamy, O.; Appell, J.; Marignan, J. Morphological transformations of the primary surfactant structures in brine-rich mixtures of ternary systems (surfactant/alcohol/brine). J. Phys. Chem. 1986, 90, 5746–5751. [Google Scholar] [CrossRef]
  8. Drye, T.J.; Cates, M.E. Living networks: The role of cross-links in entangled surfactant solutions. J. Chem. Phys. 1992, 96, 1367–1375. [Google Scholar] [CrossRef]
  9. Candau, S.J.; Khatory, A.; Lequeux, F.; Kern, F. Rheological behavior of wormlike micelles: Effect of salt content. J. Phys. IV 1993, 3, 197–209. [Google Scholar] [CrossRef]
  10. Khatory, A.; Kern, F.; Lequeux, F.; Appell, J.; Porte, G.; Morie, N.; Ott, A.; Urbach, W. Entanglement versus multiconnected network of wormlike micelles. Langmuir 1993, 9, 933–939. [Google Scholar] [CrossRef]
  11. Lequeux, F.; Candau, S.J. Dynamical properties of wormlike micelles. In Structure and Flow in Surfactant Solutions; Herb, C.A., Prud’homme, R.K., Eds.; American Chemical Society: Washington, DC, USA, 1994; pp. 51–62. ISBN 0841230544, 978-0841230545. [Google Scholar]
  12. Cates, M.E.; Fielding, S.M. Rheology of giant micelles. Ads. Phys. 2006, 55, 799–879. [Google Scholar] [CrossRef]
  13. Nettesheim, F. Phase behavior of systems with wormlike micelles. In Giant Micelles. Properties and Application; Zana, R., Kaler, E.W., Eds.; Taylor and Francis: Boca Raton, FL, USA, 2007; pp. 223–248. ISBN 1420007122, 978-1420007121. [Google Scholar]
  14. Appel, J.; Porte, G. Cloud point in ionic surfactant solutions. J. Phys. Lett. 1983, 44, L-689–L-695. [Google Scholar] [CrossRef]
  15. Magid, L.J. The surfactant-polyelectrolyte analogy. J. Phys. Chem. B 1998, 102, 4064–4074. [Google Scholar] [CrossRef]
  16. Kato, T.; Terao, T.; Seimiya, T. Intermicellar migration of surfactant molecules in entangled micellar solutions. Langmuir 1994, 10, 4468–4474. [Google Scholar] [CrossRef]
  17. Kato, T. Surfactant self-diffusion and networks of wormlike micelles in concentrated solutions of nonionic surfactants. Progr. Colloid. Polym. Sci. 1996, 100, 15–18. [Google Scholar] [CrossRef]
  18. Bernheim-Groswasser, A.; Wachtel, E.; Talmon, Y. Micellar growth, network formation and criticality in aqueous solutions of the nonionic surfactant C12E5. Langmuir 2000, 16, 4131–4140. [Google Scholar] [CrossRef]
  19. Nilsson, F.; Söderman, O.; Reimer, J. Phase separation and aggregate-aggregate interactions in the C9G1/C10G1 β-Alkyl Glucosides/Water System. A Phase Diagram and NMR Self-Diffusion Study. Langmuir 1998, 14, 6396–6402. [Google Scholar] [CrossRef]
  20. Koehler, R.D.; Raghavan, S.R.; Kaler, E.W. Microstructure and dynamics of wormlike micellar solutions formed by mixing cationic and anionic surfactants. J. Phys. Chem. B 2000, 104, 11035–11044. [Google Scholar] [CrossRef]
  21. Zana, R.; Kaler, E.W. (Eds.) Linear rheology of aqueous solutions of wormlike micelles. In Giant Micelles. Properties and Application; Zana, R.; Kaler, E.W. (Eds.) Taylor and Francis: Boca Raton, FL, USA, 2007; pp. 249–287. ISBN 1420007122, 978-1420007121. [Google Scholar]
  22. Rogers, S.A.; Calabrese, M.A.; Wagner, N.J. Rheology of branched wormlike micelles. Curr. Opin. Colloid. Interface Sci. 2014, 19, 530–535. [Google Scholar] [CrossRef]
  23. Georgiev, M.T.; Aleksova, L.A.; Kralchevsky, P.A.; Danov, K.D. Phase separation of saturated micellar network and its potential application for nanoemulsification. Colloids Surf. A 2020, 607, 125487. [Google Scholar] [CrossRef]
  24. Patel, R.B.; Patel, M.R.; Thakore, S.D.; Patel, B.G. Nanoemulsion as a valuable nanostructure platform for pharmaceutical drug delivery. In Nano-and Microscale Drug Delivery Systems; Grumezescu, A.M., Ed.; Elsevier: Amsterdam, The Netherlands, 2017; pp. 321–341. [Google Scholar] [CrossRef]
  25. Nguyen, T.T.L.; Anton, N.; Vandamme, T.F. Oral pellets loaded with nanoemulsions. In Nanostructures for Oral Medicine; Andronescu, E., Grumezescu, A.M., Eds.; Elsevier: Amsterdam, The Netherlands, 2017; pp. 203–230. [Google Scholar] [CrossRef]
  26. Chircov, C.; Grumezescu, A.M. Nanoemulsion preparation, characterization, and application in the field of biomedicine. In Nanoarchitectonics in Biomedicine; Grumezescu, A.M., Ed.; Elsevier: Amsterdam, The Netherlands, 2019; pp. 169–188. [Google Scholar] [CrossRef]
  27. Choudhury, H.; Pandey, M.; Gorain, B.; Chatterjee, B.; Madheswaran, T.; Md, S.; Mak, K.-K.; Tambuwala, M.; Chourasia, M.K.; Kesharwani, P. Nanoemulsions as effective carriers for the treatment of lung cancer. In Nanotechnology-Based Targeted Drug Delivery Systems for Lung Cancer; Kesharwani, P., Ed.; Elsevier: Amsterdam, The Netherlands, 2019; pp. 217–247. ISBN 9780128163672. [Google Scholar]
  28. Szczepanowicz, K.; Hoel, H.J.; Szyk-Warszynska, L.; Bielańska, E.; Bouzga, A.M.; Gaudernack, G.; Simon, C.; Warszynski, P. Formation of biocompatible nanocapsules with emulsion core and pegylated shell by polyelectrolyte multilayer adsorption. Langmuir 2010, 26, 12592–12597. [Google Scholar] [CrossRef]
  29. Szczepanowicz, K.; Podgórna, K.; Szyk-Warszyńska, L.; Warszyński, P. Formation of oil filled nanocapsules with silica shells modified by sequential adsorption of polyelectrolytes. Colloids Surf. A 2014, 441, 885–889. [Google Scholar] [CrossRef]
  30. Szczepanowicz, K.; Bzowska, M.; Kruk, T.; Karabasz, A.; Bereta, J.; Warszynski, P. Pegylated polyelectrolyte nanoparticles containing paclitaxel as a promising candidate for drug carriers for passive targeting. Colloids Surf. B 2016, 143, 463–471. [Google Scholar] [CrossRef]
  31. Miller, J.H.; Quebedeaux, D.A.; Sauer, J.D. Amine oxide/alcohol ethoxylate blends: Zero-phosphate, high-performance, hard-surface cleaners. J. Am. Oil Chem. Soc. 1995, 72, 857–859. [Google Scholar] [CrossRef]
  32. Kolp, D.G.; Laughlin, R.G.; Krause, F.P.; Zimmerer, R.E. Interaction of dimethyldodecylamine oxide with sodium dodecylbenzenesulfonate in dilute solution. J. Phys. Chem. 1963, 67, 51–55. [Google Scholar] [CrossRef]
  33. Weers, J.G.; Rathman, J.F.; Scheuing, D.R. Structure/performance relationships in long chain dimethylamine oxide/sodium dodecylsulfate surfactant mixtures. Colloid. Polym. Sci. 1990, 268, 832–846. [Google Scholar] [CrossRef]
  34. Soontravanich, S.; Munoz, J.A.; Scamehorn, J.F.; Harwell, J.H.; Sabatini, D.A. Interaction between and anionic and an amphoteric surfactant. Part I: Monomer-micelle equilibrium. J. Surfact. Deterg. 2008, 11, 251–261. [Google Scholar] [CrossRef]
  35. Soontravanich, S.; Walsh, S.; Scamehorn, J.F.; Harwell, J.H.; Sabatini, D.A. Interaction between and anionic and an amphoteric surfactant. Part II: Precipitation. J. Surfact. Deterg. 2009, 12, 145–154. [Google Scholar] [CrossRef]
  36. Kakitani, M.; Imae, T.; Furusaka, M. Investigation of mixed micelles of dodecyldimethylamine oxide and sodium dodecyl sulfate by SANS: Shape, size, charge, and interaction. J. Phys. Chem. 1995, 99, 16018–16023. [Google Scholar] [CrossRef]
  37. Varade, D.; Joshi, T.; Aswal, V.K.; Goyal, P.S.; Hassan, P.A.; Bahadur, P. Micellar behavior of mixtures of sodium dodecyl sulfate and dodecyldimethylamine oxide in aqueous solutions. Colloids Surf. A 2005, 259, 103–109. [Google Scholar] [CrossRef]
  38. Goloub, T.P.; Pugh, R.J.; Zhmud, B.V. Micellar interactions in nonionic/ionic mixed surfactant systems. J. Colloid. Interf. Sci. 2000, 229, 72–81. [Google Scholar] [CrossRef]
  39. Smirnova, N.A.; Murch, B.; Pukinsky, I.B.; Churjusova, T.G.; Alexeeva, M.V.; Vlasov, A.Y.; Mokrushina, L.V. Phase boundaries for mixed aqueous micellar solutions of dimethyldodecylamine oxide and sodium or magnesium dodecyl sulfate with regard to chemical processes in the systems. Langmuir 2002, 18, 3446–3453. [Google Scholar] [CrossRef]
  40. Khodaparast, S.; Sharratt, W.N.; Tyagi, G.; Dalgliesh, R.M.; Robles, E.S.J.; Cabral, J.T. Pure and mixed aqueous micellar solutions of sodium dodecyl sulfate (SDS) and dimethyldodecyl amine oxide (DDAO): Role of temperature and composition. J. Colloid. Interf. Sci. 2021, 582, 1116–1127. [Google Scholar] [CrossRef]
  41. Tyagi, G.; Seddon, D.; Khodaparast, S.; Sharratt, W.N.; Roble, E.S.J.; Cabral, J.T. Tensiometry and FTIR study of the synergy in mixed SDS:DDAO surfactant solution in varying pH. Colloids Surf. A 2021, 618, 126414. [Google Scholar] [CrossRef]
  42. Safonova, E.A.; Alexeeva, M.V.; Smirnova, N.A. The effect of acidity on micellization in dodecyldimethylamine oxide-sodium dodecyl sulfate aqueous mixtures. Colloid. J. 2009, 71, 717–724. [Google Scholar] [CrossRef]
  43. Safonova, E.A.; Alekseeva, M.V.; Filippov, S.K.; Durrschmidt, T.; Mokrushina, L.V.; Hoffmann, H.; Smirnova, N.A. The structure and rheology of mixed micellar solutions of sodium dodecyl sulfate and dodecyldimethylamine oxide. Russ. J. Phys. Chem. 2006, 80, 915–921. [Google Scholar] [CrossRef]
  44. Summerton, E.; Hollamby, M.J.; Le Duff, C.S.; Thompson, E.S.; Snow, T.; Smith, A.J.; Jones, C.; Bettiol, J.; Bakalis, S.; Britton, M.M. Nuclear magnetic resonance and small-angle X-ray scattering studies of mixed sodium dodecyl sulfate and N,N-dimethyldodecylamine N-oxide aqueous systems performed at low temperatures. J. Colloid. Interf. Sci. 2019, 535, 1–7. [Google Scholar] [CrossRef] [PubMed]
  45. Hao, J.; Hoffmann, H.; Horbaschek, K. A novel cationic/anionic surfactant system from a zwitterionic alkyldimethylamine oxide and dihydroperfluorooctanoic acid. Langmuir 2001, 17, 4151–4160. [Google Scholar] [CrossRef]
  46. Hoffmann, H.; Thunig, C.; Valiente, M. The different phases and their macroscopic properties in ternary surfactant systems of alkyldimethylamine oxides, intermediate chain n-alcohols and water. Colloids Surf. 1992, 67, 223–237. [Google Scholar] [CrossRef]
  47. Blagojević, S.M.; Pejić, N.D.; Blagojević, S.N. Synergism and physicochemical properties of anionic/amphoteric surfactant mixtures with nonionic surfactant of amine oxide type. Russ. J. Phys. Chem. 2017, 91, 2690–2695. [Google Scholar] [CrossRef]
  48. Lin, Z. Branched worm-like micelles and their networks. Langmuir 1996, 12, 1729–1737. [Google Scholar] [CrossRef]
  49. Birnie, C.R.; Malamud, D.; Schnaare, R.L. Antimicrobial Evaluation of N-Alkyl Betaines and N-Alkyl-N,N-Dimethylamine Oxides with Variations in Chain Length. Antimicrob. Agents Chemother. 2000, 44, 2514–2517. [Google Scholar] [CrossRef]
  50. Singh, S.K.; Bajpai, M.; Tyagi, V.K. Amine oxides: A review. J. Oleo Sci. 2006, 55, 99–119. [Google Scholar] [CrossRef]
  51. Garcia, M.T.; Campos, E.; Ribosa, I. Biodegradability and ecotoxicity of amine oxide-based surfactants. Chemosphere 2007, 69, 1574–1578. [Google Scholar] [CrossRef]
  52. Stancheva, T.S.; Georgiev, M.T.; Radulova, G.M.; Danov, K.D.; Marinova, K.G. Rheology of saturated micellar networks: Wormlike micellar solutions vs. bicontinuous micellar phases. Colloids Surf. A 2022, 652, 129927. [Google Scholar] [CrossRef]
  53. Bhattacharya, A.; Niederholtmeyer, H.; Podolsky, K.A.; Bhattacharya, R.; Song, J.-J.; Brea, R.J.; Tsai, C.-H.; Sinha, S.K.; Devaraj, N.K. Lipid sponge droplets as programmable synthetic organelles. Proc. Natl. Acad. Sci. USA 2020, 117, 18206–18215. [Google Scholar] [CrossRef] [PubMed]
  54. Tartaro, G.; Gentile, L.; Palazzo, G. Characteristic length and curvature of AOT/brine/squalene “sponge” L3 phases. J. Colloid. Interface Sci. Open 2023, 9, 100077. [Google Scholar] [CrossRef]
  55. Gilbert, J.; Christensen, S.; Nylander, T.; Bülow, L. Encapsulation of sugar beet phytoglobin BvPgb 1.2 and myoglobin in a lipid sponge phase system. Front. Soft. Matter. 2023, 3, 1201561. [Google Scholar] [CrossRef]
  56. Barauskas, J.; Johnsson, M.; Tiberg, F. Self-assembled lipid superstructures: Beyond vesicles and liposomes. Nano Lett. 2005, 8, 1615–1619. [Google Scholar] [CrossRef] [PubMed]
  57. Valldeperas, M.; Wisniewska, M.; Ram-On, M.; Kesselman, E.; Danino, D.; Nylander, T.; Barauskas, J. Sponge phases and nanoparticle dispersions in aqueous mixtures of mono- and diglycerides. Langmuir 2016, 32, 8650–8659. [Google Scholar] [CrossRef] [PubMed]
  58. Christov, N.C.; Denkov, N.D.; Kralchevsky, P.A.; Ananthapadmanabhan, K.P.; Lips, A. Synergistic sphere-to-rod micelle transition in mixed solutions of sodium dodecyl sulfate and cocoamidopropyl betaine. Langmuir 2004, 20, 565–571. [Google Scholar] [CrossRef] [PubMed]
  59. Khallouki, F.; de Medina, P.; Caze-Subra, S.; Bystricky, K.; Balaguer, P.; Poirot, M.; Silvente-Poirot, S. Molecular and biochemical analysis of the estrogenic and proliferative properties of Vitamin E compounds. Front. Oncol. 2016, 5, 287. [Google Scholar] [CrossRef] [PubMed]
Figure 1. Chemical structures of the surfactants and oily substances: (a) SDS; (b) n = 1 corresponds to SLES-1EO and n = 3—SLES-3EO; (c) DDAO; (d) CAPB; (e) limonene; (f) vitamin E.
Colloids 08 00011 g001
Figure 2. Photographs of 8 wt% 1:1 SLES-1EO + zwitterionic surfactant solutions, illustrating the effect of the added inorganic salt: (a) SLES-1EO+DDAO+MgCl2; (b) SLES-1EO+DDAO+CaCl2; (c) SLES-1EO+CAPB+MgCl2; (d) SLES-1EO+CAPB+CaCl2. The divalent salt concentrations are denoted on the top of the vials.
Colloids 08 00011 g002
Figure 3. Dependencies of the density of both phases on temperatures: (a) at 16 °C; (b) at 19 °C; (c) at 20 °C. (d) Illustration of the ultra-low surface tension.
Colloids 08 00011 g003
Figure 4. The two phases in the presence of the lipophilic dye for SLES-1EO+DAO mixtures in the presence of divalent salts: (a) MgCl2; (b) CaCl2. The salt concentrations are denoted on the top of the vials. Microscopic pictures of a sample from 8 wt% 1:1 SLES-1EO+DDAO+70 mM MgCl2 taken in (c) transmitted light; (d) in fluorescent mode. The scale bar is 100 µm.
Colloids 08 00011 g004
Figure 5. Photographs of 8 wt% 1:1 SLES-1EO + zwitterionic surfactant solutions, illustrating the effect of the added NaCl: (a) in the presence of DDAO; (b) in the presence of CAPB. The salt concentrations are denoted on the top of the vials.
Colloids 08 00011 g005
Figure 6. Rheological response of the surfactant mixture 8 wt% 1:1 SLES-1EO+DDAO in the presence of different salts: (a) salt curve in the presence of CaCl2, with the last three points representing the viscosity of the isolated saturated micellar phases; (b) the apparent viscosity as a function of the shear rate for the isolated saturated micellar phases in the presence of CaCl2; (c) salt curve in the presence of MgCl2; (d) salt curve in the presence of NaCl.
Colloids 08 00011 g006
Figure 7. (a) Comparison of the salt curves (viscosity vs. MgCl2 concentration) obtained for 8 wt% 1:1 SLES-1EO+zwitterionic surfactant (DDAO and CAPB). (b) Effect of adding NaCl (the same molar ratio as in CAPB samples) to the SLES-1EO+DDAO+MgCl2 mixture. The last three experimental points in both salt curves correspond to the isolated saturated micellar phases.
Colloids 08 00011 g007
Figure 8. The amount of 1 wt% limonene in micellar solutions containing (a) SLES-1EO+DDAO: the left bottle contains a surfactant mixture with the same surfactant concentration as in the saturated micellar phase without added CaCl2 and the right bottle contains saturated micellar phase formed from 8 wt% 1:1 SLES-1EO+DDAO+70 mM CaCl2; (b) SLES-1EO+CAPB: the left bottle is the surfactant mixture without MgCl2 and the right bottle—saturated micellar phase formed from 8 wt% 1:1 SLES-1EO+CAPB+100 mM MgCl2. (c) DLS results for the size distribution of samples corresponding to (a). (d) DLS results for the size distribution of samples corresponding to (b).
Colloids 08 00011 g008
Figure 9. Size distribution of nanoemulsion limonene droplets in the isolated saturated micellar phases: (a) from 8 wt% 1:1 SLES-1EO+DDAO+70 mM CaCl2 in the presence of 1 wt% and 7 wt% limonene; (b) from 8 wt% 1:1 SLES-1EO+CAPB+100 mM MgCl2 in the presence of 1 wt% and 8 wt% limonene.
Colloids 08 00011 g009
Figure 10. Photographs of the saturated micellar phases with dispersed 1 wt% vitamin E: (a) phase separated from 8 wt% 1:1 SLES-1EO+DDAO+70 mM CaCl2; (b) phase separated from 8 wt% 1:1 SLES-1EO+CAPB+100 mM MgCl2. (c) Size distribution of vitamin E nanoemulsion droplets in the isolated saturated micellar phases from (b).
Colloids 08 00011 g010
Disclaimer/Publisher’s Note: The statements, opinions and data contained in all publications are solely those of the individual author(s) and contributor(s) and not of MDPI and/or the editor(s). MDPI and/or the editor(s) disclaim responsibility for any injury to people or property resulting from any ideas, methods, instructions or products referred to in the content.

