Review

Dynamic Light Scattering: A Powerful Tool for In Situ Nanoparticle Sizing

1
SINOPEC Dalian Research Institute of Petroleum and Petrochemicals Co., Ltd., Dalian 116045, China
2
Key Lab of Materials Modification by Laser, Ion, and Electron Beams, Dalian University of Technology, Ministry of Education, Dalian 116024, China
3
Laboratoire des Sciences des Procédés et des Matériaux, CNRS, Université Sorbonne Paris Nord, F-93430 Villetaneuse, France
*
Authors to whom correspondence should be addressed.
Colloids Interfaces 2023, 7(1), 15; https://doi.org/10.3390/colloids7010015
Submission received: 26 December 2022 / Revised: 6 February 2023 / Accepted: 13 February 2023 / Published: 16 February 2023
(This article belongs to the Special Issue Feature Reviews in Colloids, Nanomaterials, and Interfaces)

Abstract

:
Due to surface effects and quantum size effects, nanomaterials have properties that are vastly different from those of bulk materials due to surface effects. The particle size distribution plays an important role in chemical and physical properties. The measurement and control of this parameter are crucial for nanomaterial synthesis. Dynamic light scattering (DLS) is a fast and non-invasive tool used to measure particle size, size distribution and stability in solutions or suspensions during nanomaterial preparation. In this review, we focus on the in situ sizing of nanomaterial preparation in the form of colloids, especially for metal oxide nanoparticles (MONs). The measuring principle, including an overview of sizing techniques, advantages and limitations and theories of DLS were first discussed. The instrument design was then investigated. Ex-situ and in situ configuration of DLS, sample preparations, measurement conditions and reaction cell design for in situ configuration were studied. The MONs preparation monitored by DLS was presented, taking into consideration both ex situ and in situ configuration.

1. Introduction

Modern industrial production pursues high efficiency and energy saving. By increasing the rate of chemical reaction, catalysts have become the core of chemical technology and more than 90% of chemical industrial processes cannot be separated from catalysts. Nanoparticles, especially metal oxide nanoparticles (MONs) are currently of great interest to scientists and engineers due to their prospective uses in the majority of industrial chemical processes, mainly in catalysis [1], electronics [2] and optics [3]. It has been shown that the size and shape of nanocatalysts have a main impact of catalytic reactions by tailoring the nanoparticle at molecular level [4]. In particular, semiconductor MONs have been widely used for the photocatalytic degradation of various organic pollutants [5]. Since the photo-induced decomposition of water on TiO2 electrodes was discovered [6], MONs (e.g., TiO2 [7], ZnO [8], Fe3O4 [9], V2O5 [10] and CeO2 [11]) photocatalysis has attracted extensive interest. For photocatalytic reactions, the generation of a hole-electron pair is a significant stage of photo reactions. When the energy of the photon is larger than the band gap of semiconductor nanoparticles, the electrons in its valence band will be excited to the conduction band leaving the holes in the valence band. The electrons and holes diffuse to the surface of the particle, thus creating a strong redox potential to induce the photocatalytic reaction.
According to the available literature, many different chemical processes have been used to create metal oxide nanoparticles, including sol-gel [12], hydrothermal method [13], co-precipitation [14], solvothermal synthesis [15], plasma treatment [16], and others [17,18,19]. Among these techniques, the sol-gel process is the most popular because it produces highly homogenous materials, processes at low temperatures and provides the possibility to efficiently control particles’ size and morphology [20]. With the sol-gel method, a wide variety of materials can be produced in different forms, including thin films, ceramics, fibers, powders, monoliths, porous gels, etc. Furthermore, the sol-gel synthesis resulted in the ability to regulate the physico-chemical characteristics of the resultant compounds by careful adjustment of the factors controlling the various synthesis processes.
In the photocatalytic applications involving the use of MONs, the particle size remains the most important parameter. Firstly, one of the distinguishing characteristics of the MONs is their high surface-to-volume ratio, which is inversely proportional to the diameter. Secondly, there is a quantitative correlation between particle morphology and photocatalytic activity [21]. The increase of the particle size has a negative effect on the light interaction efficiency with catalyst, photoinduced carriers’ mobility and effectiveness of transfer to the active surface sites. Finally, the consequences of exaction quantum confinement in the volume are significant for photocatalysis. In particles, the energy of the photogenerated charges increases with the decrease of the size of the particles [22]. For either reason, the MONs’ size is one of the determining factors.
Fundamentally, if the particle size distribution is polydisperse, size determination will be disturbed, which hinders the size evolution kinetics. Therefore, preparation of the monodispersed colloids becomes essential for the understanding of the nucleation-growth mechanisms and definition of the most stable material building unit—the nucleus. From the engineering viewpoint, this task is related to the creation of the point-like reaction conditions and to the successful realization of the physical reagents’ micromixing and conducting process at low Damkohler numbers Da ≤ 1 [23]. This number is used to describe the relative time scale of chemical reactions compared to other phenomena in the same system. In chemical engineering, Da is defined as the characteristic mixing time (diffusion rate) divided by the characteristic chemical time (reaction rate). In this respect, in situ particle sizing is also of critical importance in terms of providing necessary feedback to researchers about the reaction conditions.
Numerous analytical techniques have been employed to determine the size of MONs [24], such as dynamic light scattering (DLS), transmission electron microscopy (TEM), scanning electron microscopy (SEM), atomic force microscopy (AFM), X-ray diffraction (XRD) and acoustic spectrometry measurement. Among them, the technique of DLS can be widely employed for in situ measuring of MONs’ size in the liquid phase during the preparation of the catalysts due to several advantages: high precision, reliable analysis and modest costs. Some excellent reviews [25,26,27,28,29,30,31,32,33,34] have already been published with emphasis on the theory, data analysis and applications of DLS. In this review, we focus on in situ measurement of nanoparticles’ size during their synthesis process, especially for the sol gel process. The measuring principle, instrument design and an update on applications of DLS in studying nanoparticles will be investigated in this review.

2. Measuring Principle

2.1. Overview of In Situ Sizing Techniques

Two types of methods are commonly known for particle size analysis: measurement of individual particles or measurement of the properties of a number of particles. The major techniques for nanoparticles’ distribution measurement are based on sedimentation [35], electrical and optical sensing zones [36], image analysis [37,38], light diffraction [39] and light scattering [40]. The common nanoparticle sizing techniques and their characteristics are presented in Table 1.
The size of a particle obtained by different techniques is often not the same and this reflects the different properties of the particulate system. For example, a number distribution (from electron microscopy) will be much smaller than an intensity distribution (from DLS) for a polydisperse sample. For a metal colloid coated with surfactant, the size measured by DLS will be a reflection of the center and the shell. However, using electron microscopy or SAXS, only the inner part will be seen and the size is smaller.

2.2. Theories of DLS

Dynamic light scattering (DLS) is a non-destructive spectroscopic analysis technique that allows measuring corresponding to (i) light intensity scattered by the nanoparticles and (ii) size of particles suspended in a liquid from 1 to 1000 nm.
The detection of scattered light from light-matter interactions provides information related to the physical properties of the sample. John Tyndall [41] observed and studied light scattering experiments in the late nineteenth century. Moreover, the scattering light is not angle-dependent when the particles are smaller than λ/10 (λ is the wavelength of incident light), named Rayleigh scattering [42]. When particles are larger than λ/10, Gustave Mie proposed that the scattered light is angle-dependent (inelastic scattering) [43].
The particles suspended in a liquid experience a random movement: Brownian motion. Typically, the DLS measurement is based on the principle of the Doppler effect, which states that the frequency of light scattered from a particle is shifted depending on the particle velocity. Small particles move more quickly in the medium than big particles, resulting in a faster varying intensity signal as shown in Figure 1a and b. The DLS measures the characteristic time of variations in scattered intensity, which is dependent on the diffusion coefficient of the particles.
The form of the spectrum of light scattering may be changed not only because of the Brownian motion of scattering centers, but their number in the observation volume is of importance; in opaque colloids the multiple scattering events prohibit reliable measurements. Thus, analysis based on the temporal autocorrelation function (ACF, or G(t) in Figure 1c and d), allows obtaining information about its radius from the spectrum of light diffusion intensity. By experimentally studying the ACF of colloids, relation between the diffusion coefficient and form of the spectrum is generally used (see, e.g., in [44,45]):
G = A + B   e 2 k τ
with k = Dq 2 and the light scattering vector q = 4 π n λ   sin ( θ / 2 ) (n is refraction index and θ is diffusion angle) defined by the experiment geometry.
To obtain the hydrodynamic radius measurements, the Stokes–Einstein equation is used, which describes the relationship between particle radius RH and diffusion coefficient D (in the case of spherical particles):
D = k B T 6 π μ R H
where μ (Pa.s)—dynamic viscosity of the medium, T(K)—medium temperature and kB = 1.3806 × 10⁻²³ J*molecule−1.K−1 is Boltzmann constant.
It is important to note that the hydrodynamic radius RH is hypothetical. In DLS calculation, it assumes the particle to be a hard sphere, which is almost non-existent in suspensions and this radius is an indication of how a particle behaves in a fluid.
The real nanoparticle samples contain a distribution of particle sizes. The PSD (particle size distribution) enables the display of size by intensity, volume or number, as well as the calculation of peak means. The intensity-based distribution (fundamental size) could convert to volume- and number-based distribution, but huge errors may be generated after the conversion.
To describe the size distribution of sample, Z-average is the most used DLS technique associated with the polydispersity index (PI) to estimate the width of the distribution. In fact, Z-average is the intensity-weighted mean hydrodynamic size of the ensemble collection of a sample. For a monodisperse sample, the Z-average should be equal to the mean of the single peak of the distribution. For a polydisperse sample, the Z-average will be a single number, but the intensity distribution will display two or more peaks with its own mean and width. In the following sections, the size obtained by DLS is obtained from the mean of the intensity-based distribution.

2.3. Advantages and Limitations

Among the techniques mentioned in Table 1, dynamic light scattering is a very powerful tool for studying the diffusion behaviors of nanoparticles in solution and has a number of advantages over other methods.
The main advantages of DLS techniques are as follows:
  • ➢ DLS is a non-invasive method with a short experiment duration.
  • ➢ Low numbers of samples and less sample preparation are required.
  • ➢ Repeatability of the diameter obtained by DLS is very good.
  • ➢ Analysis could be achieved with a wide range of temperature and modest development costs.
Although this technique displays numerous advantages, it has the following limitations:
  • ➢ Temperature and solvent viscosity have a significant impact on DLS results. Therefore, the temperature must be maintained at a constant level and the solvent viscosity should be determined.
  • ➢ Resolution of DLS technique is limited by the cumulants procedure.
  • ➢ Artifact peaks from bubbles, opalescent and reflective particles, optical mode.
  • ➢ Inability to study concentrated solutions/systems with the classical device design.
  • ➢ Strong distortion of results in the presence of even minimal numbers of larger particles in the system.
  • ➢ Low concentration DLS measurements can be difficult to make due to the low signal-to-noise ratio. To improve the accuracy, it is important to use a high-sensitivity detector, to equip a sample cell with a large volume and to employ a sample that is well dispersed and has a high refractive index.

3. Instrument Design

3.1. Ex-Situ and In Situ Configuration

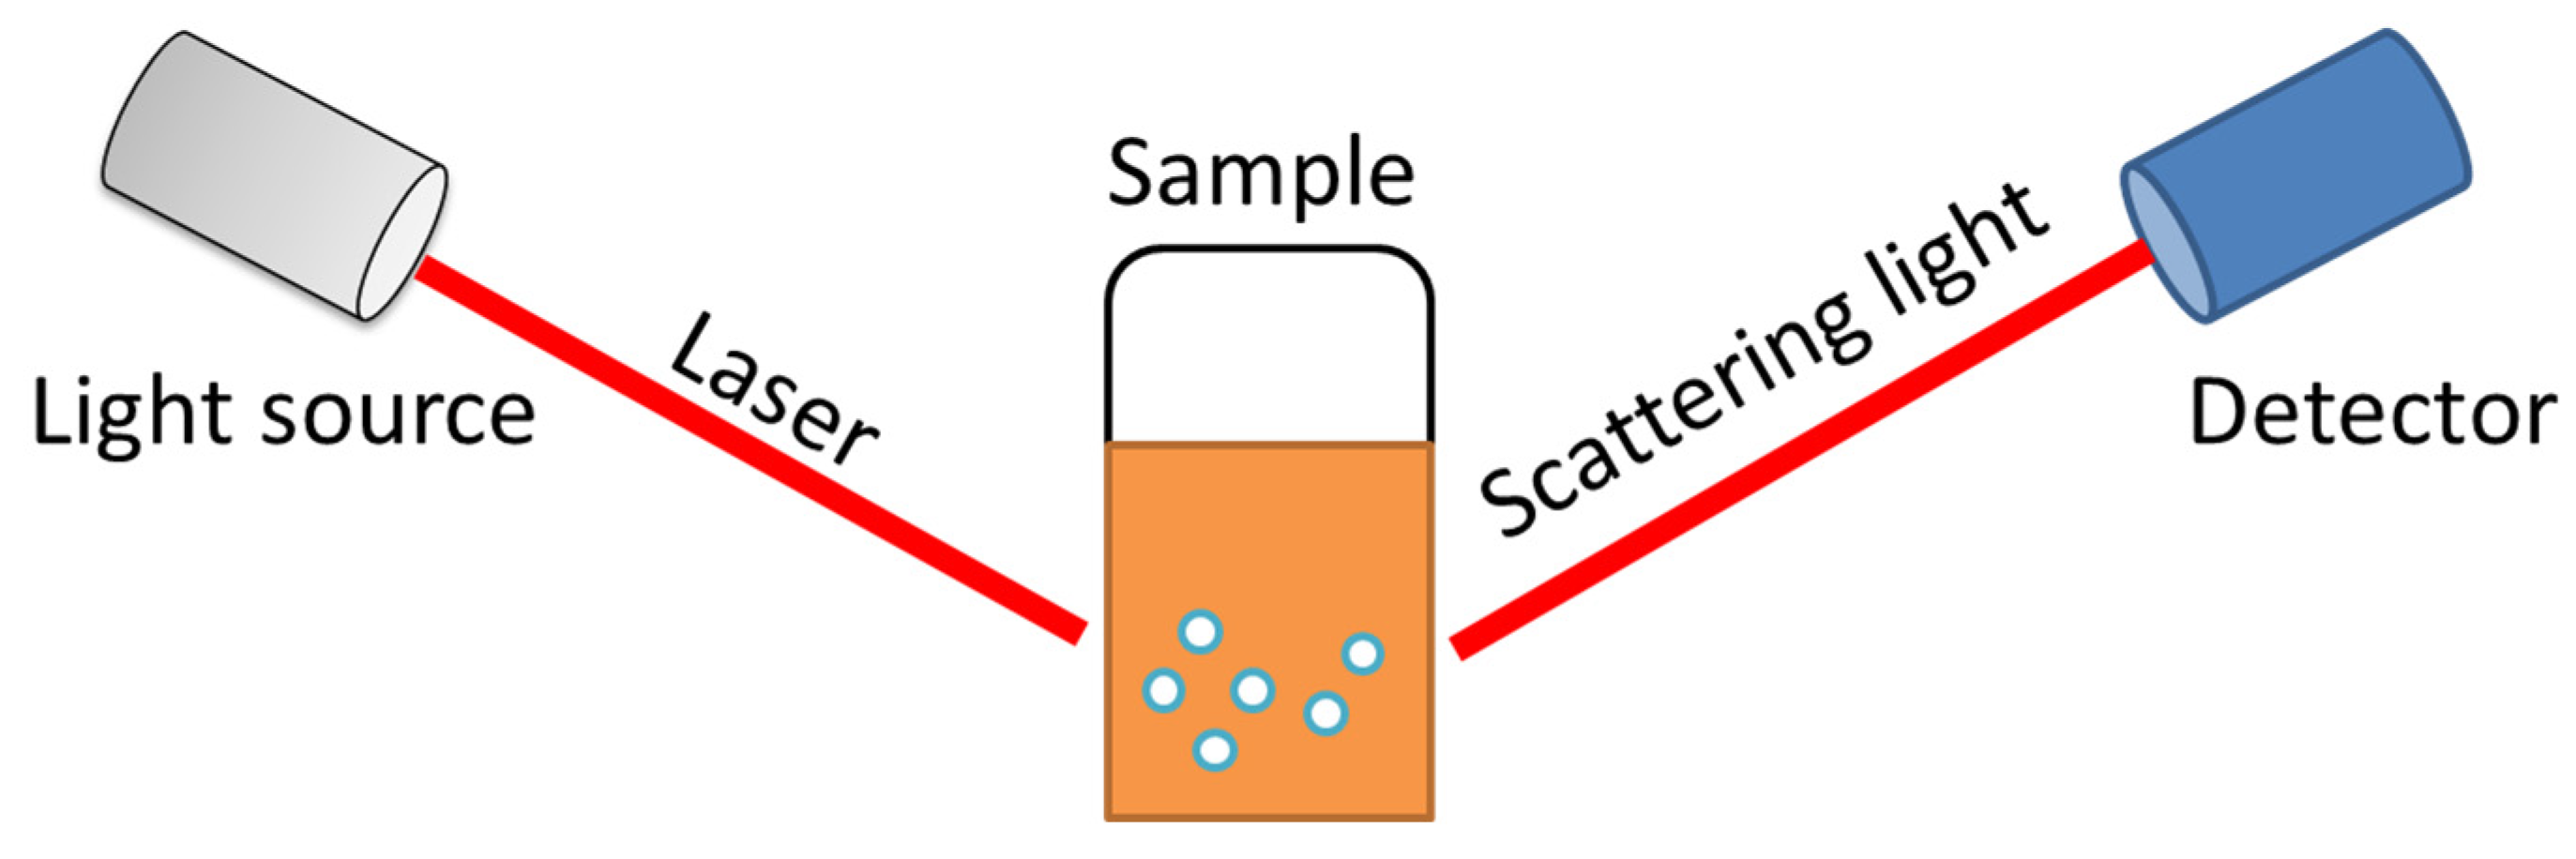
Conventionally, in a dynamic light scattering experiment, the sample is placed in a glass cell. A laser beam is applied to the sample and the scattered light intensity can be collected and measured, as shown in Figure 2. Theoretically, DLS measurements can be carried out with the detector positioned at any angle. For large particles, back scattering detection (173°), side scattering (90°) and forward scattering (15°) are suitable for large particles and highly concentrated samples, small particles and transparent samples and samples containing small particles with few large particles, respectively. The presence of double and multiple light scattering events can significantly affect the accuracy of particle size distributions obtained from laser diffraction measurements. Multiple light scattering occurs when light is scattered multiple times by particles of different sizes, resulting in a broadening of the diffraction pattern. This can lead to an overestimation of the particle size distribution, as the broadening of the diffraction pattern will be interpreted as larger particles. To limit the influence of multiple scattering, diluting down the sample or shortening the light path length are the most common methods. Moreover, using a larger detection angle or a higher laser power can help to reduce the impact of multiple scattering on the measurement.
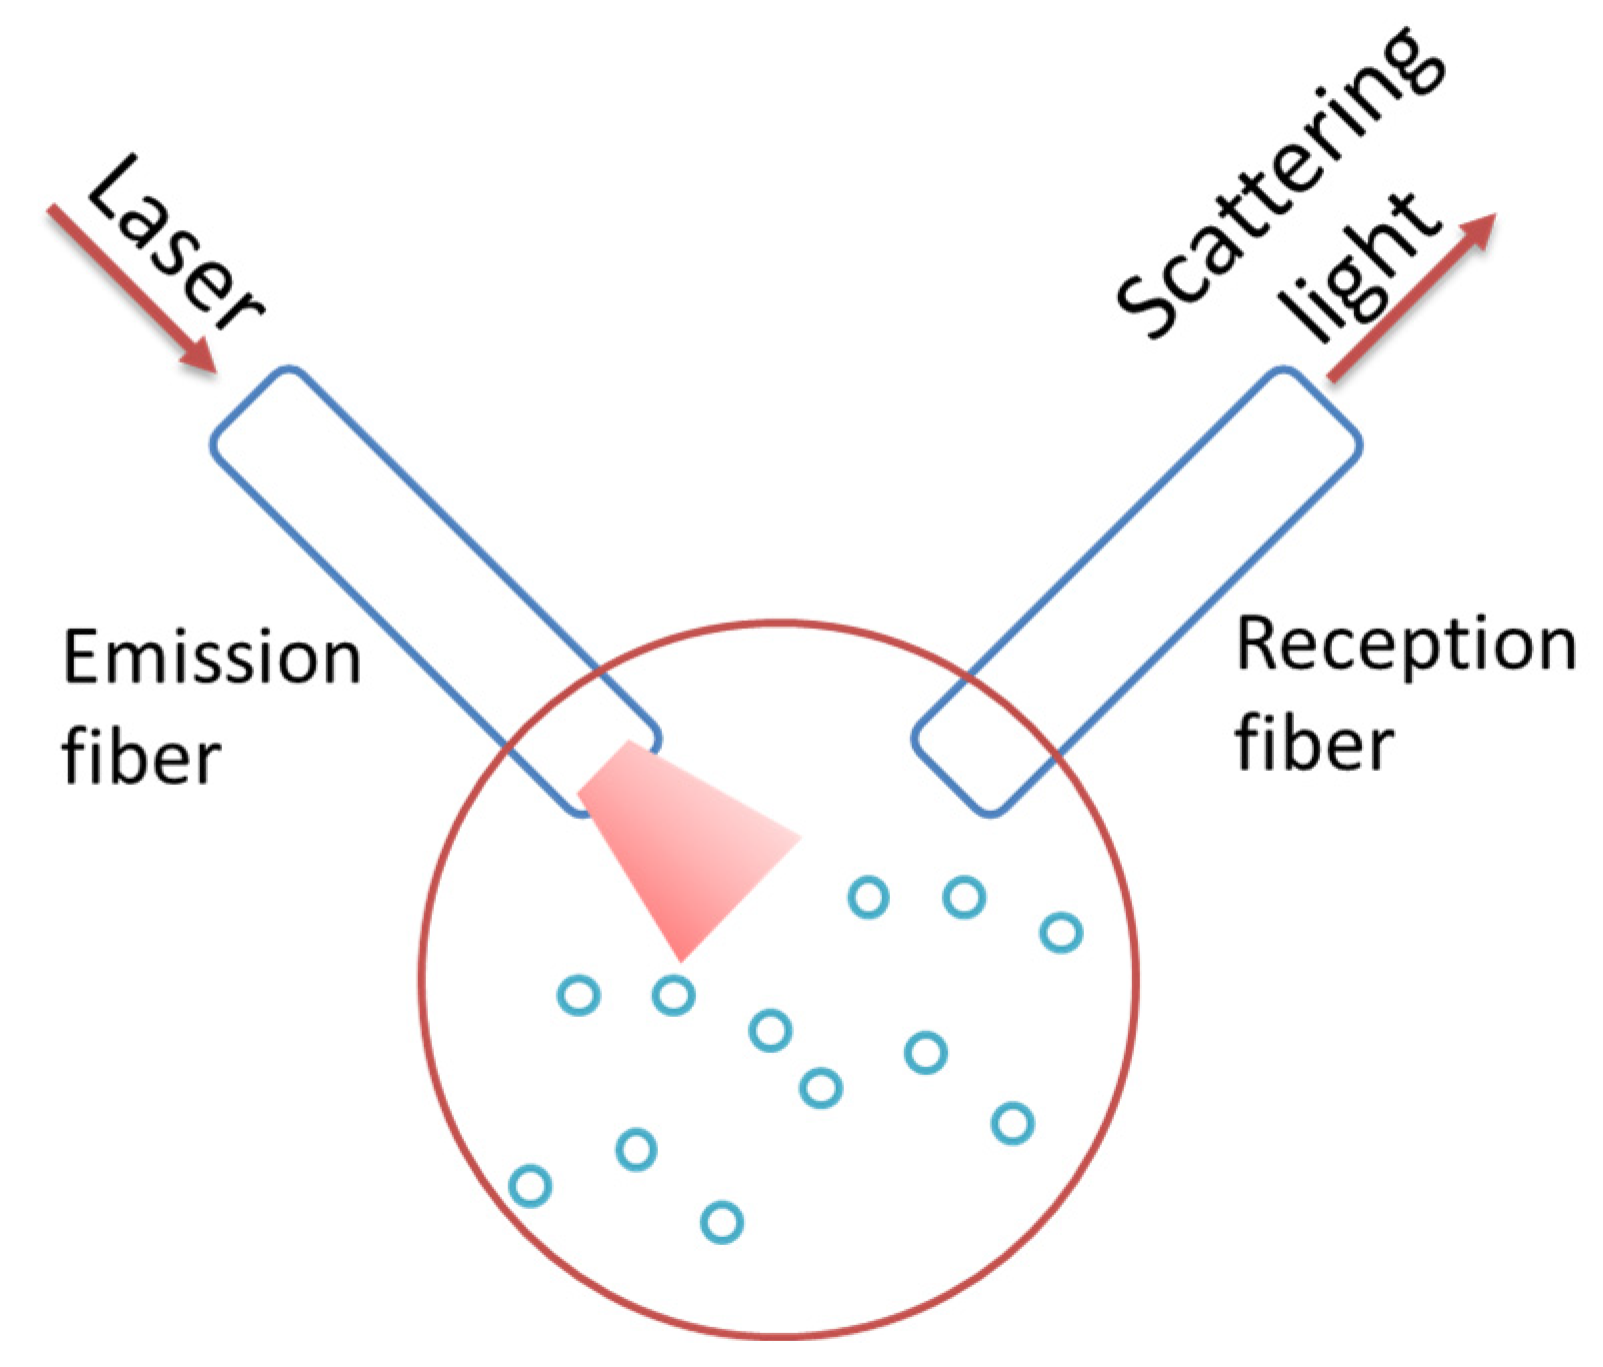
The ex-situ configuration is not suitable for in situ measurement because it is bulky and sampling is necessary for this configuration. A colloidal solution obtained by a sol-gel process is very sensitive to humidity and temperature. Accordingly, more versatile systems have been developed by using optical fibers to avoid any sampling or transfer of the solution. As shown in Figure 3, the incident light from a laser is focalized on the observation zone with the help of an emission fiber probe and the diffused light is collected with a reception fiber probe. A proper alignment of the two fibers allows fixing the observation volume as small as ~10−6 mL, which can be considered as transparent neglecting multiple scattering phenomena and thus permitting the measurements in generally opaque suspensions with high concentration of nanoparticles. Furthermore, perturbations due to undesirable scattering events by rare large dust particles can be avoided by adjusting time window of the accumulation series and data processing. This experimental set allows in situ measurements after the first moments of reaction.
To our knowledge, a fiber-optic Doppler anemometer was first developed by Dyott et al. [46] in 1978 to investigate Brownian motion in colloidal suspensions. A 5 mW HeNe laser was employed into a graded-index multimode optical fiber. The fiber end was immersed in the colloidal solution. This experimental setup was suitable for in situ characterization of moving particles in solution. However, if the medium itself was flowing, turbulence at the fiber tip prohibited proper flow measurement. To overcome this inconvenience, Auweter and Horn [47] present a fiber-optical setup where all the conventional optical components are replaced by their fiber-optical counterparts. Since the fiber-optics-based DLS equipment was developed, it was widely used for in situ sizing during catalysts’ preparation by different processes. A fiber-optics-based multiangle light scattering instrument was presented by Egelhaaf and Schurtenberger [48]. It shows the advantages in particle form and structure factors’ determinations, particularly for aggregation phenomena study.

3.2. Sample Preparation and Measurement Conditions

The classic DLS measurement requires transferring the sample to the cuvette. In some cases, sample preparation is necessary to ensure the reproducibility and reliability of the measurements. The measurement principle of DLS is based on Brownian motion. As a result, the sample to be measured by this method is colloids, including solid particles, proteins and polymers in an appropriate solvent. Sample preparation and measurement conditions are summarized in Table 2.
DLS measurements require clear and homogeneous samples and the sample preparation is crucial to obtain accurate particle size distribution. The following steps are recommended: (1) choose a solvent that is compatible with the sample and does not interfere with measurement; (2) ensure that the sample is in a homogeneous solution with a known concentration; (3) filter the solution, if necessary, to remove any large particles or aggregates.

3.3. Reaction Cell Design for In Situ Configuration

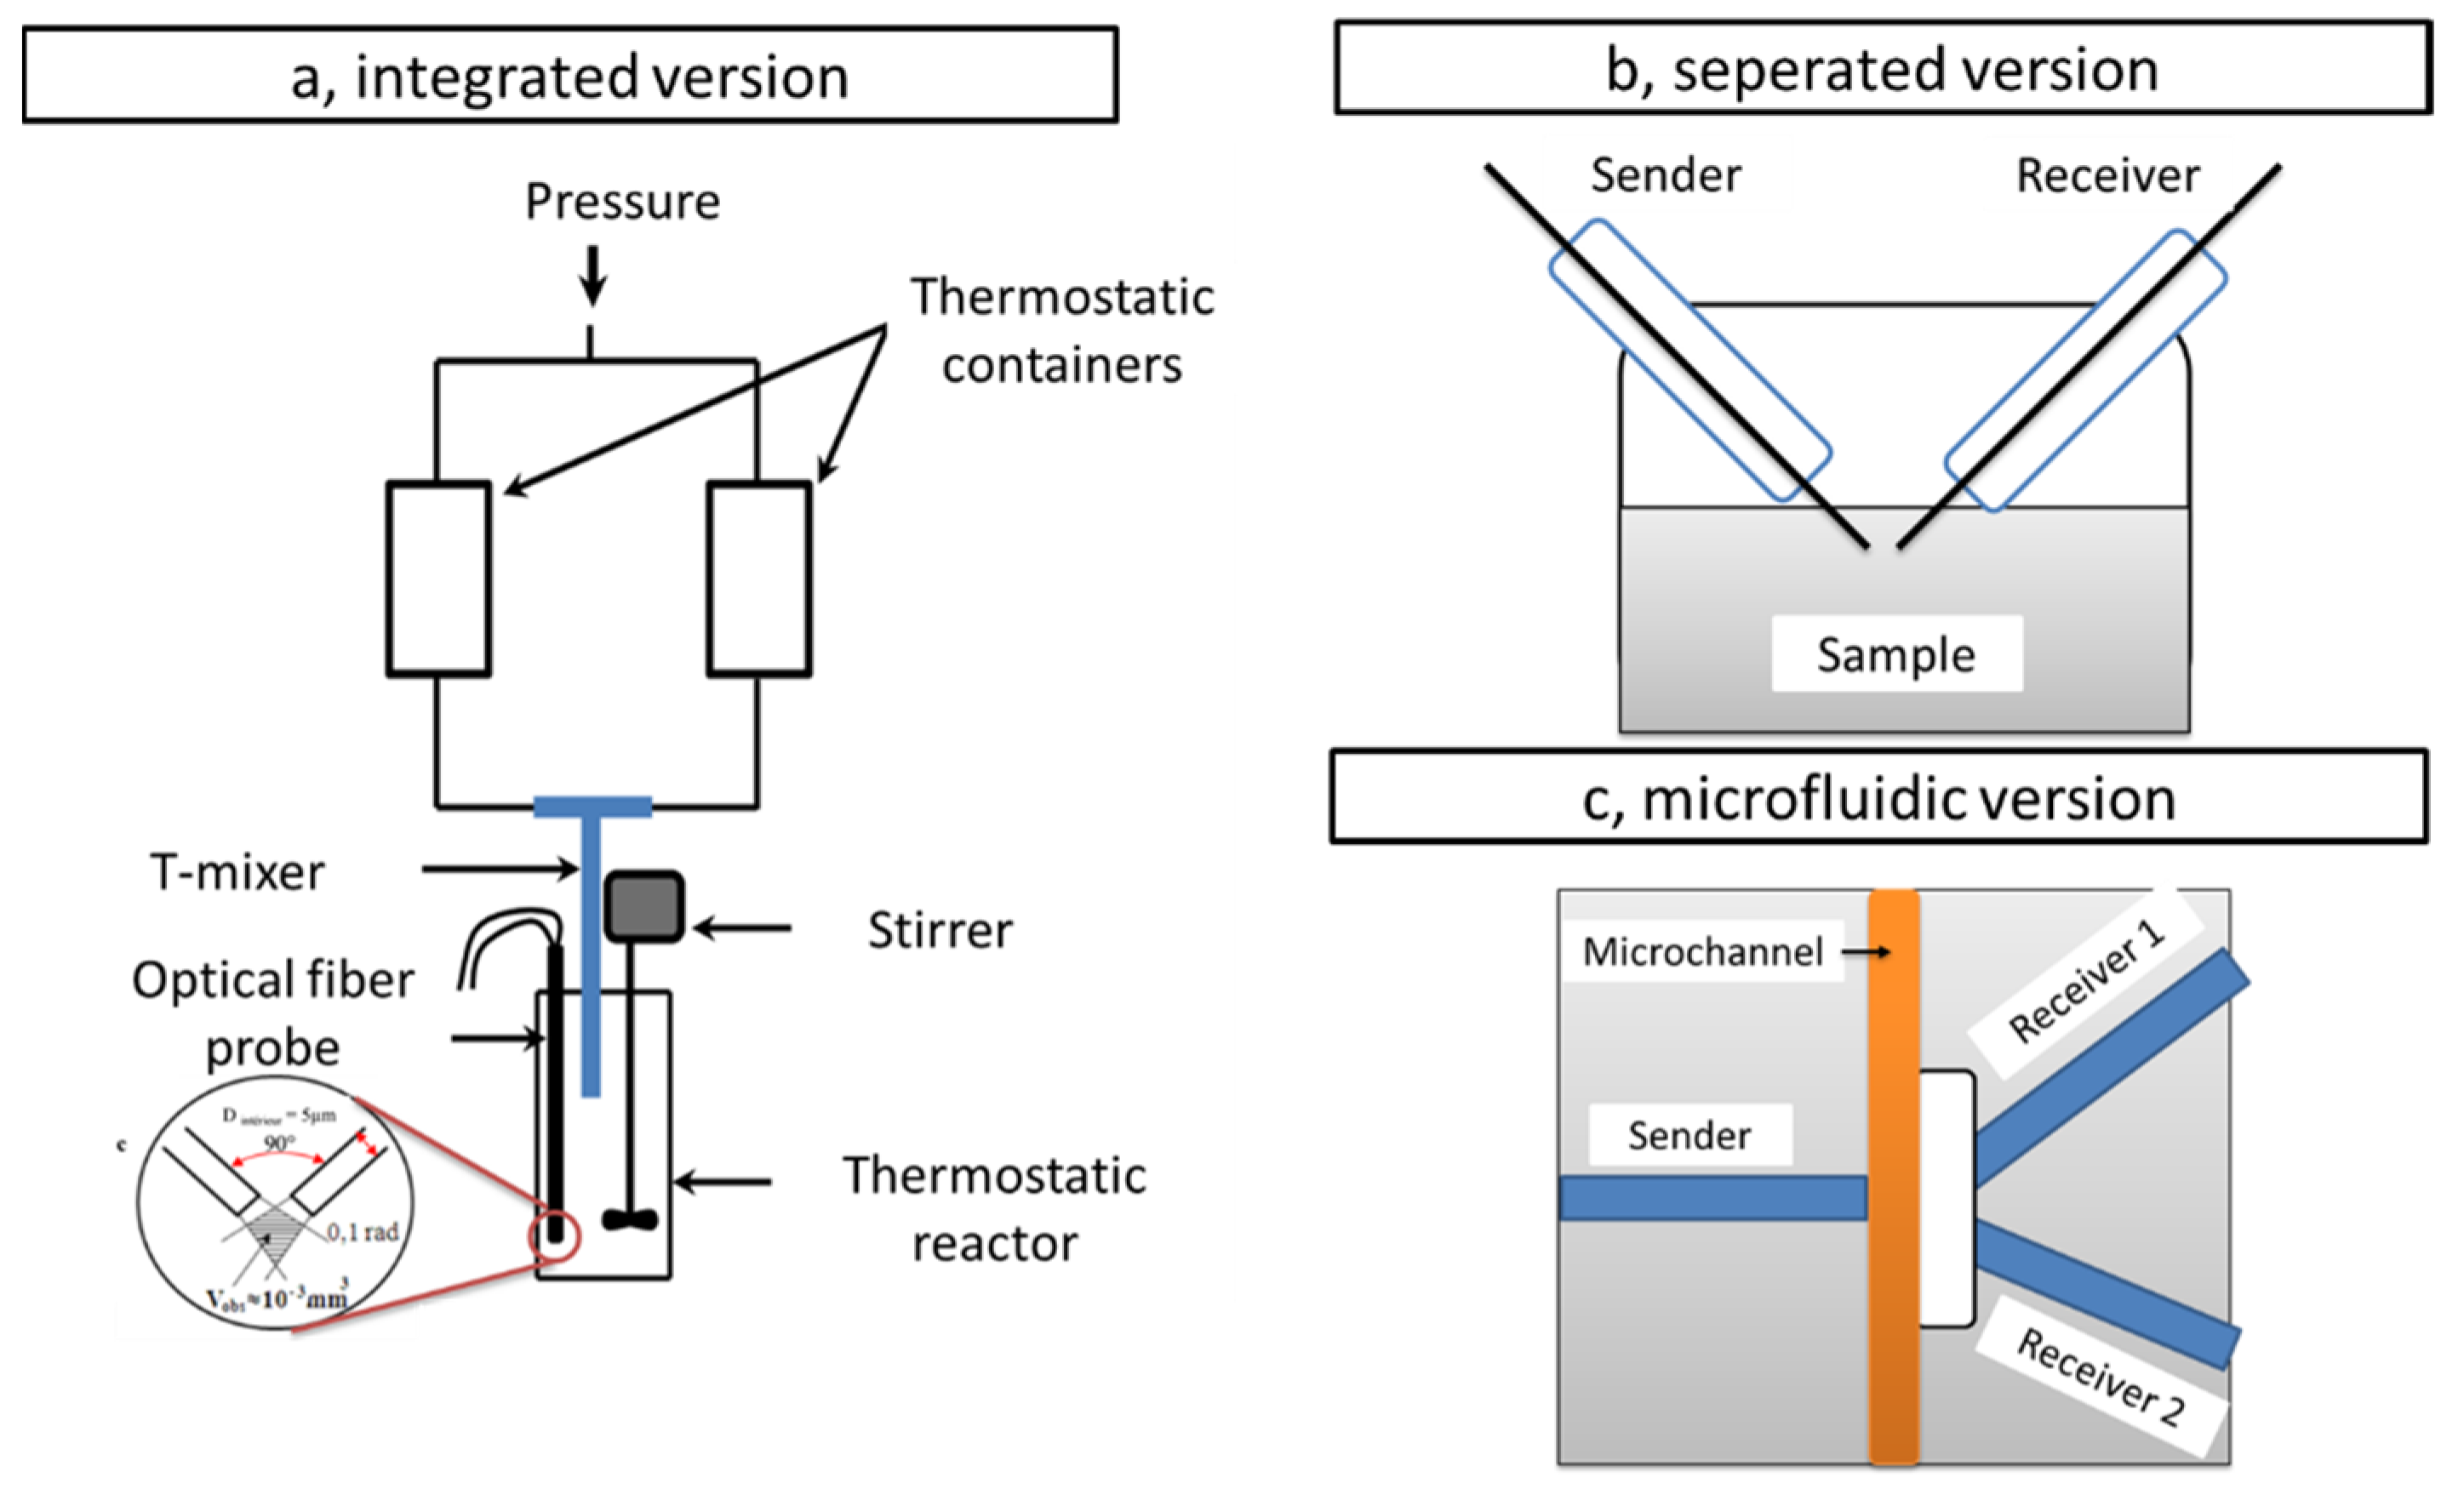
As mentioned in Section 3.1, the optic fiber DLS system was considered the most suitable for in situ configuration. Several reaction cells for nanoparticle preparation were designed to integrate the optic fiber module, as shown in Figure 4. The main characteristics of three common reactors which integrate DLS system are shown in Table 3.
The integrated reactor has been used by Rivallin et al. [50] in order to investigate the sol-gel process for catalyst preparation under atmospheric and temperature control conditions. Two optical fibers (sender and receiver) were fixed to a stainless steel at an angle of 90°. The mono-disperse TiO2 sols were produced by this reactor and the induction kinetics was studied. The good reproducibility of particle size and scattered light intensity has been obtained, which confirmed the results of Soloviev et al. [53]. This rector is a kinetic device to analyze the rate of aggregation in the sol-gel process.
Pristinski and Chastek [51] have presented a separated set-up for better adaptation than existing reactors, e.g., standard three-neck flask for in situ sizing during catalyst preparation. By incorporating the fiber optics into the conventional reactors, the silica particle growth could be characterized in situ.
In addition to being used directly for nanoparticles’ preparation in a batch reactor, there are other in situ DLS experimental set-ups combined with microfluidics chips. Chastek et al. [54] have presented five designs for a miniaturized DLS instrument. These instruments could accurately analyze the size of 10–100 nm particles in the solvents less than 150 µL. Chen et al. [52] have integrated combined fiber optic probes with microfluidic chips to measure sub-micrometer particles at high concentration.

3.4. Latest Methods and DLS Setups

As discussed, DLS is a very versatile approach that may be use in situ to characterize samples in a variety of phase states and physico-chemical environments. Additionally, more DLS configurations were developed and further varied that could be potentially adapted for in situ cases.
Multi-channel DLS enables the simultaneous recording of multiple DLS data [55]. The laser source was typically the same as conventional DLS and the scattered light is captured in four statistically independent detectors. This enables the observation of small variations at different positions in a solution.
The depolarized dynamic light scattering (DDLS) method analyzes the depolarization of the scattering light with the help of additional optical components [56]. This method is widely used for nanoparticle rotational diffusion studies and applied for non-spherical nanoparticles with strong morphology anisotropy (nanorods, nanotubes, etc.) [57].

4. Nanoparticle Preparation Monitored by DLS

4.1. Ex-Situ Cases

DLS is widely used to determine the particle size distribution and stability of various catalysts, as shown in Table 4.
The sizing competence of DLS is generally compared with TEM, as shown in Table 5. The former is an intensity-based hydrodynamic particle size measurement giving an “average” size of all particles, while TEM is a number based one showing an “individual” geometric size of one particle. Although it is not the same parameters that are measured (intensity-based versus number-based diameter), several studies [69,70,71,72] have shown a good agreement between DLS and TEM measurement.
The DLS measurement often overestimates the particle size compared to TEM. The difference between these two techniques is due to: (1) the adsorbing layer on the particle surface, which is not presented in TEM, (2) the contribution of the large particles to the averaged diameter, (3) light scattering cross-section dependence on particle size and (4) shape irregularity and polydispersity. DLS is more representative than TEM in terms of size distribution because it measures a large number of particles, ~1017 cm−3 (TEM measures a few hundred). Researchers should also pay attention to the concentration of the samples for DLS measurement. As DLS analyses the scattering light, a high concentration of particles leads to multi-scattering events and results in underestimating the size [74]. Moreover, agglomeration is more likely to occur at high concentrations, and different surfactants have been applied to ensure colloid stability [75]. On the other hand, employing samples that are overly diluted cannot provide enough scattered light for the analysis. Therefore, it is crucial to find the optimal conditions for DLS measurement. In addition to size determination, DLS could be used to study the stability of the samples and even the fractal dimensions of the aggregation process [53].

4.2. In Situ Cases

As mentioned in Section 3.1, DLS displays the capacities of size measurement and stability that make this technique a perfect tool to study the kinetics of nucleation, growth and stabilization of nanoclusters. Moreover, in situ and real-time particle size measurement is crucial to establish the relationship between the experimental parameters and the particle sizes for measuring the size of nanoparticles in a range of colloidal suspensions. In this section, the size measurement of nanoparticles has been investigated, including TiO2, doped TiO2, ZrO2, ZrxTi1-xO2, VxTi1-xO2 and others, as shown in Table 6.

4.2.1. TiO2

Because of the accuracy size control and sol stability in colloids by means of in situ DLS [50,53,77,84], numerous applications using size-controlled TiO2 nanoparticles monitored by in situ DLS have been developed, e.g., photocatalysis [85,86], hybrid material [87,88,89], toxicity experiments and plasma catalysis [90,91,92,93].
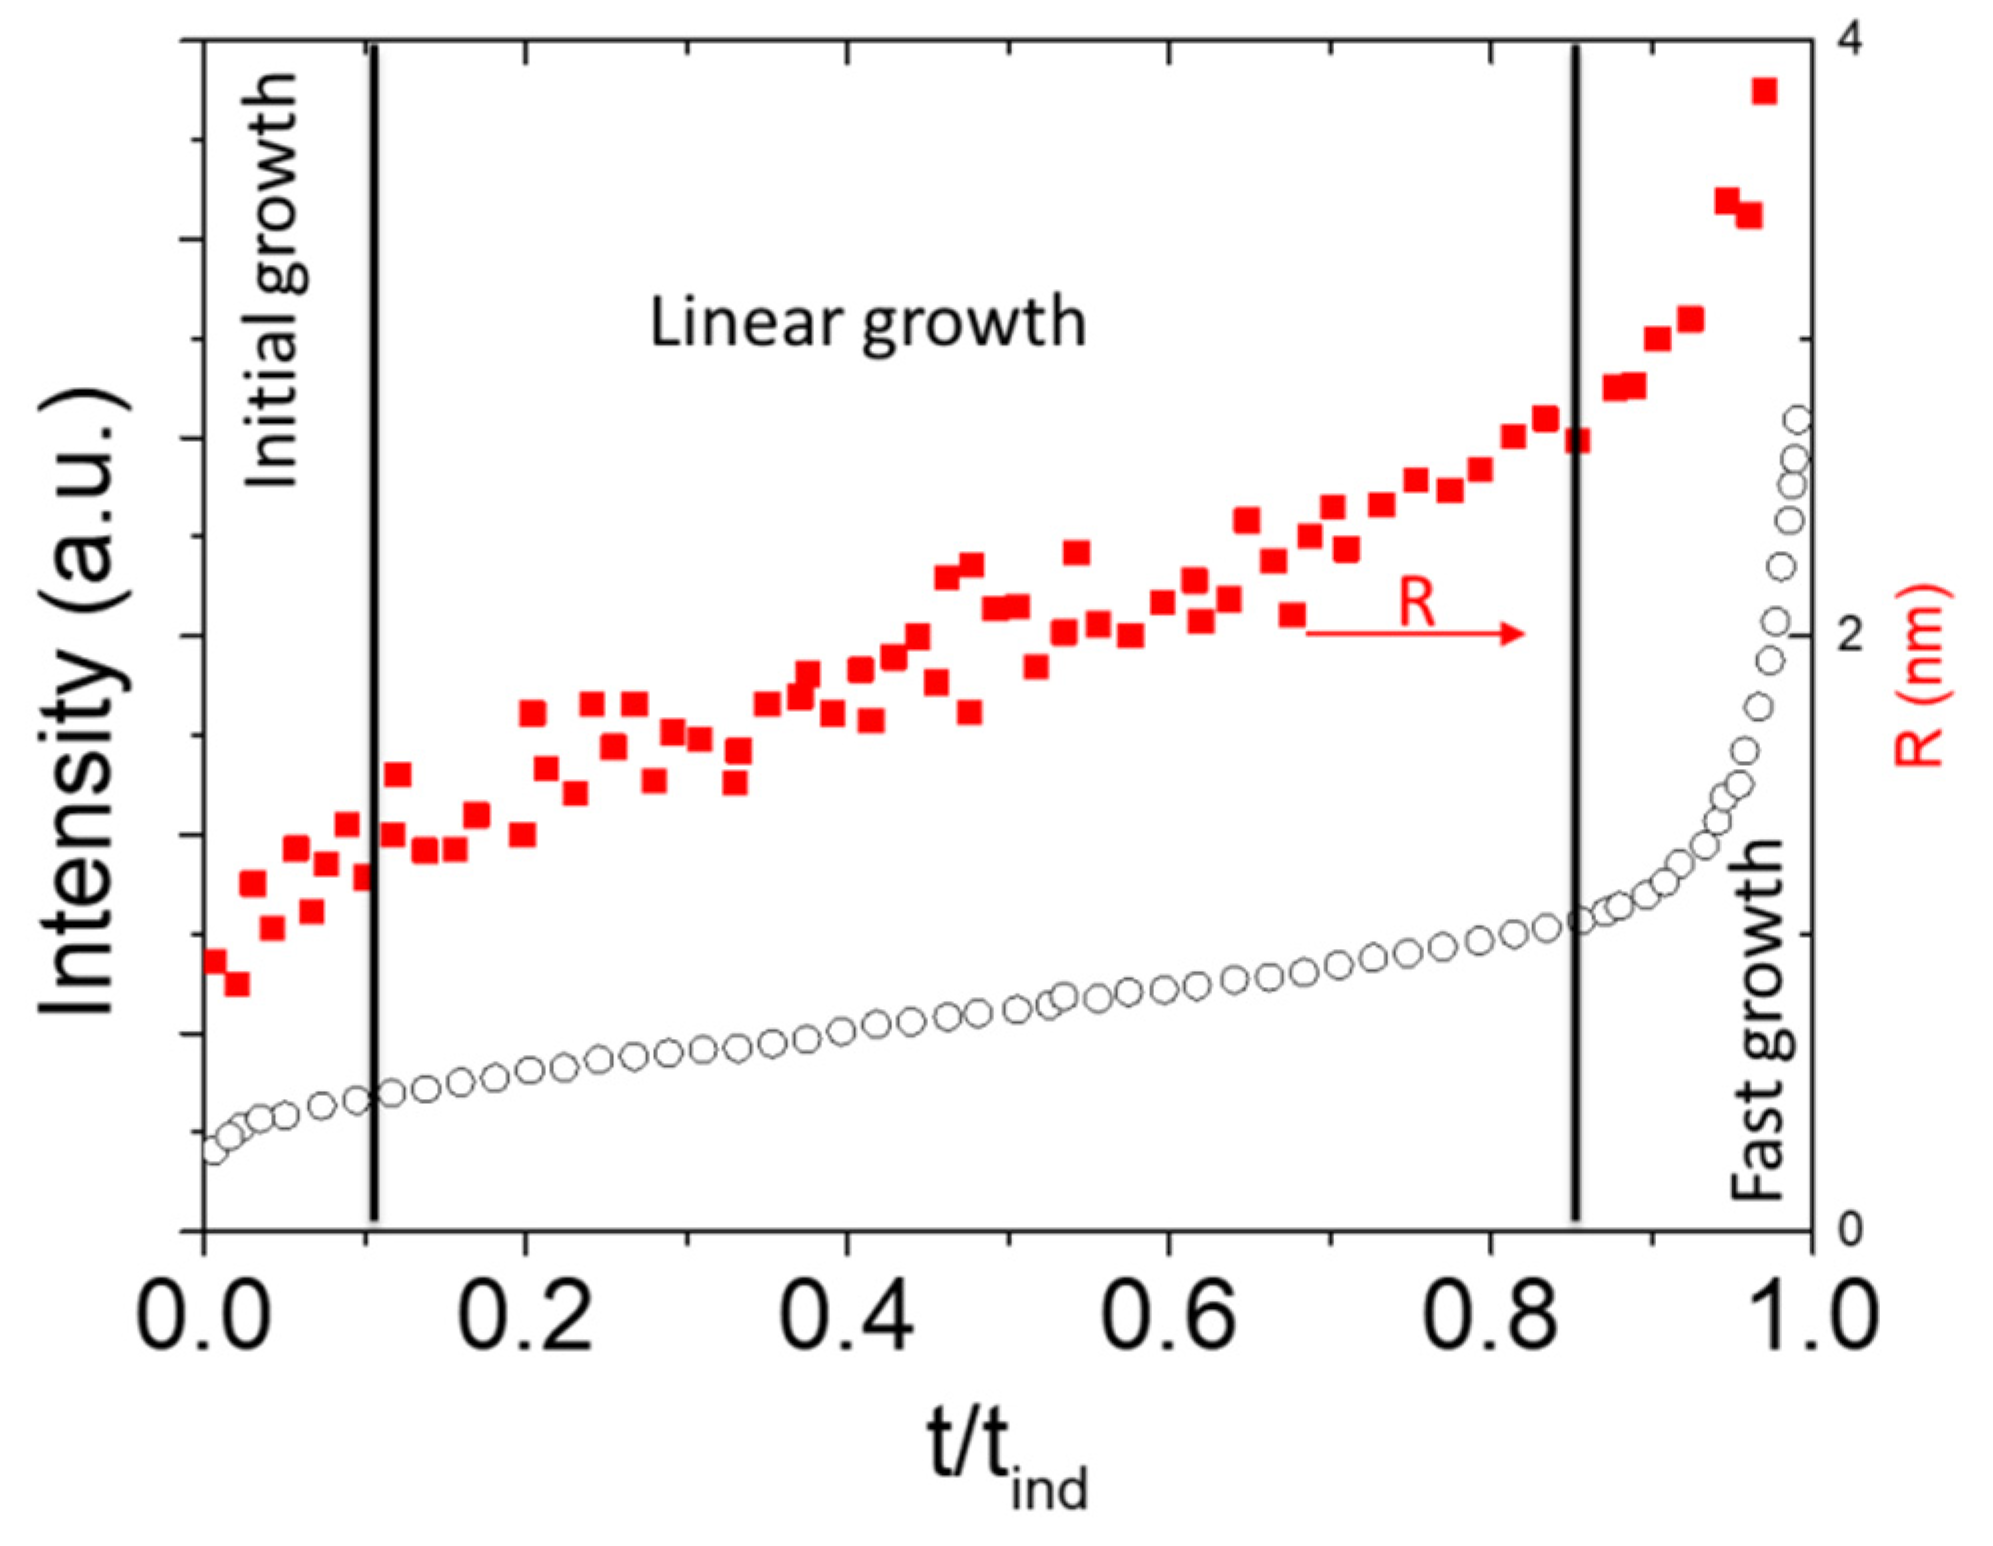
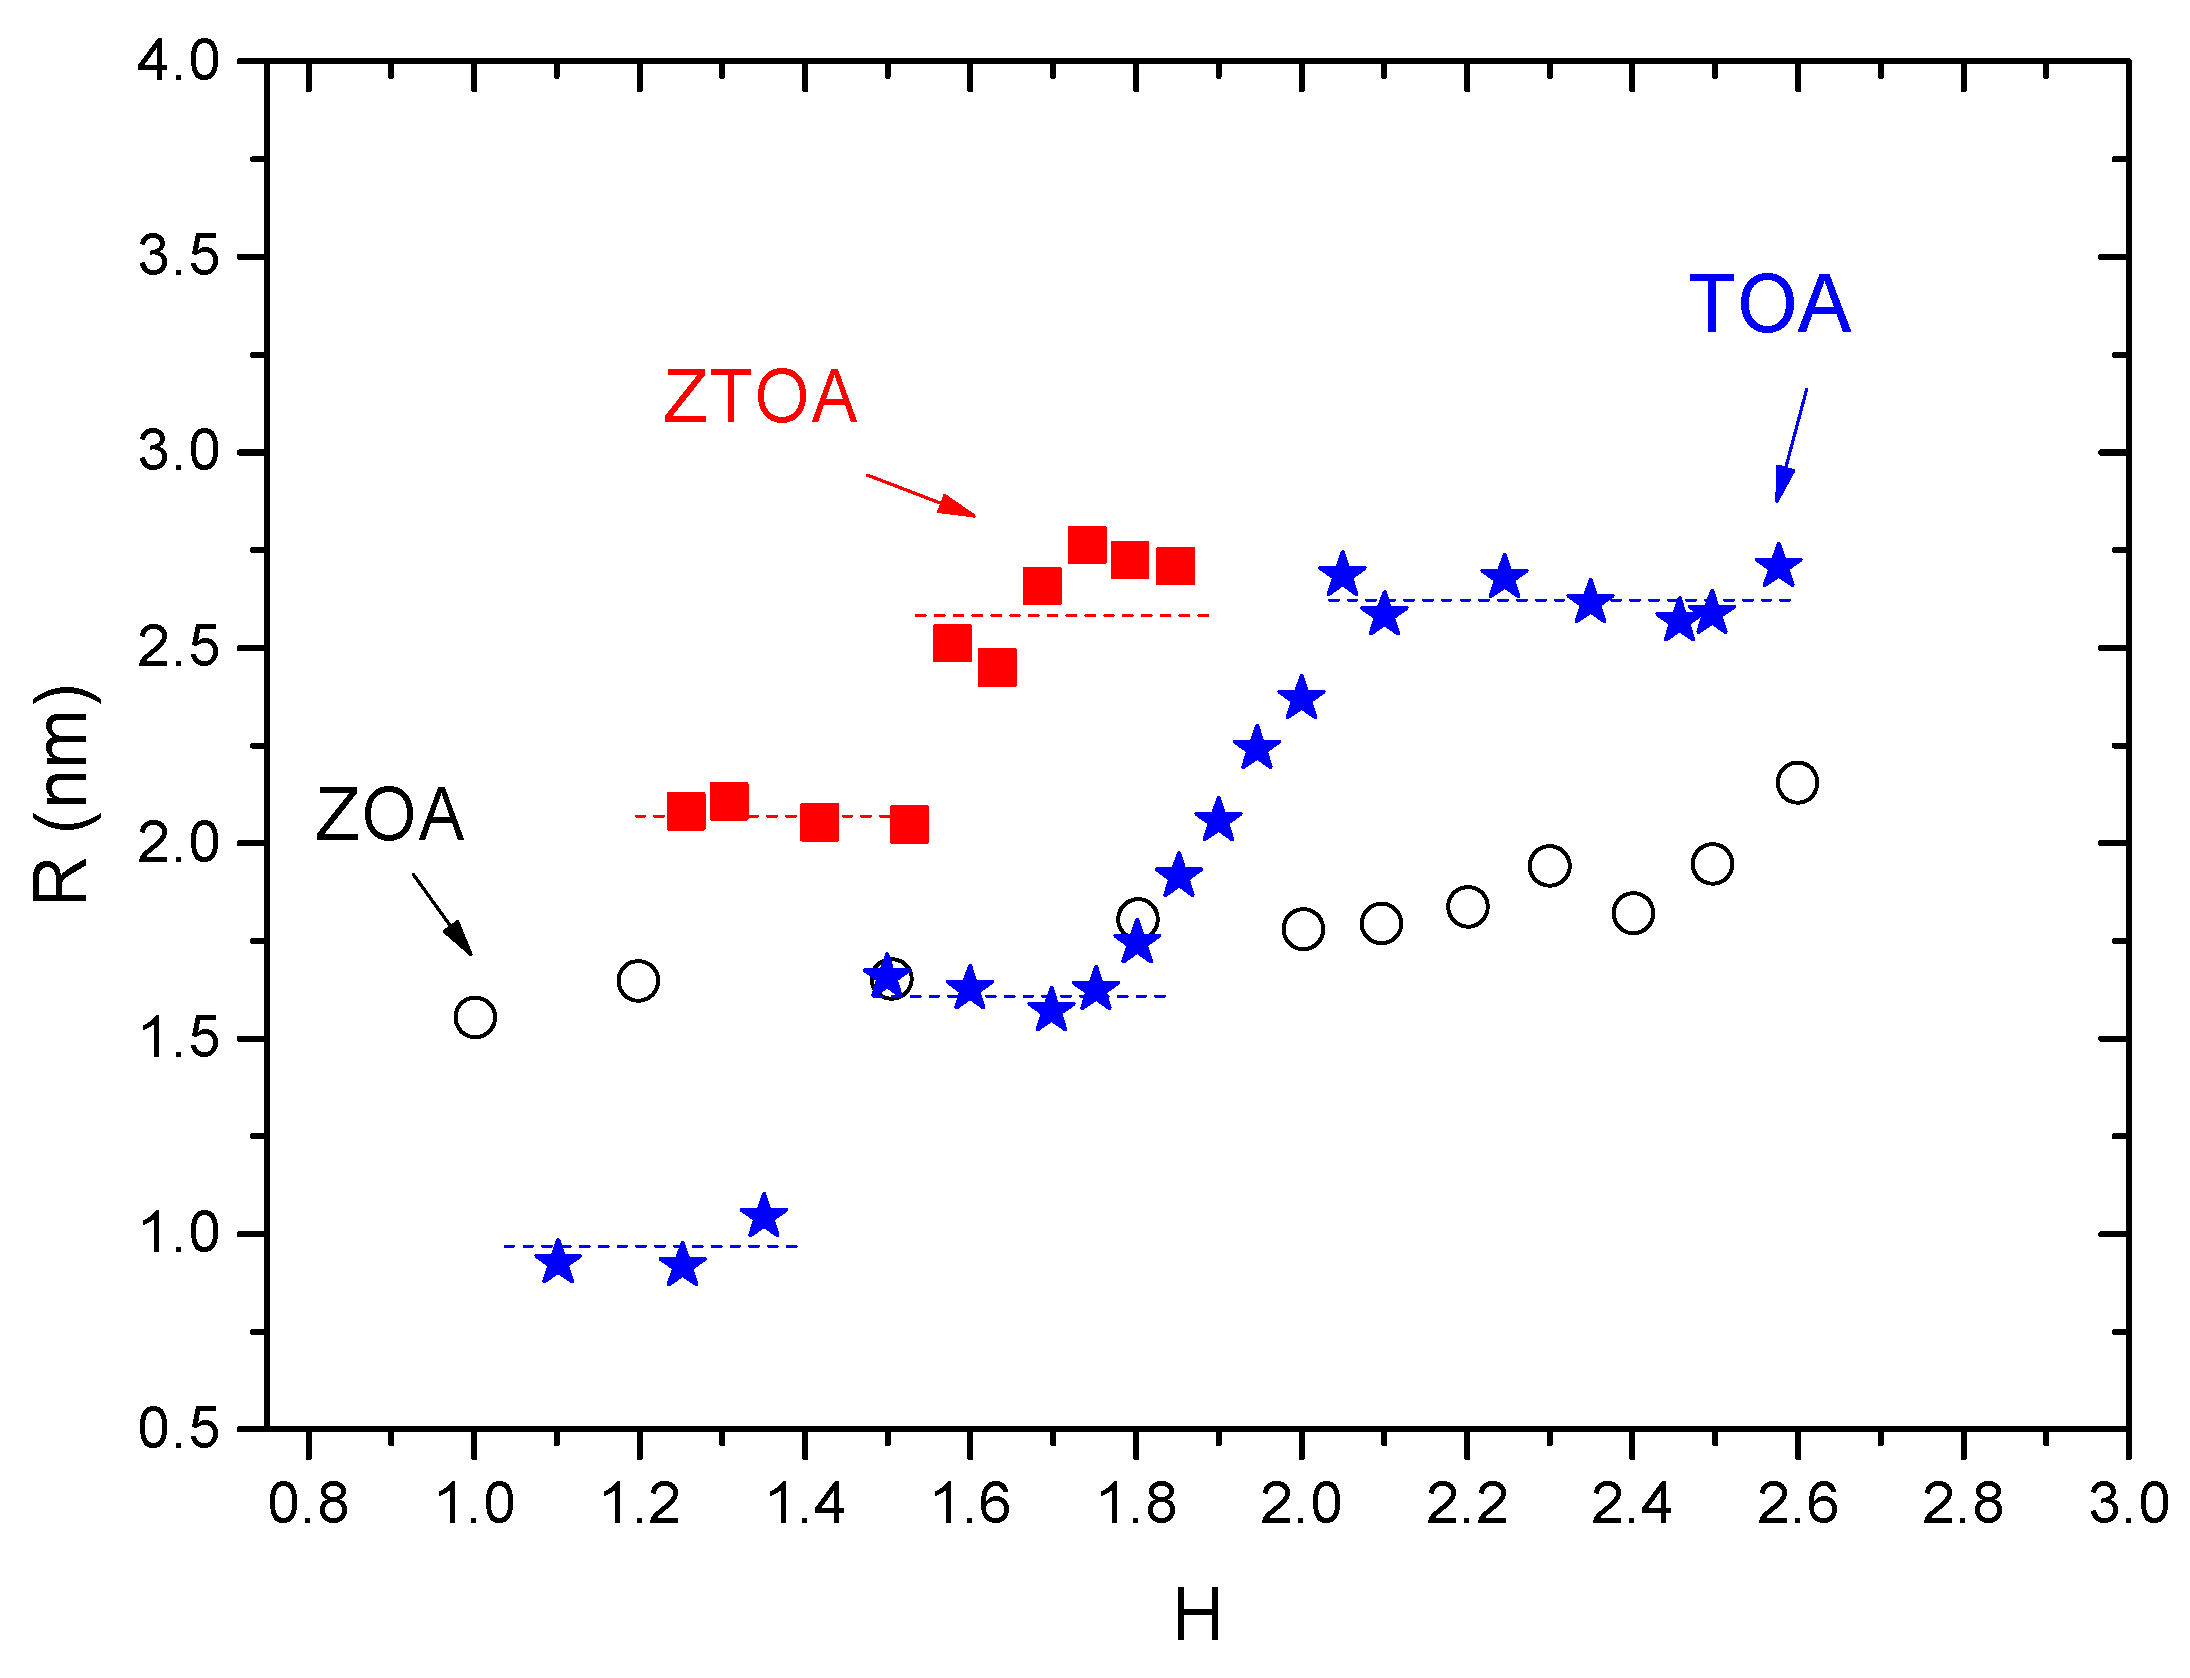
To investigate the growth kinetics during hydrolysis and polycondensation reactions, Soloviev et al. [53] prepared titanium oxo-alkoxide particles (TOA) using the sol-gel method. The experiments were carried out using manual mixing. In brief, solutions in isopropanol of titanium tetraisopropoxide (TTIP) precursor and water were mixed quickly. After stirring for about 30 s, the colloidal suspension was transferred to a Photocor DLS device, where the scattering light was measured. These studies also allow defining an induction time characteristic of the experience corresponding to an intensity of scattered light equal to five times that of origin. This choice is justified by the fact that the increase of light intensity diffused by the suspension is so rapid during precipitation that the difference between 5I0 and 10I0 represents only a small part of the induction period. In this case, the induction time is defined as the moment of the change in the growth mechanism, from slow kinetics to rapid kinetics. The normalized data of the hydrodynamic radius and scattered light intensity by nanoparticles are shown in Figure 5. Rivallin et al. [50] have investigated the nucleation and growth kinetics of TOA particles in isopropanol, after a TTIP precursor was hydrolyzed with different hydrolysis ratios. Precursor and water solutions were mixed by a sol-gel micromixing reactor. The results revealed that the evolutions of particle sizes and induction times were highly reproducible. The evolution of TOA particle sizes with temperature was found to be thermally activated with an activated energy equal to 0.33 ± 0.02 eV. This energy was assigned to hydrolysis reaction of the group Ti-OPri on the surface. Using a micromixing sol-gel reactor, a relationship between hydrolysis ratio and particle size was established [94]. The evolution of initial particle sizes as a function of hydrolysis ratio (H) is given in Figure 6 (blue and star), which can be classed into four domains. In the domain H < 1.45 (I), the smallest cluster C1 was assigned to the Keggin-type structure. The cluster C2 with radius R = 1.5 nm was formed in the domain 1.45 ≤ H ≤ 1.75 (II) by condensation of several C1 clusters. With the following increase of hydrolysis ratio (1.75 < H ≤ 2.0 (III)), C2 clusters agglomerated in short chains, the size of which increased with H. Once the chain size reached 2R = 5.2 nm (H > 2.0), the particles were formed and subjected to an irreversible growth until precipitation into TiO2 powders. The size characterized by in situ DLS was confirmed by TEM [86].
To obtain a deeper insight into the TiO2 nucleation process, Cheng et al. [84] performed a comparative study of the appearance of titanium oxo-alkoxy nanoparticles in n-propanol and isopropanol solvents via DLS/SLS methods. Stable particles with a hydrodynamic radius of 1.6 nm were a common feature of both systems in the early stage of the sol-gel process. These species were stable in a large parametric domain of CTi and H and not sensitive to the solvents. At larger hydrolysis ratios H > 2, this basic unit converts to a larger nanoparticle, the size and growth kinetics of which were sensitive to the solvents. In particular, the hydrodynamic radius of the TiO2 nanoparticles in n-propanol and isopropanol solvents were 1.9 nm and 2.6 nm, respectively.
Through a pH adjustment protocol, highly dispersed and stable suspensions of TiO2 were synthetized [95]. The in situ DLS measurements confirms the lack of presence of sedimentation over 17 h in both the concentrated stock suspensions and their dilution into Luria Bertani medium. Moreover, the DLS results were correlated with SAXS measurements.

4.2.2. Doped-TiO2

Tieng et al. [76] have reported on the nucleation and growth process of titanium-oxo-alkoxy nanoparticles doped with iron acetylacetonate (Fe(acac)3). It has been observed that Fe(acac)3 significantly reduced the rate of the particles’ growth, which was explained by the formation of a large particle coordinated by the acetylacetonate group slowing down the rates of hydrolysis and condensation. Even though the iron doping notably affects the induction rates, doped oxo-particles’ sizes were not significantly different from pure TOA. The photocatalytic activity of oxo-Fe-TiO2 particles on a SiO2 support for the ethylene removal was studied [96]. The maximum efficiency was obtained for a photocatalyst treated at 350 °C with a Fe/Ti molar ratio of 0.005 at.%. The comparative study of catalytic performance with the TiO2-P25 reference photocatalyst showed that the elaborated material is seven times more active than the reference material. The optimum size of the TiO2 photocatalyst was estimated to be ~8 nm and explained by the differences in the photoinduced charges (e and h+) motilities.
Azouani et al. [77,78] have reported the synthesis of nitrogen doped TiO2. Different from iron doping, this doping accelerates the kinetics rate in both nucleus and aggregation stages. The N-doping at the nucleation stage of oxo-alkoxy nanoparticles was found to be very effective. In contrast, it has been observed that N easily leaves the solids during heating at temperatures close to those required for the anatase phase crystallization. A major problem of the N-doped photocatalyst preparation by the proposed method is therefore related to N atoms’ retention at the heat treatment stage. The synthesis of nitrogen-doped TiO2 nanodeposits on glass beads was employed for photocatalytic tests under visible light. The nanodeposits are active under visible radiation and the conversion rate of trichloroethylene is around 40%. The control of the homogeneity and the amount of dopant (heat treatment) with nitrogen seemed to be the key to the synthesis of a new generation of active photocatalysts under visible radiation.

4.2.3. ZrO2

The element zirconium is in the same group as titanium, and its alkoxides have four ligands—OR groups. The parameters, such as pH, reaction medium, synthesis time and temperature, were investigated for in situ synthesis of zirconia via sol-gel [97]. The particle sizes and the polydispersion of sols were characterized by in situ DLS. A detailed study of the nucleation-growth of zirconium-oxo-alkoxy (ZOA) nanoparticles reported by Labidi et al. [79] has been carried out in a micromixing sol-gel reactor using zirconium n-butoxide and zirconium n-propoxide as precursors, and ethanol, n-propanol, 2-propanol and n-butanol as solvents. It has been found that ZOA oxo-particles were monodisperse with small sizes and stable when zirconium n-propoxide and n-propanol were used. The size of ZOA particles prepared from zirconium(IV) propoxide in n-propanol, obtained in a large range of precursor concentrations and hydrolysis ratios, is equal to 2R = 3.6 nm, which is significantly smaller than that of titanium oxo-particles TOA (R = 2.6 nm, H > 2, confirmed by The TEM analysis). The evolution of ZOA sizes obtained from DLS versus hydrolysis ratios is shown in Figure 6. In domain H ≤ 2: monodisperse nanoparticles appeared in the millisecond timescales and were very stable (they existed for longer than 24 h) with R = 1.8 nm. In domain H > 2, particles grew quickly with some aggregations after the injection. This study highlighted similarities and differences between the behaviors of ZOA and TOA. A remarkable similarity with the results of the nucleation-growth kinetic monitoring of (TOA) nanoparticles was noted. Specifically, both systems denote near-instantaneous nucleation as well as accelerated classical growth during the induction step for hydrolysis rates H > 2.0 and stable colloids for H ≤ 2.0. On the other hand, ZOA does not show stable sub-nuclear units (clusters), which was observed with TOA, an aspect that requires a theoretical explanation of quantum chemistry. Monodispersed ZOA nanoparticles of 3.6 nm size were used as catalysts for the conversion of free fatty acids (FFA) into biofuel [98]. The solid acid catalyst showed an enhanced activity with a 95–99% yield of methyl palmitate in the esterification of palmitic acid.

4.2.4. ZrxTi1-xO2 and VxTi1-xO2

The zirconium-titanium oxo-alkoxy (ZTOA) nanoparticles were prepared via sol-gel process of different elemental compositions 0 ≤ x = CZr/(CZr + CTi) ≤ 1. At the hydrolysis ratio H = 1.25 and 0.3 ≤ x ≤ 0.6, ZTOA nanoparticles formed with a radius of 2.1 nm, which differs from pure titanium-oxo-alkoxy (TOA, x = 0) and zirconium-oxo-alkoxy (ZOA, x = 1), with respective radii of 1.6 and 1.8 nm, as shown in Figure 6. The mixed oxide nanoparticles were stable at H ≤ 1.5 and underwent an accelerated growth at higher H values during a common induction period of the sol-gel process. Moreover, the elemental composition x is related to the material electronic structure, which defines the size of ZTOA nuclei [80]. Based on sol-gel process monitoring by in situ DLS, the size-selected ZTOA particles were prepared. The band gap of ZrxTi1-xO2 shifts to higher energies with an increase of Zr content, making the material with 0 ≤ x ≤ 0.2 appropriate for UVA photocatalysis: this material conserves anatase phase of titania strongly distorted by the addition of Zr. The best activity showed a composition with x = 0.0425 heat treated at T = 500 °C, which was twice as high as that of to pure anatase TiO2 [99]. The enhanced activity of the material has been attributed to its open porosity specific to composition x and calcination temperature T.
The mixed vanadium-titanium oxo-alkoxy (VTOA) nanoparticles [81] were prepared in the sol-gel micromixing reactor. The vanadium content x appeared to be a key parameter for the catalyst preparation. At a low vanadium content of x ≤ 10 mol%, titanium oxo-alkoxy species first appeared in the colloid solution, and then the vanadium oxo-alkoxy species was attracted at the surface. However, at the high x > 20 mol%, the subnuleus TOA species were imprisoned by large VOA species, preventing the appearance of the nucleus. The increase of the nucleus size was induced by an increase of the precursor concentration. These results support a new paradigm of the sol-gel process proposed by Kessler [100], which suggests a profound restructuring of the oxo-metallic species during their association. The size- and composition-controlled VTOA nanoparticles coated on silica beads were used, after an appropriate heat treatment, as the photocatalyst in the methylene blue (MB) degradation in aqueous solutions [101]. The best photocatalytic performance of VxTi1-xO2 nanoparticle coatings under UVA and visible light illuminations was noted, with a vanadium content x of 2 mol% and 10 mol%, respectively.

4.2.5. Zeolite

Nanosized zeolites have been widely used as catalysts for petrochemistry and environmental protection [102]. One of the significant developments in zeolite research has been the production of microporous nanocrystals in the shape of stable colloidal suspensions with narrow particle size distribution [103]. Artioli et al. [104] investigated the early stage of zeolite growth using in situ DLS and synchrotron X-ray powder diffraction. The DLS results confirmed the formation of an amorphous phase before the development of the zeolite LTA crystals. The increase of the temperature decreased the induction time and increased the growth rate. For a more detailed study, Mintova and Valtchev [82] first applied in situ DLS to investigate the effect of different silica sources in the formation of nanosized zeolite crystals. It was shown that the type of silica source used strongly influenced the size of the primary species in the precursor mixture: 2 nm with TEOS, 50 nm with Ludox LS 30 and 50 nm with Cab-O-Sil. After transforming the amorphous precursor colloids into crystalline silicalite, the hydrodynamic radius determined by DLS were 15, 25 and 50 nm for TEOS, Cab-O-Sil and Ludox LS, respectively. This study showed the importance of in situ DLS for the study of the transformation process of the silica precursors into crystalline silicalite.

4.2.6. Metal and Metal-Polymer

The hybrid microgel (metal-polymer) offers the benefit of embedding metal nanoparticles in a polymer network, which inhibits aggregation with other nanoparticles. The catalytic activity of nanoparticles could be adjusted by swelling and shrinking the polymer gels. For this purpose, in situ DLS has an advantage over other techniques. Xiao et al. [83] investigated the metal–polymer hybrid microgels for the simultaneous modulation and monitoring of catalysis. In situ DLS indicated the formation of gold microgel with a larger diameter, 260 nm, than the gold nanoparticles, which had a diameter of 32 nm. The influence of the solution temperature and pH value on the hybrid microgels was also investigated by studying polymer gel volume phase transitions in solutions.

4.2.7. Biological Materials

DLS is becoming the most common technique for the characterization of suspensions in life science and industrial quality control in biotechnology. For example, the different stages of protein crystallization experiments could be investigated by in situ DLS, as the size of the crystals can be measured as they grow [105,106]. Despite the difficulties of the in situ DLS technique in continuous reactors, a flow-connected DLS apparatus has been developed which couples in situ DLS with SAXS measurements [55]. DLS data could be collected during an X-ray exposure and provide the dispersion of the solution as well as the hydrodynamic radius of biological particles in solution. Furthermore, near UV circular dichroism spectroscopy was used in conjunction with the DLS to analyze the tertiary structure and consequently the stability of the proteins.

4.2.8. Others

The in situ measurements of carbon nanotubes in suspension could be achieved by DLS. To understand the influence of sonication procedures, Badaire et al. [56] applied this in situ technique to determine of the length and diameter of carbon nanotubes and investigated the sonication power and time. By developing an appropriate model, in situ DLS could be extended to anisotropic particles (e.g., gold nanorods [107]).
Nanomesocrystals have displayed huge potential as catalysts due to their unique structural features [108]. Embrechts et al. [109] used ZnO-PVP mesocrystals as a model system characterized by in situ DLS. With in situ DLS, it is possible to see firsthand how 10 nm primary building blocks develop early in the synthesis and how they are subsequently oriented attached to 200–1200 nm mesocrystalline superstructures.

5. Conclusions

As a non-destructive technique, DLS has been widely applied for determining colloids’ stability and particles’ sizing in the range of 1–1000 nm. To access the in situ and real-time measurement in the sol-gel process and effective micromixing reactors, DLS instruments based on an optical fiber probe have been used, which permitted avoiding any sampling or transfer of the solution and showed good reproducibility of the process kinetics. This in situ and real-time particle size measurement appeared to be crucial for establishment of the relationships between the process parameters and particles’ sizes in the sol-gel process. Different nanomaterials have been investigated up to now, including TiO2, doped TiO2, ZrO2, zeolite, ZrxTi1-xO2, VxTi1-xO2, metal and biological materials. The use of in situ DLS methods allowed a successful analysis of the nucleation-growth kinetics, determination of the nucleus size and establishment of an interesting correlation between the elementary composition, size and crystallization process. These results show that efficient catalysts with reproducible functional response can be developed for nanoparticles with the size and composition control, helped by in situ DLS measurements.

Author Contributions

Z.J.: conceptualization, methodology, investigation, data curation, formal analysis, writing—original draft, writing—review & editing, supervision, project administration, funding acquisition. J.L.: software, visualization, investigation, writing—review & editing. L.G.: investigation, writing—review & editing. D.Y.: project administration, writing—review & editing, supervision. A.K.: investigation, writing—review & editing, supervision. All authors have read and agreed to the published version of the manuscript.

Funding

This research received no external funding.

Data Availability Statement

Not applicable.

Conflicts of Interest

The authors declare no conflict of interest.

References

  1. Oskam, G. Metal Oxide Nanoparticles: Synthesis, Characterization and Application. J. Sol. Gel Sci. Technol. 2006, 37, 161–164. [Google Scholar] [CrossRef]
  2. Franke, M.E.; Koplin, T.J.; Simon, U. Metal and Metal Oxide Nanoparticles in Chemiresistors: Does the Nanoscale Matter? Small 2006, 2, 36–50. [Google Scholar] [CrossRef] [PubMed]
  3. Bayal, N.; Jeevanandam, P. Synthesis of TiO2−MgO Mixed Metal Oxide Nanoparticles via a Sol−Gel Method and Studies on Their Optical Properties. Ceram. Int. 2014, 40, 15463–15477. [Google Scholar] [CrossRef]
  4. Somorjai, G.A.; Park, J.Y. Molecular Factors of Catalytic Selectivity. Angew. Chem. Int. Ed. 2008, 47, 9212–9228. [Google Scholar] [CrossRef]
  5. Bhatkhande, D.S.; Pangarkar, V.G.; Beenackers, A.A.C.M. Photocatalytic Degradation for Environmental Applications–a Review. J. Chem. Technol. Biotechnol. Int. Res. Process Environ. Clean Technol. 2002, 77, 102–116. [Google Scholar] [CrossRef]
  6. Fujishima, A.; Honda, K. Photolysis-Decomposition of Water at the Surface of an Irradiated Semiconductor. Nature 1972, 238, 37–38. [Google Scholar] [CrossRef]
  7. Verma, V.; Al-Dossari, M.; Singh, J.; Rawat, M.; Kordy, M.G.M.; Shaban, M. A Review on Green Synthesis of TiO2 NPs: Photocatalysis and Antimicrobial Applications. Polymers 2022, 14, 1444. [Google Scholar] [CrossRef]
  8. Xu, T.; Zhang, L.; Cheng, H.; Zhu, Y. Significantly Enhanced Photocatalytic Performance of ZnO via Graphene Hybridization and the Mechanism Study. Appl. Catal. B Environ. 2011, 101, 382–387. [Google Scholar] [CrossRef]
  9. Wang, B.-Y.; Huang, S.-Y.; Hsiao, Y.-S.; Wei, P.-C.; Chou, C.-M.; Hsiao, V.K.S. Pulsed-Laser Induced Photolysis of Synthesizing Magnetic Fe3O4 Nanoparticles for Visible-Light Photocatalysis. Catalysts 2022, 12, 1459. [Google Scholar] [CrossRef]
  10. Fu, X.; Tang, W.; Ji, L.; Chen, S. V2O5/Al2O3 Composite Photocatalyst: Preparation, Characterization, and the Role of Al2O3. Chem. Eng. J. 2012, 180, 170–177. [Google Scholar] [CrossRef]
  11. Fauzi, A.A.; Jalil, A.A.; Hassan, N.S.; Aziz, F.F.A.; Azami, M.S.; Hussain, I.; Saravanan, R.; Vo, D.-V. A Critical Review on Relationship of CeO2-Based Photocatalyst towards Mechanistic Degradation of Organic Pollutant. Chemosphere 2022, 286, 131651. [Google Scholar] [CrossRef] [PubMed]
  12. Akpan, U.G.; Hameed, B.H. The Advancements in Sol–Gel Method of Doped-TiO2 Photocatalysts. Appl. Catal. A Gen. 2010, 375, 1–11. [Google Scholar] [CrossRef]
  13. Wong, C.L.; Tan, Y.N.; Mohamed, A.R. A Review on the Formation of Titania Nanotube Photocatalysts by Hydrothermal Treatment. J. Environ. Manag. 2011, 92, 1669–1680. [Google Scholar] [CrossRef] [PubMed]
  14. Zhang, M.; Sheng, G.; Fu, J.; An, T.; Wang, X.; Hu, X. Novel Preparation of Nanosized ZnO–SnO2 with High Photocatalytic Activity by Homogeneous Co-Precipitation Method. Mater. Lett. 2005, 59, 3641–3644. [Google Scholar] [CrossRef]
  15. Mamaghani, A.H.; Haghighat, F.; Lee, C.-S. Hydrothermal/Solvothermal Synthesis and Treatment of TiO2 for Photocatalytic Degradation of Air Pollutants: Preparation, Characterization, Properties, and Performance. Chemosphere 2019, 219, 804–825. [Google Scholar] [CrossRef]
  16. Di, L.; Zhang, X.; Xu, Z.; Wang, K. Atmospheric-Pressure Cold Plasma for Preparation of High Performance Pt/TiO2 Photocatalyst and Its Mechanism. Plasma Chem. Plasma Process. 2014, 34, 301–311. [Google Scholar] [CrossRef]
  17. Nikam, A.V.; Prasad, B.L.V.; Kulkarni, A.A. Wet Chemical Synthesis of Metal Oxide Nanoparticles: A Review. CrystEngComm 2018, 20, 5091–5107. [Google Scholar] [CrossRef]
  18. Ishak, N.M.; Kamarudin, S.K.; Timmiati, S.N. Green Synthesis of Metal and Metal Oxide Nanoparticles via Plant Extracts: An Overview. Mater. Res. Express 2019, 6, 112004. [Google Scholar] [CrossRef]
  19. Jeevanandam, J.; Chan, Y.S.; Danquah, M.K. Biosynthesis of Metal and Metal Oxide Nanoparticles. ChemBioEng Rev. 2016, 3, 55–67. [Google Scholar] [CrossRef]
  20. Owens, G.J.; Singh, R.K.; Foroutan, F.; Alqaysi, M.; Han, C.-M.; Mahapatra, C.; Kim, H.-W.; Knowles, J.C. Sol–Gel Based Materials for Biomedical Applications. Prog. Mater. Sci. 2016, 77, 1–79. [Google Scholar] [CrossRef] [Green Version]
  21. Li, Y.-F.; Liu, Z.-P. Particle Size, Shape and Activity for Photocatalysis on Titania Anatase Nanoparticles in Aqueous Surroundings. J. Am. Chem. Soc. 2011, 133, 15743–15752. [Google Scholar] [CrossRef]
  22. Stroyuk, A.L.; Kryukov, A.I.; Kuchmii, S.Y.; Pokhodenko, V.D. Quantum Size Effects in Semiconductor Photocatalysis. Theor. Exp. Chem. 2005, 41, 207–228. [Google Scholar] [CrossRef]
  23. Bałdyga, J.; Pohorecki, R. Turbulent Micromixing in Chemical Reactors—A Review. Chem. Eng. J. Biochem. Eng. J. 1995, 58, 183–195. [Google Scholar] [CrossRef]
  24. Barth, H.G. Modern Methods of Particle Size Analysis; John Wiley & Sons: Hoboken, NJ, USA, 1984; Volume 97, ISBN 0-471-87571-6. [Google Scholar]
  25. Lim, J.; Yeap, S.P.; Che, H.X.; Low, S.C. Characterization of Magnetic Nanoparticle by Dynamic Light Scattering. Nanoscale Res. Lett. 2013, 8, 1–14. [Google Scholar] [CrossRef] [Green Version]
  26. Stetefeld, J.; McKenna, S.A.; Patel, T.R. Dynamic Light Scattering: A Practical Guide and Applications in Biomedical Sciences. Biophys. Rev. 2016, 8, 409–427. [Google Scholar] [CrossRef] [Green Version]
  27. Maguire, C.M.; Rösslein, M.; Wick, P.; Prina-Mello, A. Characterisation of Particles in Solution–a Perspective on Light Scattering and Comparative Technologies. Sci. Technol. Adv. Mater. 2018, 19, 732–745. [Google Scholar] [CrossRef] [PubMed] [Green Version]
  28. Hassan, P.A.; Rana, S.; Verma, G. Making Sense of Brownian Motion: Colloid Characterization by Dynamic Light Scattering. Langmuir 2015, 31, 3–12. [Google Scholar] [CrossRef]
  29. Xu, R. Light Scattering: A Review of Particle Characterization Applications. Particuology 2015, 18, 11–21. [Google Scholar] [CrossRef]
  30. ISO 22412:2017(En); Particle Size Analysis—Dynamic Light Scattering (DLS). ISO: Geneva, Switzerland.
  31. Bhattacharjee, S. DLS and Zeta Potential—What They Are and What They Are Not? J. Control. Release 2016, 235, 337–351. [Google Scholar] [CrossRef]
  32. Hutin, A. Size Analysis of Dispersions in Liquid Phase; Zenodo: Geneva, Switzerland, 2022. [Google Scholar]
  33. Alexander, M.; Dalgleish, D.G. Dynamic Light Scattering Techniques and Their Applications in Food Science. Food Biophys. 2006, 1, 2–13. [Google Scholar] [CrossRef]
  34. Carvalho, P.M.; Felício, M.R.; Santos, N.C.; Gonçalves, S.; Domingues, M.M. Application of Light Scattering Techniques to Nanoparticle Characterization and Development. Front. Chem. 2018, 6, 237. [Google Scholar] [CrossRef] [PubMed]
  35. Demeler, B.; Nguyen, T.-L.; Gorbet, G.E.; Schirf, V.; Brookes, E.H.; Mulvaney, P.; El-Ballouli, A.O.; Pan, J.; Bakr, O.M.; Demeler, A.K. Characterization of Size, Anisotropy, and Density Heterogeneity of Nanoparticles by Sedimentation Velocity. Anal. Chem. 2014, 86, 7688–7695. [Google Scholar] [CrossRef] [PubMed] [Green Version]
  36. Wynn, E.J.W.; Hounslow, M.J. Coincidence Correction for Electrical-Zone (Coulter-Counter) Particle Size Analysers. Powder Technol. 1997, 93, 163–175. [Google Scholar] [CrossRef]
  37. Kim, J.S.; LaGrange, T.; Reed, B.W.; Taheri, M.L.; Armstrong, M.R.; King, W.E.; Browning, N.D.; Campbell, G.H. Imaging of Transient Structures Using Nanosecond in Situ TEM. Science 2008, 321, 1472–1475. [Google Scholar] [CrossRef]
  38. Wang, M.; Li, Z.; Raabe, D. In-Situ SEM Observation of Phase Transformation and Twinning Mechanisms in an Interstitial High-Entropy Alloy. Acta Mater. 2018, 147, 236–246. [Google Scholar] [CrossRef]
  39. Hall, B.D.; Zanchet, D.; Ugarte, D. Estimating Nanoparticle Size from Diffraction Measurements. J. Appl. Crystallogr. 2000, 33, 1335–1341. [Google Scholar] [CrossRef]
  40. Khlebtsov, B.N.; Khlebtsov, N.G. On the Measurement of Gold Nanoparticle Sizes by the Dynamic Light Scattering Method. Colloid J. 2011, 73, 118–127. [Google Scholar] [CrossRef]
  41. Tyndall, J. On the Blue Color of the Sky, the Polarization of Skylight, and Polarization of Light by Cloudy Matter Generally. J. Frankl. Inst. 1869, 88, 34–40. [Google Scholar] [CrossRef]
  42. Strutt, J.W.X.V. On the Light from the Sky, Its Polarization and Colour. Lond. Edinb. Dublin Philos. Mag. J. Sci. 1871, 41, 107–120. [Google Scholar] [CrossRef]
  43. Mie, G. Beiträge Zur Optik Trüber Medien, Speziell Kolloidaler Metallösungen. Ann. Der Phys. 1908, 330, 377–445. [Google Scholar] [CrossRef]
  44. Soloviev, A. Sol-Gel Process: DLS Studies of Particles Growth Kinetics during Hydrolysis-Condensation of Titanium Isopropoxide (IV). Ph.D. Thesis, Sorbonne Paris Nord University, Paris, France, 2000. [Google Scholar]
  45. Frisken, B.J. Revisiting the Method of Cumulants for the Analysis of Dynamic Light-Scattering Data. Appl. Opt. 2001, 40, 4087–4091. [Google Scholar] [CrossRef] [PubMed] [Green Version]
  46. Dyott, R.B. The Fibre-Optic Doppler Anemometer. IEE J. Microw. Opt. Acoust. UK 1978, 2, 13. [Google Scholar] [CrossRef]
  47. Auweter, H.; Horn, D. Fiber-Optical Quasi-Elastic Light Scattering of Concentrated Dispersions. J. Colloid Interface Sci. 1985, 105, 399–409. [Google Scholar] [CrossRef]
  48. Egelhaaf, S.U.; Schurtenberger, P. A Fiber-optics-based Light Scattering Instrument for Time-resolved Simultaneous Static and Dynamic Measurements. Rev. Sci. Instrum. 1996, 67, 540–545. [Google Scholar] [CrossRef]
  49. Alargova, R.G.; Deguchi, S.; Tsujii, K. Dynamic Light Scattering Study of Polystyrene Latex Suspended in Water at High Temperatures and High Pressures. Colloids Surf. A Physicochem. Eng. Asp. 2001, 183–185, 303–312. [Google Scholar] [CrossRef]
  50. Rivallin, M.; Benmami, M.; Kanaev, A.; Gaunand, A. Sol–Gel Reactor with Rapid Micromixing: Modelling and Measurements of Titanium Oxide Nano-Particle Growth. Chem. Eng. Res. Des. 2005, 83, 67–74. [Google Scholar] [CrossRef]
  51. Pristinski, D.; Chastek, T.Q. A Versatile, Low-Cost Approach to Dynamic Light Scattering. Meas. Sci. Technol. 2009, 20, 045705. [Google Scholar] [CrossRef]
  52. Chen, M.; Wang, Y.; Li, W.; Xia, M.; Meng, Z.; Xia, L. A Dual-Angle Fiber Dynamic Light Scattering System Integrated with Microfluidic Chip for Particle Size Measurement. Opt. Laser Technol. 2022, 150, 107891. [Google Scholar] [CrossRef]
  53. Soloviev, A.; Jensen, H.; Søgaard, E.G.; Kanaev, A.V. Aggregation Kinetics of Sol-Gel Process Based on Titanium Tetraisopropoxide. J. Mater. Sci. 2003, 38, 3315–3318. [Google Scholar] [CrossRef]
  54. Chastek, T.Q.; Beers, K.L.; Amis, E.J. Miniaturized Dynamic Light Scattering Instrumentation for Use in Microfluidic Applications. Rev. Sci. Instrum. 2007, 78, 072201. [Google Scholar] [CrossRef]
  55. Falke, S.; Dierks, K.; Blanchet, C.; Graewert, M.; Cipriani, F.; Meijers, R.; Svergun, D.; Betzel, C. Multi-Channel in Situ Dynamic Light Scattering Instrumentation Enhancing Biological Small-Angle X-Ray Scattering Experiments at the PETRA III Beamline P12. J. Synchrotron Radiat. 2018, 25, 361–372. [Google Scholar] [CrossRef] [PubMed]
  56. Badaire, S.; Poulin, P.; Maugey, M.; Zakri, C. In Situ Measurements of Nanotube Dimensions in Suspensions by Depolarized Dynamic Light Scattering. Langmuir 2004, 20, 10367–10370. [Google Scholar] [CrossRef] [PubMed]
  57. Lehner, D.; Lindner, H.; Glatter, O. Determination of the Translational and Rotational Diffusion Coefficients of Rodlike Particles Using Depolarized Dynamic Light Scattering. Langmuir 2000, 16, 1689–1695. [Google Scholar] [CrossRef]
  58. Zarghani, M.; Akhlaghinia, B. Fe 3 O 4 Magnetic Nanoparticles (MNPs) as an Efficient Catalyst for Selective Oxidation of Benzylic and Allylic C–H Bonds to Carbonyl Compounds with Tert-Butyl Hydroperoxide. RSC Adv. 2016, 6, 38592–38601. [Google Scholar] [CrossRef]
  59. Dutta, S.; Jaiswal, K.K.; Verma, R.; Basavaraju, D.M.; Ramaswamy, A.P. Green Synthesis of Zinc Oxide Catalyst under Microwave Irradiation Using Banana (Musa Spp.) Corm (Rhizome) Extract for Biodiesel Synthesis from Fish Waste Lipid. Biocatal. Agric. Biotechnol. 2019, 22, 101390. [Google Scholar] [CrossRef]
  60. He, X.; Gan, J.; Fakhri, A.; Dizaji, B.F.; Azarbaijan, M.H.; Hosseini, M. Preparation of Ceric Oxide and Cobalt Sulfide-Ceric Oxide/Cellulose-Chitosan Nanocomposites as a Novel Catalyst for Efficient Photocatalysis and Antimicrobial Study. Int. J. Biol. Macromol. 2020, 143, 952–957. [Google Scholar] [CrossRef]
  61. Wang, C.; Cai, X.; Chen, Y.; Cheng, Z.; Luo, X.; Mo, S.; Jia, L.; Lin, P.; Yang, Z. Improved Hydrogen Production from Glycerol Photoreforming over Sol-Gel Derived TiO2 Coupled with Metal Oxides. Chem. Eng. J. 2017, 317, 522–532. [Google Scholar] [CrossRef]
  62. Larichev, Y.V. Application of DLS for Metal Nanoparticle Size Determination in Supported Catalysts. Chem. Pap. 2021, 75, 2059–2066. [Google Scholar] [CrossRef]
  63. Bayat, A.; Baghdadi, M.; Bidhendi, G.N. Tailored Magnetic Nano-Alumina as an Efficient Catalyst for Transesterification of Waste Cooking Oil: Optimization of Biodiesel Production Using Response Surface Methodology. Energy Convers. Manag. 2018, 177, 395–405. [Google Scholar] [CrossRef]
  64. Tran, U.P.N.; Le, K.K.A.; Phan, N.T.S. Expanding Applications of Metal−Organic Frameworks: Zeolite Imidazolate Framework ZIF-8 as an Efficient Heterogeneous Catalyst for the Knoevenagel Reaction. ACS Catal. 2011, 1, 120–127. [Google Scholar] [CrossRef]
  65. Catalytic and Physicochemical Properties of Fe-Polymer Nanocatalysts of Fischer–Tropsch Synthesis: Dynamic Light Scattering and FTIR Spectroscopy Study|SpringerLink. Available online: https://link.springer.com/article/10.1134/S0965544116120033 (accessed on 31 August 2022).
  66. Zhu, G.; Glass, E.N.; Zhao, C.; Lv, H.; Vickers, J.W.; Geletii, Y.V.; Musaev, D.G.; Song, J.; Hill, C.L. A Nickel Containing Polyoxometalate Water Oxidation Catalyst. Dalton Trans. 2012, 41, 13043. [Google Scholar] [CrossRef] [PubMed]
  67. Gopalakrishnan, R.; Loganathan, B.; Raghu, K. Green Synthesis of Au–Ag Bimetallic Nanocomposites Using Silybum Marianum Seed Extract and Their Application as a Catalyst. RSC Adv. 2015, 5, 31691–31699. [Google Scholar] [CrossRef]
  68. Baruah, B.; Gabriel, G.J.; Akbashev, M.J.; Booher, M.E. Facile Synthesis of Silver Nanoparticles Stabilized by Cationic Polynorbornenes and Their Catalytic Activity in 4-Nitrophenol Reduction. Langmuir 2013, 29, 4225–4234. [Google Scholar] [CrossRef] [PubMed] [Green Version]
  69. Souza, T.G.; Ciminelli, V.S.; Mohallem, N.D.S. A Comparison of TEM and DLS Methods to Characterize Size Distribution of Ceramic Nanoparticles. In Journal of Physics: Conference Series; IOP Publishing: Bristol, UK, 2016; Volume 733, p. 012039. [Google Scholar]
  70. Chen, Z.H.; Kim, C.; Zeng, X.; Hwang, S.H.; Jang, J.; Ungar, G. Characterizing Size and Porosity of Hollow Nanoparticles: SAXS, SANS, TEM, DLS, and Adsorption Isotherms Compared. Langmuir 2012, 28, 15350–15361. [Google Scholar] [CrossRef]
  71. Pabisch, S.; Feichtenschlager, B.; Kickelbick, G.; Peterlik, H. Effect of Interparticle Interactions on Size Determination of Zirconia and Silica Based Systems—A Comparison of SAXS, DLS, BET, XRD and TEM. Chem. Phys. Lett. 2012, 521, 91–97. [Google Scholar] [CrossRef] [Green Version]
  72. Flower, G.L.; Latha, S.V.; Rao, K.V. Novel Characterization of Nanosilver Fluid through Ultrasonic Studies Supported by UV–Vis Spectroscopy, DLS and TEM Studies. J. Mol. Liq. 2016, 221, 333–338. [Google Scholar] [CrossRef]
  73. Zhang, L.; He, R.; Gu, H.-C. Oleic Acid Coating on the Monodisperse Magnetite Nanoparticles. Appl. Surf. Sci. 2006, 253, 2611–2617. [Google Scholar] [CrossRef]
  74. Panchal, J.; Kotarek, J.; Marszal, E.; Topp, E.M. Analyzing Subvisible Particles in Protein Drug Products: A Comparison of Dynamic Light Scattering (DLS) and Resonant Mass Measurement (RMM). AAPS J. 2014, 16, 440–451. [Google Scholar] [CrossRef] [Green Version]
  75. Phenrat, T.; Kim, H.-J.; Fagerlund, F.; Illangasekare, T.; Tilton, R.D.; Lowry, G.V. Particle Size Distribution, Concentration, and Magnetic Attraction Affect Transport of Polymer-Modified Fe0 Nanoparticles in Sand Columns. Environ. Sci. Technol. 2009, 43, 5079–5085. [Google Scholar] [CrossRef]
  76. Tieng, S.; Azouani, R.; Chhor, K.; Kanaev, A. Nucleation-Growth of TiO2 Nanoparticles Doped with Iron Acetylacetonate. J. Phys. Chem. C 2011, 115, 5244–5250. [Google Scholar] [CrossRef]
  77. Azouani, R.; Tieng, S.; Chhor, K.; Bocquet, J.-F.; Eloy, P.; Gaigneaux, E.M.; Klementiev, K.; Kanaev, A.V. TiO 2 Doping by Hydroxyurea at the Nucleation Stage: Towards a New Photocatalyst in the Visible Spectral Range. Phys. Chem. Chem. Phys. 2010, 12, 11325–11334. [Google Scholar] [CrossRef] [PubMed] [Green Version]
  78. Azouani, R.; Michau, A.; Hassouni, K.; Chhor, K.; Bocquet, J.-F.; Vignes, J.-L.; Kanaev, A. Elaboration of Pure and Doped TiO2 Nanoparticles in Sol–Gel Reactor with Turbulent Micromixing: Application to Nanocoatings and Photocatalysis. Chem. Eng. Res. Des. 2010, 88, 1123–1130. [Google Scholar] [CrossRef]
  79. Labidi, S.; Jia, Z.; Amar, M.B.; Chhor, K.; Kanaev, A. Nucleation and Growth Kinetics of Zirconium-Oxo-Alkoxy Nanoparticles. Phys. Chem. Chem. Phys. 2015, 17, 2651–2659. [Google Scholar] [CrossRef]
  80. Cheng, K.; Chhor, K.; Brinza, O.; Vrel, D.; Kanaev, A. From Nanoparticles to Bulk Crystalline Solid: Nucleation, Growth Kinetics and Crystallisation of Mixed Oxide ZrxTi1−xO2 Nanoparticles. CrystEngComm 2017, 19, 3955–3965. [Google Scholar] [CrossRef]
  81. Sanchez Mendez, M.; Jia, Z.; Traore, M.; Ben Amar, M.; Nikravech, M.; Kanaev, A. Nucleation and Growth of Mixed Vanadium-Titanium Oxo-Alkoxy Nanoparticles in Sol-Gel Synthesis. Colloids Surf. A Physicochem. Eng. Asp. 2021, 610, 125636. [Google Scholar] [CrossRef]
  82. Mintova, S.; Valtchev, V. Effect of the Silica Source on the Formation of Nanosized Silicalite-1: An in Situ Dynamic Light Scattering Study. Microporous Mesoporous Mater. 2002, 55, 171–179. [Google Scholar] [CrossRef]
  83. Xiao, C.; Wu, Q.; Chang, A.; Peng, Y.; Xu, W.; Wu, W. Responsive Au@polymer Hybrid Microgels for the Simultaneous Modulation and Monitoring of Au-Catalyzed Chemical Reaction. J. Mater. Chem. A 2014, 2, 9514. [Google Scholar] [CrossRef]
  84. Cheng, K.; Chhor, K.; Kanaev, A. Solvent Effect on Nucleation-Growth of Titanium-Oxo-Alkoxy Nanoparticles. Chem. Phys. Lett. 2017, 672, 119–123. [Google Scholar] [CrossRef]
  85. Benmami, M.; Chhor, K.; Kanaev, A.V. High Photocatalytic Activity of Monolayer Nanocoatings Prepared from Non-Crystalline Titanium Oxide Sol Nanoparticles. Chem. Phys. Lett. 2006, 422, 552–557. [Google Scholar] [CrossRef]
  86. Bouslama, M.; Amamra, M.C.; Jia, Z.; Ben Amar, M.; Chhor, K.; Brinza, O.; Abderrabba, M.; Vignes, J.-L.; Kanaev, A. Nanoparticulate TiO2–Al2O3 Photocatalytic Media: Effect of Particle Size and Polymorphism on Photocatalytic Activity. Acs Catal. 2012, 2, 1884–1892. [Google Scholar] [CrossRef]
  87. Gorbovyi, P.; Uklein, A.; Tieng, S.; Brinza, O.; Traore, M.; Chhor, K.; Museur, L.; Kanaev, A. Novel Nanostructured PHEMA-TiO2 Hybrid Materials with Efficient Light-Induced Charge Separation. Nanoscale 2011, 3, 1807–1812. [Google Scholar] [CrossRef]
  88. Gorbovyi, P.; Uklein, A.; Traore, M.; Museur, L.; Kanaev, A. Formation of Gel of Preformed Size-Selected Titanium-Oxo-Alkoxy Nanoparticles: Towards Organic-Inorganic Hybrid Material with Efficient Interfacial Electron Transfer. Mater. Res. Express 2014, 1, 045039. [Google Scholar] [CrossRef]
  89. Luu, T.T.H.; Jia, Z.; Kanaev, A.; Museur, L. Photopolymerization of TiO2-Based Hybrid Materials: Effect of Nanoparticles Loading and Photosensitive 1D Microstructures Fabrication. J. Mater. Sci. 2023, 58, 1127–1138. [Google Scholar] [CrossRef]
  90. Jia, Z.; Ben Amar, M.; Brinza, O.; Astafiev, A.; Nadtochenko, V.; Evlyukhin, A.B.; Chichkov, B.N.; Duten, X.; Kanaev, A. Growth of Silver Nanoclusters on Monolayer Nanoparticulate Titanium-Oxo-Alkoxy Coatings. J. Phys. Chem. C 2012, 116, 17239–17247. [Google Scholar] [CrossRef]
  91. Jia, Z.; Amar, M.B.; Yang, D.; Brinza, O.; Kanaev, A.; Duten, X.; Vega-González, A. Plasma Catalysis Application of Gold Nanoparticles for Acetaldehyde Decomposition. Chem. Eng. J. 2018, 347, 913–922. [Google Scholar] [CrossRef]
  92. Sauce, S.; Vega-González, A.; Jia, Z.; Touchard, S.; Hassouni, K.; Kanaev, A.; Duten, X. New Insights in Understanding Plasma-Catalysis Reaction Pathways: Study of the Catalytic Ozonation of an Acetaldehyde Saturated Ag/TiO2/SiO2 Catalyst. Eur. Phys. J. Appl. Phys. 2015, 71, 20805. [Google Scholar] [CrossRef]
  93. Jia, Z.; Vega-Gonzalez, A.; Amar, M.B.; Hassouni, K.; Tieng, S.; Touchard, S.; Kanaev, A.; Duten, X. Acetaldehyde Removal Using a Diphasic Process Coupling a Silver-Based Nano-Structured Catalyst and a Plasma at Atmospheric Pressure. Catal. Today 2013, 208, 82–89. [Google Scholar] [CrossRef]
  94. Azouani, R.; Soloviev, A.; Benmami, M.; Chhor, K.; Bocquet, J.-F.; Kanaev, A. Stability and Growth of Titanium-Oxo-Alkoxy Ti x O y (OiPr) z Clusters. J. Phys. Chem. C 2007, 111, 16243–16248. [Google Scholar] [CrossRef]
  95. Guiot, C.; Spalla, O. Stabilization of TiO2 Nanoparticles in Complex Medium through a PH Adjustment Protocol. Environ. Sci. Technol. 2013, 47, 1057–1064. [Google Scholar] [CrossRef]
  96. Tieng, S.; Kanaev, A.; Chhor, K. New Homogeneously Doped Fe(III)–TiO2 Photocatalyst for Gaseous Pollutant Degradation. Appl. Catal. A: Gen. 2011, 399, 191–197. [Google Scholar] [CrossRef]
  97. dos Santos, V.; da Silveira, N.P.; Bergmann, C.P. In-Situ Evaluation of Particle Size Distribution of ZrO2-Nanoparticles Obtained by Sol–Gel. Powder Technol. 2014, 267, 392–397. [Google Scholar] [CrossRef]
  98. Labidi, S.; Amar, M.B.; Abderrabba, M.; Passarello, J.-P.; Kanaev, A. Nanoparticulate ZrO2/SO42- Catalyst for Biofuel Production. Int. J. Adv. Appl. Phys. Res. 2015, 2, 1–7. [Google Scholar] [CrossRef]
  99. Cheng, K.; Chhor, K.; Passarello, J.-P.; Colbeau-Justin, C.; Kanaev, A. Photocatalytic Nanoparticulate ZrxTi1-XO2 Coatings with Controlled Homogeneity of Elemental Composition. ChemistrySelect 2018, 3, 11118–11126. [Google Scholar] [CrossRef]
  100. Kessler, V.G. The Chemistry behind the Sol–Gel Synthesis of Complex Oxide Nanoparticles for Bio-Imaging Applications. J. Sol-Gel Sci. Technol. 2009, 51, 264. [Google Scholar] [CrossRef]
  101. Sanchez Mendez, M.; Lemarchand, A.; Traore, M.; Perruchot, C.; Sassoye, C.; Selmane, M.; Nikravech, M.; Ben Amar, M.; Kanaev, A. Photocatalytic Activity of Nanocoatings Based on Mixed Oxide V-TiO2 Nanoparticles with Controlled Composition and Size. Catalysts 2021, 11, 1457. [Google Scholar] [CrossRef]
  102. Wang, X.; Ma, Y.; Wu, Q.; Wen, Y.; Xiao, F.-S. Zeolite Nanosheets for Catalysis. Chem. Soc. Rev. 2022, 51, 2431–2443. [Google Scholar] [CrossRef]
  103. Kirschhock, C.E.; Ravishankar, R.; Looveren, L.V.; Jacobs, P.A.; Martens, J.A. Mechanism of Transformation of Precursors into Nanoslabs in the Early Stages of MFI and MEL Zeolite Formation from TPAOH− TEOS− H2O and TBAOH− TEOS− H2O Mixtures. J. Phys. Chem. B 1999, 103, 4972–4978. [Google Scholar] [CrossRef]
  104. Artioli, G.; Grizzetti, R.; Carotenuto, L.; Piccolo, C.; Colella, C.; Liguori, B.; Aiello, R.; Frontera, P. In Situ Dynamic Light Scattering and Synchrotron X-Ray Powder Diffraction Study of the Early Stages of Zeolite Growth. In Studies in Surface Science and Catalysis; Elsevier: Amsterdam, The Netherlands, 2002; Volume 142, pp. 45–52. ISBN 978-0-444-51174-4. [Google Scholar]
  105. Meyer, A.; Dierks, K.; Hussein, R.; Brillet, K.; Brognaro, H.; Betzel, C. Systematic Analysis of Protein–Detergent Complexes Applying Dynamic Light Scattering to Optimize Solutions for Crystallization Trials. Acta Crystallogr. Sect. F Struct. Biol. Commun. 2015, 71, 75–81. [Google Scholar] [CrossRef]
  106. Schubert, R.; Meyer, A.; Dierks, K.; Kapis, S.; Reimer, R.; Einspahr, H.; Perbandt, M.; Betzel, C. Reliably Distinguishing Protein Nanocrystals from Amorphous Precipitate by Means of Depolarized Dynamic Light Scattering. J. Appl. Crystallogr. 2015, 48, 1476–1484. [Google Scholar] [CrossRef]
  107. Glidden, M.; Muschol, M. Characterizing Gold Nanorods in Solution Using Depolarized Dynamic Light Scattering. J. Phys. Chem. C 2012, 116, 8128–8137. [Google Scholar] [CrossRef]
  108. Zhou, L.; O’Brien, P. Mesocrystals Properties and Applications. J. Phys. Chem. Lett. 2012, 3, 620–628. [Google Scholar] [CrossRef] [PubMed]
  109. Embrechts, H.E.; Zhang, S.; Hock, R.; Peukert, W.; Distaso, M. Observing Oriented Attachment during Mesocrystal Growth with in Situ Dynamic Light Scattering (DLS). Cryst. Growth Des. 2020, 20, 1266–1275. [Google Scholar] [CrossRef]
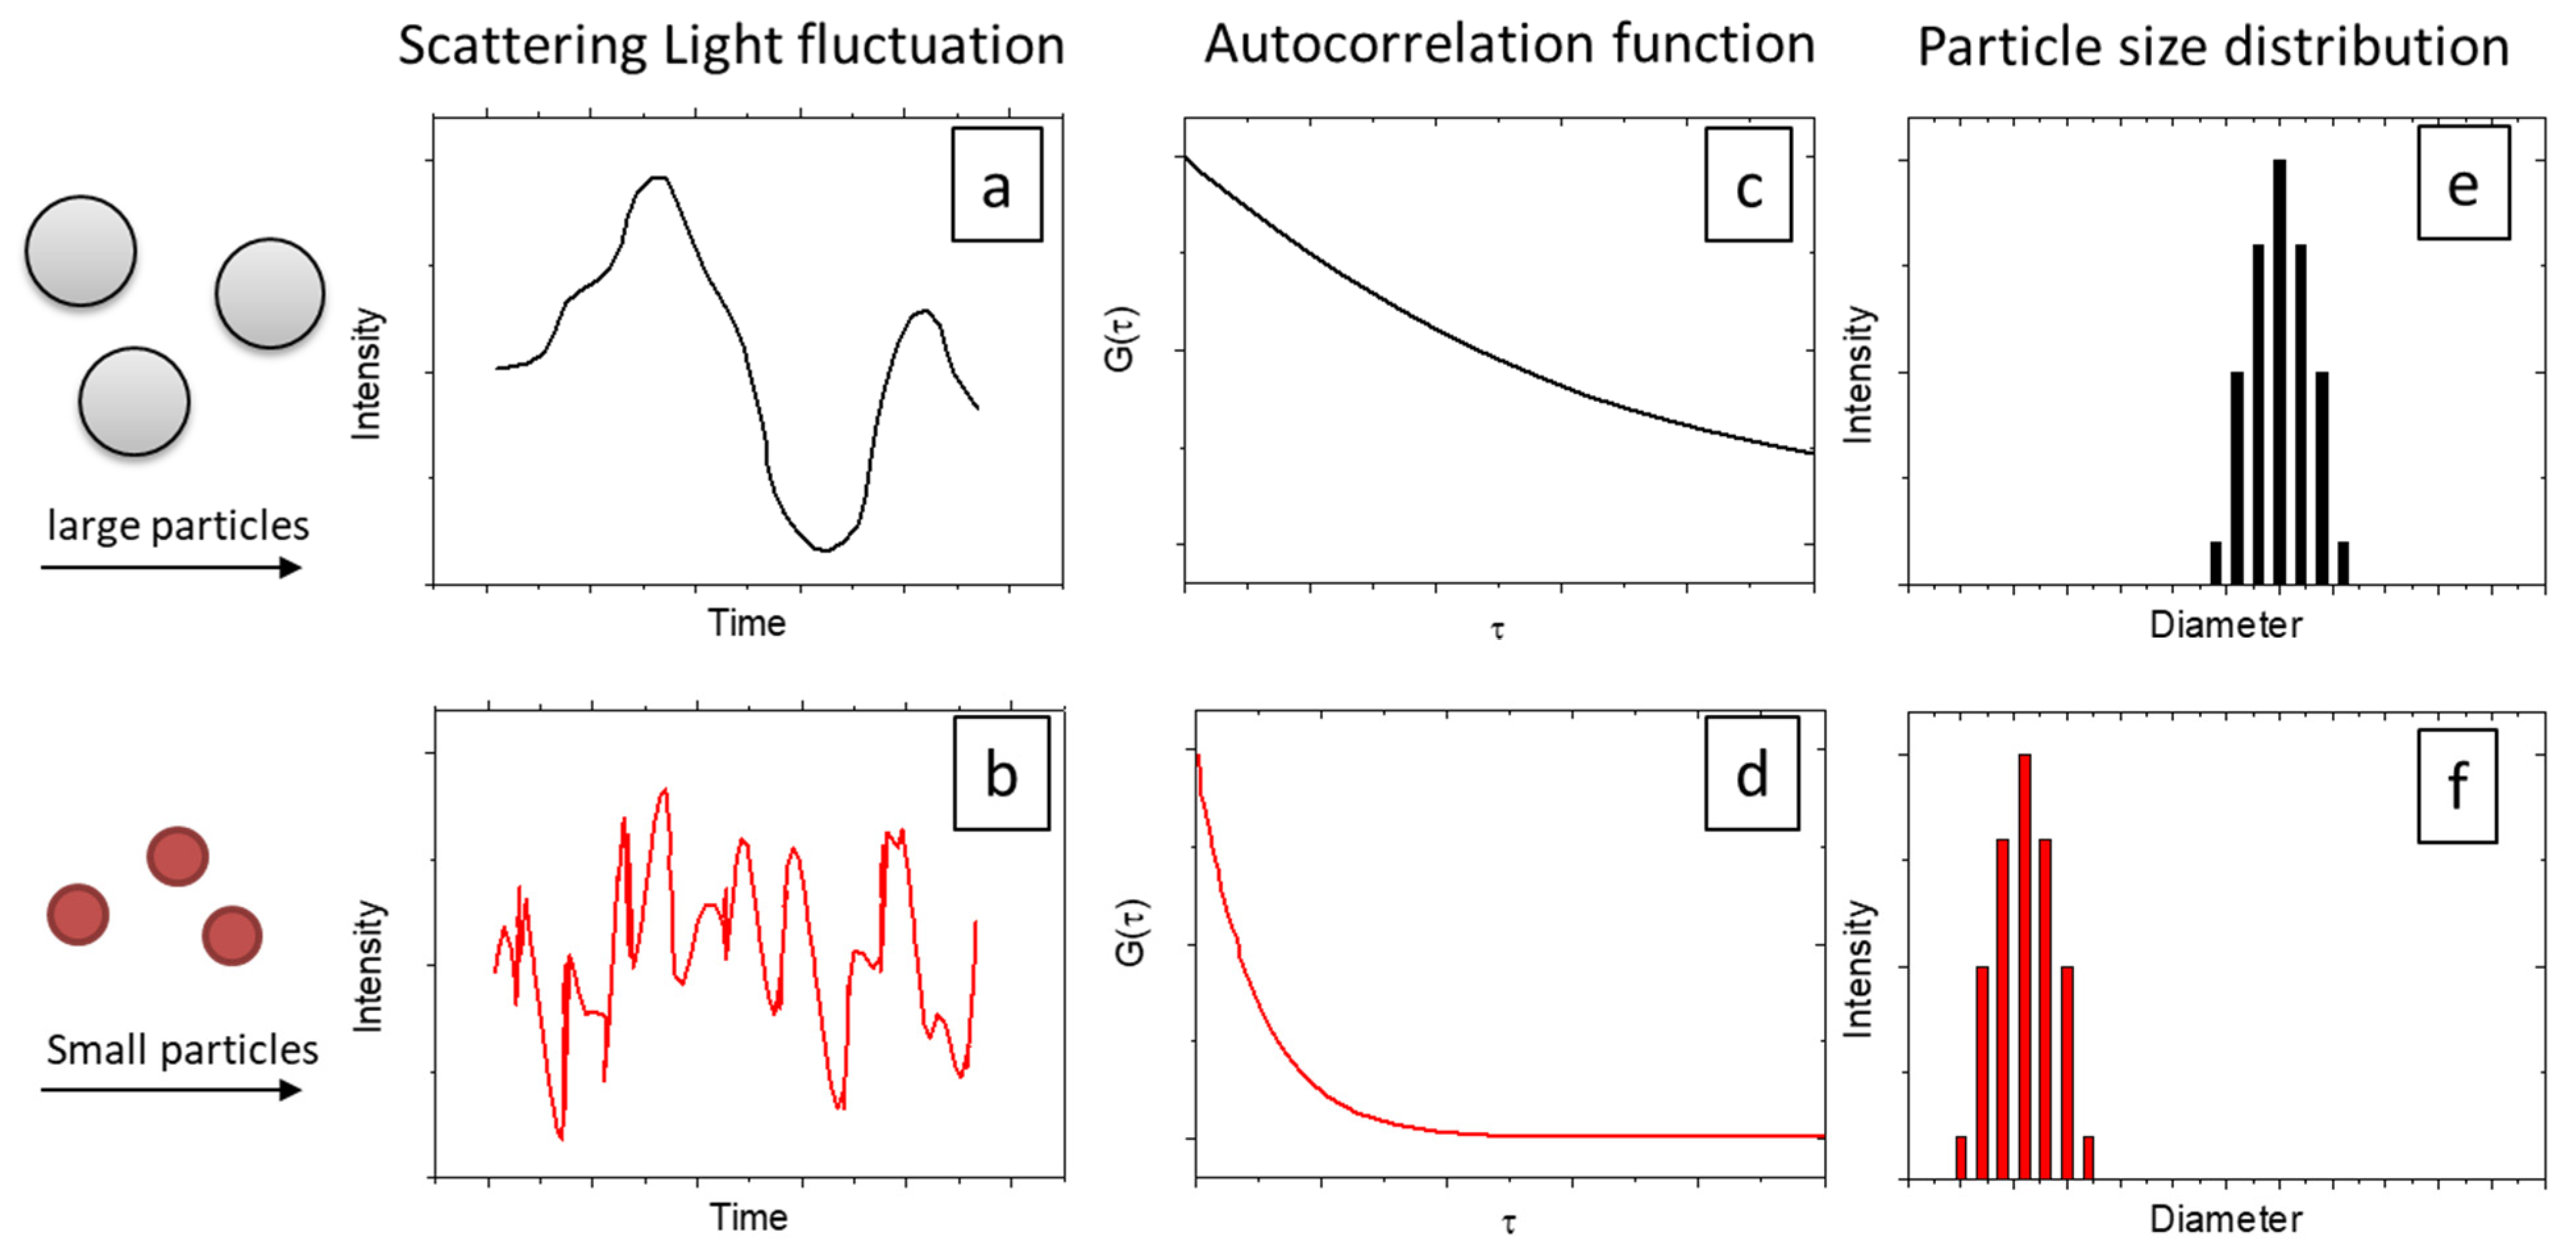
Figure 1. The effect of particles’ size on the fluctuations of the scattered light intensity (a,b), the corresponding autocorrelation function—ACF (c,d) and the particle size distribution (e,f).
Colloids 07 00015 g001
Figure 2. Block diagram of ex-situ DLS configuration.
Colloids 07 00015 g002
Figure 3. Schematic diagram of in situ DLS configuration using optical fiber.
Colloids 07 00015 g003
Figure 4. Three common modes of incorporating the optical fiber with existing reactor: (a) integrated, (b) separated and (c) microfluidic chips. (Reprinted/adapted with permission from Refs. [50,51,52]. Copyright © 2023 Elsevier Ltd. and © 2023 The Institution of Chemical Engineers. Elsevier B.V.).
Colloids 07 00015 g004
Figure 5. Scattering intensity of sol-gel growth during induction time with square symbol for radius and circle symbol for intensity. (Reprinted/adapted with permission from Ref. [53]. Copyright © 2023, Kluwer Academic Publishers).
Colloids 07 00015 g005
Figure 6. Initial sizes of particle (R) during the induction period of sol–gel process for different hydrolysis ratios with blue star for TOA, circle for ZOA and red square for ZTOA (Reprinted/adapted with permission from Refs. [80,81,94], Copyright © 2023, American Chemical Society, © 2023 Elsevier B.V. and © 2023 Royal Society of Chemistry).
Colloids 07 00015 g006
Table 1. The common sizing techniques and their characteristics.
TechniqueType of SizeSize (2R) Range
Dynamic light scatteringHydrodynamic radius1 nm–1 µm
Electrical mobilityElectrical mobility2 nm–1 µm
Laser diffractionScatter diameter100 nm–104 µm
Optical microscopyShape/Structure800 nm–150 µm
Scanning electron microscopyShape/Structure10 nm–5 µm
Transmission electron microscopyShape/Structure0.5 nm–1 µm
X-ray diffractionCrystallite size1 nm–1 µm
Ultrasound attenuationUltrasound attenuation10 nm–3000 µm
Table 2. Sample preparations and measurement conditions of DLS technique.
DesignationCriteria
DeviceLight sourceMonochromatic light (Laser): semiconductor laser is preferable for the low cost and long lifetime.
Angle90° or another specified angle
DetectorSensitive photomultiplier
Optical fibersSingle and multimode
CalibrationLatex standard
SampleConcentrationDilution or Enrichment (10−2–10−3% (v/v))
SampleColloids
SolventNo influence of samples’ properties
Good particles dispersion
TemperatureConstant: Room or others (up to 275 °C [49]).
Viscosity of solventKnown
Table 3. The main characteristics of three common reactors which integrate DLS system.
IntegratedSeparatedMicrofluidics
Reference[50][51][52]
LaserHe–Ne laser 632.8 nmDPSS 532 nmMGL-III 532 nm
Optical fiberMono et multi mode SEDILPC-07 series single modesingle-mode fiber probe,
Angle90°90°30° and 45°
Observed Volume(nL)~17~1
Calibration100 and 300 nm latex spheres 35 nm TiO2 sols107.6 and 64 nm latex spheres110 and 140 Carboxylated latex362–710 nm polystyrene particles
Table 4. Hydrodynamic diameter of different catalysts determined by DLS.
CatalystsSynthesis MethodHydrodynamic Diameter (nm)Catalytic
Application
Ref.
Fe3O4Coprecipitation16 nmBenzylic and allylic C-H oxidation[58]
ZnOMicrowave irradiation370 nmTransesterification conversion[59]
CeO2
CoS2-CeO2
ultrasonic method56 nm
62 nm
Photocatalysis[60]
TiO2Sol-gel215 nmPhotocatalysis[61]
Au/Al2O3Deposition–precipitation5–2000 nmCO oxidation[62]
Fe3O4/Al2O3Coprecipitation196 nmTransesterification reaction[63]
ZIF-8Solvothermal143 µmKnoevenagel reaction[64]
Fe-polymerThermal decomposition2–932 nmFischer–Tropsch Synthesis[65]
Ni-POMDeposition–precipitation700–1300 nmWater oxidation[66]
Au-AgSuccessive reduction10–5000 nmMethanol oxidation[67]
AgReduction0.2–30 nm4-Nitrophenol Reduction[68]
Table 5. Diameter of nanoparticles determined by DLS and TEM.
CatalystsDLS (nm)TEM (nm)Difference %Ref.
TiO277.2
224.8
39.3
66.2
49.1
70.63
[69]
Fe3O416.9
21.1
43.1
7.2
14.5
20.1
57.4
31.3
53.4
[73]
CoFe2O427.9
84.5
10.8
45.8
61.3
45.8
[69]
SiO26453.516.4[71]
ZrO2 small
ZrO2 Large
17.8
54
3.8
15.2
78.7
71.9
SiO2/TiO228
59
108
26
57
105
7.1
3.4
2.8
[70]
Table 6. Hydrodynamic diameter of different catalysts determined by in situ DLS.
CatalystsPrecursor of Sol-GelHydrodynamic Diameter (nm)Catalytic ApplicationRef.
TiO2Tianium tetraisopropoxide0.9–2.6 nmPhotocatalysis[50]
Fe–TiO2Iron(acetylacetonate)3
Tianium tetraisopropoxide
6 nmPhotocatalysis[76]
N–TiO2Hydroxyurea
Tianium tetraisopropoxide
3.0–6.7 nmPhotocatalysis[77,78]
ZrO2Zirconium n-butoxide1.5–2.1 nmEsterification[79]
ZrxTi1-xO2Zirconium n-butoxide
Tianium tetraisopropoxide
2.0–2.7 nmPhotocatalysis[80]
VxTi1-xO2Vanadium(V) oxytripropoxide
Tianium tetraisopropoxide
2–7 nmPhotocatalysis[81]
SilicaliteTEOS, Cab-O-Sil, Ludox LS2–50 nmPetrochemistry[82]
Au hybrid gelHAuCl432 nm
260 nm
Au-catalyzed reaction[83]
Disclaimer/Publisher’s Note: The statements, opinions and data contained in all publications are solely those of the individual author(s) and contributor(s) and not of MDPI and/or the editor(s). MDPI and/or the editor(s) disclaim responsibility for any injury to people or property resulting from any ideas, methods, instructions or products referred to in the content.