Article

The Effect of Nonionic Surfactants on the Kinetics of Methane Hydrate Formation in Multiphase System

1
Chemical Engineering Department, Universiti Teknologi PETRONAS, Bandar Seri Iskandar 32610, Malaysia
2
CO2 Research Centre, Universiti Teknologi PETRONAS, Bandar Seri Iskandar 32610, Malaysia
3
PTTEP, Level 26–30, Tower 2, PETRONAS Twin Towers, Kuala Lumpur City Centre, Kuala Lumpur 50088, Malaysia
4
Petroleum Engineering Department, College of Energy Technologies, Jikharra 218 657, Libya
5
PETRONAS Research Sdn Bhd, Kawasan Institusi Bangi, Lot 3288 3289 off Jalan Ayer Itam, Kajang 43000, Malaysia
*
Author to whom correspondence should be addressed.
Colloids Interfaces 2022, 6(3), 48; https://doi.org/10.3390/colloids6030048
Submission received: 15 August 2022 / Revised: 6 September 2022 / Accepted: 14 September 2022 / Published: 16 September 2022

Abstract

:
Gas hydrate inhibitors have proven to be the most feasible approach to controlling hydrate formation in flow assurance operational facilities. Due to the unsatisfactory performance of the traditional inhibitors, novel effective inhibitors are needed to replace the existing ones for safe operations within constrained budgets. This work presents experimental and modeling studies on the effects of nonionic surfactants as kinetic hydrate inhibitors. The kinetic methane hydrate inhibition impact of Tween-20, Tween-40, Tween-80, Span-20, Span-40, and Span-80 solutions was tested in a 1:1 mixture of a water and oil multiphase system at a concentration of 1.0% (v/v) and 2.0% (v/v), using a high-pressure autoclave cell at 8.70 MPa and 274.15 K. The results showed that Tween-80 effectively delays the hydrate nucleation time at 2.5% (v/v) by 868.1% compared to the blank sample. Tween-80 is more effective than PVP (a commercial kinetic hydrate inhibitor) in delaying the hydrate nucleation time. The adopted models could predict the methane hydrate induction time and rate of hydrate formation in an acceptable range with an APE of less than 6%. The findings in this study are useful for safely transporting hydrocarbons in multiphase oil systems with fewer hydrate plug threats.

1. Introduction

Gas hydrates are crystalline inclusion compounds that consist of small guest molecules encapsulated in hydrogen-bonded water cages under suitable thermodynamic conditions [1]. The guest molecules are typically gases such as methane, ethane, and CO2, or liquids such as tetrahydrofuran and cyclopentane [2]. The packing of the guest to the cage size ratio of gas hydrates determines its crystalline structure either in a cubic structure I, cubic structure II, or a hexagonal hydrate structure [3], as shown in Figure 1.
Gas hydrate formation is a promising technology for gas separation and transportation, water desalination, and refrigeration [4,5,6,7]. However, the formation of gas hydrates in pipelines is one of the major flow assurance problems in the oil and gas industry. Gas hydrate formation may block the production facilities and eventually hinder natural gas production [8,9]. The progressive field development of oil and gas explorations into deep water exposes production pipelines to hostile operating environments, which are prone to gas hydrate formation. In oil-dominated systems, the oil phase complicates hydrates’ plug formation in pipelines, hence the need to prevent such hydrate plugs for safe production. This necessitates investigations to understand the role of inhibitors in order to prevent gas hydrate formation in gas/oil/water systems.
To prevent and manage hydrate formation, four methods, namely, heating, dehydration, chemical injection, and depressurization, can be used. However, due to its economic and technical feasibility, chemical injection is extensively used. The chemical additives for hydrate inhibition are classified into two main groups, namely, thermodynamic hydrate inhibitors (THIs) and low-dosage hydrate inhibitors (LDHIs). The LDHIs are further divided into kinetic hydrate inhibitors (KHIs) and anti-agglomerates (AAs). THIs such as methanol and glycol shift the hydrate–liquid–vapor curve (HLVE) to a lower temperature and a higher pressure zone [1,10]. THIs have some disadvantages related to their volatility, environmental issues, and economical concerns since their use in high concentrations (~50 wt.%) is needed for them to be effective. Therefore, LDHIs were introduced to retard the onset of hydrate formation by delaying the nucleation (KHIs) or preventing the agglomeration of formed small hydrate crystals (AAs). LDHIs are used at low concentrations (0.1–2 wt.%) such as in polyvinylpyrrolidone (PVP), polyvinyl caprolactam (PVCap), and cationic surfactants.
Surfactants are surface-active substances that play a crucial and diverse role in gas hydrate-related applications. Cationic surfactants such as cetyltrimethylammonium bromide (CTAB) can act as effective anti-agglomerates due to their ability to prevent the agglomeration of the hydrate crystals into bigger particles [11]. These surfactants adsorb onto the hydrate crystals’ surface to keep them suspended in a transportable slurry [12]. Contrarily, anionic surfactants such as sodium dodecyl sulfate (SDS) promote hydrate formation by reducing the adhesive forces between hydrate crystals allowing for a larger mass and faster hydrate growth [13]. Non-ionic surfactants such as Span and Tween are used as emulsifiers for many applications. They offer many advantages over ionic surfactants including increased stability, formulating flexibility, and biodegradability. Additionally, being non-ionic, these surfactants are widely compatible and stable in many fluid systems including freshwater, saline water, mild acids, and alkaline, and do not react with ionic compounds and charged substances [14]. These benefits of non-ionic surfactants have encouraged their potential application in hydrate-related studies.
Ganji et al. [15] studied the effects of different surfactants on the methane hydrate formation rate, stability, and storage capacity. The study revealed that the presence of surfactants reduces the gas storage capacity less than the maximum theoretical value for the Structure I hydrate. This implies that surfactants act as anti-agglomerates by preventing hydrate crystals from agglomerating [15]. Pan et al. [16] claimed that Span and Tween series can affect the methane gas hydrate in an emulsion system of 40% water and 60% diesel. The surfactants under study were Span-20, Span-80, Tween-20, and Tween-80. The results show that the surfactants promoted the growth of hydrates in diesel emulsion systems, shortening the hydrate reaction time while improving the gas storage density. In 2003, Sun et al. [17] studied the effect of SDS and a non-ionic surfactant, dodecyl polysaccharide glycoside (DPG), on the methane gas hydrate formation rate and storage capacity. DPG could increase the methane hydrate formation rate and improve the gas storage capacity (79 volume gas/volume hydrate). However, the effect of SDS in this context is still superior compared to DPG (146 volume gas/volume hydrate). The study also concluded that the induction time of hydrate formation is accelerated with the presence of cyclopentane (CP) but the hydrate storage capacity is reduced. According to Zhang et al. [18] in 2008, Tween surfactants have a great promotive effect on the hydrate formation rate because the surfactants can facilitate the dissolving of the gas molecules in the aqueous phase, enhancing the mass transfer of the gas molecules from a bulk phase to form a hydrate. The dissolution of gas is more profound when the surfactant concentration exceeds the critical micelle concentration in the system.
It can be concluded from the reviewed literature that most of the surfactant applications on hydrates are focused on kinetic-promotive effects and anti-agglomerate abilities. This implies that these surfactants could work as inhibitors or promoters depending on the aim of the application and the concentrations at which they are used. Aside the hydrate-promotive and anti-agglomeration tests of surfactants, their KHI potentials are rarely reported in multiphase systems. In addition, the hydrate formation behavior modeling in the presence of surfactants in multiphase systems is underreported and needs to be evaluated to provide data for correctively mitigating hydrate plugs in process flow assurance facilities.
In this work, the effect of six nonionic surfactants operating as kinetic methane hydrate inhibitors was studied in a multiphase system (gas + water + oil) using a non-hydrate former drilling fluid-based oil to represent the oil phase. The induction time, rate of gas consumption, and amount of gas consumed were measured. The effects of the temperature and inhibitor load were studied. A new modelling study was conducted to predict the induction time of hydrate formation in multiphase systems using the classical nucleation theory. Additionally, an empirical correlation was developed based on Englezos’ model to predict the rate of hydrate formation. The model considered the variation in the inhibitor concentration and the operating temperature.

2. Materials and Methods

2.1. Material

The nonionic surfactants used in this study were Tween-20, Tween-40, Tween-80, Span-20, Span-40, and Span-80. The surfactants were purchased from Sigma Aldrich and used without further purification. The details of the chemicals including the HLB (hydrophilic–hydrophobic balance) and purities of the surfactants are summarized in Table 1.
Drilling fluid base oil (MG3), supplied by PETRONAS Sdn Bhd, was used to mimic the oil phase in the multiphase flow pipelines. The oil phase composition was selected cautiously to exclude oil compositions that could form hydrates and complicate the data analysis. The deionized water used to prepare the samples was obtained from Ultra-Pure Water System. The surfactant concentrations in the sample ranged from 1.0–3.0% (v/v) in the water phase (or oil phase).

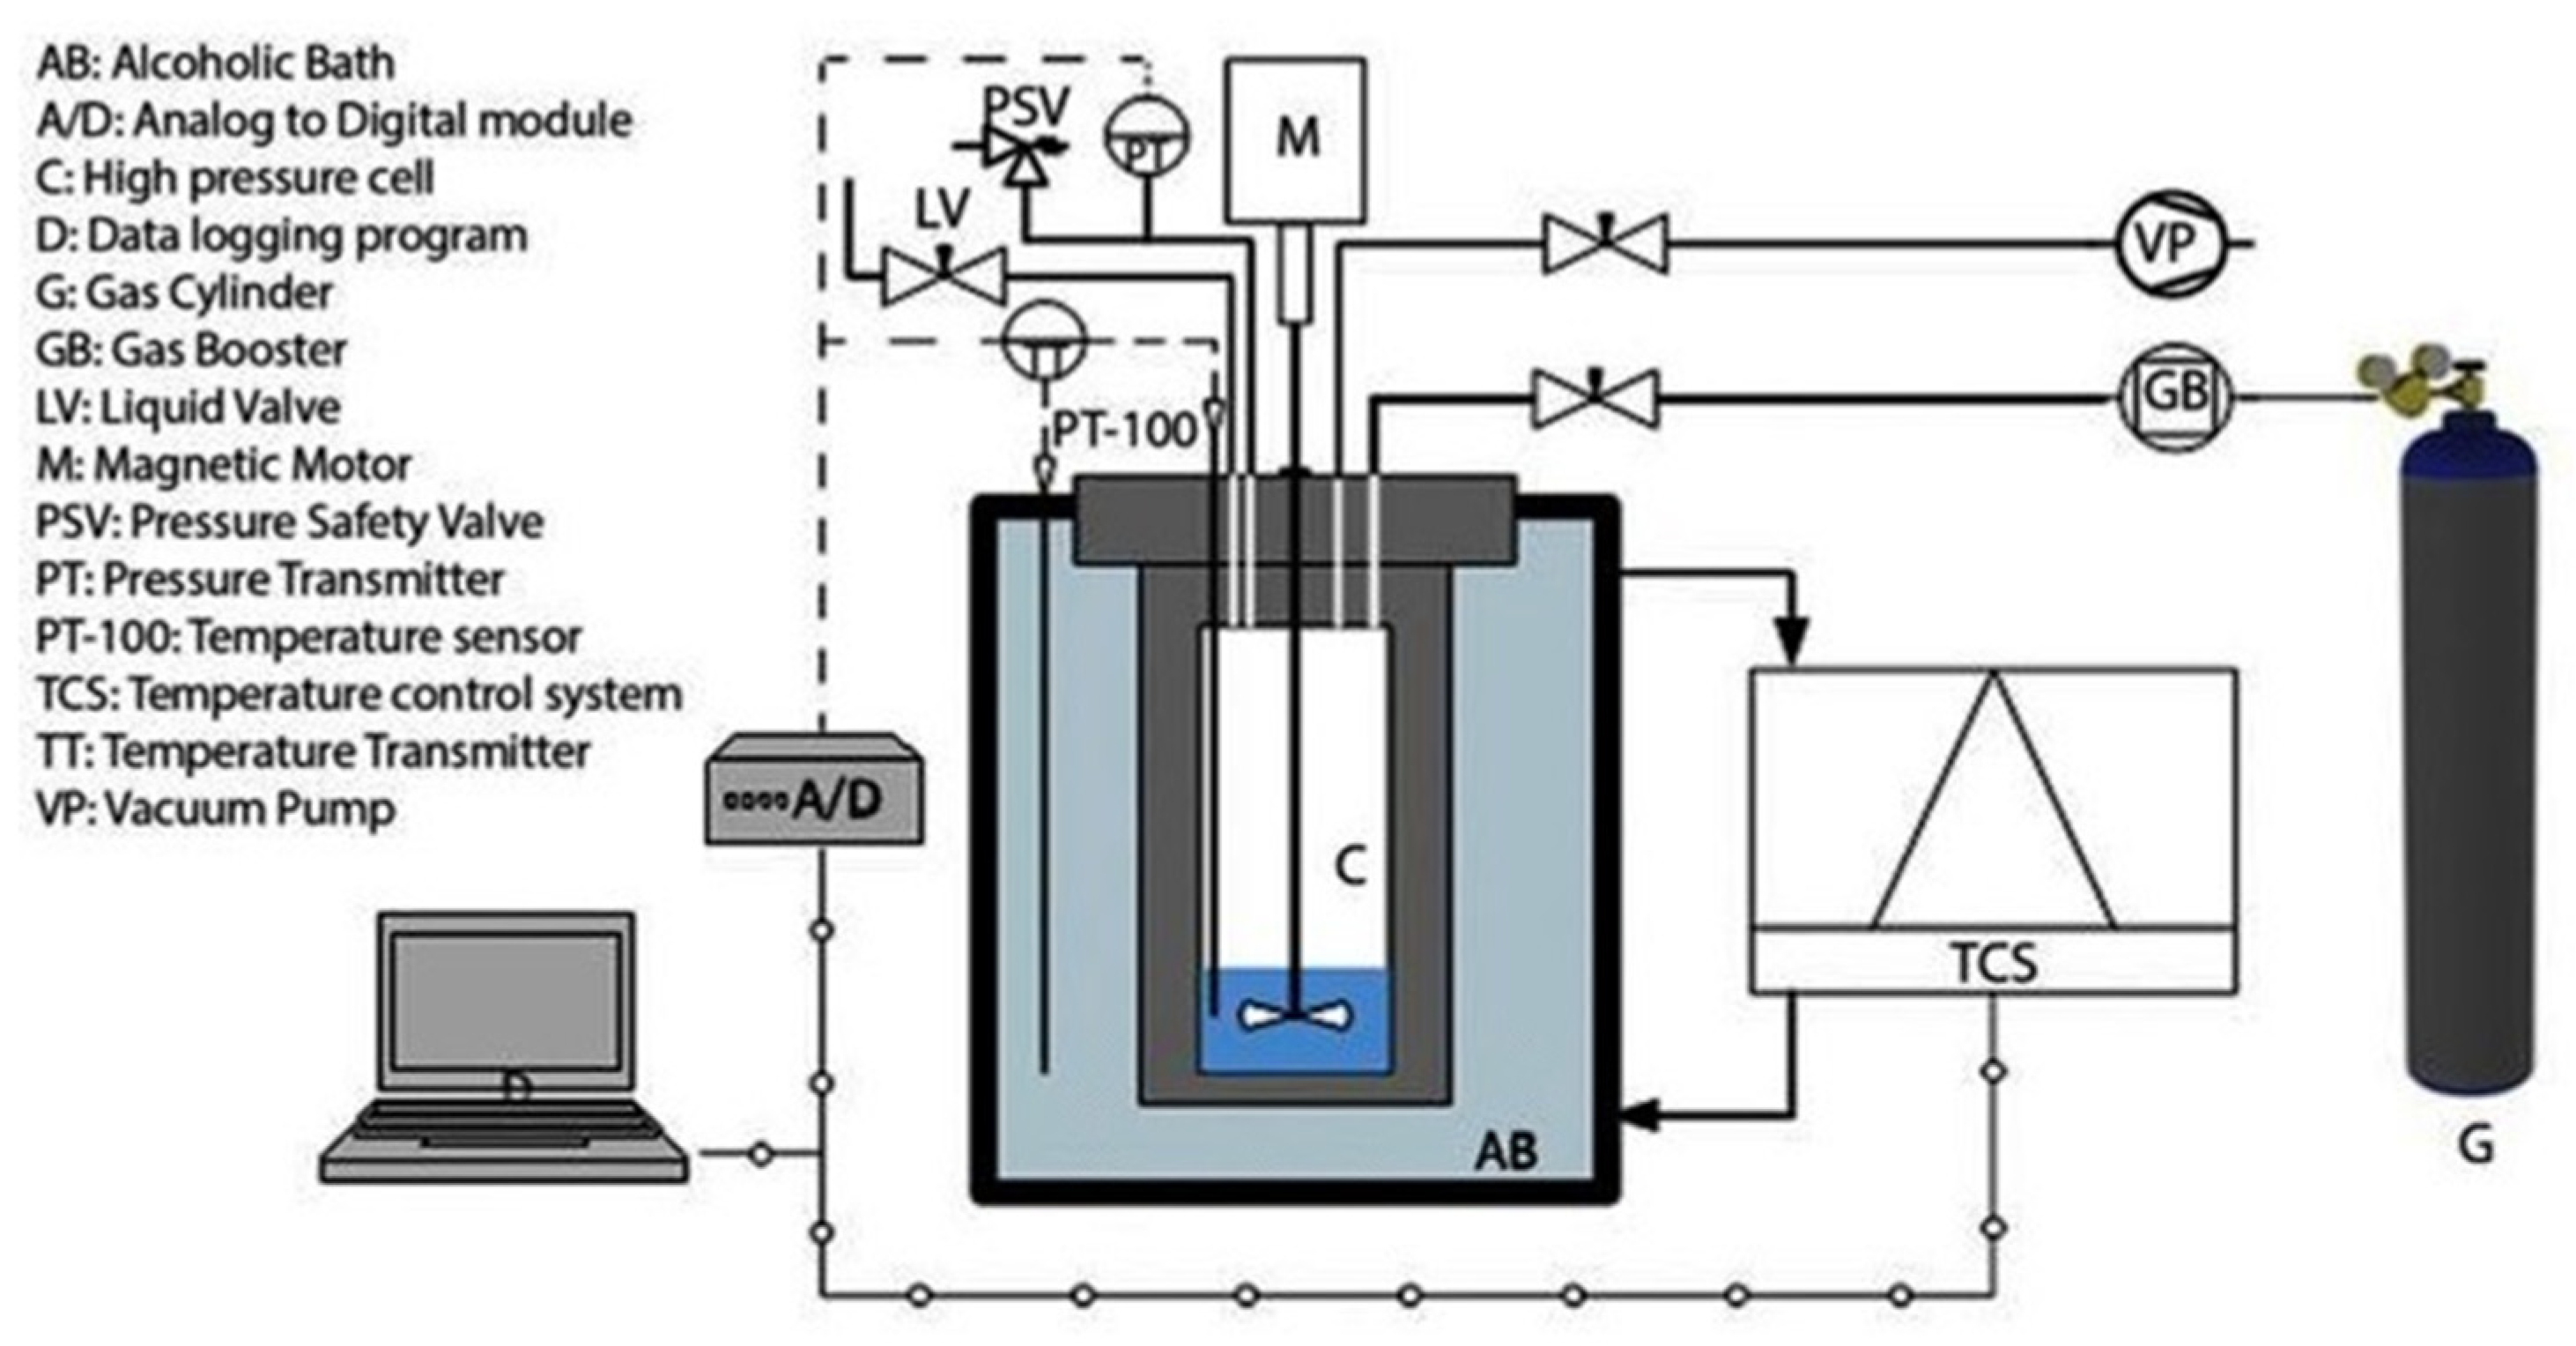
2.2. Experimental Apparatus and Procedure

A 650 mL high-pressure stainless-steel stirred tank reactor (STR) (Figure 2) was used to conduct the experiments in this work. The reactor was designed with thermocouples with an accuracy of ±0.5 K to measure the temperatures from 253.15 K–523.15 K and pressure up to 20 MPa. More details on the experimental setup can be found in our previous work [19].
The desired amount of surfactant was added to a 1:1 mixture of oil and distilled water at 298.15 K. The mixture was subjected to vigorous magnetic stirring for at least 4 h to prepare the emulsion. To start each experimental test, 100 mL of the desired prepared sample was loaded into the reactor; then, the system was placed on the vacuum to remove any excess air inside of the reactor. After purging the system, the methane hydrate phase behavior and kinetic-testing procedures were used to evaluate the systems.

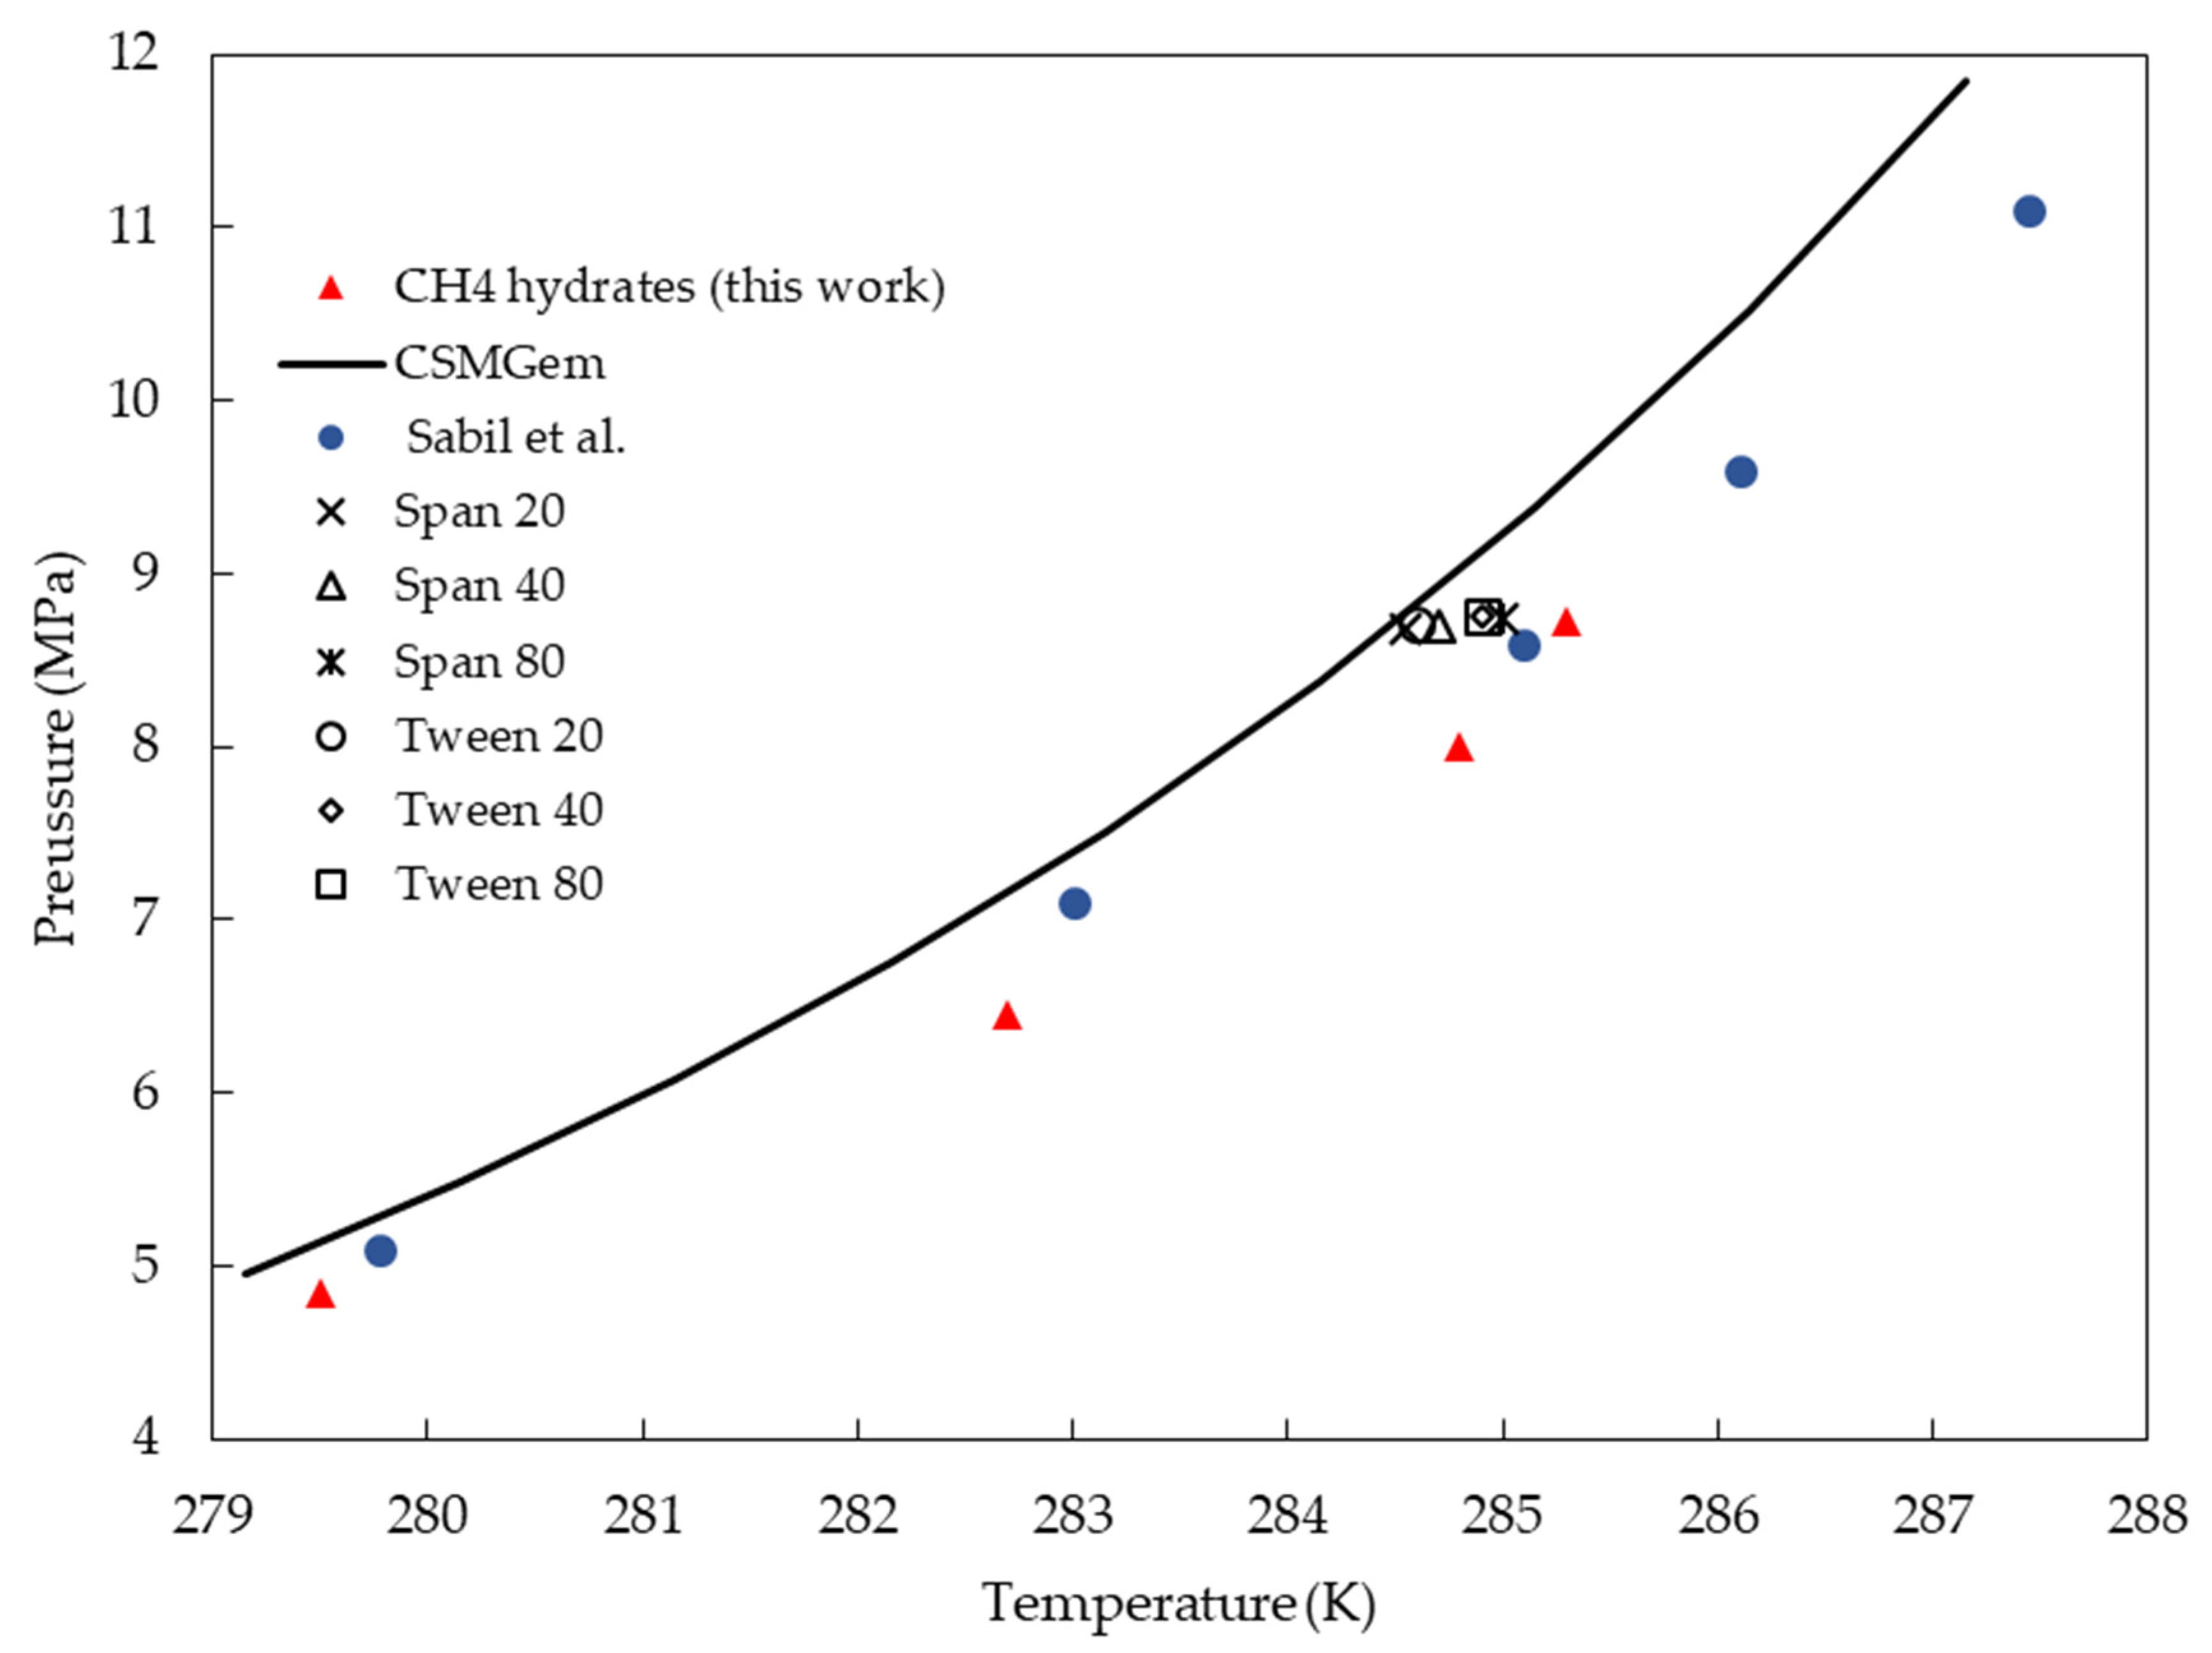
2.2.1. Methane Hydrate Phase Equilibrium Measurement

The hydrate dissociation temperature as an equilibrium point was measured using the T-cycle method at 8.80 MPa. The measurements were initiated by reducing the system’s temperature to 271.15 K and maintaining said temperature to allow hydrate formation to occur. After the hydrates were formed, a stepwise heating method was applied at a heating rate of 0.25 K/h to determine dissociation conditions. A slow heating rate was used to accurately detect the hydrate dissociation temperature.

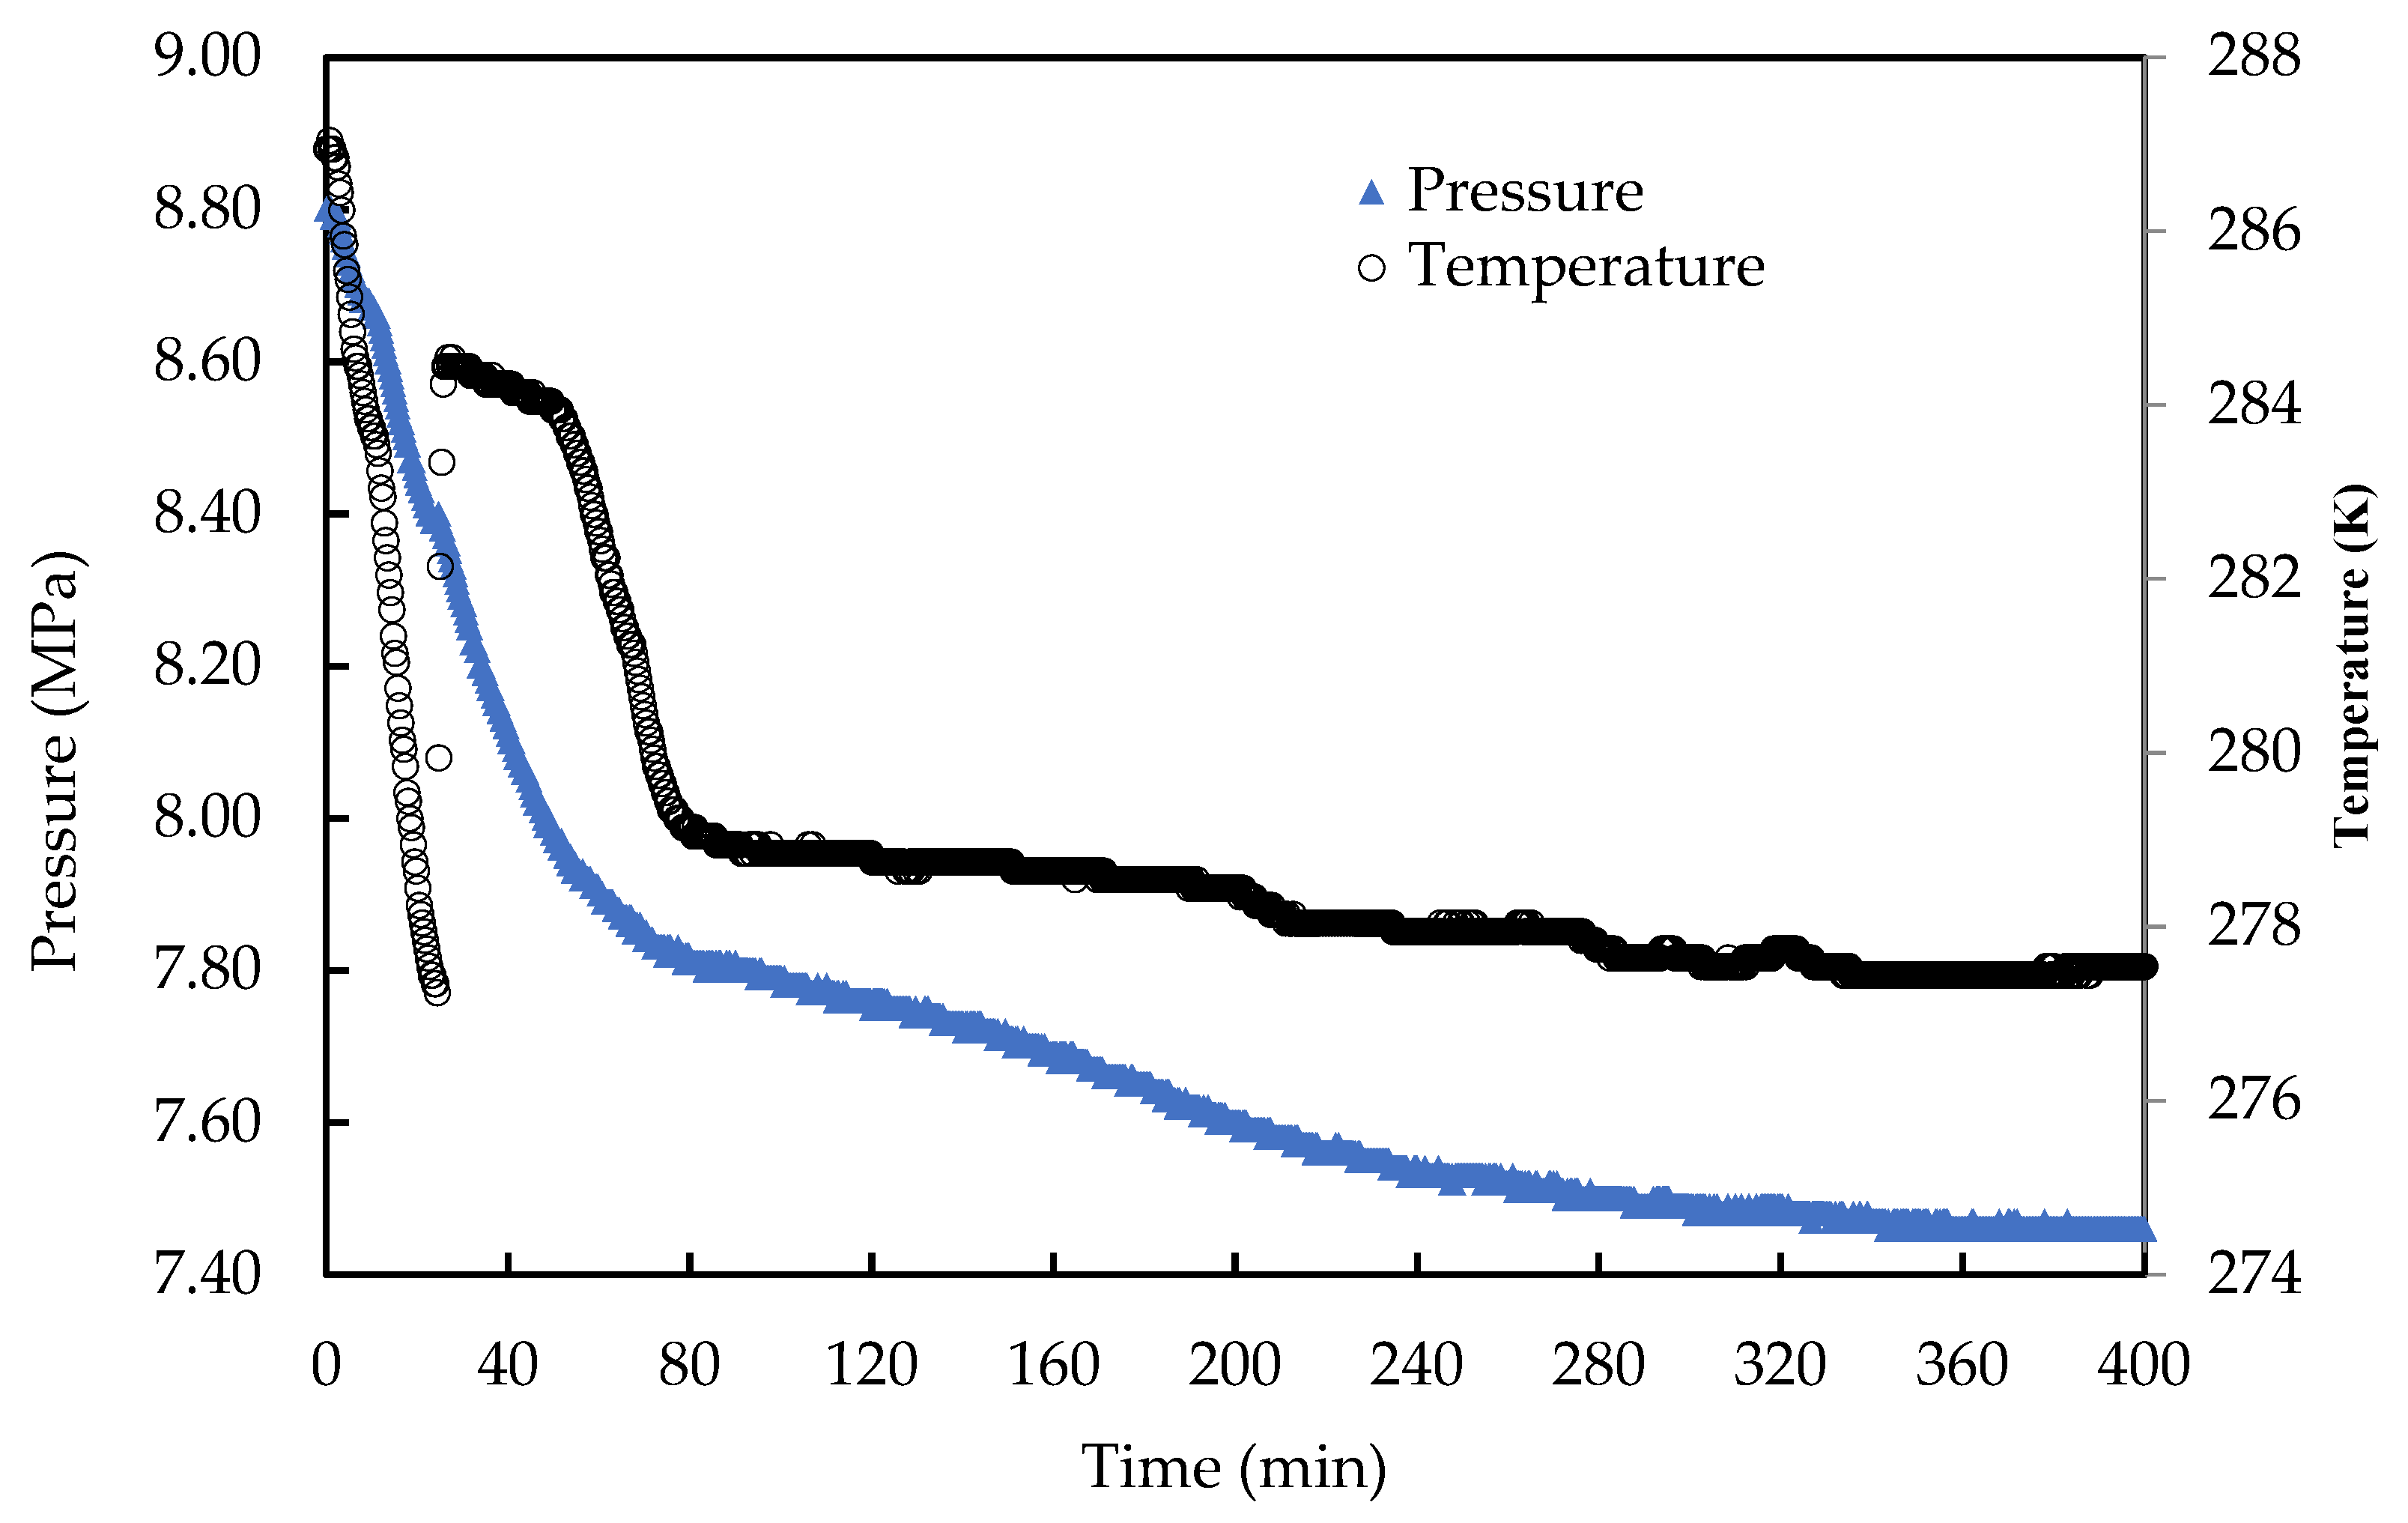
2.2.2. Kinetics of Methane Hydrate Formation

For the kinetic experiments, the reactor was cooled down to the initial temperature of 287.15 K, which is about 2 K higher than the hydrate equilibrium temperature. Methane was then compressed into the reactor up to equilibrate at 8.8 MPa with the stirrer turned on. The system was then cooled to the desired temperature (274.15–277.15 K) with continuous stirring at 600 rpm during the cooling period. This was performed to initiate the hydrate formation process. The hydrate formation was indicated by a sudden pressure drop and temperature increase in the reactor. When the system attained a constant pressure for 2 to 3 h, the hydrate formation was completed and the experiment was terminated. The changes in pressure and temperature of the system were recorded constantly every 10 s using a data acquisition system.

2.3. Calculation of the Kinetic Parameters

2.3.1. Induction Time

The induction time of the CH4 hydrate formation in the multiphase systems was determined as the time taken to detect the onset of hydrate crystal formation. In practice, the measurement of the hydrate formation process is very stochastic even under the same conditions. Therefore, all experiments in this study were repeated at least three times to obtain the mean value for reporting purposes. This was detected at the point when a sudden pressure drop and temperature increase were observed during the experiment. The induction time is always compared to a reference sample, which is the chemical-free sample. In the event of a surfactant increasing the induction time, it acts as an inhibitor, whereas when it is decreased, it is considered a promoter. To evaluate the performance of different surfactants, Relative Inhibition Power (RIP) was calculated according to Equation (1) [20]. The positive value indicates an inhibitive behavior while a negative value indicates that the surfactant is behaving as a hydrate promoter.
RIP = ( induction   time   with   surfactant induction   time   without   surfactant ) induction   time   without   surfactant

2.3.2. Amount of CH4 Consumption and Gas Uptake

The amount of CH4 consumed to achieve the maximum degree of hydrate formation is an important parameter to elevate gas hydrate technology to the industrial scale. The gas consumption in this work was calculated using Equation (2). It is assumed that there were no water volume changes during hydrate formation.
Δ n g = V R [ ( P Z T ) 0 ( P Z T ) t ]
where P and T are the system pressure and temperature, respectively; V is the gas phase volume; R is the universal gas constant; Z is the compressibility factor, which is calculated using the Peng–Robinson Equation of State; subscript 0 stands for the start time of the experiment; and t stands for the conditions at time t.

2.3.3. Initial Rate of the CH4 Consumption

The initial rate of gas consumption is the main parameter for gas hydrate applications. It represents the rate of CH4 hydrate formation, and was calculated as in Equation (3):
r ( t ) = n i i 1 n i i + 1 t i 1 t i + 1  
where n i i 1 and n i i + 1 are the mole numbers of gas in the gas phase at time intervals t i 1 and t i + 1 , respectively.

2.3.4. Water to Hydrate Conversion

The fraction of the mole number of water molecules in the hydrates phase per mole of the initial solution is called water to hydrate conversion, and was calculated using Equation (4):
C o n v e r s i o n = M × Δ n g n w 0  

2.4. Kinetics Models Theories

Modeling the hydrate formation’s nucleation time and formation rate in a multiphase system provides the necessary information for field engineers to efficiently detect any risk of the formation of a hydrate plug. It also allows for the initiation of appropriate actions to mitigate hydrate plug formation in such systems. In this study, the classical nucleation theory and the Englezos rate model [21] were used to describe the hydrates’ onset time and the formation rate behavior of the studied systems.

Classical Nucleation Theory (CNT) for Induction Time Prediction

Generally, hydrate formation occurs in two steps: nucleation and growth. The induction time represents the nucleation time and can be predicted if the nucleation rate is known. The nucleation rate, J, is referred to as the number of nuclei formed per unit volume and time (m−3·s−1) and can be quantitatively predicted by the classical nucleation theory. The nucleation rate in the classical nucleation theory is generally expressed by the following equation (Equation (5)) [22]:
J = N s Z j e x p ( Δ G * k T )  
where Ns is the number of nucleation sites, Z is the Zeldovich factor, j is the rate of molecules attaching to the nucleus, ΔG* is the Gibbs free energy barrier for the formation of a hydrate’s critical nucleus size, k is the Boltzmann constant (1.380649 × 10⁻²³ J⋅K−1), and T is the absolute temperature in Kelvin. The equation consists of two parts: the first of which is the dynamic part represented by Zj term, which reflects the nucleus growth rate. The second part of the equation Ns exp(−ΔG*/kT) represents the instantaneous number of critical hydrate nuclei reaching the free energy barrier. The Gibbs free energy for nucleation of the spherical nucleus, which involves the volume term and the surface term, is derived from the following expression (Equation (6)) [23]:
Δ G * = 16 π 3 ( v k T l n ( S ) ) 2 σ 3  
where υ is the molecular volume, S is level of supersaturation, and σ is the surface tension between the solid and liquid phases (0.026) [24].
To improve the induction time prediction via CNT, special attention must be paid to the S value. S is the ratio between P and P0; however, it was reported that S is more dependent on the final pressure P0 than the experimental pressure at a given time P. Since P0 is mainly affected by subcooling temperature and the presence of surfactants, a set of experiments was performed at four different temperatures (274.15–277.15 K) at the experimental pressure of 8.80 MPa. The P0 values for each tested system were measured and correlated with temperature. A linear correlation was found with R2 value of 0.9854, and it can be expressed through the following first-order equation (Equation (7)):
P 0 = 0.02250   T + 1.27163  
where T is the experimental temperature. Equation (7) was optimized for each system and used to determine S in Equation (6). The nucleation rate was then estimated by substituting the resulting parameters in Equation (5). Importantly, since the oil used in this work does not participate in hydrate formations, its effect on the hydrate nucleation and formation rate was neglected in the models.

2.5. Prediction of Rate of Hydrate formation

The model proposed by Englezos et al. [21] for the kinetics of methane and ethane hydrates was adopted in this study to predict the methane hydrate formation rate in the oil system. The model is based on the theories of crystallization and mass transfer at a gas–liquid interface. In this model, the driving force for hydrate formation is defined as the difference between the fugacity of the dissolved gas (at operating temperature and pressure) and the equilibrium fugacity at the experimental temperature and at equilibrium pressure. The growth rate for a hydrate particle with an interfacial area Ap is expressed in Equation (8):
( d n d t ) = K A p ( f f e q )  
where n represents the moles of gas consumed in hydrate formation and K is the rate constant that accounts for resistances associated and can be calculated using Equation (9)
1 K = 1 k r + 1 k d  
where kr is the intrinsic rate constant for hydrate particle growth reaction and kd is the mass transfer coefficient around the particle. The rate of growth per particle is expressed by Equation (10):
r = ( d n d t ) = K a p p ( f g f e q )  
where Kapp is the apparent rate constant that incorporates the interfacial area. The initial rate of hydrate formation for each of the surfactant concentrations was calculated from the slope of a chart plotting for mole gas consumed vs. time. Subsequently, the apparent rate constant, Kapp, was generated by multiplying the experimental rate, Kexp, with fugacity difference at each interval. Next, the average of the gas rate constant, Kaver, was calculated by averaging each Kapp at the respective interval. Using the Kaver, an empirical equation was developed using MATLAB to correlate the rate of hydrate formation with temperature and concentration. The generated empirical equation has a fast and reliable mathematical formula to interpolate between experimental points.
The modified Englezos model was established to represent the CH4 hydration formation rate with the tested systems after deriving an empirical correlation from the rate constant, concentration, and temperature, as shown in Equation (11):
r = d n d t = ( a 0 a 1 C a 2 T ) ( f g f e q )  
where a0, a1, and a2 are the correlation coefficients.
The absolute percentage error APE% of the predictions was calculated to evaluate the accuracy of the model using Equation (12):
A P E % =   | r p r e r e x p | r e x p × 100
where rexp and rpre are the experimental and predicted gas formation rate.

3. Results

3.1. Hydrate Phase Equilibrium

The hydrate phase behavior effect of any chemical is a prerequisite to its potential application in oil and gas production and delivery systems. The methane phase behavior impact by the nonionic surfactants in this study was tested in the pressure range of 4.85–8.73 MPa. This range of pressure was chosen to include the pressure used for kinetic experiments, taking into account economic aspects and the avoidance of high pressures. In addition, a blank sample (deionized water) was also tested to compare and evaluate the phase behavior effect of the surfactants on methane hydrates. In addition, the blank sample result was compared with the predictions of the CSMGem software and the literature data to check the reliability and validity of the equipment and method. The CSMGem software works based on the incorporation of the new hydrate and aqueous phase models into a multi-phase Gibbs energy minimization model. The results accorded well with the predicted and literature data as illustrated in Figure 3. Figure 3 presents the phase behavior of the surfactants at 2.0% (v/v) in 50% water cut at 8.70 MPa (approximately similar to the kinetics testing experimental pressure). The results revealed that the nonionic surfactants have a negligible effect on the methane hydrate phase boundary condition. The findings agree with the literature, where surfactants are mostly known to have a negligible effect on the hydrate phase boundary condition [25,26].
The results further indicate that the molecular size and chemical structure of the surfactants slightly disrupt the activity of water in the hydrate formation region [28]. In addition, as it is well known that changing the type of guest molecules and hydrate structure results in a significant change in phase boundaries, it was concluded that the studied surfactants do not participate or occupy water cavities or alter the methane hydrate structure. Moreover, the low miscibility concentration of SPAN nonionic surfactant in the water phase further accounts for their negligible impact on the methane hydrate phase boundaries conditions. The results in Figure 3 further confirm that the oil in the systems does not participate in hydrate formation in any form.

3.2. Kinetics of the Methane Hydrate Formation

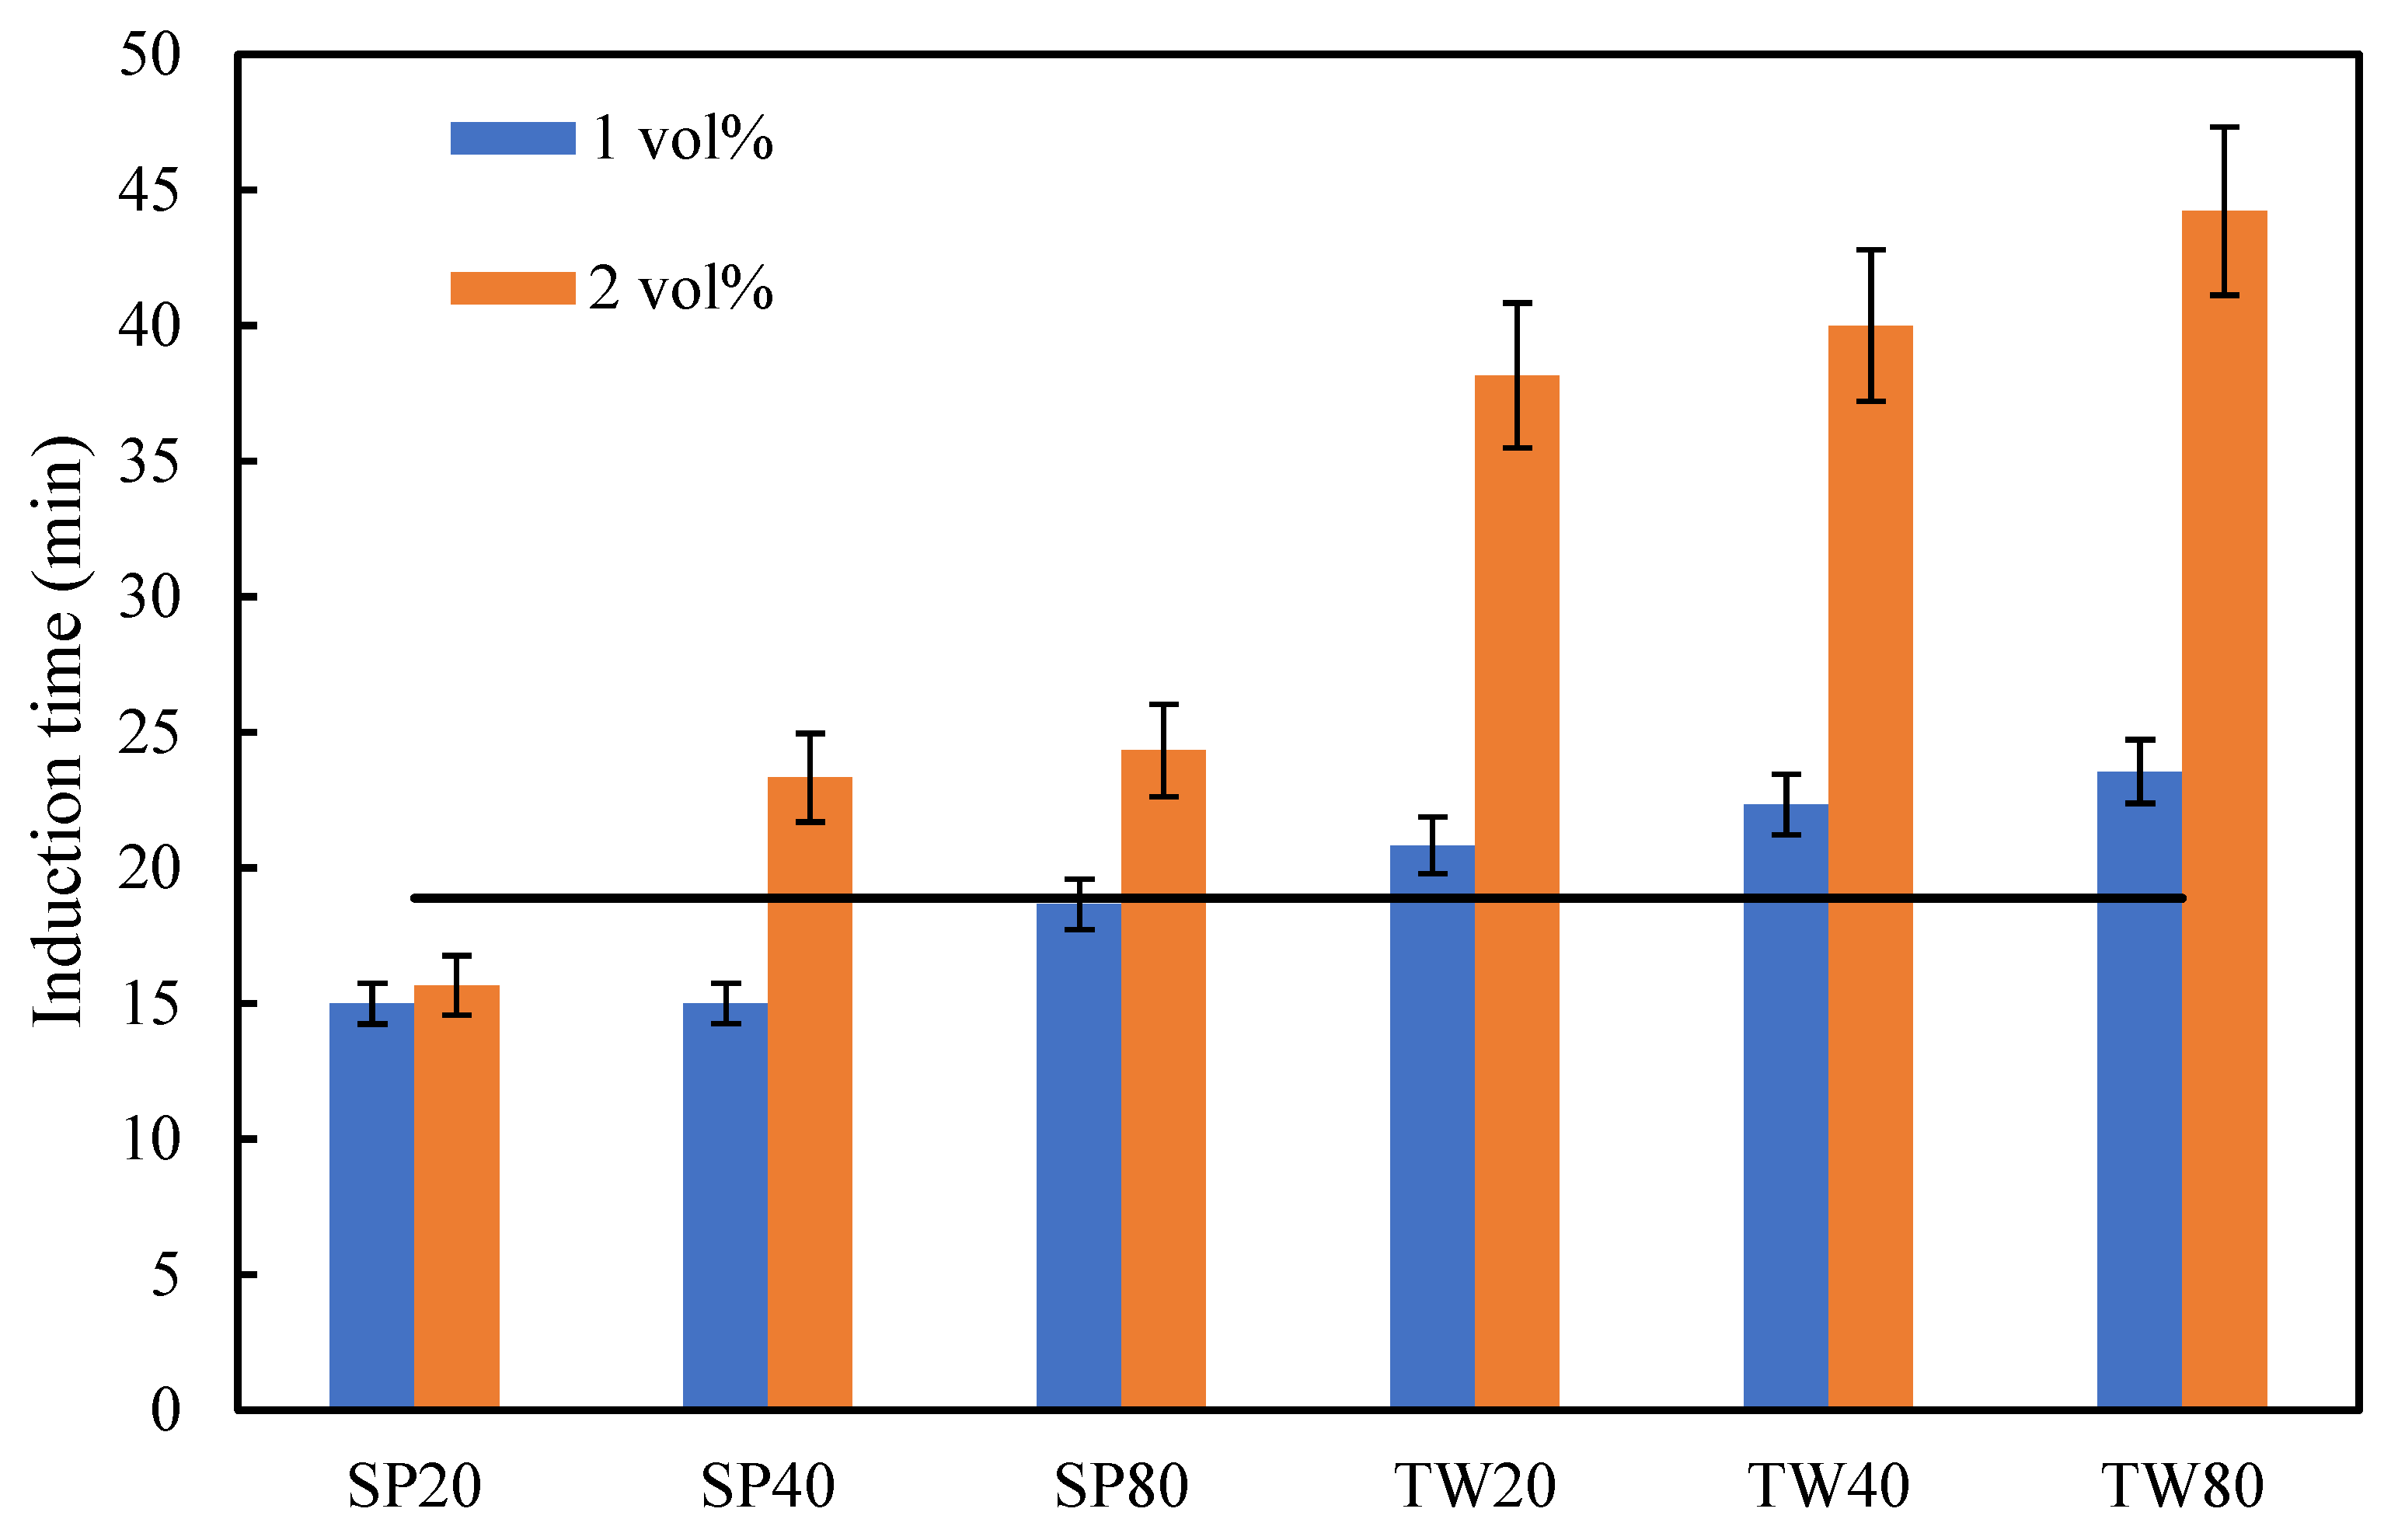
3.2.1. Induction Time Measurement

The induction times of methane hydrate formations are detected when the pressure drops drastically following an increase in temperature due to the exothermic nature of hydrate crystallization. However, in this work, a unique and distinctive temperature peak was observed as the temperature increased to a much higher magnitude compared to the conventional temperature profile, as shown in Figure 4. This phenomenon could be attributed to the low heat capacity of oil compared the to pure water system.
It can be observed from Figure 5 that apart from the Span-20, all the surfactants recorded higher induction times at a 2% (v/v) concentration compared to the blank sample. In addition, the Tween series prolonged the induction times in both 1% (v/v) and 2% (v/v). However, only Span-40 and Span-80 acted as kinetic hydrate inhibitors at higher concentrations at 2% (v/v). In other words, Span-20 promotes the rate of formation of CH4 gas hydrates at all concentrations. Similarly, Span-40 and Span-80 are kinetic promoters at 1% (v/v).
The promotional effect at lower concentrations may be attributed to the reduction in surface tension. Span is able to reduce the surface tension more than Tweens as reported in [29]. To be exact, Tweens are ethoxylated Spans. Due to ethoxylation, the Tweens are water-soluble as opposed to the oil-soluble Spans. That is why higher concentrations may interact to a greater extent with water molecules and disturb hydrate formation. The Relative Inhibition Power (RIP) was calculated to evaluate the effectiveness of different surfactants as kinetic methane hydrate inhibitors in multiphase systems. A positive value indicates an inhibitive behavior while a negative value indicates that the surfactant is behaving as a hydrate promoter. Figure 6 reveals that Tween-80 is the most effective inhibitor as it enhances methane inhibition power up to 134%.
In the Tween series surfactant, the ethoxylation of the sorbitan molecule enhances its hydrophilicity so that it preferentially dissolves in water as opposed to dissolving in an oil phase (a non-polar phase). In a water–oil–CH4 multiphase fluid system, the Tween molecules orientate themselves at the fluid interfaces and tend to produce an oil-in-water emulsion system. Some of the CH4 dissolves in the oil phase, which is encapsulated as droplets within the continuous water phase. Consequentially, this limited the availability of the CH4 molecules to be in direct contact with water molecules to form gas hydrates, thereby delaying the induction time. On the contrary, the SPAN series surfactant with a lower HLB value has a tendency to produce a water-in-oil emulsion. The oil, being the continuous phase, allows more CH4 to be dissolved within it, thereby increasing the surface area for the water–CH4 contact to form a gas hydrate, and thus increasing the rate of hydrate formation. When the SPAN concentration increased, excessive SPAN molecules would absorb and form a multilayered structure at the oil–water interface, providing the steric and hindering effect that enabled the CH4 to diffuse across the interface boundary layer to form a hydrate with the encapsulated water droplets

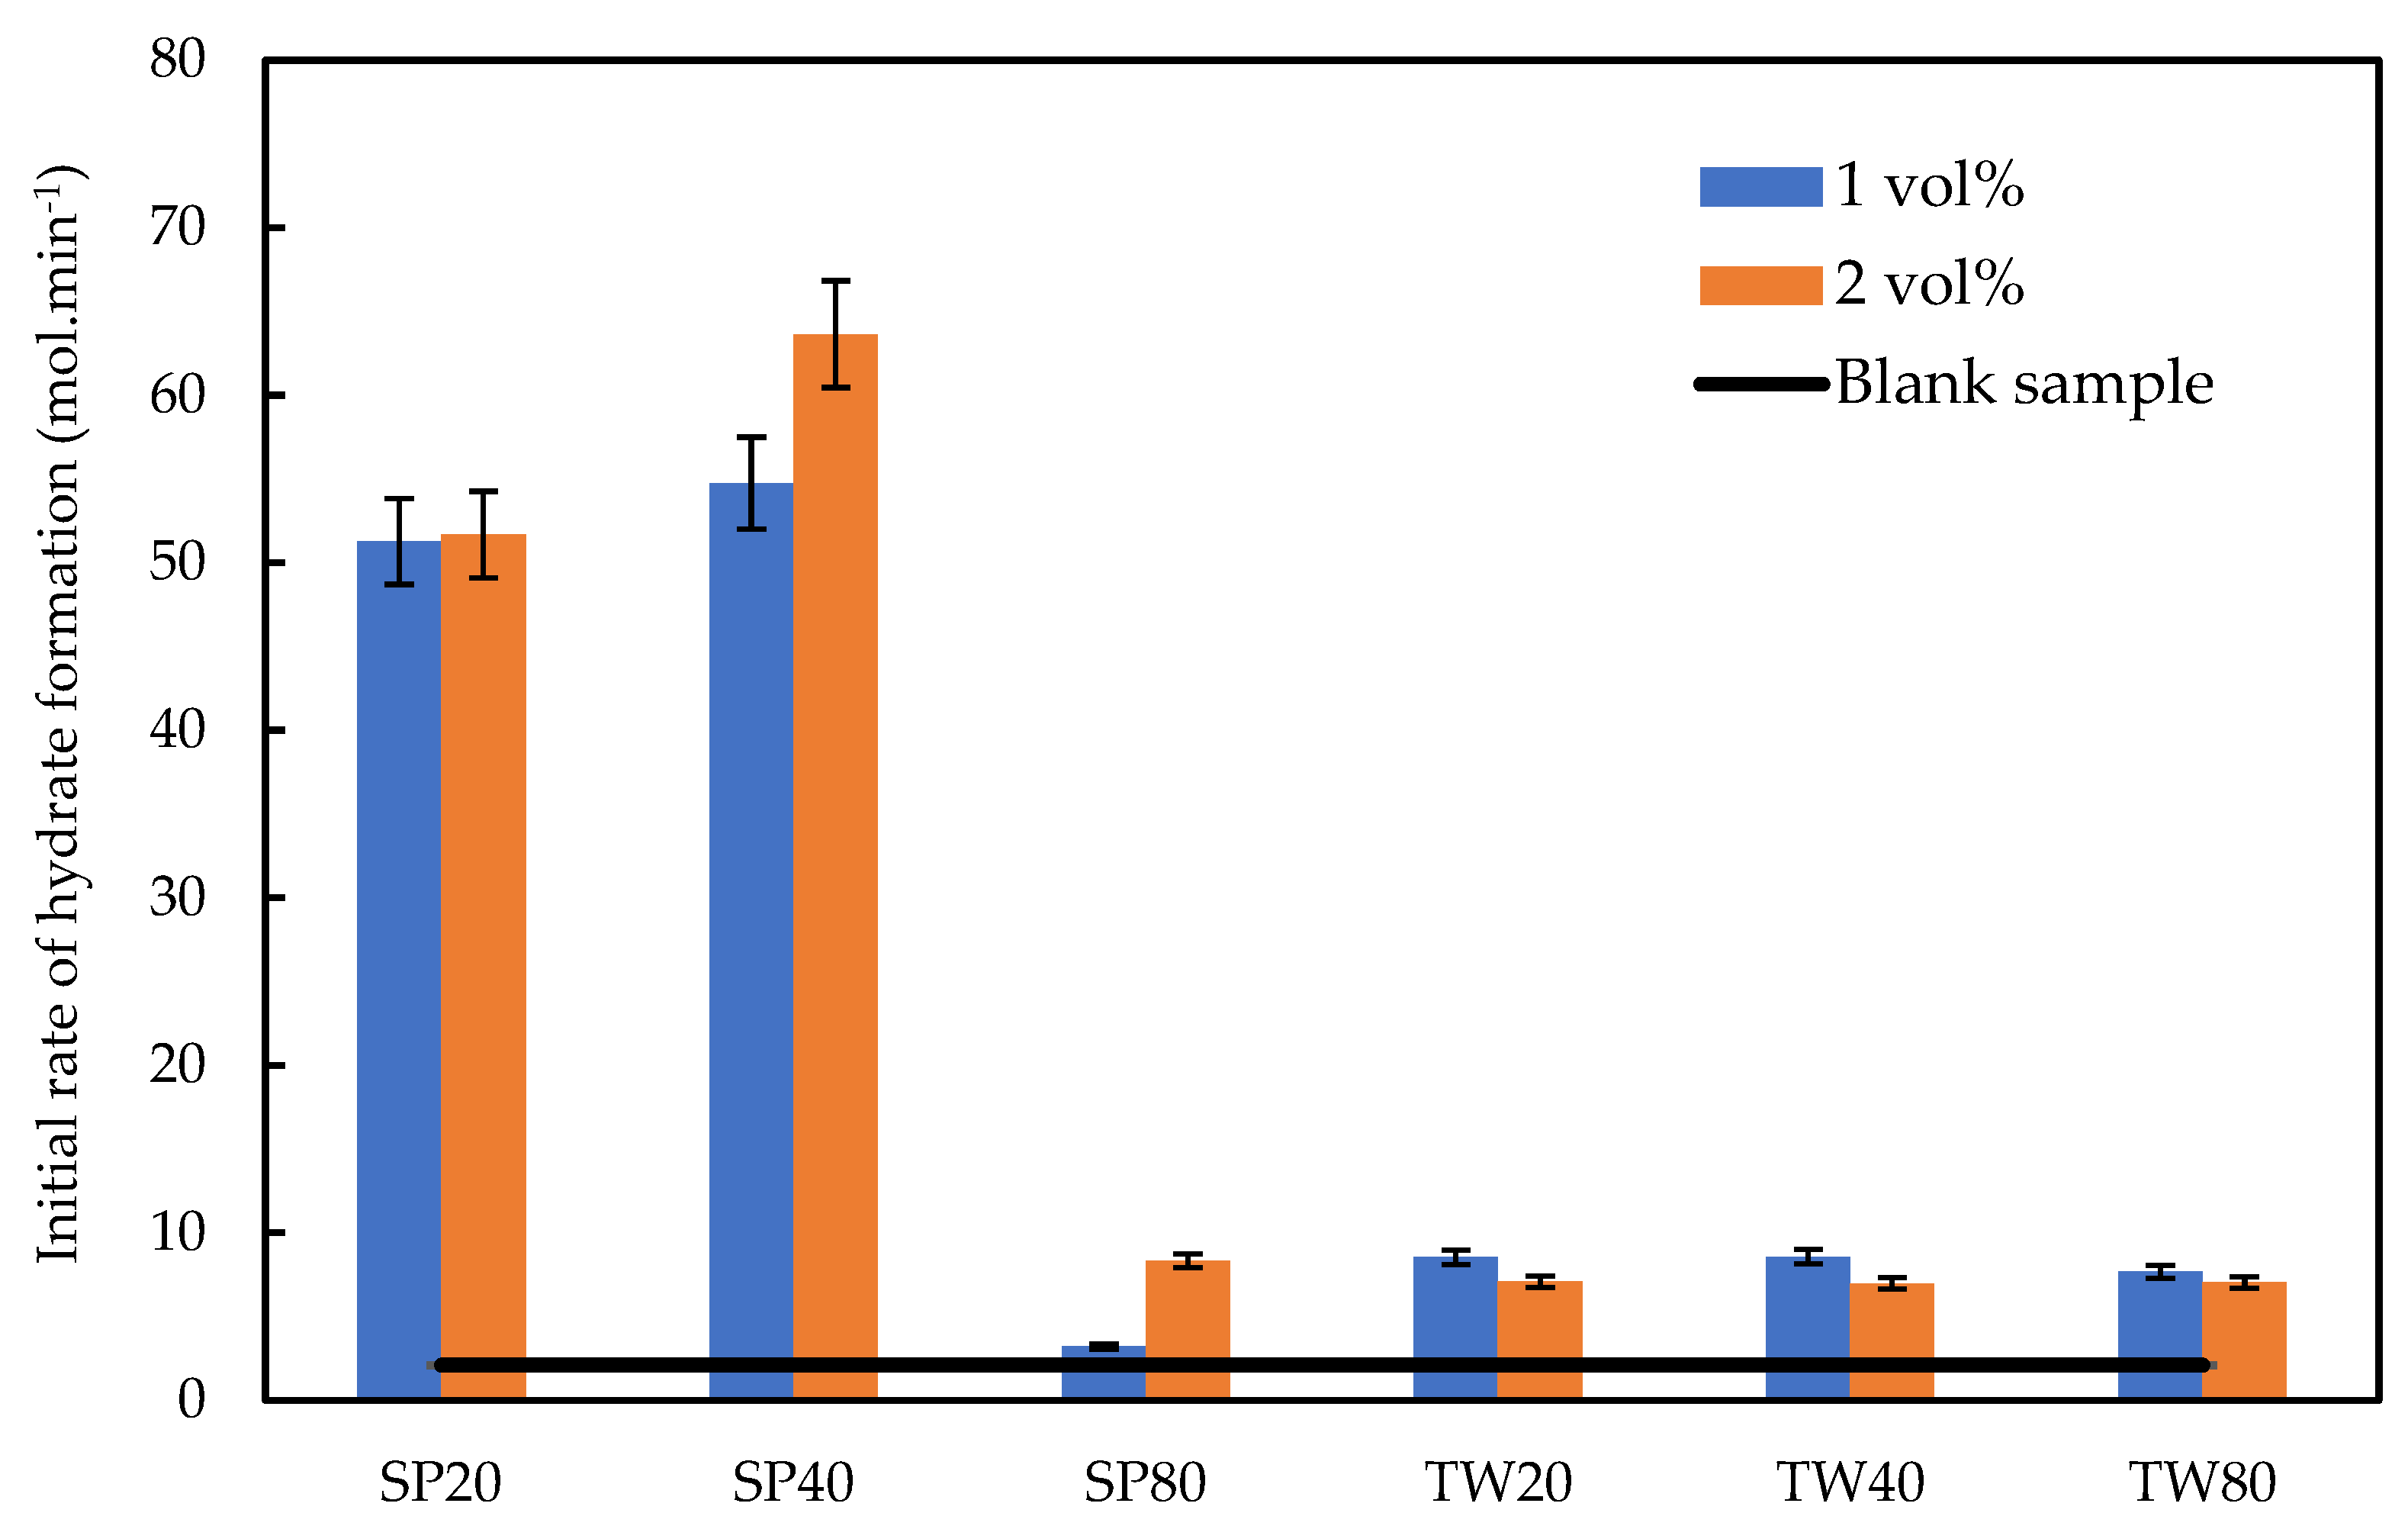
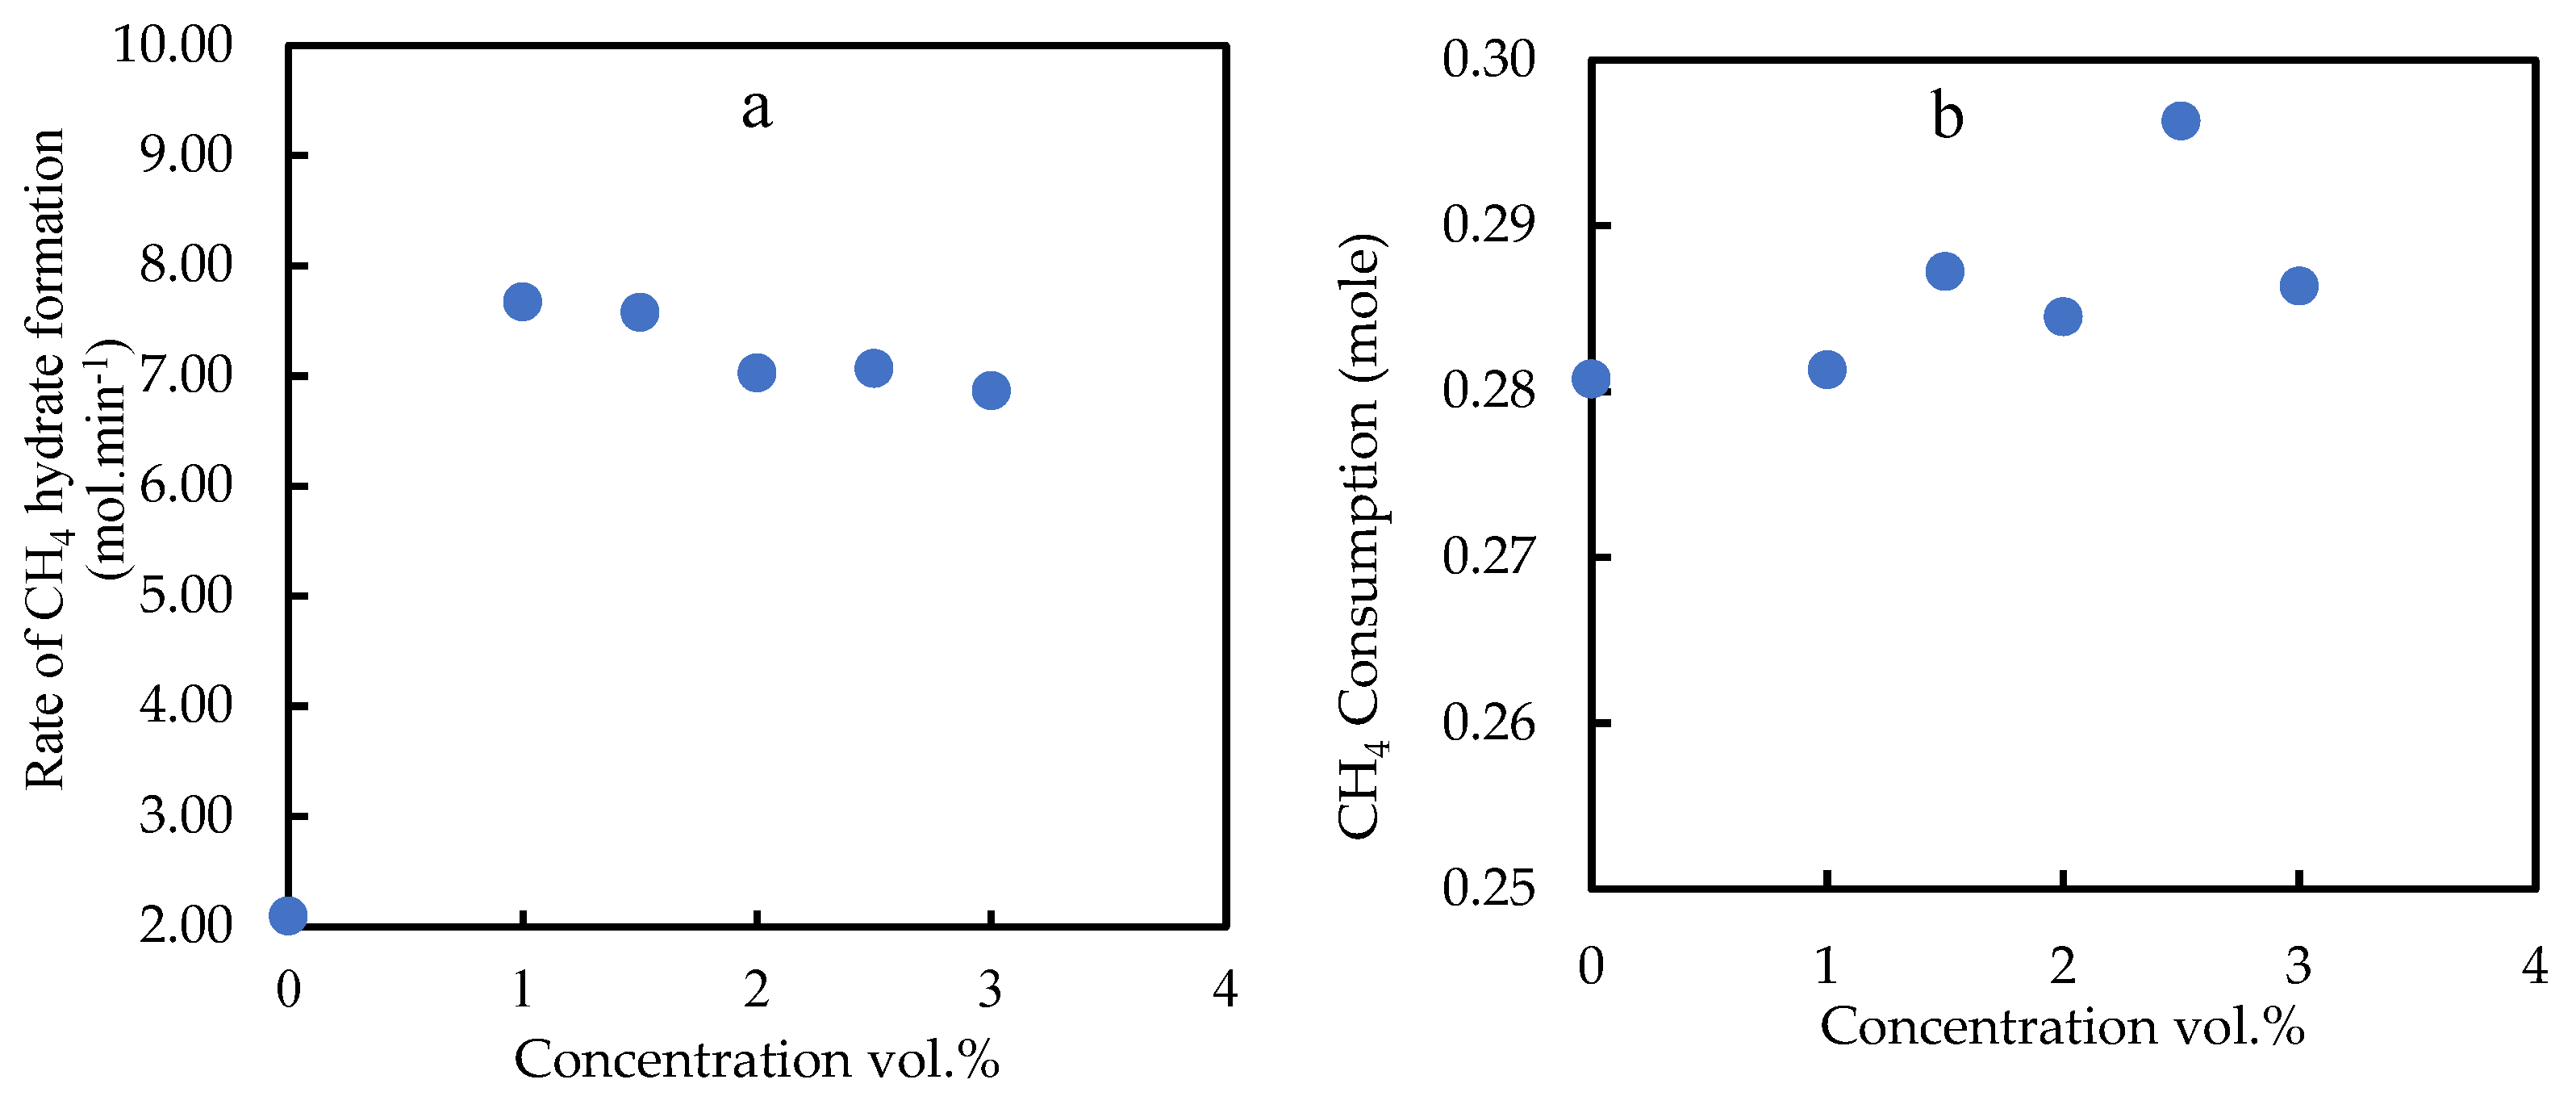
3.2.2. Initial Rate of the Gas Hydrate Consumption

The initial rate of gas hydrate formation is related to the rate of gas being consumed during the initial period of gas hydrate formation. The rate can be inferred from the slope of the plot of gas consumption vs. time.
The experiments were conducted at an initial pressure of 8.80 MPa and a temperature of 277.15 K with concentrations of surfactants 1% (v/v) and 2% (v/v). For comparison, a blank sample composed of a water and oil mixture (1:1) was tested. Figure 7 illustrates the effect of non-ionic surfactants on the rate of CH4 hydrate formation in a multiphase system. The SPAN and Tween surfactants promote the initial rate of gas hydrate formation. However, SPAN-20 and SPAN-40 demonstrate the highest rates of this promotional effect. The initial rates are three times higher than the baseline without any surfactant. In comparison, the initial rates are relatively slower for Span-80, Tween-20, Tween-40, and Tween-80.
The initiate rate is accelerated by the surfactant once the gas hydrate has overcome the gas hydrate nucleation energy, and the hydrate nucleus will continue to increase in size. This is due to the presence of a surfactant, which reduces the interfacial tension and expands the gas–water contact area. As a significant number of methane molecules are available in the system, the hydrate encapsulation process could occur quickly in both types of non-ionic surfactants and accelerate the rate of gas formation. As Span-40 is in a solid form, at a low temperature, it could be separated from the emulsion as a solid phase. Thus, it provided additional nucleation sites and enhanced the hydrate formation rate.

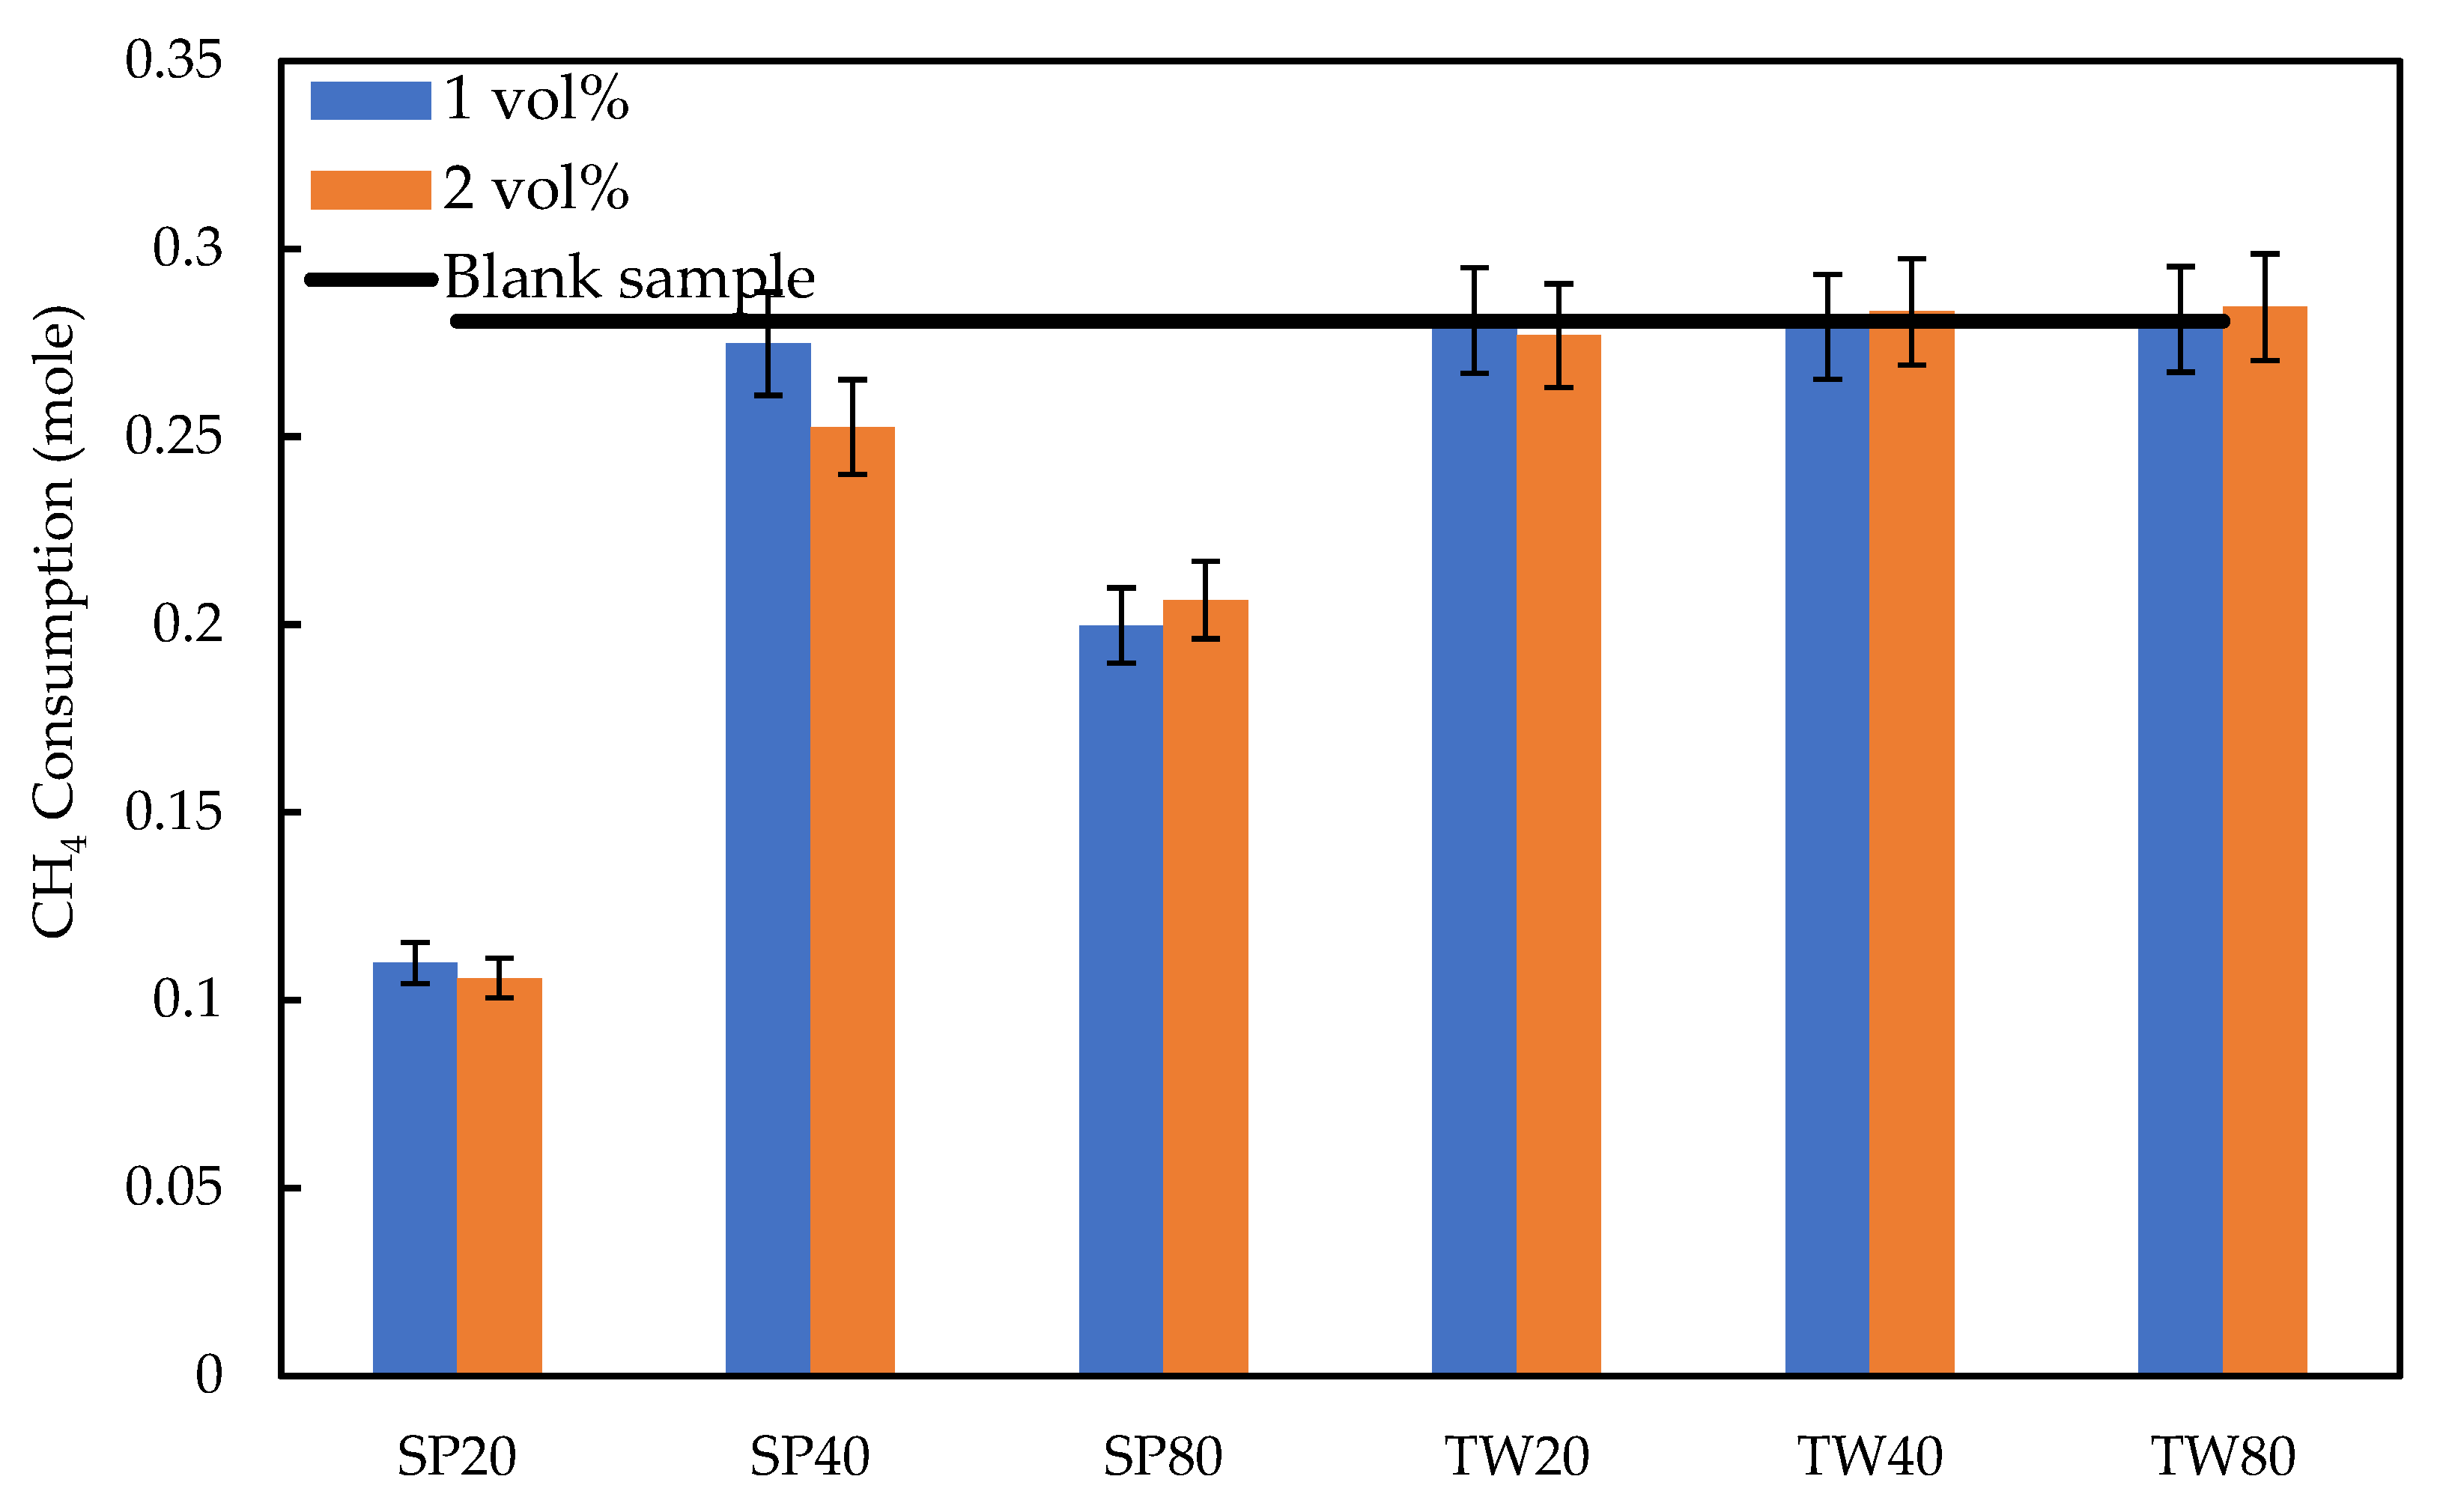
3.2.3. Degree of Gas Consumption and Water to Hydrate Conversion

The degree of methane consumption was calculated from the material balance. The final extent of gas consumption was measured when the system pressure reached a steady state and remained at a plateau for one hour. As the hydrate formation plugs the pipeline, the surfactant could be used to manage and control the risk of hydrate formation. One such method is to delay the hydrate nucleation process by adding kinetic hydrate inhibitors such as the Tween surfactant, as discussed in the induction time results. Another method is to allow for a fast and small degree of hydrate formation in a transportable slurry form within the hydrocarbon phase. Therefore, it is important to study the effect of chemical additives on the amount of gas consumption, which represents the number of hydrates formed.
It can be observed from Figure 8 that Tween surfactants show approximately the same gas consumption activity as in the blank system in the absence of any surfactants. Systems with Span-20 and Span-80 have reduced gas consumption activity. It was also observed that there was a slight impact of the surfactant concentration on the final degree of CH4 consumption. The final amount of gas consumption is normally controlled by the available amount of water, the equilibrium pressure, and the mass transfer resistance. The experimental temperature in this work was set at 277.15 K, which corresponds to an equilibrium pressure of 3.88 MPa as calculated by the CSMGem software. However, the final pressure in all the experiments does not drop below 7.40 MPa, which indicates that there is no thermodynamic limitation in this case. On the other hand, the water to hydrate conversion results confirm the availability of excessive water to form more hydrates. The maximum number of moles of water used in this work is 2.78 moles, which are supposed to consume 0.483 moles of CH4 if an ideal conversion rate has been achieved for structure I. Therefore, it can be concluded that due to the low solubility of CH4 in the water, mass transfer resistance dominated the system. Moreover, the non-ionic surfactants form an emulsion but do not significantly assist in incorporating more gas molecules in the liquid phase. This can be indicated by the lack of significant increase in CH4 consumption compared to water. For the Span family, the degree of CH4 consumption decreased significantly compared to water. The lowest amount was observed for Span-20, while the highest was observed for Span-40.
The measured water to hydrate conversions in the oil and water system with and without surfactants were listed in Table 2. The hydration number was assumed to be 6 as it is quite challenging to fully occupy all water cavities and reach the optimal hydration number of a Structure-I hydrate (5.75). The results show that Span-20 and Span-80 reduce the amount of water being converted to methane hydrates. Moreover, Tween-80 shows the highest conversion rate compared to the other samples. As mentioned earlier with respect to gas consumption, the Span forms a water-in-oil emulsion and disturbs the water molecules agglomeration to form a larger mass.

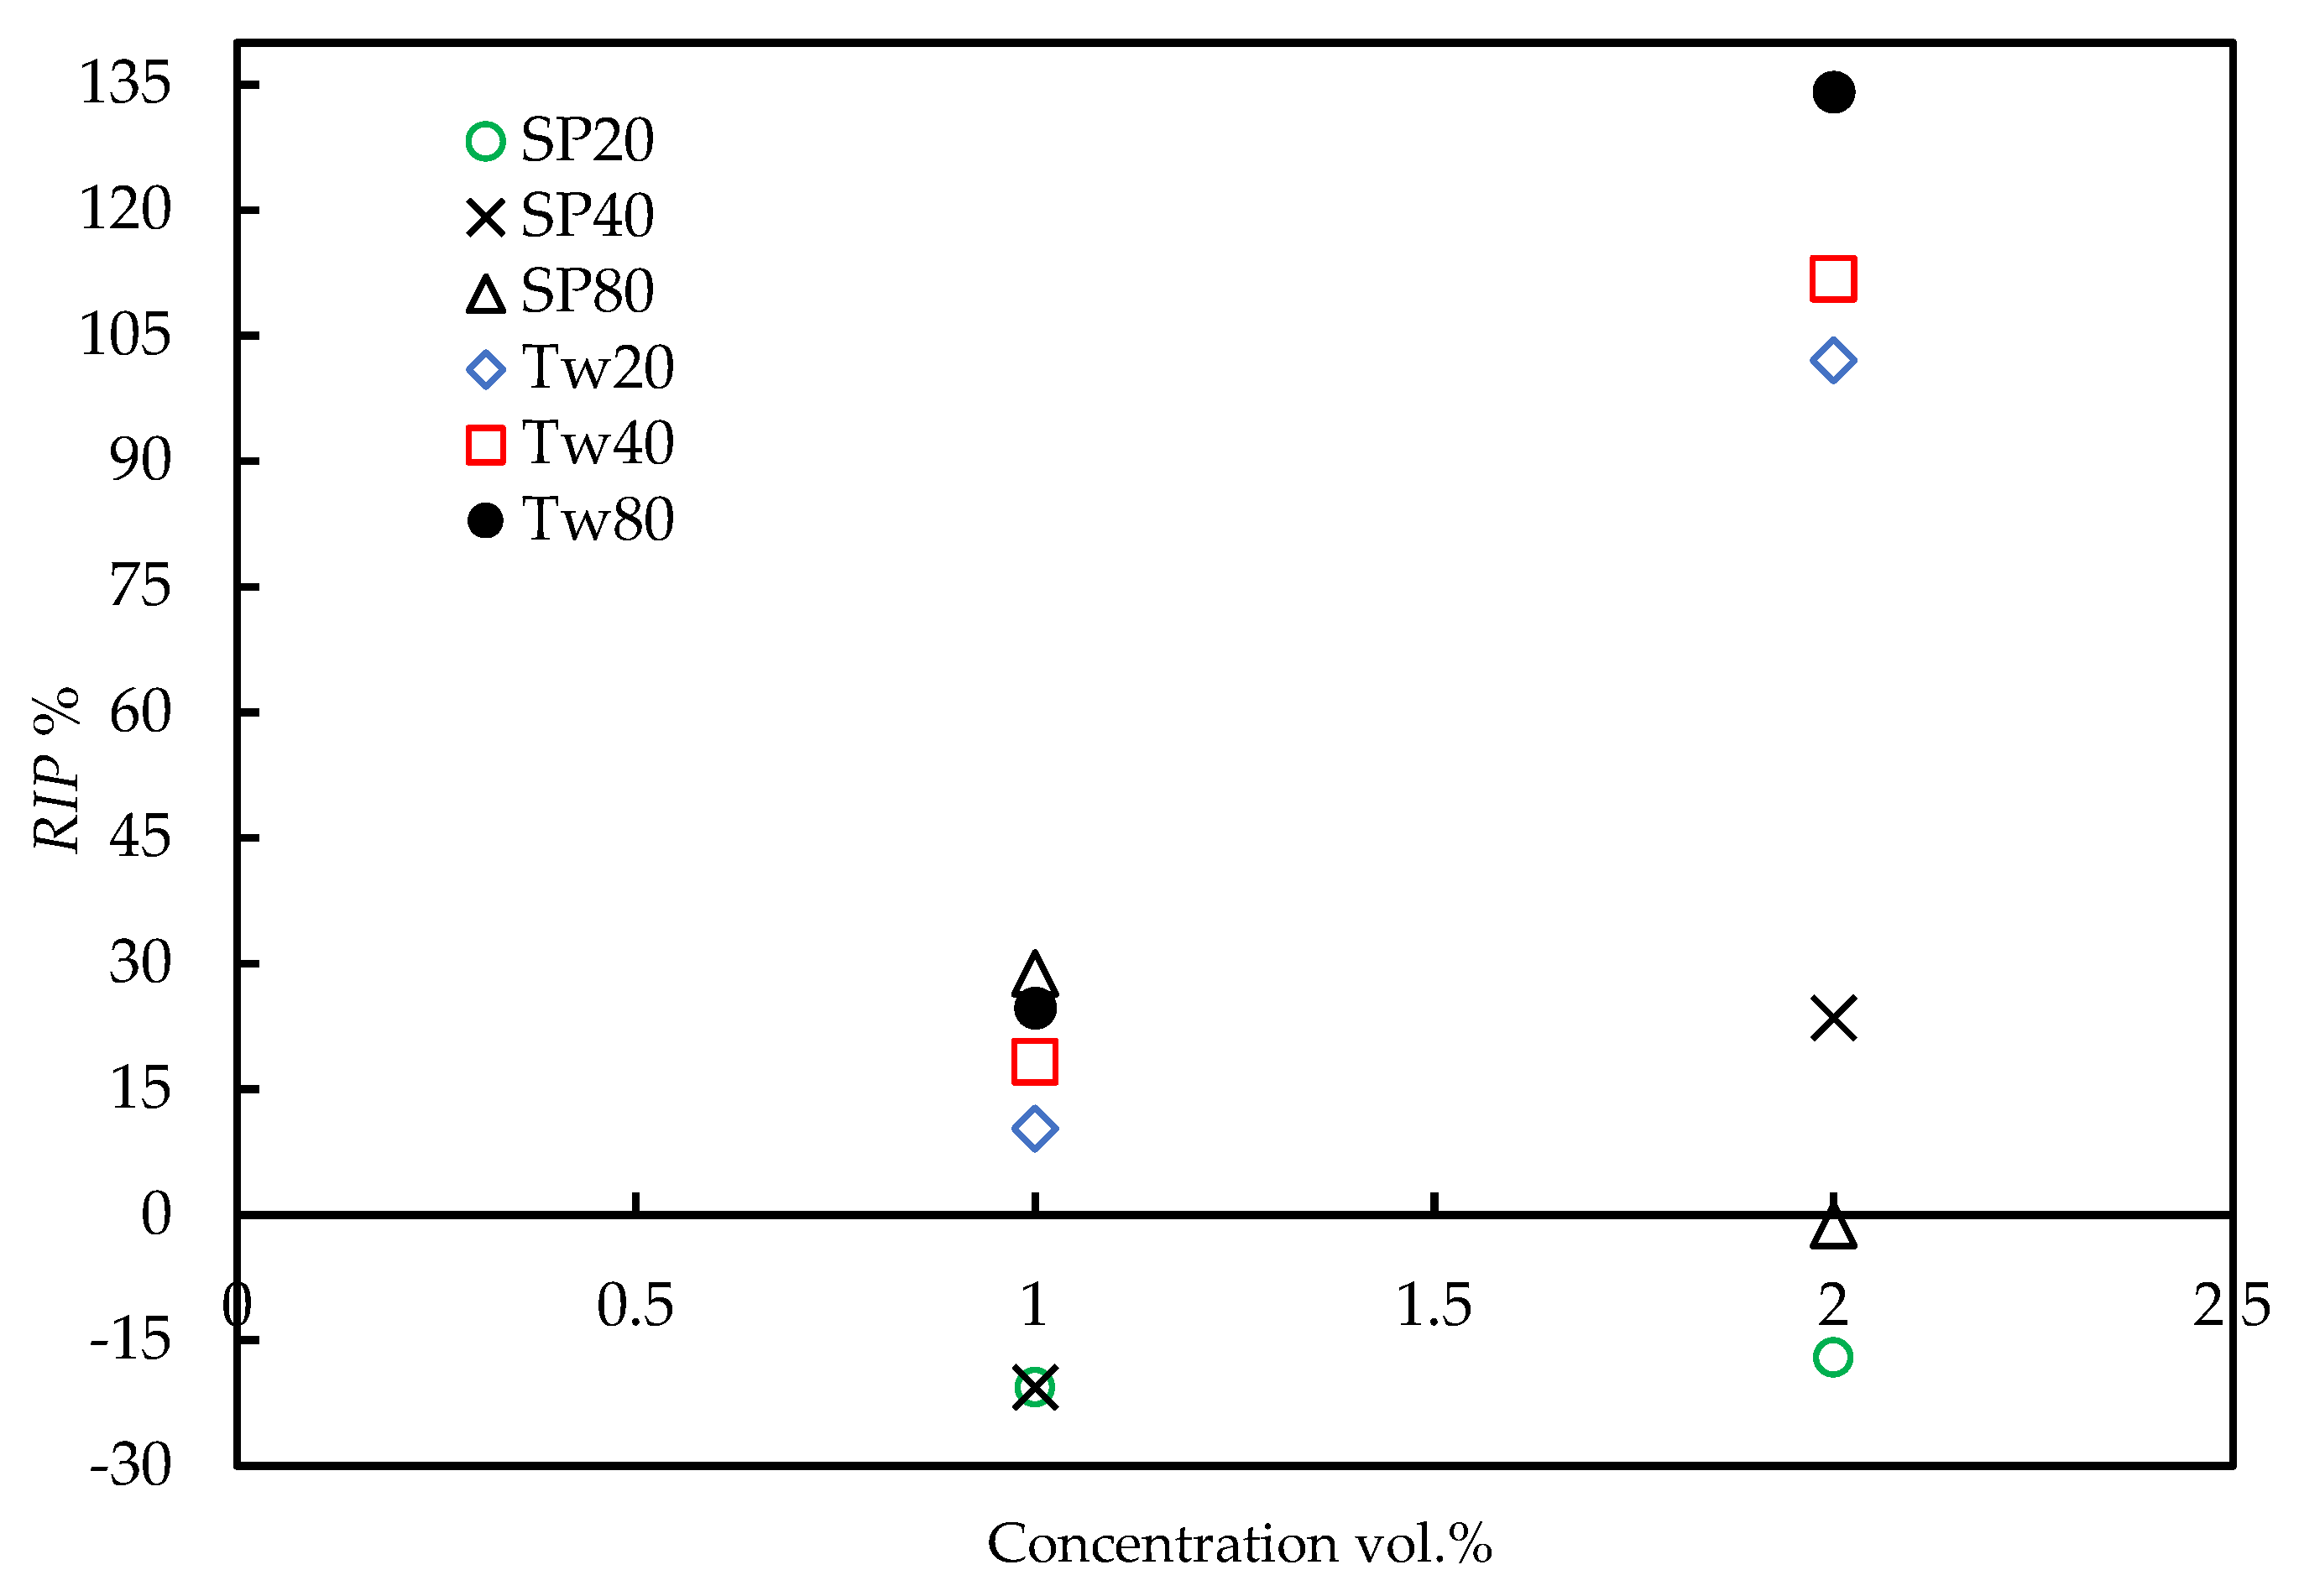
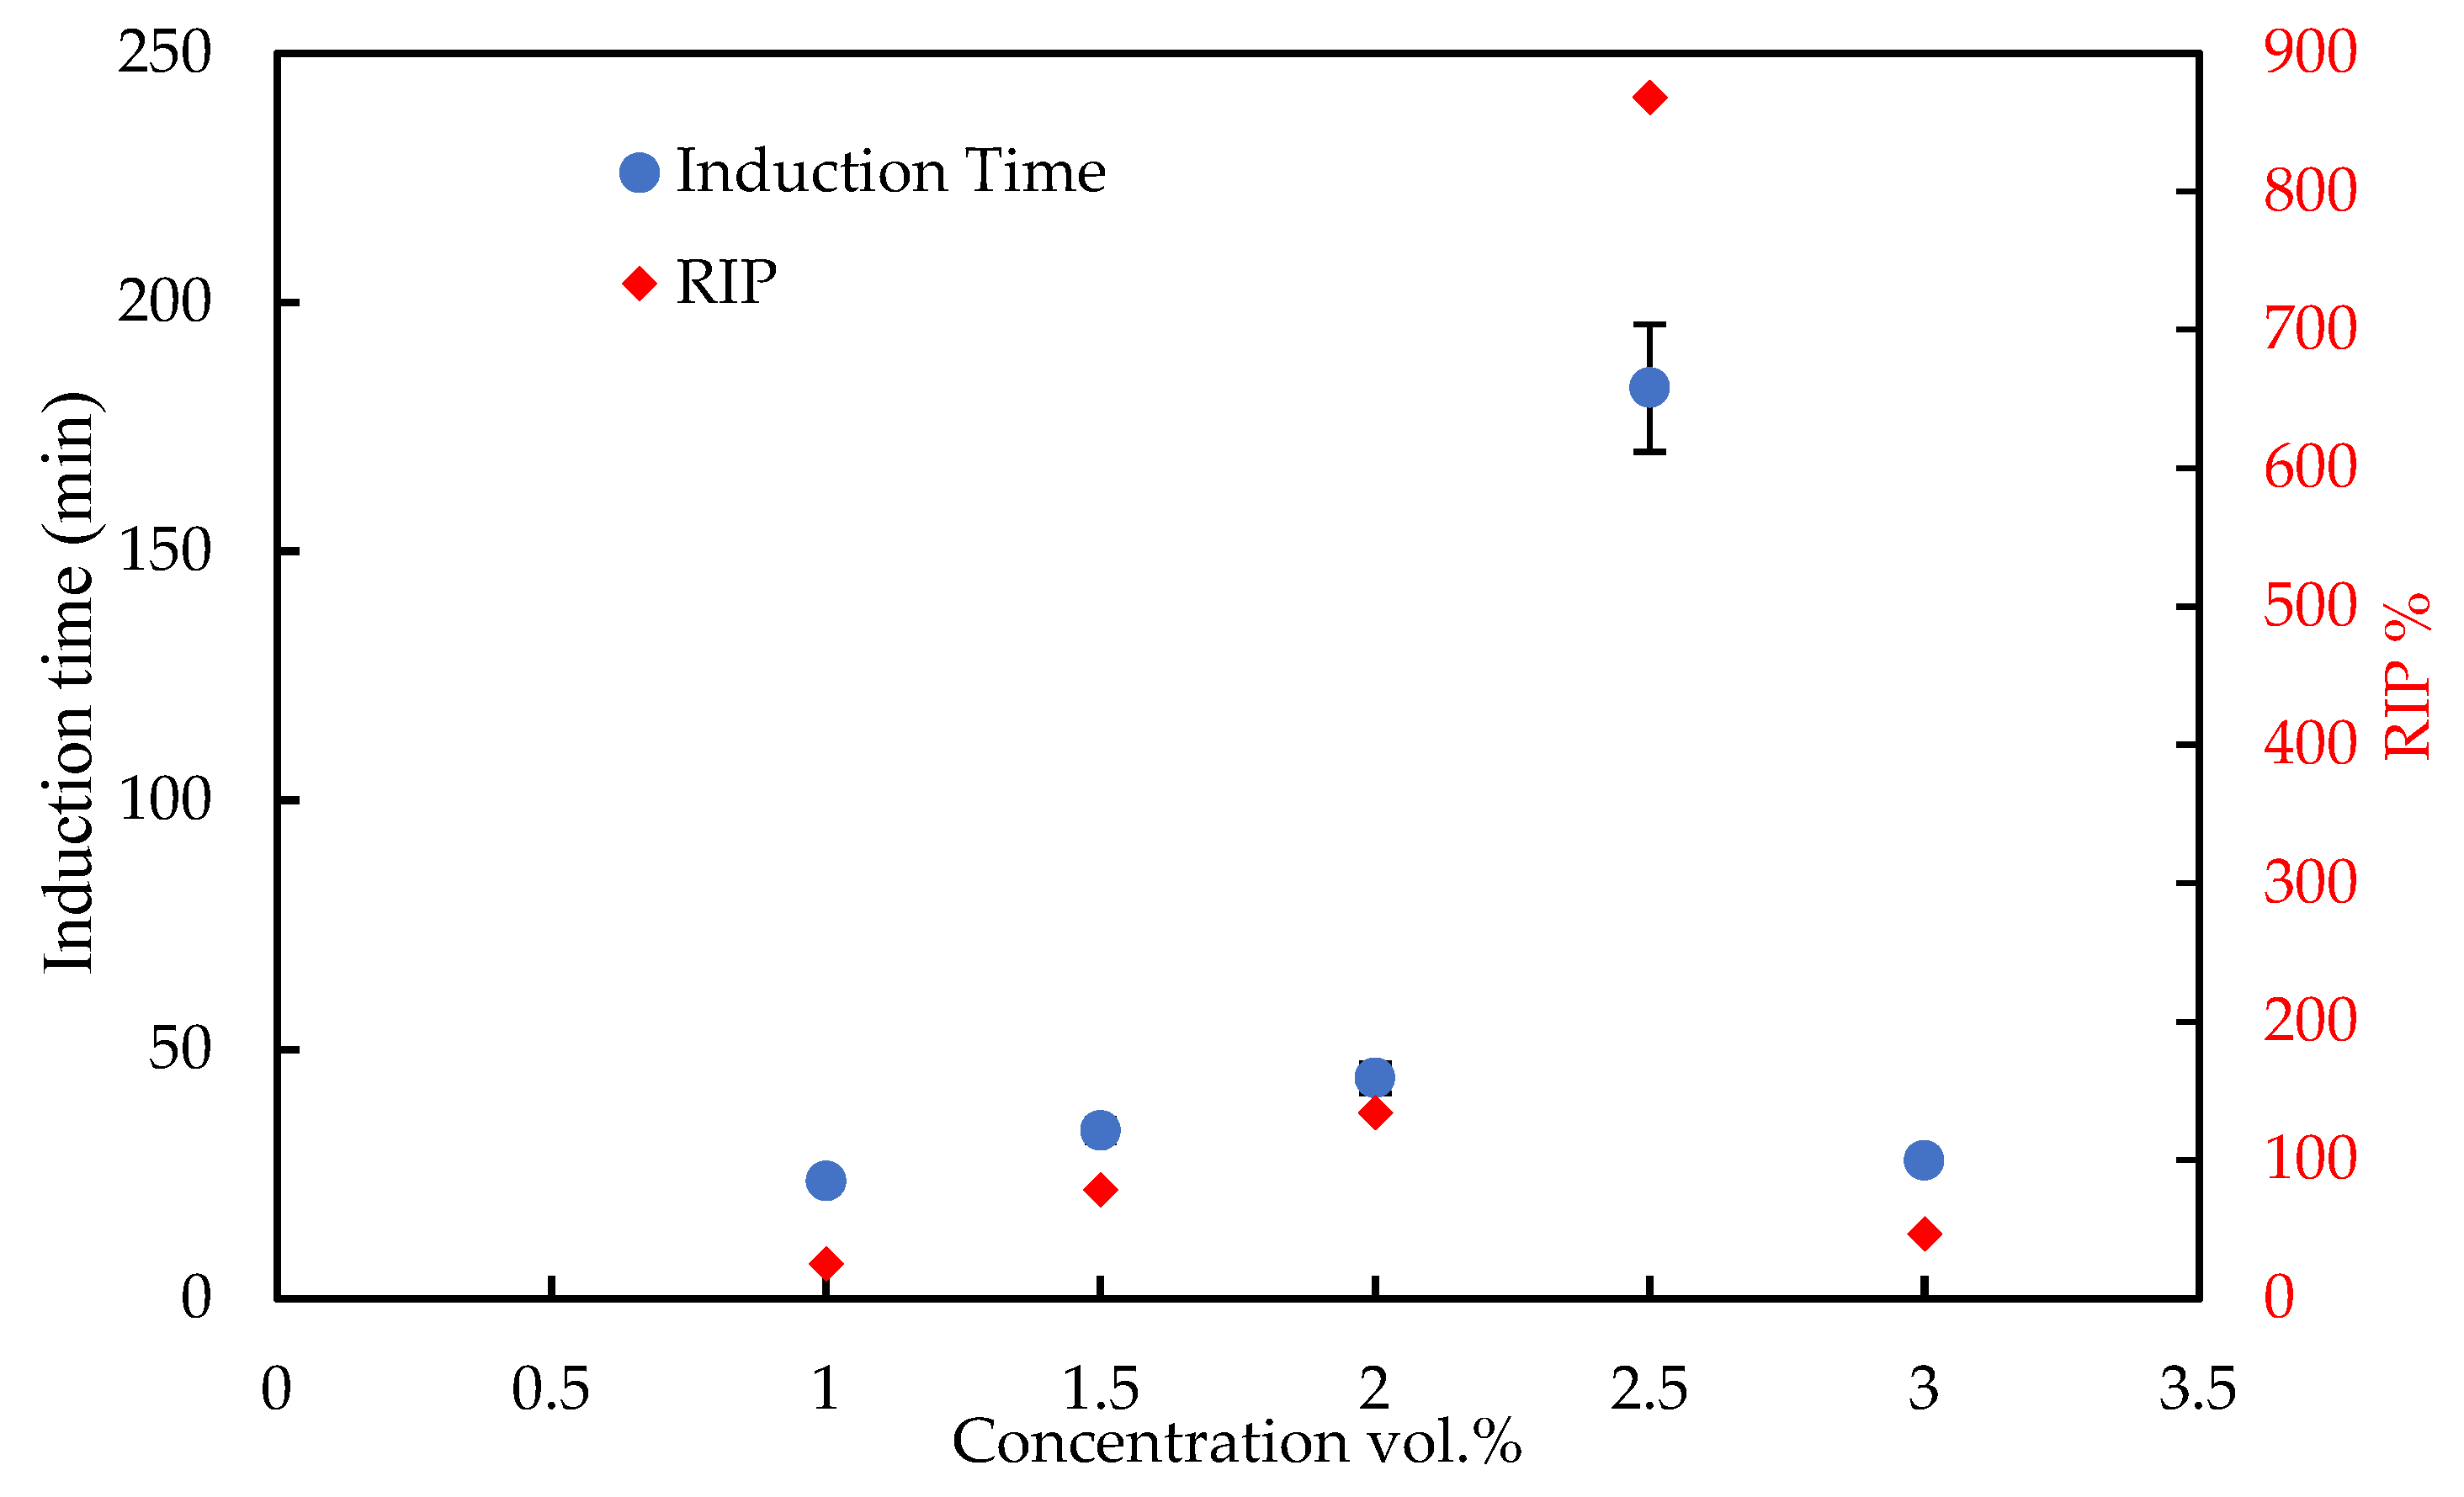
3.2.4. Further Evaluation of Tween-80 as KHI

Based on induction time measurements, Tween-80 has been demonstrated as the best KHI amongst all the non-ionic surfactants under study. As such, it was selected and prepared at 1.0, 1.5, 2.0, 2.5, and 3.0% (v/v) for further evaluation to compare its performance with the commercial KHI product. The 0.5 wt.% interval amongst the concentrations was maintained to ensure visible and accurate trends. Usually, convergent concentrations (concentrations intervals below 0.5 wt.%) are not useful in kinetic studies of hydrate formation because of their random nature and tendency to often yield inconsistent data measurement trends. The samples were tested at an initial pressure of 8.80 MPa at a constant temperature of 277.15 K.
The concentration effects of Tween-80 on the induction time, the rate of hydrate formation, and the degree of CH4 consumption are plotted in Figure 9 and Figure 10. Figure 9 shows that the optimum concentration at which Tween-80 significantly delays hydrate formation is 2.5 vol.%. The RIP at this concentration was reported at 868.10% higher than the blank sample. This finding could be a breakthrough in hydrate kinetic inhibition, not only due to its effectiveness but also due to its biodegradability and economic considerations. However, further analytical studies and molecular dynamic simulations are needed to describe the mechanism(s) provoking this phenomenon of a high induction time for Tween-80 in this study.
In Figure 10, the rate of hydrate formation was slightly decreased with the increasing concentration of Tween-80. The correlation between the concentration and the rate is almost linear, which could be attributed to the quantity of the surfactant molecules in the system. Saturating the system with excessive surfactant molecules has decreased the hydrate formation rates. However, all concentrations have enhanced the rate of formation compared to the blank sample. Moreover, the degree of CH4 consumed is slightly higher than the blank sample.

3.3. Comparison of Tween 80 with PVP

Although commercial KHIs such as PVP and PVCap have been proven to be efficient KHIs, researchers and stakeholders are still in search of better inhibitors that are efficient at higher subcooling temperatures and that are more environmentally friendly. Therefore, the performance of Tween-80 in this work was compared to PVP, as presented in Table 3. It can be observed that PVP exhibits an inhibitory behavior at all the studied concentrations as its RIP values are 155.9, 220.3, and 203.4% at 1.0, 2.0, and 2.5% (v/v), respectively. The maximum RIP for PVP was found at 2.0% (v/v), which is higher than Tween-80 at 2.0% (v/v). However, using PVP at a high concentration causes solubility issues that could lead to a poor hydrate inhibition effect as reported in [30]. Tween-80 at 2.5% (v/v) with RIP of 868.1% has outperformed PVP.
PVP is superior to Tween-80 for lowering the CH4 hydrate formation rate and total gas consumption. This is due to the surface-tension-reductive property of the Tween-80 surfactants. However, both PVP and Tween-80 have hydrophobic and hydrophilic groups as it is known that the KHIs are adsorbed on the hydrate crystal’s surface through hydrogen bonding. The presence of multiple OH and O groups in the Tween-80 structure forms stronger hydrogen bonds with the water molecules, which strengthen its adsorption on the hydrate crystal’s surface. In contrast, the steric hindrance effect of the hydrophobic groups in the PVP molecules inhibits and delays the nucleation and growth of hydrates at all concentrations.

3.4. Induction Time Prediction Using CNT

The induction time of methane hydrate formation in 2.5% (v/v) of Tween-80 was predicted by the CNT. This could offer an efficient tool for predicting the hydrate formation onset time in pipelines according to the operating temperature and pressure conditions. Due to the slight changes in the equilibrium pressure in accordance with the temperature, a first order equation was fitted to the experimental data. The nucleation rate was calculated using Equation (5). The onset of hydrate formation was detected when the nucleation rate reached zero, which indicates that there is no change in the number of nuclei over time and that the nucleation process has been completed. Table 4 presents the experimental and the CNT-predicted data. The maximum average absolute error (APE) was found to be 5.70%, which is quite accurate for such a stochastic kinetic phenomenon. This demonstrates the applicability of using the CNT model to predict the methane hydrate formation rate in the presence of a nonionic surfactant, Tween-80. The same model was successfully used to predict methane hydrate formation in drilling mud.

3.5. Modeling the Rate of CH4 Hydrate Formation in the Presence of Tween-80

The apparent rate constant Kapp of CH4 hydrate formation in the multiphase system in the presence of 1.0–3.0% (v/v) Tween-80 was calculated at the temperature range of 274.15–277.15 K. The empirical correlation representing the relationship between the apparent rate constant, concentration, and temperature is established as follows (Equation (13)):
K a p p = 0.03514 0.0001483 C 0.0001181 T .
Hence, the modified Englezos model is expressed in Equation (14).
r = d n d t = ( 0.03514 0.0001483 C 0.0001181 T ) ( f g f e q )  
The predicted rates of hydrate formation are presented in Table 5 along with their APEs. The rate predictions from the model agreed with the experimental data. The prediction errors are in the range of 0.38% to 4.93%. The errors are relatively acceptable for kinetic data compared to other reported studies in the literature [31]. The apparent rate constant is useful for comparing the growth rate of hydrate crystals. Therefore, in such a predictive model, the rate constant would help to obtain information on the rate of hydrate formation within the studied range as the operating pressure is known during oil and gas processing. It is worth mentioning that the presence of surfactants has a strong effect on the rate of hydrate formation due to their surface tension reduction property. However, they have a negligible effect on the hydrate phase equilibrium pressure and/or the equilibrium fugacity, feq, at a given temperature. Therefore, the driving force, fgfeq, was changed only due to the different operating temperatures.

4. Conclusions

In this study, nonionic surfactants were investigated as kinetic methane hydrate inhibitors in a multiphase system at 8.70 MPa and a temperature range of 274.15–277.15 K. The results showed that the Span and Tween series have a negligible effect on methane hydrate phase boundary conditions. Among the studied nonionic surfactants, Tween-80 profoundly delayed the methane hydrate nucleation time. However, the presence of surfactants promoted the rate of hydrate formation. The SPAN family significantly reduced the methane consumption and water to hydrate conversion rates, while the Tween family exhibited a negligible effect on the methane consumed. The optimal methane hydrate inhibition concentration of Tween-80 was 2.5% (v/v), which outperforms PVP (a commercial KHI inhibitor) in terms of induction time. However, PVP inhibits and delays the rate of hydrate formation, and its degree of gas consumption is greater than Tween-80. Generally, conventional kinetic hydrate inhibitors such as PVP are known to plug pipelines or promote hydrate formation post-induction time. Therefore, for hydrate prevention purposes, the use of induction time as the main kinetic performance indicator is recommended, thus supporting the noticeable induction time performance of Tween-80 over PVP in this work. The classical nucleation theory predicted the induction time in the presence of Tween-80 with a maximum error of 5.70%. In addition, the modified Englozes model has successfully predicted the rate of hydrate formation as a function of temperature and concentration with a maximum error of 4.93%.

Author Contributions

Conceptualization, K.S.F. and O.N.; methodology, O.N.; Modelling, C.B.B.; writing—original draft preparation, K.S.F. and O.N.; writing—review and editing, A.M.S. and R.D.T.; supervision, B.L.; funding acquisition, B.L. All authors have read and agreed to the published version of the manuscript.

Funding

This research was funded by MURPHY OIL Co., Ltd., grant number 015MD-021.

Institutional Review Board Statement

Not applicable.

Informed Consent Statement

Not applicable.

Data Availability Statement

All data and materials are available on request to the corresponding author.

Acknowledgments

The authors thank Universiti Teknologi PETRONAS, CO2 Research Centre (CO2RES), and MURPHY OIL Co., Ltd. for providing the facilities.

Conflicts of Interest

The authors declare no conflict of interest.

References

  1. Lal, B.; Nashed, O. Chemical Additives for Gas Hydrates; Springer Nature: Berlin/Heidelberg, Germany, 2020; ISBN 978-3-030-30749-3. [Google Scholar]
  2. Nashed, O.; Lal, B.; Shariff, A.M.; Sabil, K.M. Gas Hydrate Promoters; Springer Nature: Berlin/Heidelberg, Germany, 2020. [Google Scholar]
  3. Bavoh, C.B.; Nashed, O.; Rehman, A.N.; Othaman, N.A.A.B.; Lal, B.; Sabil, K.M. Ionic liquids as gas hydrate thermodynamic inhibitors. Ind. Eng. Chem. Res. 2021, 60, 15835–15873. [Google Scholar] [CrossRef]
  4. Mohamad Sabil, K.; Nashed, O.; Lal, B.; Foo, K.S. Formation Kinetics and Self-Preservation of CO2 Hydrates in the Presence of Carboxylated Multiwall Carbon Nanotubes. In Proceedings of the International Petroleum Technology Conference, Virtual, 16 March 2021. [Google Scholar]
  5. Takeya, S.; Mimachi, H.; Murayama, T. Methane storage in water frameworks: Self-preservation of methane hydrate pellets formed from NaCl solutions. Appl. Energy 2018, 230, 86–93. [Google Scholar] [CrossRef]
  6. Veluswamy, H.P.; Kumar, A.; Seo, Y.; Lee, J.D.; Linga, P. A review of solidified natural gas (SNG) technology for gas storage via clathrate hydrates. Appl. Energy 2018, 216, 262–285. [Google Scholar] [CrossRef]
  7. Nallakukkala, S.; Lal, B. Seawater and produced water treatment via gas hydrate: Review. J. Environ. Chem. Eng. 2021, 9, 105053. [Google Scholar] [CrossRef]
  8. Bharathi, A.; Nashed, O.; Lal, B.; Foo, K.S. Experimental and modeling studies on enhancing the thermodynamic hydrate inhibition performance of monoethylene glycol via synergistic green material. Sci. Rep. 2021, 11, 2396. [Google Scholar] [CrossRef]
  9. Khan, M.S.; Bavoh, C.B.; Foo, K.S.; Shariff, A.M.; Kassim, Z.; Othman, N.A.B.; Lal, B.; Ahmed, I.; Rahman, M.A.; Gomari, S.R. Kinetic behavior of quaternary ammonium hydroxides in mixed methane and carbon dioxide hydrates. Molecules 2021, 26, 275. [Google Scholar] [CrossRef]
  10. Tariq, M.; Rooney, D.; Othman, E.; Aparicio, S.; Atilhan, M.; Khraisheh, M. Gas hydrate inhibition: A review of the role of ionic liquids. Ind. Eng. Chem. Res. 2014, 53, 17855–17868. [Google Scholar] [CrossRef]
  11. Qasim, A.; Lal, B.; Shariff, A.M.; Ismail, M.C. Role of Ionic Liquid-Based Multipurpose Gas Hydrate and Corrosion Inhibitors in Gas Transmission Pipeline. In Nanotechnology-Based Industrial Applications of Ionic Liquids; Springer: Berlin/Heidelberg, Germany, 2020; pp. 221–244. [Google Scholar]
  12. Koh, C.A.; Sloan, E.D.; Sum, A.K.; Wu, D.T. Fundamentals and applications of gas hydrates. Ann. Rev. Chem. Biomolec. Eng. 2011, 2, 237–257. [Google Scholar] [CrossRef]
  13. Nashed, O.; Partoon, B.; Lal, B.; Sabil, K.M.; Shariff, A.M. Investigation of functionalized carbon nanotubes’ performance on carbon dioxide hydrate formation. Energy 2019, 174, 602–610. [Google Scholar] [CrossRef]
  14. Kumar, A.; Bhattacharjee, G.; Kulkarni, B.D.; Kumar, R. Role of Surfactants in Promoting Gas Hydrate Formation. Ind. Eng. Chem. Res. 2015, 54, 12217–12232. [Google Scholar] [CrossRef]
  15. Ganji, H.; Manteghian, M.; Sadaghiani zadeh, K.; Omidkhah, M.R.; Rahimi Mofrad, H. Effect of different surfactants on methane hydrate formation rate, stability and storage capacity. Fuel 2007, 86, 434–441. [Google Scholar] [CrossRef]
  16. Pan, Z.; Wang, Z.; Zhang, Z.; Ma, G.; Zhang, L.; Huang, Y. Natural gas hydrate formation dynamics in a diesel water-in-oil emulsion system. Pet. Sci. Technol. 2018, 36, 1649–1656. [Google Scholar] [CrossRef]
  17. Sun, Z.; Wang, R.; Ma, R.; Guo, K.; Fan, S. Effect of surfactants and liquid hydrocarbons on gas hydrate formation rate and storage capacity. Int. J. Energy Res. 2003, 27, 747–756. [Google Scholar] [CrossRef]
  18. Zhang, B.; Wu, Q.; Sun, D.-l. Effect of surfactant Tween on induction time of gas hydrate formation. J. China Univ. Min. Technol. 2008, 18, 18–21. [Google Scholar] [CrossRef]
  19. Khan, M.S.; Bavoh, C.B.; Partoon, B.; Nashed, O.; Lal, B.; Mellon, N.B. Impacts of ammonium based ionic liquids alkyl chain on thermodynamic hydrate inhibition for carbon dioxide rich binary gas. J. Mol. Liq. 2018, 261, 283–290. [Google Scholar] [CrossRef]
  20. Nashed, O.; Sabil, K.M.; Ismail, L.; Japper-Jaafar, A.; Lal, B. Mean induction time and isothermal kinetic analysis of methane hydrate formation in water and imidazolium based ionic liquid solutions. J. Chem. Thermodyn. 2018, 117, 147–154. [Google Scholar] [CrossRef]
  21. Englezos, P.; Dholabhai, P.D.; Kalogerakis, N. Kinetics of formation of methane and ethane gas hydrates. Chem. Eng. Sci. 1987, 42, 2647–2658. [Google Scholar] [CrossRef]
  22. Sear, R.P. Quantitative studies of crystal nucleation at constant supersaturation: Experimental data and models. CrystEngComm 2014, 16, 6506–6522. [Google Scholar] [CrossRef]
  23. Bavoh, C.B.; Md Yuha, Y.B.; Tay, W.H.; Ofei, T.N.; Lal, B.; Mukhtar, H. Experimental and modelling of the impact of quaternary ammonium salts/ionic liquid on the rheological and hydrate inhibition properties of xanthan gum water-based muds for drilling gas hydrate-bearing rocks. J. Pet. Sci. Eng. 2019, 183, 106468. [Google Scholar] [CrossRef]
  24. Malegaonkar, M.B.; Dholabhai, P.D.; Bishnoi, P.R. Kinetics of carbon dioxide and methane hydrate formation. Can. J. Chem. Eng. 1997, 75, 1090–1099. [Google Scholar] [CrossRef]
  25. Nashed, O.; Lal, B.; Partoon, B.; Sabil, K.M.; Hamed, Y. Kinematic Study of Methane Hydrate Formation and Self-Preservation in the Presence of Functionalized Carbon Nanotubes. Energy Fuels 2019, 33, 7684–7695. [Google Scholar] [CrossRef]
  26. Karaaslan, U.; Parlaktuna, M. Surfactants as hydrate promoters? Energy Fuels 2000, 14, 1103–1107. [Google Scholar] [CrossRef]
  27. Sabil, K.M.; Nashed, O.; Lal, B.; Ismail, L.; Japper-Jaafar, A. Experimental investigation on the dissociation conditions of methane hydrate in the presence of imidazolium-based ionic liquids. J. Chem. Thermodyn. 2015, 84, 7–13. [Google Scholar] [CrossRef]
  28. Partoon, B.; Sahith, S.J.K.; Lal, B.; Maulud, A.S. Bin Gas Hydrate Models. In Green Energy and Technology; Springer Verlag: Berlin/Heidelberg, Germany, 2020; pp. 67–85. [Google Scholar]
  29. Parreidt, T.S.; Schott, M.; Schmid, M.; Müller, K. Effect of Presence and Concentration of Plasticizers, Vegetable Oils, and Surfactants on the Properties of Sodium-Alginate-Based Edible Coatings. Int. J. Mol. Sci. 2018, 19, 742. [Google Scholar] [CrossRef]
  30. Qin, H.B.; Sun, Z.F.; Wang, X.Q.; Yang, J.L.; Sun, C.Y.; Liu, B.; Yang, L.Y.; Chen, G.J. Synthesis and Evaluation of Two New Kinetic Hydrate Inhibitors. Energy Fuels 2015, 29, 7135–7141. [Google Scholar] [CrossRef]
  31. Yin, Z.; Khurana, M.; Tan, H.K.; Linga, P. A review of gas hydrate growth kinetic models. Chem. Eng. J. 2018, 342, 9–29. [Google Scholar] [CrossRef]
Figure 1. Gas hydrates’ common structures.
Colloids 06 00048 g001
Figure 2. Experimental setup.
Colloids 06 00048 g002
Figure 3. HLVE curve of methane for pure water (CSMGem software, study [27], and this work), 0.03 wt.% SDS, and 2.0% (v/v) surfactants.
Colloids 06 00048 g003
Figure 4. A Typical profile of CH4 hydrate formation profile in the presence of non-ionic surfactant in multiphase system.
Colloids 06 00048 g004
Figure 5. The induction time measurements of six non-ionic surfactants at 1.0% (v/v) and 2.0% (v/v) (Oil/H2O: 50/50; 277 K, 8.50 MPa).
Colloids 06 00048 g005
Figure 6. Relative inhibition power of nonionic surfactants in multi-phase system (Oil/H2O: 50/50; 277 K, 8.50 MPa).
Colloids 06 00048 g006
Figure 7. Initial rate of CH4 hydrate formation in the presence of non-ionic surfactants. (Oil/H2O: 50/50; 277 K, 8.50 MPa).
Colloids 06 00048 g007
Figure 8. The effect of non-ionic surfactant on the degree of CH4 consumption. (Oil/H2O: 50/50; 277 K, 85 bar).
Colloids 06 00048 g008
Figure 9. The effect of Tween-80 concentration on the methane hydrate induction time.
Colloids 06 00048 g009
Figure 10. The effect of concentration of nonionic surfactant on: (a) rate of hydrate formation and (b) degree of gas consumption.
Colloids 06 00048 g010
Table 1. The names, abbreviations, properties, and suppliers of the chemicals used.
ChemicalAbbreviationHLBPuritySupplier
Sorbitan monolaurateSpan-208.6>95%Sigma Aldrich
Sorbitan monopalmitateSpan-406.7>95%
Sorbitane monooleateSpan-804.3>95%
Polyoxyethylenesorbitan monolaurateTween-2016.799%
Polyoxyethylene sorbitan monopalmitate Tween-4015.699.95%
Polyoxyethylenesorbitan monooleateTween-8015.0
MethaneCH4-99.95%Linde Malaysia Sdn Bhd
Base oilMG3NANAPetronas Sdn Bhd
Table 2. Effect of non-ionic surfactant on the final water to CH4 hydrate conversion activity.
SampleConcentration (vol%)Water to Hydrate Conversion (mol%)
Blank00.606
SP2010.240
20.234
SP4010.600
20.602
SP8010.436
20.456
TW2010.614
20.611
TW4010.610
20.625
TW8010.614
20.628
Table 3. Comparison of induction time, initial rate (r), and CH4 consumption between PVP and the TWEEN80.
Concentration vol.%Tween-80PVP
Induction Time (min)r (mol·min−1)Gas Consumption (mol)Induction Time (min)r (mol·min−1)Gas Consumption (mol)
1.023.60.007670.281348.330.001920.0780
2.044.20.007030.284560.4950.000780.1250
2.5182.80.007070.296357.30.001930.1248
Table 4. Experimental and predicted induction times of CH4 hydrate formation in the presence of Tween-80.
TemperatureInduction Time (min)APE%
ExperimentalPredicted
274.1532.1734.005.70
275.15124.00127.332.69
276.15164.83168.502.22
277.15182.83189.003.37
Table 5. Experimental and predicted initial gas consumption rate of CH4.
rpre (mol·min−1)rexp (mol·min−1)APE%
0.009990.010001.04
0.008960.009071.19
0.007970.007604.93
0.006980.007071.29
0.007640.007670.38
0.007490.007581.22
0.007120.007031.30
0.006750.006871.69
Publisher’s Note: MDPI stays neutral with regard to jurisdictional claims in published maps and institutional affiliations.

