Article

Line Patterns and Fractured Coatings in Deposited Colloidal Hydrochar on Glass Substrates after Evaporation of Water

Department of Materials and Environmental Chemistry, Stockholm University, SE-10691 Stockholm, Sweden
*
Author to whom correspondence should be addressed.
Colloids Interfaces 2022, 6(2), 36; https://doi.org/10.3390/colloids6020036
Submission received: 13 April 2022 / Revised: 15 May 2022 / Accepted: 16 May 2022 / Published: 30 May 2022

Abstract

:
Patterns of assembled colloidal particles can form on substrates due to solvent evaporation, and here we studied such phenomena in the drying of monodispersed colloidal hydrochar dispersions prepared by the hydrothermal carbonization of glucose and purified by dialysis. During the evaporation of water, line patterns or, in some cases, mud-like patterns formed. The line formation was investigated as a function of the pH of the dispersion, substrate shape, particle concentration, and concentration of sodium dodecylsulfate (SDS). The lines comprised dense assemblies of hydrochar particles. The line width increased with the successive evaporation of water. Sharper lines formed with the addition of SDS, which was ascribed to the effects of solubilization or moderated interactions. At greater particle concentrations, we also observed a continuous layer of colloidal particles between the lines. A mechanism for the line pattern formation derived from the literature on other colloids was proposed. Mud-like patterns formed on the substrate in concentrated samples without SDS addition and were put in the context of the formation of cracks in the drying of colloidal coatings. Hydrochars belong to carbon-rich colloids, which are of fundamental and technological importance. This research could be useful for in situ line printing within microfluidic devices, for example.

Graphical Abstract

1. Introduction

Well-ordered lines of deposited particles sometimes form when evaporating the solvent from colloidal dispersions of monodisperse nanocrystals of semiconductors [1], amorphous silica [2], metals and metal oxides [3,4], and polymers [5]. The lines form by directed assembly and comprise dense assemblies of particles, which are phenomenologically similar to self-assembled colloidal crystals, etc. [6,7]. Such colloidal entities have several potential applications, including optical [8,9], chemical, and biosensing [10,11], data storage [12], and in photonic band-gap materials [13]. They are also used as templates for the synthesis of nanostructured and ordered porous materials [14,15]. In another study, we used macroscopically large rods of assembled colloidal hydrochar as templates for porous SiC-Cu3Si using reactive infiltration [16].
For deposited lines of colloids, the coffee-ring effect is of importance [17,18,19,20,21]. In a pinned and drying drop, the convective flow towards the perimeter prevents evaporative shrinkage, and the colloids are transported to the perimeter and deposited as a ring. As the drop dries further, it shrinks with an oscillatory “stick-slip” motion [19], and concentric rings form. On drying and by the effect of gravity, wetted colloidal dispersions can form macroscopically thick lines or rings. Adachi et al. [21] observed that multiple and concentric rings of deposited colloidal polystyrene (PS) particles formed on drying drops of aqueous dispersions on borosilicate glass plates and ascribed the deposition of particles to a competition between the effects of surface tension and friction at the contact line of the evaporating droplet. Xu et al. [22] dried drops of toluene dispersions of CdSe/ZnS quantum dots (D = 5.5 nm) on silicon plates and observed initially that concentric rings formed, but as the drying progressed the orientation of the assembled and deposited colloids altered and spokes formed instead. The spoke formation was promoted by a slow evaporation rate and was related to a fingering instability [23] at the rim of the evaporating droplet.
On dip coating, line patterns have been observed on the plates after solvent evaporation in colloidal dispersions [14,24,25]. Giraldo et al. [24] studied how lines of deposited aggregated manganese oxide colloids developed on glass slides due to the evaporation of the solvent. Watanabe et al. [14] studied the lines of aggregated silica particles formed on solvophilic substrates on dip coating and drying. Huang et al. [25] reported lines forming during the drying of dispersions of gold or silver nanoparticles (~50 nm) on a SiO2/Si substrate. Rings of deposited colloidal particles have also been found to form in cylinders during the evaporation of solvents [14,22,25,26,27]. Abkarian et al. [26] observed rings of deposited colloidal PS in glass capillaries after evaporating the solvent.
Colosqui et al. [27] proposed a mechanism to explain how lines of deposited colloidal particles form due to dip coating and drying. For solvent films thinner than the diameters of the colloids, capillary forces prevent convective transport through the meniscus. Forces induced by the deformation of the interface are balanced by viscous drag when a certain number of particles have been deposited and assembled at the interface within the meniscus. The particles can thus enter the thin film where they move at nearly the withdrawal speed, separated from the next line. The interplay between hydrodynamic and capillary interactions generates periodic and defined structures below a critical withdrawal speed.
Line patterns have indeed been observed during the drying of various types of colloidal dispersions [28,29] but they have never before been observed for carbon colloids. Carbon-rich materials, such as hydrochar colloids, are important in electrochemistry, gas sorption, and other domains of science and technology and it would be interesting to test the possibility of similar ring formation from carbon colloids. Monodispersed hydrochar colloids can be prepared from hydrothermal carbonization (HTC) (also called wet pyrolysis [30] or wet torrefaction [31,32]) of glucose and sucrose [33,34,35,36]. The HTC process can be used for the valorisation of different types of low-quality biomass in order to produce better quality solid fuels [37,38,39,40]. We have reported that hydrochar colloids can be purified by dialysis, rendering them with a significantly negative zeta potential (approximately −40 mV) [16] at ambient pH conditions. As described in the literature, hydrochar can be formed via two pathways. One is the solid–solid conversion, in which the hydrochar is called primary char and maintains the original structural elements and morphology of the parent biomass; and the second is the aqueous phase degradation of biomass followed by the polymerization of organic molecules into an amorphous solid-phase secondary char [41]. The hydrochar colloids here refer to the secondary char.
In this study, we showed that line patterns could form during the drying of purified colloidal dispersions of hydrochar. The lines comprised dense colloidal assemblies. We also showed that for sufficiently concentrated dispersions thick, cracked, and fractured coatings could instead form during the evaporation of the water.

2. Experiments and Characterizations

2.1. Preparation of Hydrochar

Following the procedures in a study of ours [16], a crude dispersion of a monodispersed colloidal hydrochar (109 ± 54 nm) with a polydispersity of 27.8 was prepared by the HTC of glucose. A total of 9.008 g of glucose was dissolved in distilled water to prepare a 0.5 mol/dm3 glucose solution. A measurement in the range 15–18 mL of the solutions were subjected to HTC in Teflon™-lined autoclaves (Shanghai Qiuzuo Tec. Shanghai, China, 20–24 mL) at the optimized temperature and reaction time (468 K for 2 h) based on the experimental design from a previous study [16]. The temperature and reaction time were the two most influential factors for generating monodispersed colloidal hydrochar. After the HTC, the autoclaves were cooled down rapidly (caution: rapid cooling of autoclaves may be hazardous). The rate of the cooling was estimated by measuring the rate of temperature change in the water bath used to cool the autoclave; the time constant for that change in temperature was 18 K/min. This crude dispersion was purified using a sealed dialysis membrane (MEMBRA-CEL® dialysis tubing MD77, 14 kDa cut-off, Sigma-Aldrich, St. Louis, MO, USA). The permeate (normally distilled water) was changed regularly until the conductivity close to the dialysis tubing became similar to that of the permeate (0.5–0.7 µS/m) and stable. When conductivity was less than 1.5 µS/m, the purified CH3.63 dispersion was then ready to use. The 3.63 (g/dm3) denoted the hydrochar particle concentration. For a typical dialysis preparation, we used approximately 4 × 5 dm3 of water and the process took 48 h. The conductivity was measured with an XS COND 70+ pH/conductivity meter (XS Instruments, Italy). To some of the CH3.63 samples, 1–3 drops of a surfactant sodium dodecylsulfate (SDS) solution of 0.1 g/mL was added. These preparations were named CH3.63-SDS. One preparation of CH3.63 was purified with a permeate of an aqueous sodium hydroxide (NaOH) of pH = 9.5 and called CH3.63-NaOH. The crude dispersion, purified CH3.63, and CH3.63-NaOH had pH = 2.6 ± 0.01, 4.6 ± 0.01, and 5.8 ± 0.04, respectively [16].

2.2. Means Used for the Evaporation of Water

The evaporation of water was conducted in different geometries as follows: in glass vials (with diameters of 1.5 or 2.6 cm, and a height of 5.5 cm), glass tubes (with a diameter of 0.8 cm and a height of 7.5 cm), or polypropylene tubes (with a diameter of 1.0 cm and a height of 7.0 cm). For these items, a preheated oven was used. Evaporation was also performed with items of other geometries as follows: a glass beaker (with a diameter of 3.2 cm and a height of 4.7 cm), an immersed glass cylinder with two open ends (with a diameter of 1.2 and 1.0 cm and height of 2.7 cm), and on a glass slide. An oil bath at a temperature of 80 °C was used for these items.

2.3. Electron Microscopy

A transmission electron microscopy (TEM) image was taken with a field emission TEM microscope (JEOL JEM-2100F, Tokyo, Japan) operated at 200 kV. The samples were prepared by dispersing hydrochar particles onto a holey carbon-coated copper grid and then dried. The scanning electron microscopy (SEM) images were recorded with a Hitachi TM3000 microscope (Tokyo, Japan) operated at 15 kV with a working distance of 4.4 mm; or in a secondary electron mode of a field-emission SEM microscope (JEOL JSM-7000F) operated at 1–5 kV with a gentle beam. The working distance was 9.6–9.8 mm.

2.4. Dynamic Light Scattering (DLS)

The monodispersity and the hydrodynamic diameter of the hydrochar particles were determined by DLS using a Zetasizer Nano-ZS (Malvern Instrument Ltd., Malvern, UK) at 298 K. Average hydrodynamic diameters and polydispersity indexes (PDIs) were calculated using the cumulant method with the program supplied with the instrument. The PDI is equal to the square of the standard deviation divided by the mean particle diameter. It is a parameter describing the width of the particle size distribution. The PDI may vary from 0 to 1, and colloidal particles with PDIs < 0.1 are monodispersed, and those with PDIs > 0.1 are polydispersed [42,43]. The 1/PDI defines, thus, a monodispersity and 1/PDI > 10 corresponds to monodispersed particles. Particle-size distributions were derived from the autocorrelation functions with an inverse Laplace transform method and regularized using the program supplied with the instrument.

3. Results and Discussion

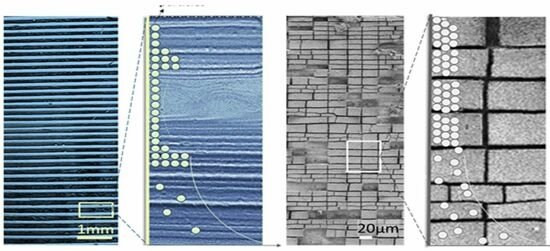
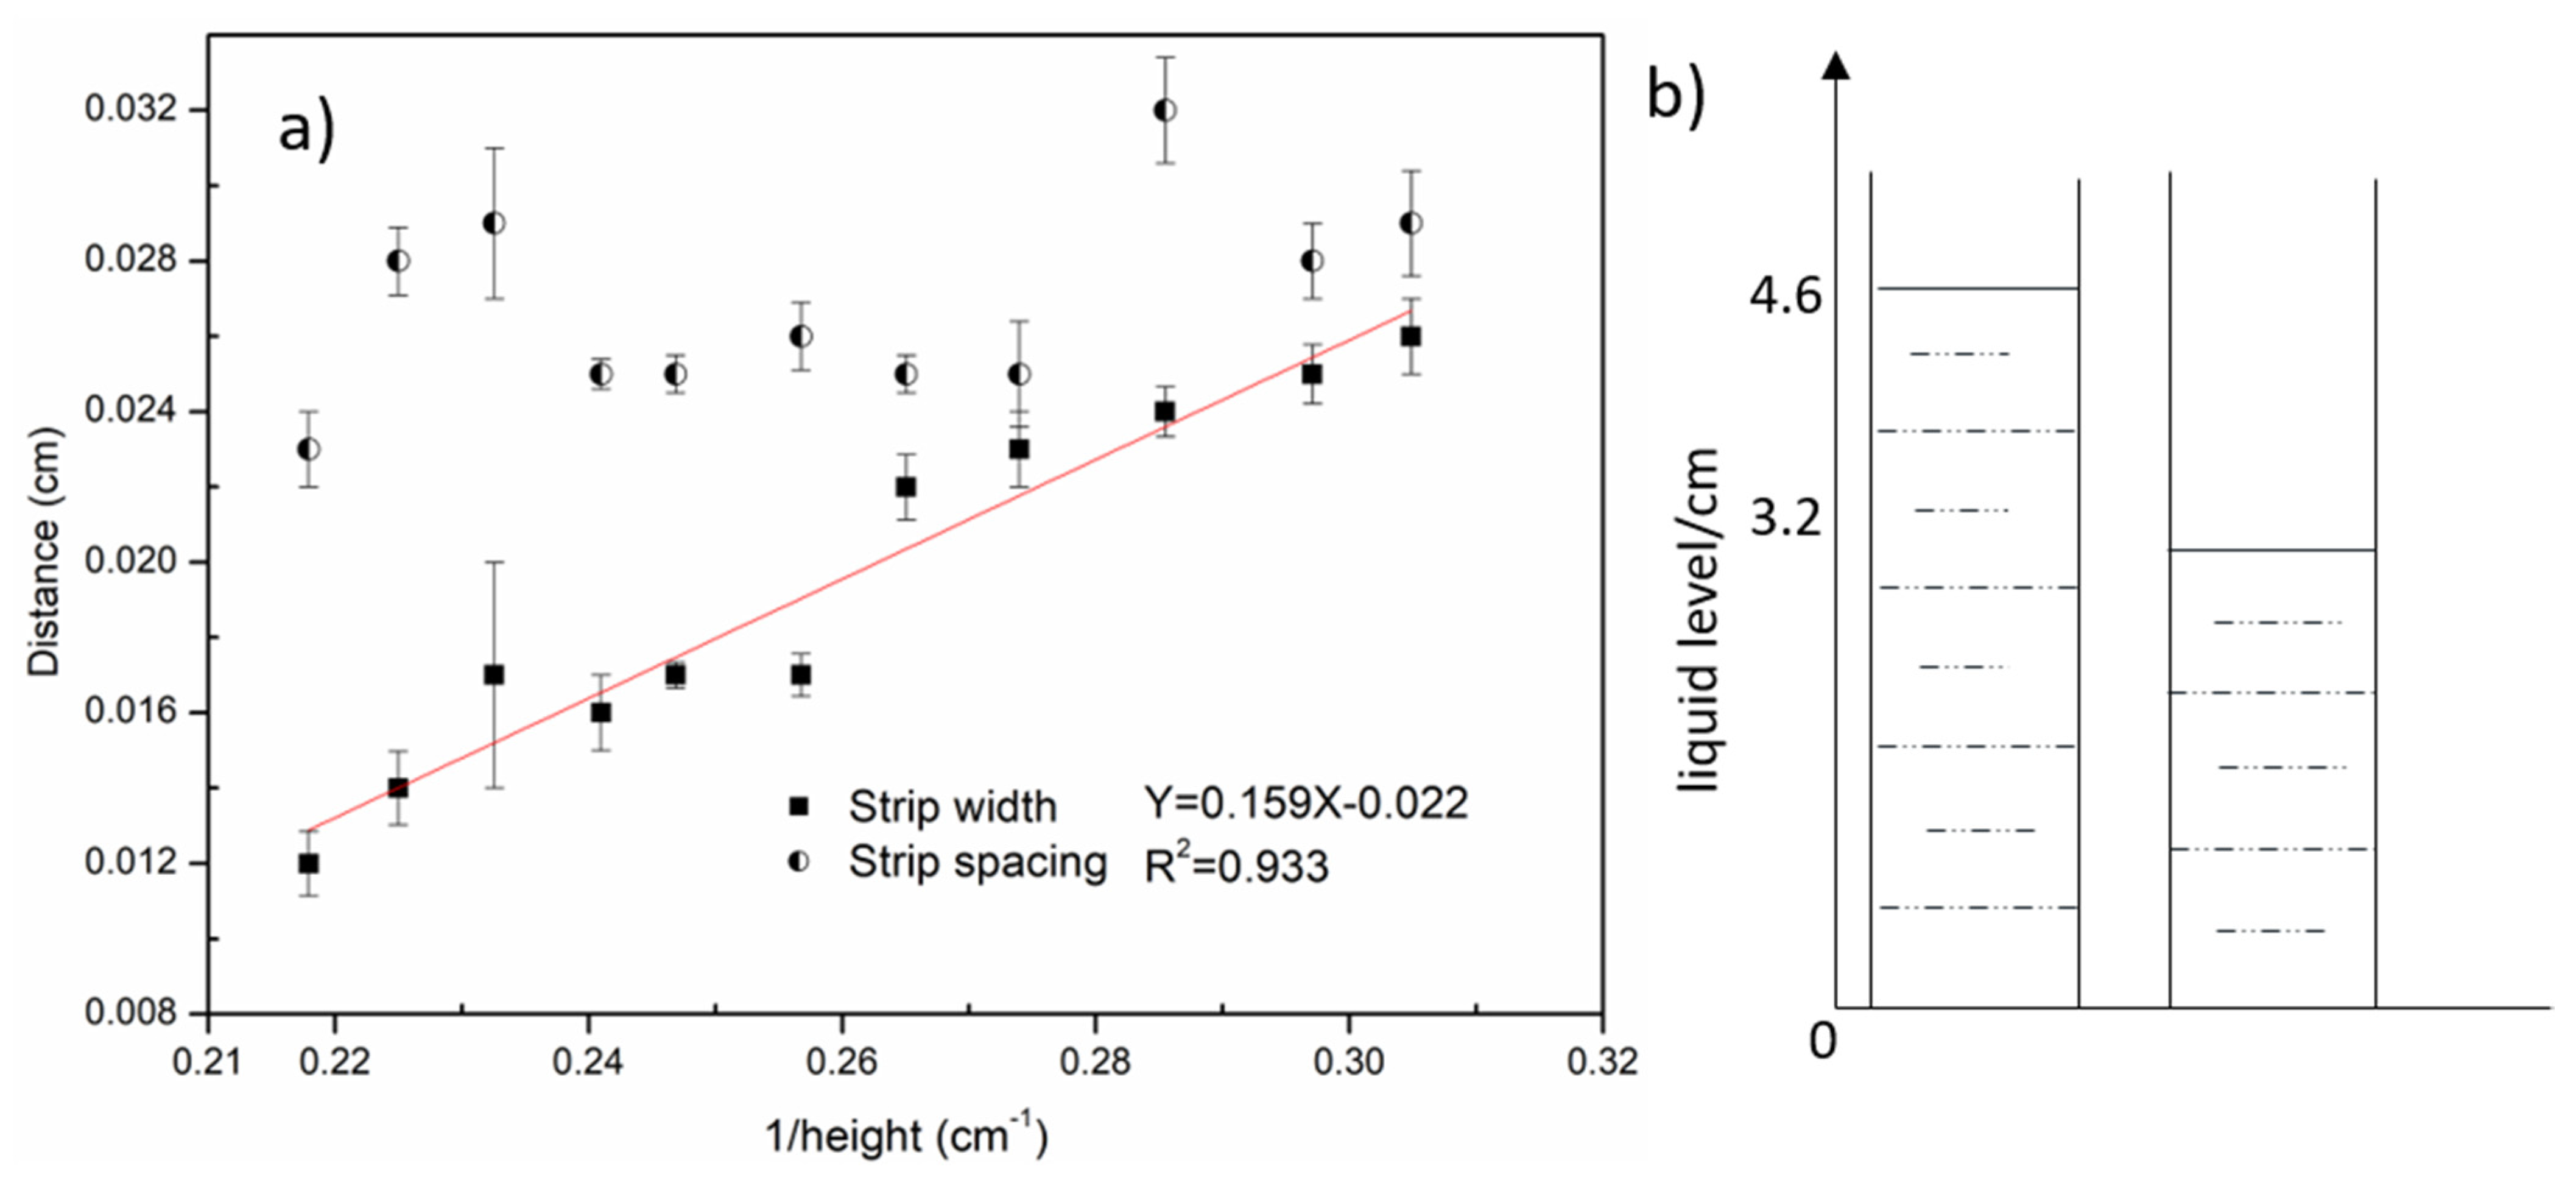
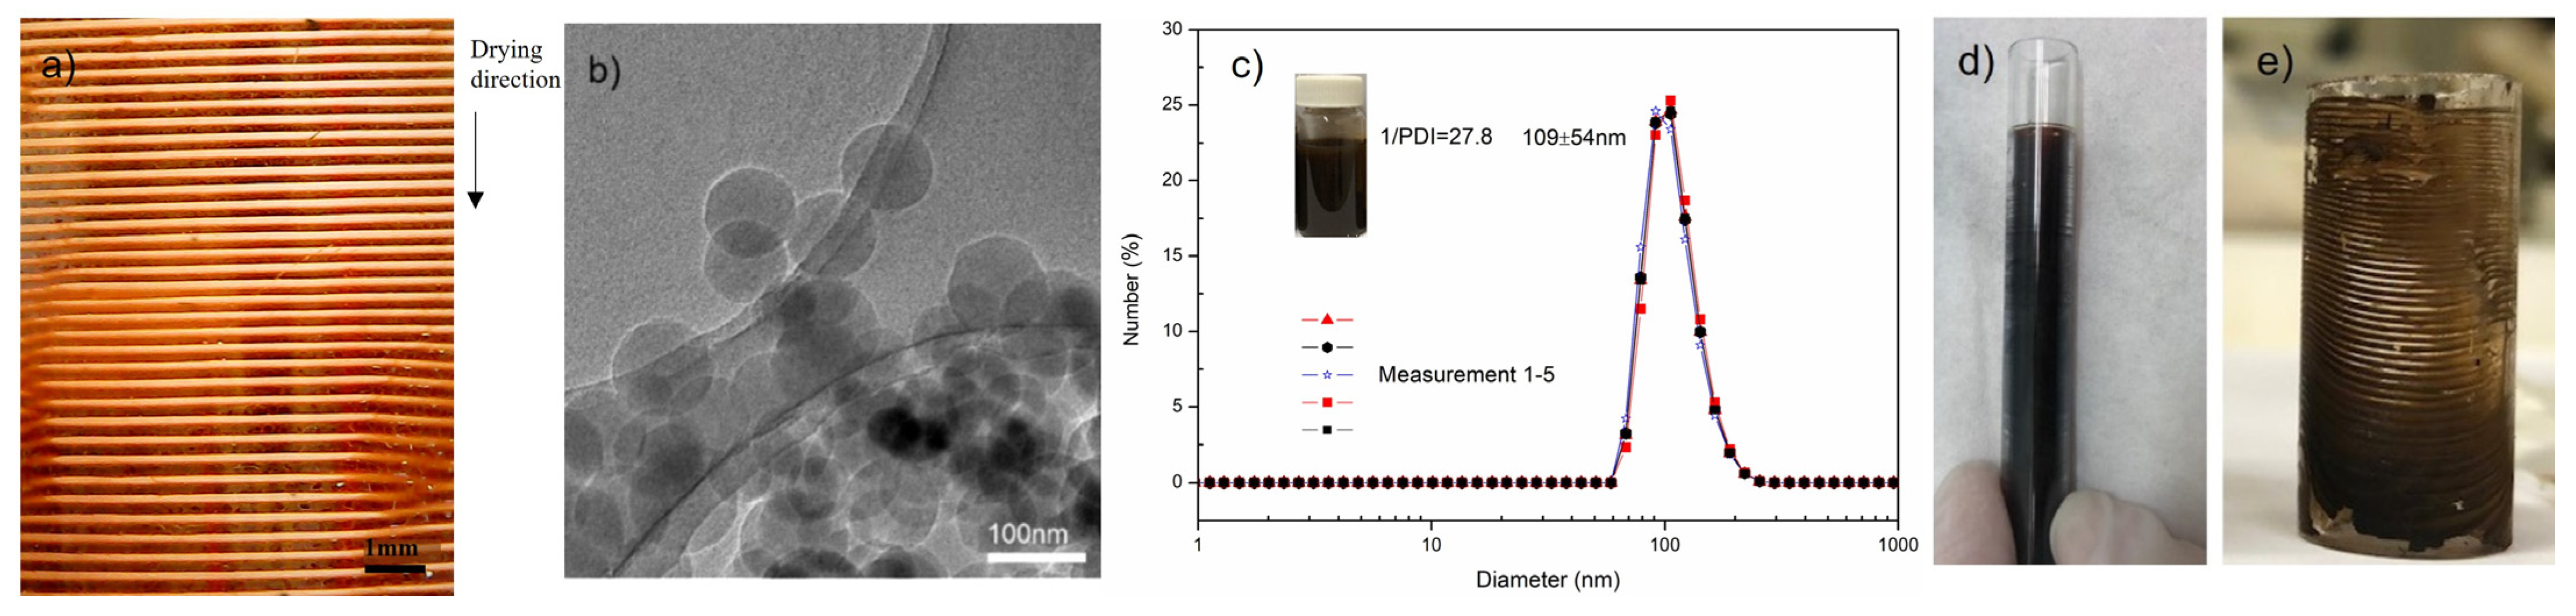
3.1. Lines or Rings of Deposited Colloidal Hydrochar on Glass Formed Due to the Evaporation of Water

Well-defined and repeated lines formed on glass substrates during the evaporation of purified colloidal hydrochar dispersions. As can be observed from Figure 1a, the lines formed in parallel with the evaporation front during the drying of the dispersion CH3.63-NaOH. The dispersion had been dialyzed towards a diluted NaOH solution. These patterns were similar to those formed in studies of other types of colloidal dispersions based on silica, PS, metals, and metal oxides, as summarized in Table 1, highlighting the type of colloids, dispersant, substrate type, geometry/method, characteristics of the patterns formed, and references. As carbon-rich colloids are widely applied in electrochemistry, gas sorption, and other domains of science and technology, we used our protocol to synthesize and purify monodisperse hydrochar colloids and tested the hypothesis that these charged colloids would undergo much of the same ring formation as similarly charged colloids do. A TEM image of the colloidal hydrochar particles in this study is presented in Figure 1b. The dispersion CH3.63 had particles with a particle size distribution of 109 ± 54 nm (95% confidence level) and a monodispersity (1/PDI) of 27.8. Indicative particle-size distributions were derived by inverse Laplace transforms and regularization and are presented in Figure 1c. It should be noted that other types of carbon-based colloids, such as graphene oxide (GO), can also be dispersed at concentrations of 30–50 g/dm3 for water and polar solvents. This dispersability is ascribed to the functional groups on the GO particles [44].
Lines formed on various substrates on evaporation of the hydrochar dispersions. They formed on glass vials and larger beakers as shown in Figure 1a and Figure 2a,b, on both sides of the plates (Figure 2c), on other glass items such as on the interfaces in the glass tubes, the glass cylinders with two open ends (Figure 1d,e), and also on other substrates such as on the interfaces of a polypropylene tube, etc. (not shown). The widths of the lines were from dozens to thousands of micrometers and comprised dense assemblies of hydrochar particles, as can be seen from the representative SEM image in Figure 2h.
Well-defined lines formed during the solvent evaporation with dispersions that either had SDS added or that had been dialyzed towards a high-pH permeate. We rationalized this formation with a tentative mechanism that is illustrated in Figure 2e,f. In the early stage of evaporation, no particles were deposited in the transparent regions between two adjacent lines (as defined in Figure 2h), while at the late stage, a thin layer (or similar) of particles was deposited also in the transparent region. The lines of deposited hydrochar formed until the very bottom of the vial or slide. We presumed that the mechanism for the ring/line formation for the deposited hydrochar was similar to those for deposited silica colloids on hydrophilic slides of glass, silica, or mica [14,46]. Following the propositions in those studies, initially, the colloidal dispersion of the hydrochar particles wetted the glass surface, a meniscus formed, and the contact line was pinned. With the water evaporating from the film surface, the particles of hydrochar flew upwards because of the convection of the water and the particle flow near the induced receding contact line. The concentration of hydrochar particles in the meniscus was expected to be higher than in the bulk of the dispersion [27], leading to a faster deposition at the drying line than closer to the bulk [21], and, as a result, the particles of hydrochar were deposited and assembled at the contact line as dense assemblies (Figure 2d). The common understanding of why the deposition of the particles stopped and started was presented in the study of Watanabe et al. [14]. Within this contextual framework, we rationalized that when water was continuously evaporated in our systems, the water-rich films, below the deposited first ring at the pinned contact line, became increasingly thinner; ultimately, the films became so thin that hydrochar particles could no longer pass through the menisci (Figure 2e) [14]. At this point, the deposition of the aggregating colloidal particles within the first line stopped. The periodicity (ring/line spacing) that was observed (cf. Figure 1 and Figure 2) has, in the literature, been related to variations in the film thickness at the water–glass interface and the size of the colloidal particles [14,27]. For the second ring (Figure 2f), the receding water–glass–air contact line had again been pinned by new colloidal particles that had been brought up to that contact line, and the deposition started over again and continued until the water film on the glass became too thin to allow the transport of the colloidal hydrochar particles. This process is illustrated in the schematics in Figure 2d–f. A similar figure is presented in the study by Watanabe et al. [14] and similar findings have been observed for the dispersion of manganese oxide, studied by Giraldo et al. [24], and silica, studied by Bodiguel et al. [45]. The transparent zones between the two adjacent lines were clearer in the early stage of the evaporation, as shown in Figure 2a,b. However, as we observed that the transparency in between rings was reduced at the later stage of the evaporation, and that thin layers of hydrochar particles also formed on the glass substrates in between the pronounced lines for concentrated dispersions, we modified the model by Watanabe et al. [14] and proposed that a thin layer of particles (or similar) formed during this stage as indicated in Figure 2g. When the concentration increased with evaporation, the height and width of both the lines and the transparent zones were related to the flow and deposit behavior of the particles, and interactions among the hydrochar particles or between hydrochar particles and the substrate surface. As expected from its lower electron density, the Hamaker constants of amorphous carbon particles [47] have been calculated to be somewhat lower than those for silica particles [48,49], with a value of 4.875 × 10⁻²⁰ J [47] for amorphous carbon and 6.6 × 10⁻²⁰ J [47] for silica; hence, carbon particles will have slightly weaker van der Waals attraction. It should also be noted that hydrochar particles are polymeric [50,51,52], so the argument is qualitative. However, notably, the hydrochar is still phase-separated from the water. Amorphous carbon has a much reduced Hamaker constant compared to isotropic forms of graphite, which have Hamaker constants between 19 and 29 × 10−20 J [53]. In addition, the hydrophilicity of hydrochar particles is high [51,54,55,56], and we have shown in a previous study [16] that colloidal hydrochar particles are negatively charged. The pH of the hydrochar dispersion after purification was 4.6 ± 0.01 and the zeta potential was around −40 mV, and in this manner, the hydrochar particles appeared relatively similar to hydrophilic silica particles.
SDS lowers the surface tension of the water–air interface and the associated contact angle [57]. The clear patterns developing after evaporation of the hydrochar dispersios with the SDS addition were somewhat contradictory to the linear stability analysis of Lyushnin et al. [23] and the Marangoni effect observed for a related system [58], from which one could have concluded that instabilities would be amplified by a decreased surface tension. Tentatively, the stability enhancement as defined by a defined line formation with the addition of SDS was instead ascribed to either the purification of the hydrochar dispersion by solubilization or the modification of the interactions among the hydrochar particles and the particles at the interfaces. The SDS concentration in the CH3.63-SDS dispersion was between 2.2–6.5 mmol/dm3. The CMC of SDS is fairly temperature independent [59,60,61]. The CMC of SDS is 8 mmol/dm3 in water without other additives or salts and at 298 K, atmospheric pressure [62]. It increases somewhat at higher temperatures and is 14 mmol/dm3 at 80 °C for pure water and 5 mmol/dm3 for a 0.1 mol/dm3 electrolyte of NaCl(aq) [63]. Ring patterns also formed on the interfaces of silica on the evaporation of the corresponding dispersion when the SDS concentration was elevated to 8.7–13 mmol/dm3, as shown in Figure S1a. For the dispersion with a higher SDS concentration, the ring width increased and became less regular. In this context, one could note that Rezende et al. showed that the evaporative deposition of silica nanoparticles from poly (N-isopropylacrylamide)-SDS dispersions formed differently oriented patterns, which were related to aspects of polymer dewetting [64]. Concerning the rings forming on the glass during the evaporation of water from the CH3.63-SDS dispersion, several rings of dense assemblies of hydrochar particles are shown in the SEM image in Figure 2h. The lines were much wider (hundreds to thousands of µm) than the diameters of the hydrochar particles, and each macroscopic ring consisted of thin and stacked lines with the height of the ring/lines ascending and then descending as can be seen in Figure 2i (the ascending side of a ring). Each line consisted of many hydrochar particles as shown in Figure 2j, and we believe the hydrochar particle arrangement was very similar to that in Figure 2 in the study of Valeria et al. [65], and to better understand the mechanism of line patterns, similar Voronoi diagrams of the arrangement of our hydrochar particles could be executed in the future. The average particle diameter was separately determined to be 109 ± 54 nm (Figure 1c). These observations were consistent with studies of lines in other kinds of inorganic colloids or nanoparticles, such as metals and silica on hydrophilic substrates [24,26].
We had expected the line width and line spacing in principle to vary with the concentration of particles in the remaining dispersion, and such variations were studied by Watanabe et al. [14] and Giraldo et al. [24] after the drying of colloidal silica dispersions in glass cylinders. The CH3.63-SDS dispersion was dried, and the line width and line spacing of the deposited hydrochar on the glass were recorded and are displayed in Figure 3a. The rings formed on the glass in the upper part of the glass vial, as is highlighted in Figure 3b. The variations in line width and line spacing were presented as a function of the inverse height of the remaining liquid in the vials, which was proportional to the particle concentration. We presumed this assumption to be correct at least at the beginning of the evaporation when only a minor amount of colloids had been deposited. The width of the deposited rings increased linearly with the inverse height (and particle concentration). We related this to the increased concentration and that more particles were transported to the pinned meniscus, where a particulate film was growing. It seemed as if the particle concentration affected the particle flux supplied to the line-growth region, which was directly related to the line width. The line spacing (distance in between the rings) did not depend on the particle concentration in the remaining dispersion.
Items with other geometries and other dispersants were also tested for line formation due to water evaporation from purified hydrochar dispersions. A picture of an immersed cylinder with two open ends where rings formed both inside and outside on the cylinder glass is presented in Figure 1e. Rings of deposited hydrochar formed when the CH3.63 dispersion was diluted by adding 12.5–62.5% (volume) of water or by adding ethanol of up to 87.5% (volume) before the drying. The rings are displayed in Figure S2a–d (a photo of the evaporating dispersion CH3.63-NaOH in a vial is shown for comparison in Figure S2e.)

3.2. Mud-Like Patterns and Cracked Films

Without SDS or pH adjustments, horizontal lines formed initially on the glass but a tile-like pattern formed for the dispersion of CH3.63 a bit further down on the vial. This tile-like pattern is shown in Figure 2k. The pattern vaguely resembled those formed during the drying of mud [66,67]; however, the cracks were more well organized in the tile-like patterns of this study. The organization of the cracks can be understood using the literature on cracks formed in drying suspensions and coatings of colloids [68,69,70,71,72]. We ascribe the relatively well-organized tile-like formation of cracks (Figure 2k) to primary cracks nucleating and growing transverse to the liquid front. These primary cracks stretched from the top to the bottom, as shown in Figure 2k. Second, multiple cracks formed from these primary cracks. The orthogonality of the secondary branching/cracks with respect to the primary cracks is tentatively ascribed to effects relating to the drying front (primary cracks) and the pinned liquid surface (secondary cracks). The ultimate fracture of the colloidal coating due to water evaporation is understood using the reasoning of Allain and Limat [71]. The concentration effect was delicate, and when CH3.63 was diluted with 15–62.5 wt% of water, rings formed instead (Figure S2a–c) throughout the evaporation process (the pieces missing (vacancies) in Figure 2k relate to a loss of pieces during the glass-cutting procedure used for the sample preparation for the SEM).

4. Conclusions

Patterns formed when aqueous dispersions of purified hydrochar particles were dried on glass and polypropylene items. Lines of deposited colloidal hydrochar formed in parallel with the drying front on the surfaces of the items when the purified colloidal hydrochar dispersion had been dialyzed against a dilute NaOH solution or when SDS had been added. It was observed that each macroscopic line comprised several small stacks of assembled particles, and for the highest concentrations of particles, hydrochar colloids were also deposited on the glass in between the lines. The instabilities in the ring formation decreased with the addition of a small amount of SDS, but with higher SDS concentrations, less well-defined patterns were observed. The line widths increased linearly with the inverse height remaining in the vials. Without high-pH treatment or SDS addition, tile-like fractured patterns formed in the deposited coatings on drying with longitudinal and transverse cracks.
Similar lines have been shown to form during the drying of dispersions of silica and polymer colloids, etc., and we tested the hypothesis that these charge carbon colloids would undergo much the same ring formation as similarly charged colloids do on evaporative deposition. We modified the mechanism in the literature and concluded that when the particle concentration was sufficiently low, the deposition of hydrochar particles within a line ended and for the concentrated dispersions, thin layers of hydrochar particles also formed on the glass substrates in between the pronounced lines. At sufficiently high particle concentrations and neutral pH (without SDS added), tile-like patterns formed. Our interpretation is that a thick layer of deposited and assembled hydrochar colloids formed, contiguous longitudinal cracks nucleated and grew (along the drying direction), secondary transverse cracks nucleated and grew in parallel with the pinned liquid, and ultimately the thick layer fractured along the cracks in the final stage of water evaporation.
In the future, it could be relevant to further study the formation and fundamentals of the assembling patterns and the fractured layers, as well as potential applications. Line printing of particles can likely be performed better with other methods industrially, but the approach of interface-driven assembly and deposition of particles could speculatively be useful in cases when in situ line formation is needed. Further detailed studies of the effect of the SDS concentration could be relevant.

Supplementary Materials

The following supporting information can be downloaded at: https://www.mdpi.com/article/10.3390/colloids6020036/s1. Figure S1: Strip patterns formed on evaporation of the CH3.63-SDS dispersion with (a) 6 drops of SDS added. The concentration of SDS was here initially above the critical micelle concentration (CMC), and (b) 1.5 drops of SDS; here, the concentration of SDS was initially less than the CMC. (The comparisons with the CMC was performed by assuming that the SDS concentration was not largely affected by the hydrochar.); Figure S2: Photographs of glass vials (1.5 cm in diameter) with rings formed inside by evaporating versions of CH3.63 that had been diluted by adding (a) 12.5% (volume), (b) 38.5 and (c) 62.5% of water, (d) CH3.63 with 87.5% (volume) of ethanol (magnified patterns from the top and bottom of the vial in (d) are displayed), and (e) from the dispersion CH3.63-NaOH after evaporation.

Author Contributions

X.W., methodology, data curation, visualization, writing—original draft; N.H., methodology, conceptualization, writing—review and editing, supervision, funding acquisition. All authors have read and agreed to the published version of the manuscript.

Funding

This study was supported by the EU-MSCA-ETN-GreenCarbon project 721991.

Institutional Review Board Statement

Not applicable.

Informed Consent Statement

Not applicable.

Data Availability Statement

Not applicable.

Conflicts of Interest

The authors declare no conflict of interest.

References

  1. Ohara, P.C.; Heath, J.R.; Gelbart, W.M. Self-Assembly of Submicrometer Rings of Particles from Solutions of Nanoparticles. Angew. Chem. Int. Ed. Engl. 1997, 36, 1078–1080. [Google Scholar] [CrossRef]
  2. Xia, Y.; Gates, B.; Yin, Y.; Lu, Y. Monodispersed Colloidal Spheres: Old Materials with New Applications. Adv. Mater. 2000, 12, 693–713. [Google Scholar] [CrossRef]
  3. Murray, C.B.; Sun, S.; Gaschler, W.; Doyle, H.; Betley, T.A.; Kagan, C.R. Colloidal Synthesis of Nanocrystals and Nanocrystal Superlattices. IBM J. Res. Dev. 2001, 45, 47–56. [Google Scholar] [CrossRef]
  4. Xia, Y.; Nguyen, T.D.; Yang, M.; Lee, B.; Santos, A.; Podsiadlo, P.; Tang, Z.; Glotzer, S.C.; Kotov, N.A. Self-Assembly of Self-Limiting Monodisperse Supraparticles from Polydisperse Nanoparticles. Nat. Nanotechnol. 2011, 6, 580–587. [Google Scholar] [CrossRef]
  5. Jiang, P.; Bertone, J.F.; Colvin, V.L. A Lost-Wax Approach to Monodisperse Colloids and Their Crystals. Science 2001, 291, 453–457. [Google Scholar] [CrossRef]
  6. van Dommelen, R.; Fanzio, P.; Sasso, L. Surface Self-Assembly of Colloidal Crystals for Micro- and Nano-Patterning. Adv. Colloid Interface Sci. 2018, 251, 97–114. [Google Scholar] [CrossRef]
  7. Murray, C.B.; Kagan, C.R.; Bawendi, M.G. Synthesis and Characterization of Monodisperse Nanocrystals and Close-Packed Nanocrystal Assemblies. Annu. Rev. Mater. Sci. 2000, 30, 545–610. [Google Scholar] [CrossRef] [Green Version]
  8. Weissman, J.M.; Sunkara, H.B.; Tse, A.S.; Asher, S.A. Thermally Switchable Periodicities and Diffraction from Mesoscopically Ordered Materials. Science 1996, 274, 959–963. [Google Scholar] [CrossRef] [Green Version]
  9. Holtz, J.H.; Asher, S.A. Polymerized Colloidal Crystal Hydrogel Films as Intelligent Chemical Sensing Materials. Nature 1997, 389, 829–832. [Google Scholar] [CrossRef]
  10. Lee, K.; Asher, S.A. Photonic Crystal Chemical Sensors:  PH and Ionic Strength. J. Am. Chem. Soc. 2000, 122, 9534–9537. [Google Scholar] [CrossRef]
  11. Asher, S.A.; Alexeev, V.L.; Goponenko, A.V.; Sharma, A.C.; Lednev, I.K.; Wilcox, C.S.; Finegold, D.N. Photonic Crystal Carbohydrate Sensors:  Low Ionic Strength Sugar Sensing. J. Am. Chem. Soc. 2003, 125, 3322–3329. [Google Scholar] [CrossRef] [PubMed]
  12. Sun, S.; Murray, C.B.; Weller, D.; Folks, L.; Moser, A. Monodisperse FePt Nanoparticles and Ferromagnetic FePt Nanocrystal Superlattices. Science 2000, 287, 1989–1992. [Google Scholar] [CrossRef] [PubMed]
  13. Soukoulis, C.M. Photonic Band Gap Materials; Springer Science & Business Media: Berlin/Heidelberg, Germany, 2012; ISBN 978-94-009-1665-4. [Google Scholar]
  14. Watanabe, S.; Inukai, K.; Mizuta, S.; Miyahara, M.T. Mechanism for Stripe Pattern Formation on Hydrophilic Surfaces by Using Convective Self-Assembly. Langmuir 2009, 25, 7287–7295. [Google Scholar] [CrossRef] [PubMed]
  15. Tétreault, N.; Míguez, H.; Ozin, G.A. Silicon Inverse Opal—A Platform for Photonic Bandgap Research. Adv. Mater. 2004, 16, 1471–1476. [Google Scholar] [CrossRef]
  16. Wang, X.; Hao, W.; Zhang, P.; Szego, A.E.; Svensson, G.; Hedin, N. Macroscopic Rods from Assembled Colloidal Particles of Hydrothermally Carbonized Glucose and Their Use as Templates for Silicon Carbide and Tricopper Silicide. J. Colloid Interface Sci. 2021, 602, 480–489. [Google Scholar] [CrossRef]
  17. Yunker, P.J.; Still, T.; Lohr, M.A.; Yodh, A.G. Suppression of the Coffee-Ring Effect by Shape-Dependent Capillary Interactions. Nature 2011, 476, 308–311. [Google Scholar] [CrossRef]
  18. Deegan, R.D.; Bakajin, O.; Dupont, T.F.; Huber, G.; Nagel, S.R.; Witten, T.A. Capillary Flow as the Cause of Ring Stains from Dried Liquid Drops. Nature 1997, 389, 827–829. [Google Scholar] [CrossRef]
  19. Deegan, R.D.; Bakajin, O.; Dupont, T.F.; Huber, G.; Nagel, S.R.; Witten, T.A. Contact Line Deposits in an Evaporating Drop. Phys. Rev. E 2000, 62, 756–765. [Google Scholar] [CrossRef] [Green Version]
  20. Hu, H.; Larson, R.G. Evaporation of a Sessile Droplet on a Substrate. J. Phys. Chem. B 2002, 106, 1334–1344. [Google Scholar] [CrossRef]
  21. Adachi, E.; Dimitrov, A.S.; Nagayama, K. Stripe Patterns Formed on a Glass Surface during Droplet Evaporation. Langmuir 1995, 11, 1057–1060. [Google Scholar] [CrossRef]
  22. Xu, J.; Xia, J.; Lin, Z. Evaporation-Induced Self-Assembly of Nanoparticles from a Sphere-on-Flat Geometry. Angew. Chem. Int. Ed. 2007, 46, 1860–1863. [Google Scholar] [CrossRef]
  23. Lyushnin, A.V.; Golovin, A.A.; Pismen, L.M. Fingering Instability of Thin Evaporating Liquid Films. Phys. Rev. E Stat. Nonlin. Soft Matter. Phys. 2002, 65, 021602. [Google Scholar] [CrossRef]
  24. Giraldo, O.; Durand, J.P.; Ramanan, H.; Laubernds, K.; Suib, S.L.; Tsapatsis, M.; Brock, S.L.; Marquez, M. Dynamic Organization of Inorganic Nanoparticles into Periodic Micrometer-Scale Patterns. Angew. Chem. Int. Ed. 2003, 42, 2905–2909. [Google Scholar] [CrossRef]
  25. Huang, J.; Kim, F.; Tao, A.R.; Connor, S.; Yang, P. Spontaneous Formation of Nanoparticle Stripe Patterns through Dewetting. Nat. Mater. 2005, 4, 896–900. [Google Scholar] [CrossRef]
  26. Abkarian, M.; Nunes, J.; Stone, H.A. Colloidal Crystallization and Banding in a Cylindrical Geometry. J. Am. Chem. Soc. 2004, 126, 5978–5979. [Google Scholar] [CrossRef]
  27. Colosqui, C.E.; Morris, J.F.; Stone, H.A. Hydrodynamically Driven Colloidal Assembly in Dip Coating. Phys. Rev. Lett. 2013, 110, 188302. [Google Scholar] [CrossRef] [Green Version]
  28. Bhardwaj, R.; Fang, X.; Attinger, D. Pattern Formation during the Evaporation of a Colloidal Nanoliter Drop: A Numerical and Experimental Study. New J. Phys. 2009, 11, 075020. [Google Scholar] [CrossRef]
  29. Okubo, T. 5-Drying Patterns of Dispersions and Solutions. In Colloidal Organization; Okubo, T., Ed.; Elsevier: Amsterdam, The Netherlands, 2015; pp. 282–423. ISBN 978-0-12-802163-7. [Google Scholar]
  30. Volpe, M.; Messineo, A.; Mäkelä, M.; Barr, M.R.; Volpe, R.; Corrado, C.; Fiori, L. Reactivity of Cellulose during Hydrothermal Carbonization of Lignocellulosic Biomass. Fuel Processing Technol. 2020, 206, 106456. [Google Scholar] [CrossRef]
  31. Wnukowski, M.; Owczarek, P.; Niedźwiecki, Ł. Wet Torrefaction of Miscanthus–Characterization of Hydrochars in View of Handling, Storage and Combustion Properties. J. Ecol. Eng. 2015, 16, 161–167. [Google Scholar] [CrossRef] [Green Version]
  32. Bach, Q.-V.; Tran, K.-Q.; Skreiberg, Ø.; Khalil, R.A.; Phan, A.N. Effects of Wet Torrefaction on Reactivity and Kinetics of Wood under Air Combustion Conditions. Fuel 2014, 137, 375–383. [Google Scholar] [CrossRef] [Green Version]
  33. Gong, Y.; Xie, L.; Li, H.; Wang, Y. Sustainable and Scalable Production of Monodisperse and Highly Uniform Colloidal Carbonaceous Spheres Using Sodium Polyacrylate as the Dispersant. Chem. Commun. 2014, 50, 12633–12636. [Google Scholar] [CrossRef] [PubMed]
  34. Zhao, Q.; Tao, S.; Miao, X.; Zhu, Y. A Green, Rapid, Scalable and Versatile Hydrothermal Strategy to Fabricate Monodisperse Carbon Spheres with Tunable Micrometer Size and Hierarchical Porosity. Chem. Eng. J. 2019, 372, 1164–1173. [Google Scholar] [CrossRef]
  35. Zheng, M.; Liu, Y.; Xiao, Y.; Zhu, Y.; Guan, Q.; Yuan, D.; Zhang, J. An Easy Catalyst-Free Hydrothermal Method to Prepare Monodisperse Carbon Microspheres on a Large Scale. J. Phys. Chem. C 2009, 113, 8455–8459. [Google Scholar] [CrossRef]
  36. Wang, Q.; Li, H.; Chen, L.; Huang, X. Monodispersed Hard Carbon Spherules with Uniform Nanopores. Carbon 2001, 39, 2211–2214. [Google Scholar] [CrossRef]
  37. Volpe, M.; Wüst, D.; Merzari, F.; Lucian, M.; Andreottola, G.; Kruse, A.; Fiori, L. One Stage Olive Mill Waste Streams Valorisation via Hydrothermal Carbonisation. Waste Manag. 2018, 80, 224–234. [Google Scholar] [CrossRef]
  38. Kambo, H.S.; Dutta, A. A Comparative Review of Biochar and Hydrochar in Terms of Production, Physico-Chemical Properties and Applications. Renew. Sustain. Energy Rev. 2015, 45, 359–378. [Google Scholar] [CrossRef]
  39. Funke, A.; Ziegler, F. Hydrothermal Carbonization of Biomass: A Summary and Discussion of Chemical Mechanisms for Process Engineering. Biofuel Bioprod. Bior. 2010, 4, 160–177. [Google Scholar] [CrossRef]
  40. Hu, B.; Wang, K.; Wu, L.; Yu, S.-H.; Antonietti, M.; Titirici, M.-M. Engineering Carbon Materials from the Hydrothermal Carbonization Process of Biomass. Adv. Mater. 2010, 22, 813–828. [Google Scholar] [CrossRef]
  41. Lucian, M.; Volpe, M.; Gao, L.; Piro, G.; Goldfarb, J.L.; Fiori, L. Impact of Hydrothermal Carbonization Conditions on the Formation of Hydrochars and Secondary Chars from the Organic Fraction of Municipal Solid Waste. Fuel 2018, 233, 257–268. [Google Scholar] [CrossRef]
  42. Raval, N.; Maheshwari, R.; Kalyane, D.; Youngren-Ortiz, S.R.; Chougule, M.B.; Tekade, R.K. Importance of Physicochemical Characterization of Nanoparticles in Pharmaceutical Product Development. In Basic Fundamentals of Drug Delivery; Elsevier: Amsterdam, The Netherlands, 2019; pp. 369–400. ISBN 978-0-12-817909-3. [Google Scholar]
  43. Ragheb, R.; Nobbmann, U. Multiple Scattering Effects on Intercept, Size, Polydispersity Index, and Intensity for Parallel (VV) and Perpendicular (VH) Polarization Detection in Photon Correlation Spectroscopy. Sci. Rep. 2020, 10, 21768. [Google Scholar] [CrossRef]
  44. Damasceno, J.P.V.; Kubota, L.T. Colloidal Chemistry as a Guide to Design Intended Dispersions of Carbon Nanomaterials. Mater. Today Chem. 2021, 21, 100526. [Google Scholar] [CrossRef]
  45. Bodiguel, H.; Doumenc, F.; Guerrier, B. Stick−Slip Patterning at Low Capillary Numbers for an Evaporating Colloidal Suspension. Langmuir 2010, 26, 10758–10763. [Google Scholar] [CrossRef] [PubMed]
  46. Sawadaishi, T.; Shimomura, M. Two-Dimensional Patterns of Ultra-Fine Particles Prepared by Self-Organization. Colloids Surf. A Physicochem. Eng. Asp. 2005, 257–258, 71–74. [Google Scholar] [CrossRef]
  47. Sun, W.; Zeng, Q.; Yu, A. Interaction Forces between Carbon Nanospheres: A Molecular Dynamics Simulation Study. Chem. Eng. Sci. 2015, 121, 23–31. [Google Scholar] [CrossRef]
  48. Sun, W.; Zeng, Q.; Yu, A. Calculation of Noncontact Forces between Silica Nanospheres. Langmuir 2013, 29, 2175–2184. [Google Scholar] [CrossRef]
  49. Bergström, L. Hamaker Constants of Inorganic Materials. Adv. Colloid Interface Sci. 1997, 70, 125–169. [Google Scholar] [CrossRef]
  50. Titirici, M.-M. Sustainable Carbon Materials from Hydrothermal Processes; John Wiley & Sons: London, UK, 2013; ISBN 978-1-118-62220-9. [Google Scholar]
  51. Titirici, M.-M.; Thomas, A.; Antonietti, M. Replication and Coating of Silica Templates by Hydrothermal Carbonization. Adv. Funct. Mater. 2007, 17, 1010–1018. [Google Scholar] [CrossRef]
  52. Titirici, M.-M.; White, R.J.; Falco, C.; Sevilla, M. Black Perspectives for a Green Future: Hydrothermal Carbons for Environment Protection and Energy Storage. Energy Environ. Sci. 2012, 5, 6796. [Google Scholar] [CrossRef]
  53. Tolias, P. Lifshitz Calculations of Hamaker Constants for Fusion Relevant Materials. Fusion Eng. Des. 2018, 133, 110–116. [Google Scholar] [CrossRef]
  54. Titirici, M.-M.; Antonietti, M. Chemistry and Materials Options of Sustainable Carbon Materials Made by Hydrothermal Carbonization. Chem. Soc. Rev. 2009, 39, 103–116. [Google Scholar] [CrossRef]
  55. Sevilla, M.; Fuertes, A.B. Chemical and Structural Properties of Carbonaceous Products Obtained by Hydrothermal Carbonization of Saccharides. Chem.-A Eur. J. 2009, 15, 4195–4203. [Google Scholar] [CrossRef] [PubMed]
  56. Sevilla, M.; Fuertes, A.B. The Production of Carbon Materials by Hydrothermal Carbonization of Cellulose. Carbon 2009, 47, 2281–2289. [Google Scholar] [CrossRef] [Green Version]
  57. Zhao, T.; Mu, G. The Adsorption and Corrosion Inhibition of Anion Surfactants on Aluminium Surface in Hydrochloric Acid. Corros. Sci. 1999, 41, 1937–1944. [Google Scholar] [CrossRef]
  58. Mizev, A.; Trofimenko, A.; Schwabe, D.; Viviani, A. Instability of Marangoni Flow in the Presence of an Insoluble Surfactant. Experiments. Eur. Phys. J. Spec. Top. 2013, 219, 89–98. [Google Scholar] [CrossRef]
  59. Shanks, P.C.; Franses, E.I. Estimation of Micellization Parameters of Aqueous Sodium Dodecyl Sulfate from Conductivity Data. J. Phys. Chem. 1992, 96, 1794–1805. [Google Scholar] [CrossRef]
  60. Thongngam, M.; McClements, D.J. Influence of PH, Ionic Strength, and Temperature on Self-Association and Interactions of Sodium Dodecyl Sulfate in the Absence and Presence of Chitosan. Langmuir 2005, 21, 79–86. [Google Scholar] [CrossRef]
  61. Chatterjee, A.; Moulik, S.P.; Sanyal, S.K.; Mishra, B.K.; Puri, P.M. Thermodynamics of Micelle Formation of Ionic Surfactants:  A Critical Assessment for Sodium Dodecyl Sulfate, Cetyl Pyridinium Chloride and Dioctyl Sulfosuccinate (Na Salt) by Microcalorimetric, Conductometric, and Tensiometric Measurements. J. Phys. Chem. B 2001, 105, 12823–12831. [Google Scholar] [CrossRef]
  62. Mukerjee, P.; Mysels, K.J. Critical Micelle Concentrations of Aqueous Surfactant Systems; US Government Printing Office: Washington, DC, USA, 1971. [Google Scholar]
  63. Paula, S.; Sues, W.; Tuchtenhagen, J.; Blume, A. Thermodynamics of Micelle Formation as a Function of Temperature: A High Sensitivity Titration Calorimetry Study. J. Phys. Chem. 1995, 99, 11742–11751. [Google Scholar] [CrossRef]
  64. Rezende, C.A.; Lee, L.-T.; Galembeck, F. Liquid Templating for Nanoparticle Organization into Complex Patterns. Langmuir 2007, 23, 2824–2828. [Google Scholar] [CrossRef]
  65. Lotito, V.; Zambelli, T. Pattern Formation in Binary Colloidal Assemblies: Hidden Symmetries in a Kaleidoscope of Structures. Langmuir 2018, 34, 7827–7843. [Google Scholar] [CrossRef]
  66. Shepidchenko, T.; Zhang, J.; Tang, X.; Liu, T.; Dong, Z.; Zheng, G.; Yang, L. Experimental Study of the Main Controlling Factors of Desiccation Crack Formation from Mud to Shale. J. Pet. Sci. Eng. 2020, 194, 107414. [Google Scholar] [CrossRef]
  67. Banerjee, S.; Kundu, A.; Eriksson, P.G.; Sinha, S. Investigation on the Possible Control of Grain Size on Development of ‘Mud Cracks’: A Preliminary Experimental Study of Recent Gangetic Alluvial Samples, West Bengal, India. Arab. J. Geosci. 2021, 14, 106. [Google Scholar] [CrossRef]
  68. Singh, K.B.; Tirumkudulu, M.S. Cracking in Drying Colloidal Films. Phys. Rev. Lett. 2007, 98, 218302. [Google Scholar] [CrossRef] [PubMed] [Green Version]
  69. Dufresne, E.R.; Corwin, E.I.; Greenblatt, N.A.; Ashmore, J.; Wang, D.Y.; Dinsmore, A.D.; Cheng, J.X.; Xie, X.S.; Hutchinson, J.W.; Weitz, D.A. Flow and Fracture in Drying Nanoparticle Suspensions. Phys. Rev. Lett. 2003, 91, 224501. [Google Scholar] [CrossRef] [Green Version]
  70. Bohn, S.; Pauchard, L.; Couder, Y. Hierarchical Crack Pattern as Formed by Successive Domain Divisions. Phys. Rev. E 2005, 71, 046214. [Google Scholar] [CrossRef] [Green Version]
  71. Allain, C.; Limat, L. Regular Patterns of Cracks Formed by Directional Drying of a Collodial Suspension. Phys. Rev. Lett. 1995, 74, 2981–2984. [Google Scholar] [CrossRef]
  72. Bohn, S.; Platkiewicz, J.; Andreotti, B.; Adda-Bedia, M.; Couder, Y. Hierarchical Crack Pattern as Formed by Successive Domain Divisions. II. From Disordered to Deterministic Behavior. Phys. Rev. E 2005, 71, 046215. [Google Scholar] [CrossRef]
Figure 1. (a) An optical image of the lines that formed on evaporation of a colloidal dispersion of hydrochar CH3.63-NaOH in a glass vial; (b) TEM image of the hydrochar particles; (c) the monodispersity and number particle size distribution (with a confidence level of 95% for the deviation) of the standard dispersion of CH3.63, measured by dynamic light scattering; (d) a photo of a glass tube; and (e) an immersed glass cylinder with two open ends with rings formed both inside and outside due to the evaporation of CH3.63-SDS, individually.
Colloids 06 00036 g001
Figure 2. (ac) Photographs of evaporating CH3.63-SDS show that rings could form with both cylindrical and plate geometries (a) in a glass beaker, (b) in a glass vial, and (c) lines on both sides of a glass plate; (df) illustration of the mechanism of the line pattern formation of the light dispersion on glass substrates (a similar figure is presented in the study by Watanabe et al. [14]. Adapted with permission from Watanabe et al., Langmuir; published by ACS, 2009); (g) formation of the line patterns and the transparent layer between two adjacent lines of the concentrated dispersion on glass substrates; SEM images of CH3.63-SDS evaporation indicated; (h) parallel rings, ring spacing, and transparent regions; (i) each ring consisted of thin and stacked small layers; (j) each layer is assembled from spherical particles of hydrochar; and (k) is an example SEM image showing patterns formed in a glass vial by evaporating water from CH3.63. The insert photo presented the macro morphology of the corresponding patterns of hydrochar particles formed on the glass interface after the evaporation of water from the purified hydrochar dispersions (to see the patterns clearly, a light was inserted through the top of the vial).
Colloids 06 00036 g002
Figure 3. (a) Ring width and ring spacing as the 1/height of receding liquid level with standard deviations (the particle concentration increased with 1/height) for the rings that formed due to the evaporation of water from a purified hydrochar dispersion CH3.63–SDS; (b) measurement of the height of the receding liquid level in a glass vial.
Colloids 06 00036 g003
Table 1. Line patterns formed on substrates for colloidal dispersions during the evaporation of the dispersants (solvents).
Colloid TypeDispersantSubstrateGeometry/MethodPattern Alignment vs. Drying FrontReference
Polystyrene (PS)WaterBorosilicate glassDrop on flatParallelAdachi et al. [21]
CdSe/ZnS quantum dotsTolueneSiliconDrop on flatParallel then orthogonalXu et al. [22]
PSEthanol etc.Glass capillaryStandstill capillaryParallelAbkarian et al. [26]
SilicaWaterGlass plateStandstill slideParallelBodiguel et al. [45]
Manganese oxideMixture of water and 2-butanolGlass slideStandstill slideParallelGiraldo et al. [24]
SilicaWater and ethanol mixtureSolvophilic substratesDip coatingParallelWatanabe et al. [14]
Gold or silver nanoparticlesWaterSiO2/SiDip coatingOrthogonalHuang et al. [25]
Spherical hydrochar particlesWater, water with SDS addition, water with pH adjusted, ethanol, or the mixture of water and ethanolGlass vials, tubes, slides and two end opening cylinders, etc.; polypropylene tubesStandstill substratesParallel, parallel then orthogonal or –likeThis study
Publisher’s Note: MDPI stays neutral with regard to jurisdictional claims in published maps and institutional affiliations.

