As shown previously [
28,
29,
30], two oppositely charged surfactants dissolved in pure water form ion pairs, in the following also called dimers. Such dimers can show much higher surface activity than the single surfactants. Their molecular geometry, i.e., the chain lengths of the two surfactants directly influences the dimer’s surface activity. In the present work, we investigated catanionic surfactants with a medium chain length (C
12) mixed with surfactants having a long (C
16) or a short (C
6) alkyl chain, respectively.
4.1. Equilibrium Interfacial Tension Isotherms
As shown in
Figure 1, the equilibrium adsorption isotherms of the two equimolar mixtures [NaC
12SO
4 + C
16TAB] and [NaC
16SO
4 + C
12TAB] are almost identical, although these two catanionics have different constituents. The reason lays in the similar geometry of the formed dimers, i.e., both dimers possess one positive and one negative charge accompanied with one C
12 and one C
16 chain (total of 28 carbon atoms in the alkyl chains).
In
Figure 2, the adsorption isotherms of mixtures of [NaC
12SO
4 + C
6TAB] and [NaC
6SO
4 + C
12TAB] are shown. Here we have a total of 18 carbon atoms in the alkyl chains, and again visually identical isotherms are obtained, i.e., the two resulting dimers exhibit similar surface activities.
Fitting the experimental results in
Figure 1 and
Figure 2 with the Frumkin model, we obtain the results summarized in
Table 1 and
Table 2. Although the values of the fitting parameters show slight differences, the shapes of the adsorption isotherm curves shown in
Figure 1 and
Figure 2, respectively, are quite similar.
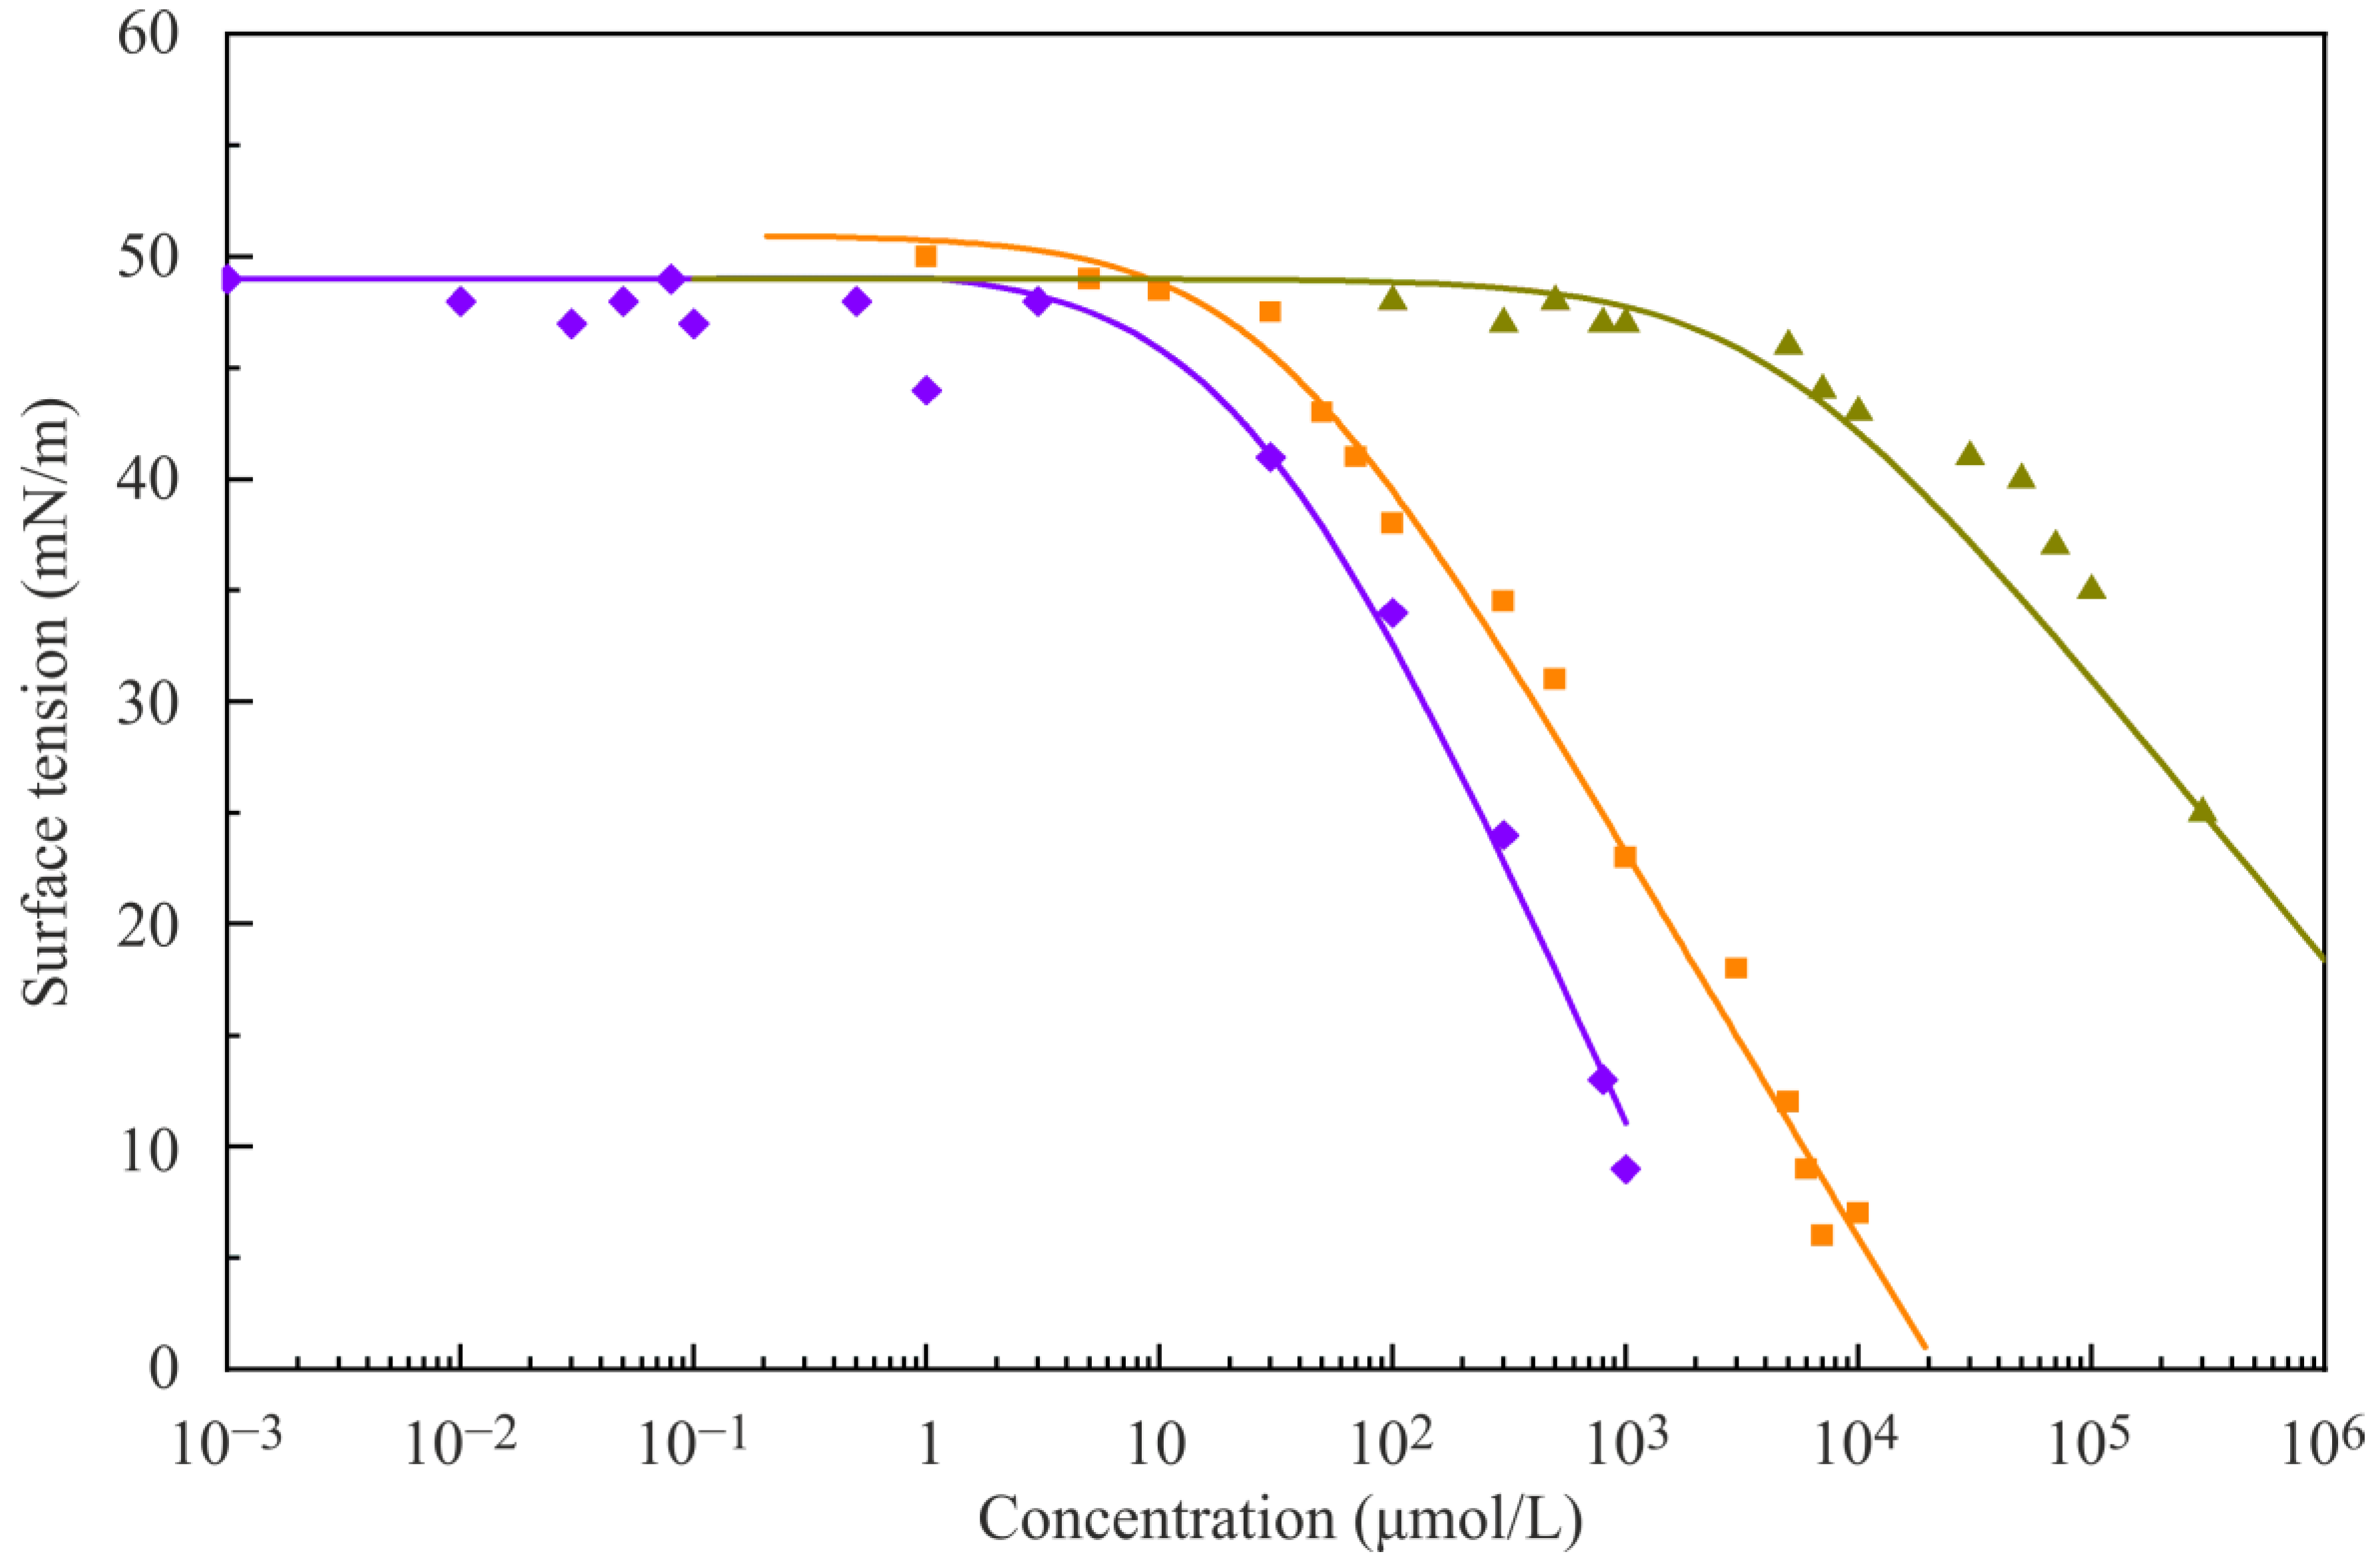
In
Figure 3, the adsorption isotherm for the mixture (NaC
12SO
4 + C
16TAB) is plotted together with the isotherms of the single surfactants NaC
12SO
4 and C
16TAB, respectively. The resulting dimers show a much higher surface activity, i.e., the adsorption isotherm is remarkably shifted to lower bulk concentrations, i.e., the dimers have a surface activity one order of magnitude higher than that of the long chain compound C
16TAB and 3 orders of magnitude higher than that of the medium chain surfactant NaC
12SO
4. Here we take the adsorption equilibrium coefficient b in the Frumkin isotherm as a measure for the surface activity (see
Table 3).
Similar to
Figure 3, in
Figure 4 the isotherm of NaC
16SO
4 + C
12TAB is plotted together with the isotherms of the single surfactants NaC
16SO
4 and C
12TAB, respectively. The adsorption isotherm of the ion pair is shifted toward lower bulk concentrations in the same way as for the surfactant mixture shown in
Figure 3 and the change in the surface activity of the dimer, as compared to the two compounds, is quite similar to these finding, as we can see from the b values given in
Table 4.
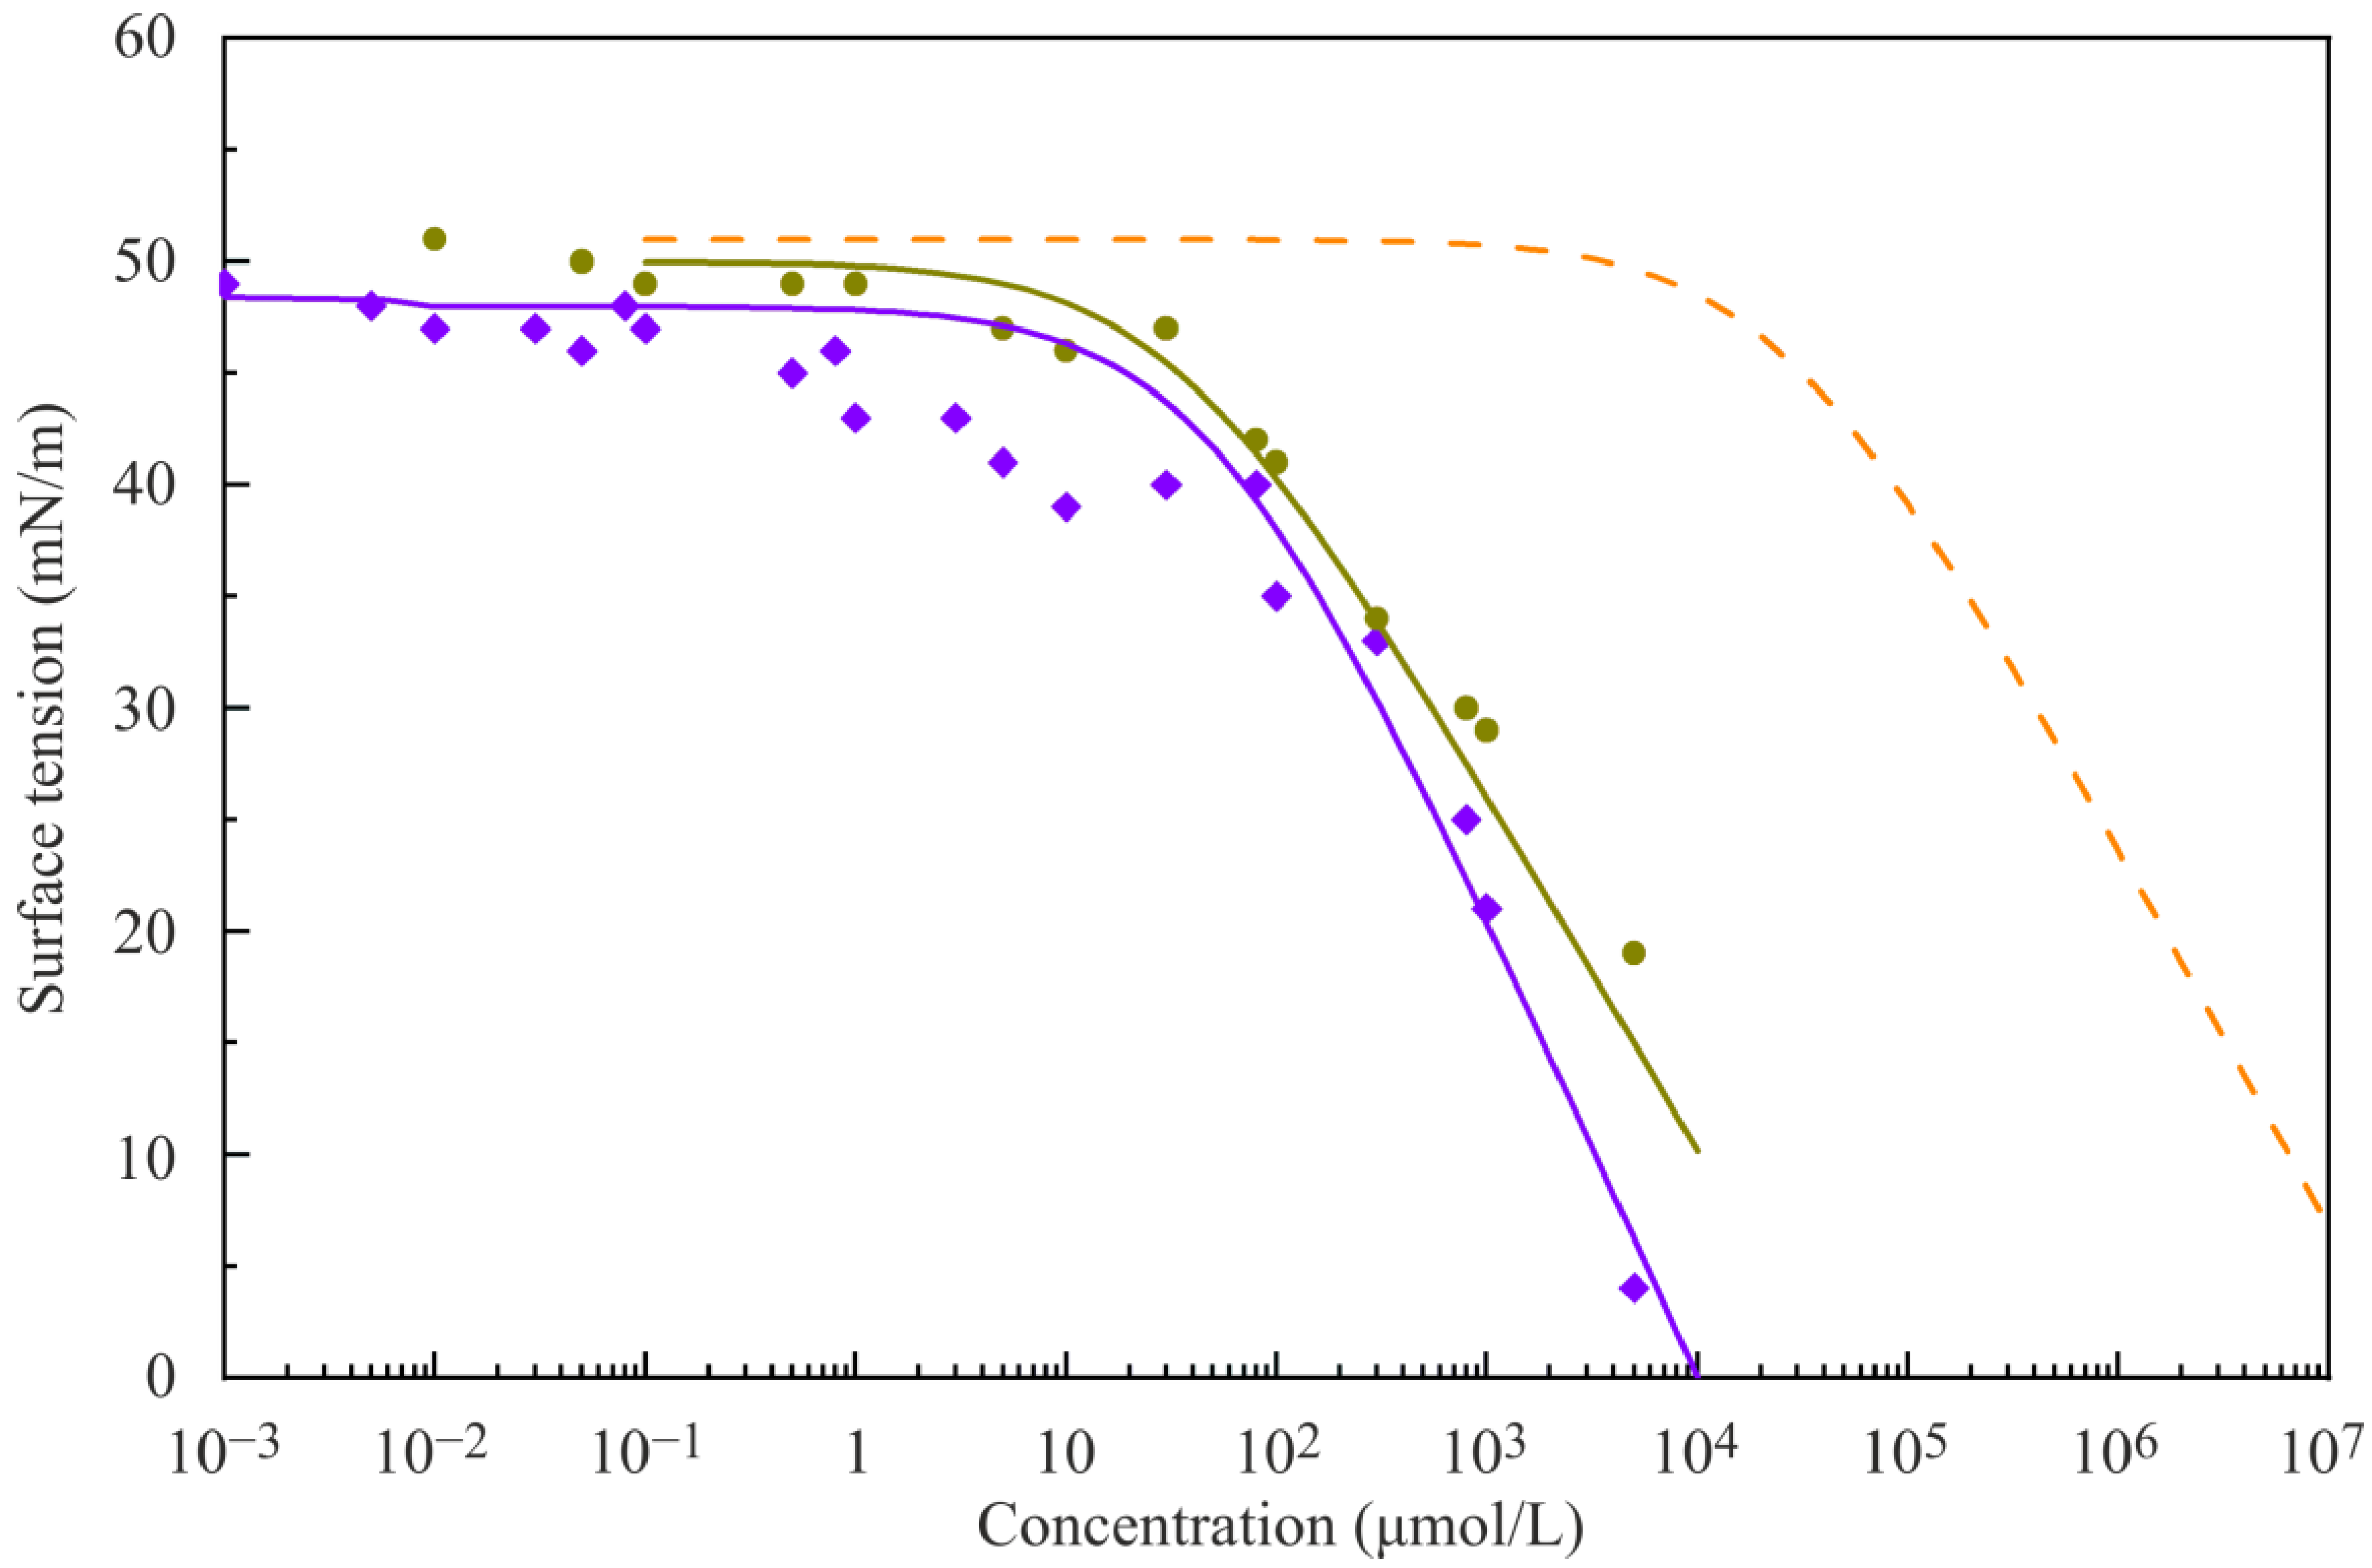
In contrast to
Figure 3 and
Figure 4, when mixing medium chain surfactants (C
12) with short chain surfactants (C
6), the resulting adsorption isotherm for the dimer is positioned close to the isotherm for the medium chain surfactant (
Figure 5). In other words, the adsorption activity of the complexes is not significantly increased in comparison to the activity of the single medium chain surfactant (values of the model parameters are summarized in
Table 5).
C
6TAB possesses a positively charged ionic group and a short C
6 alkyl chain. Thus, the solubility of such molecule in water is preferable as compared with the hydrophobic interaction with other surfactants or oil molecules at the interface. As shown in
Figure 5 the adsorption isotherms of the [NaC
12SO
4 + C
6TAB] mixture and the single NaC
12SO
4 are similar because the adsorption layer consists mainly of NaC
12SO
4 molecules. It was shown in [
30] that by mixing long chain surfactants with short alkyl chain molecules, the short chains are removed from the adsorption layer by mutual interaction between the long chains of the surfactants. Similarly, in this work, the short chain surfactant C
6TAB is probably squeezed out from the mixed adsorption layer by the much longer chains of the NaC
12SO
4 molecules.
Similarly to
Figure 5, in
Figure 6 the adsorption isotherms of single surfactants and ion pairs of NaC
6SO
4 and C
12TAB, respectively, are shown. Due to the rather high price for the substance and the large amount needed for experiments, the NaC
6SO
4 adsorption isotherm (shown in
Figure 6 by a dashed line) was not experimentally measured but rather extrapolated via Traube’s rule [
31]. NaC
6SO
4 as single surfactant shows low surface activity as compared to C
12TAB and their mixtures NaC
6SO
4 + C
12TAB. Thus, NaC
6SO
4 does not significantly influence the total surface activity of the dimer NaC
6SO
4 + C
12TAB. Therefore, the dimer adsorption isotherm has a similar shape and position like the isotherm for the single C
12TAB (values of model parameters are summarized in
Table 6).
4.2. Dynamic Interfacial Tensions
After the equilibrium adsorption isotherms are determined and discussed, we now discuss the adsorption kinetics results in terms of dynamic interfacial tensions. The kinetic curves are fitted with the reorientation and Frumkin models, respectively. Since the measured solutions present mixtures of single surfactants and of complexes, i.e., cationics, anionics and catanionics, the Frumkin model does not always fit sufficiently well the catanionic combinations while the reorientation model describes the measured dependencies much better.
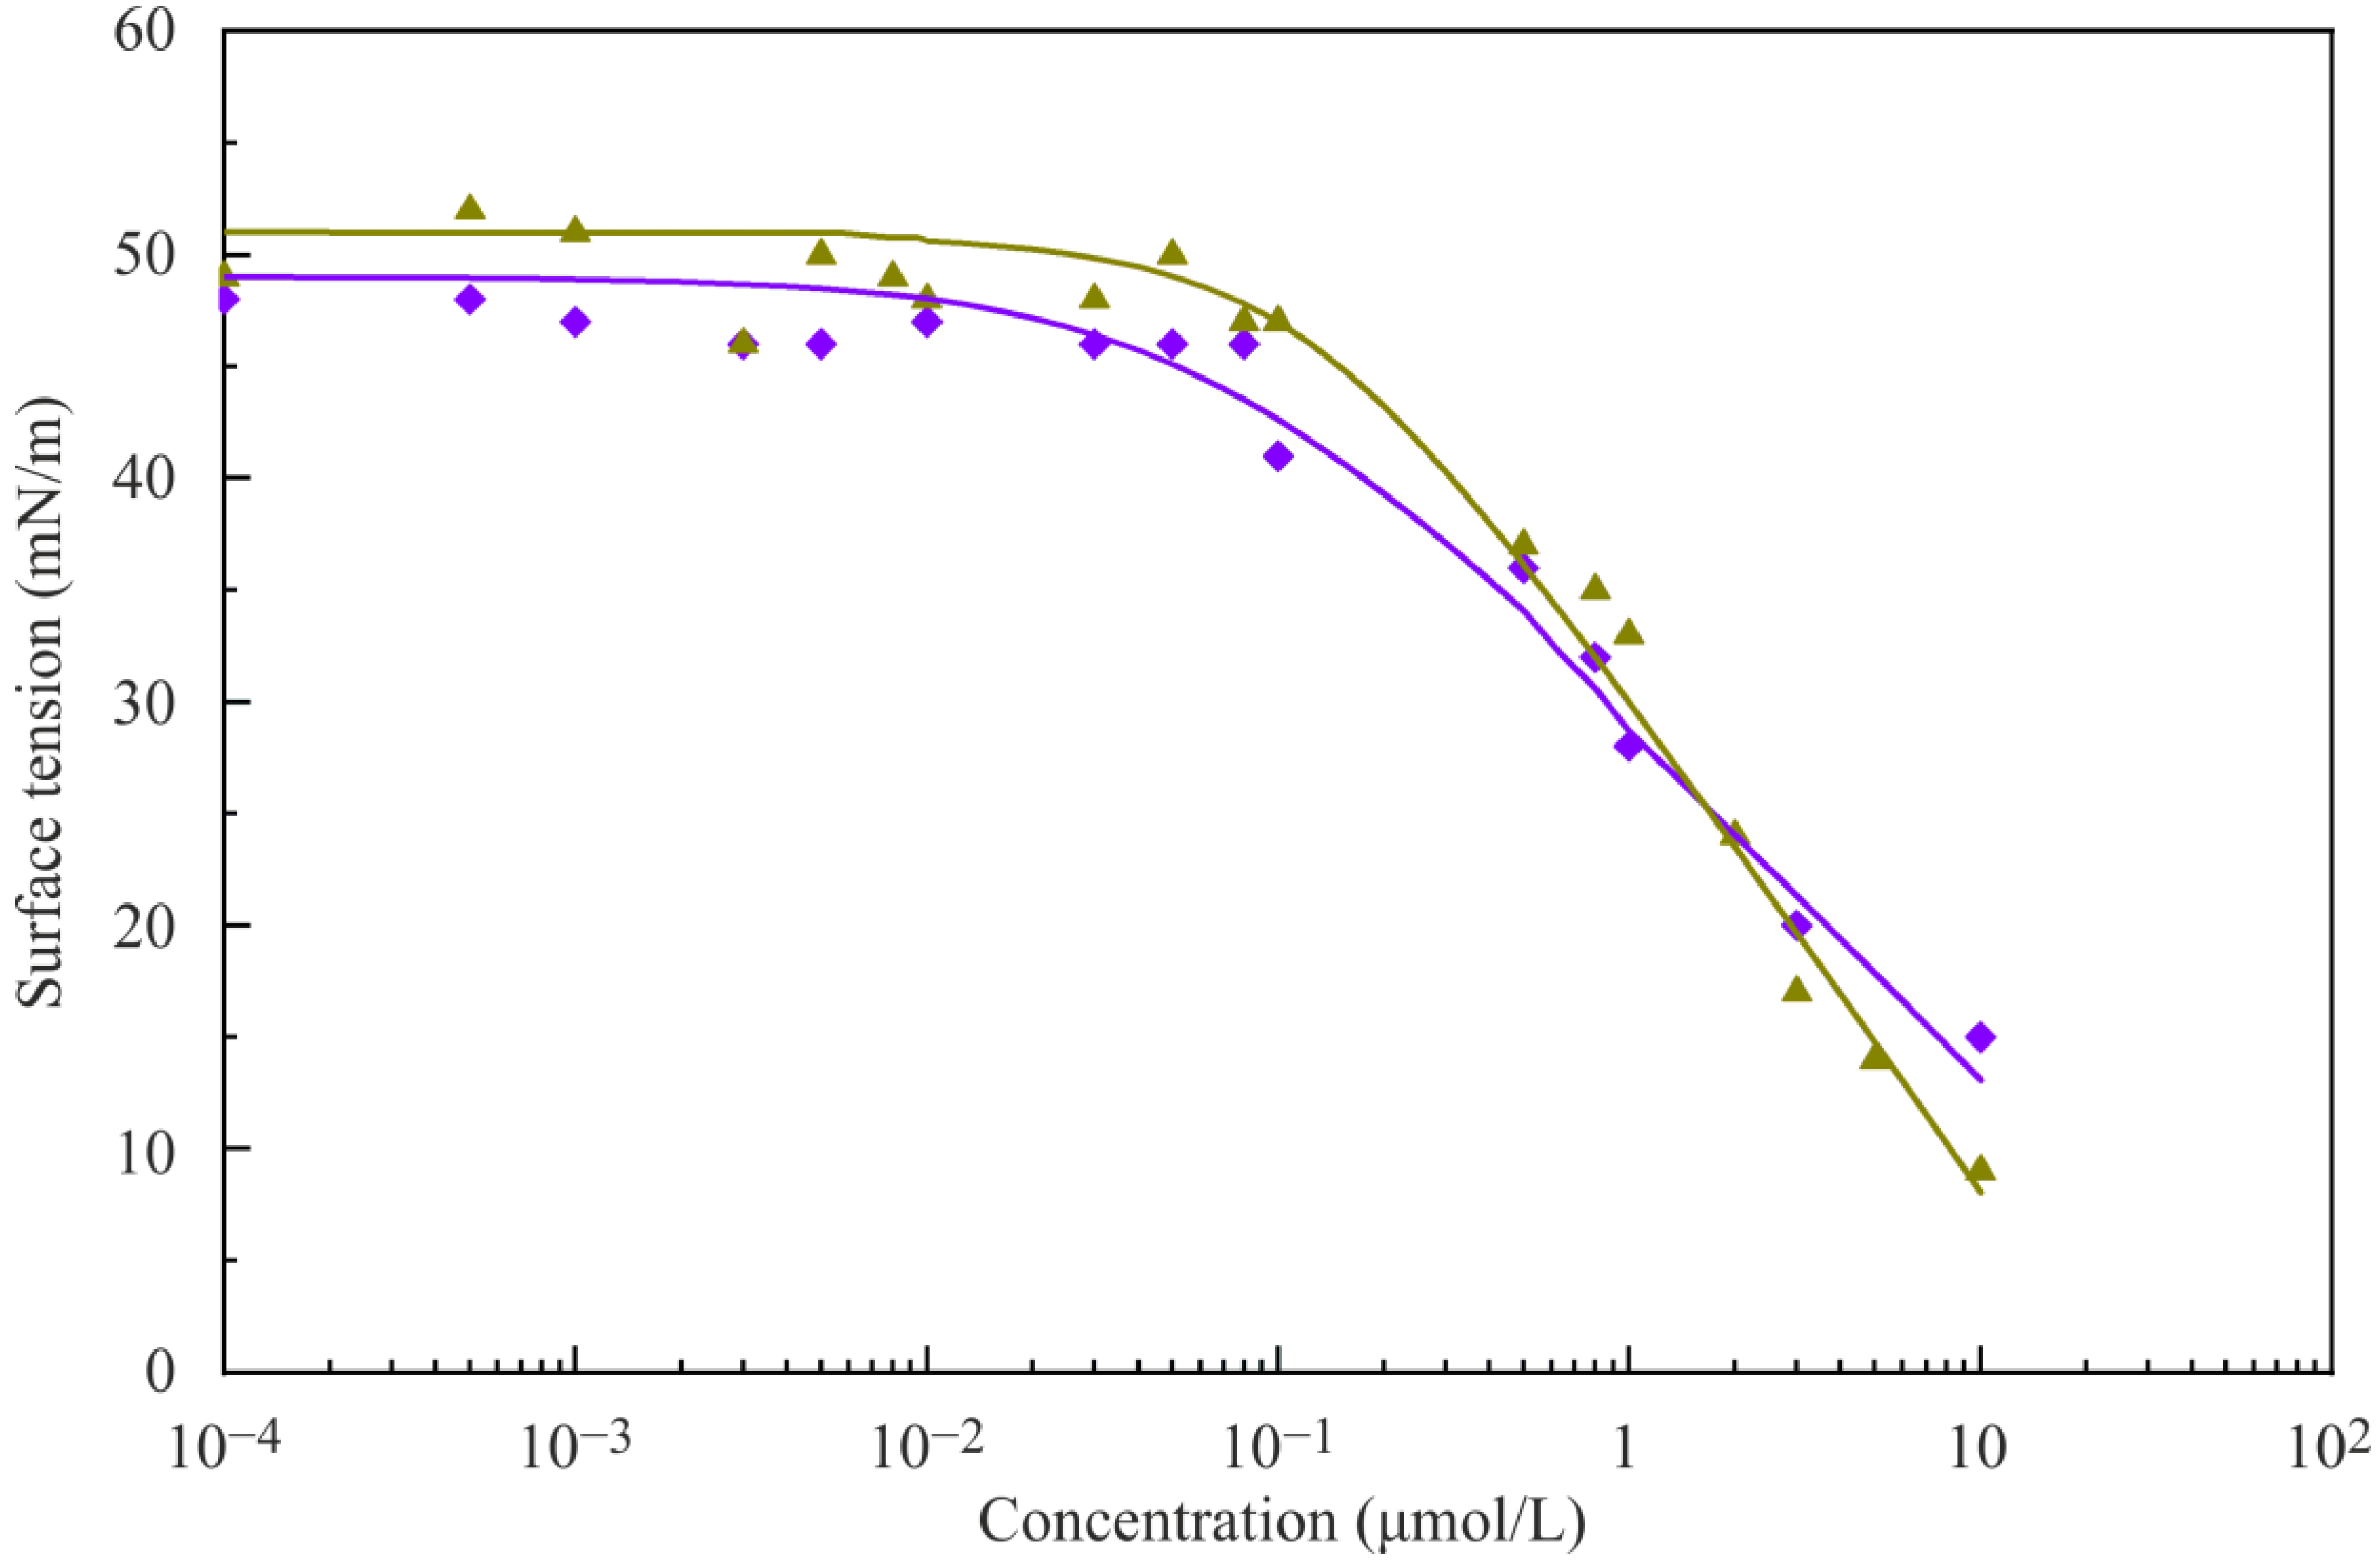
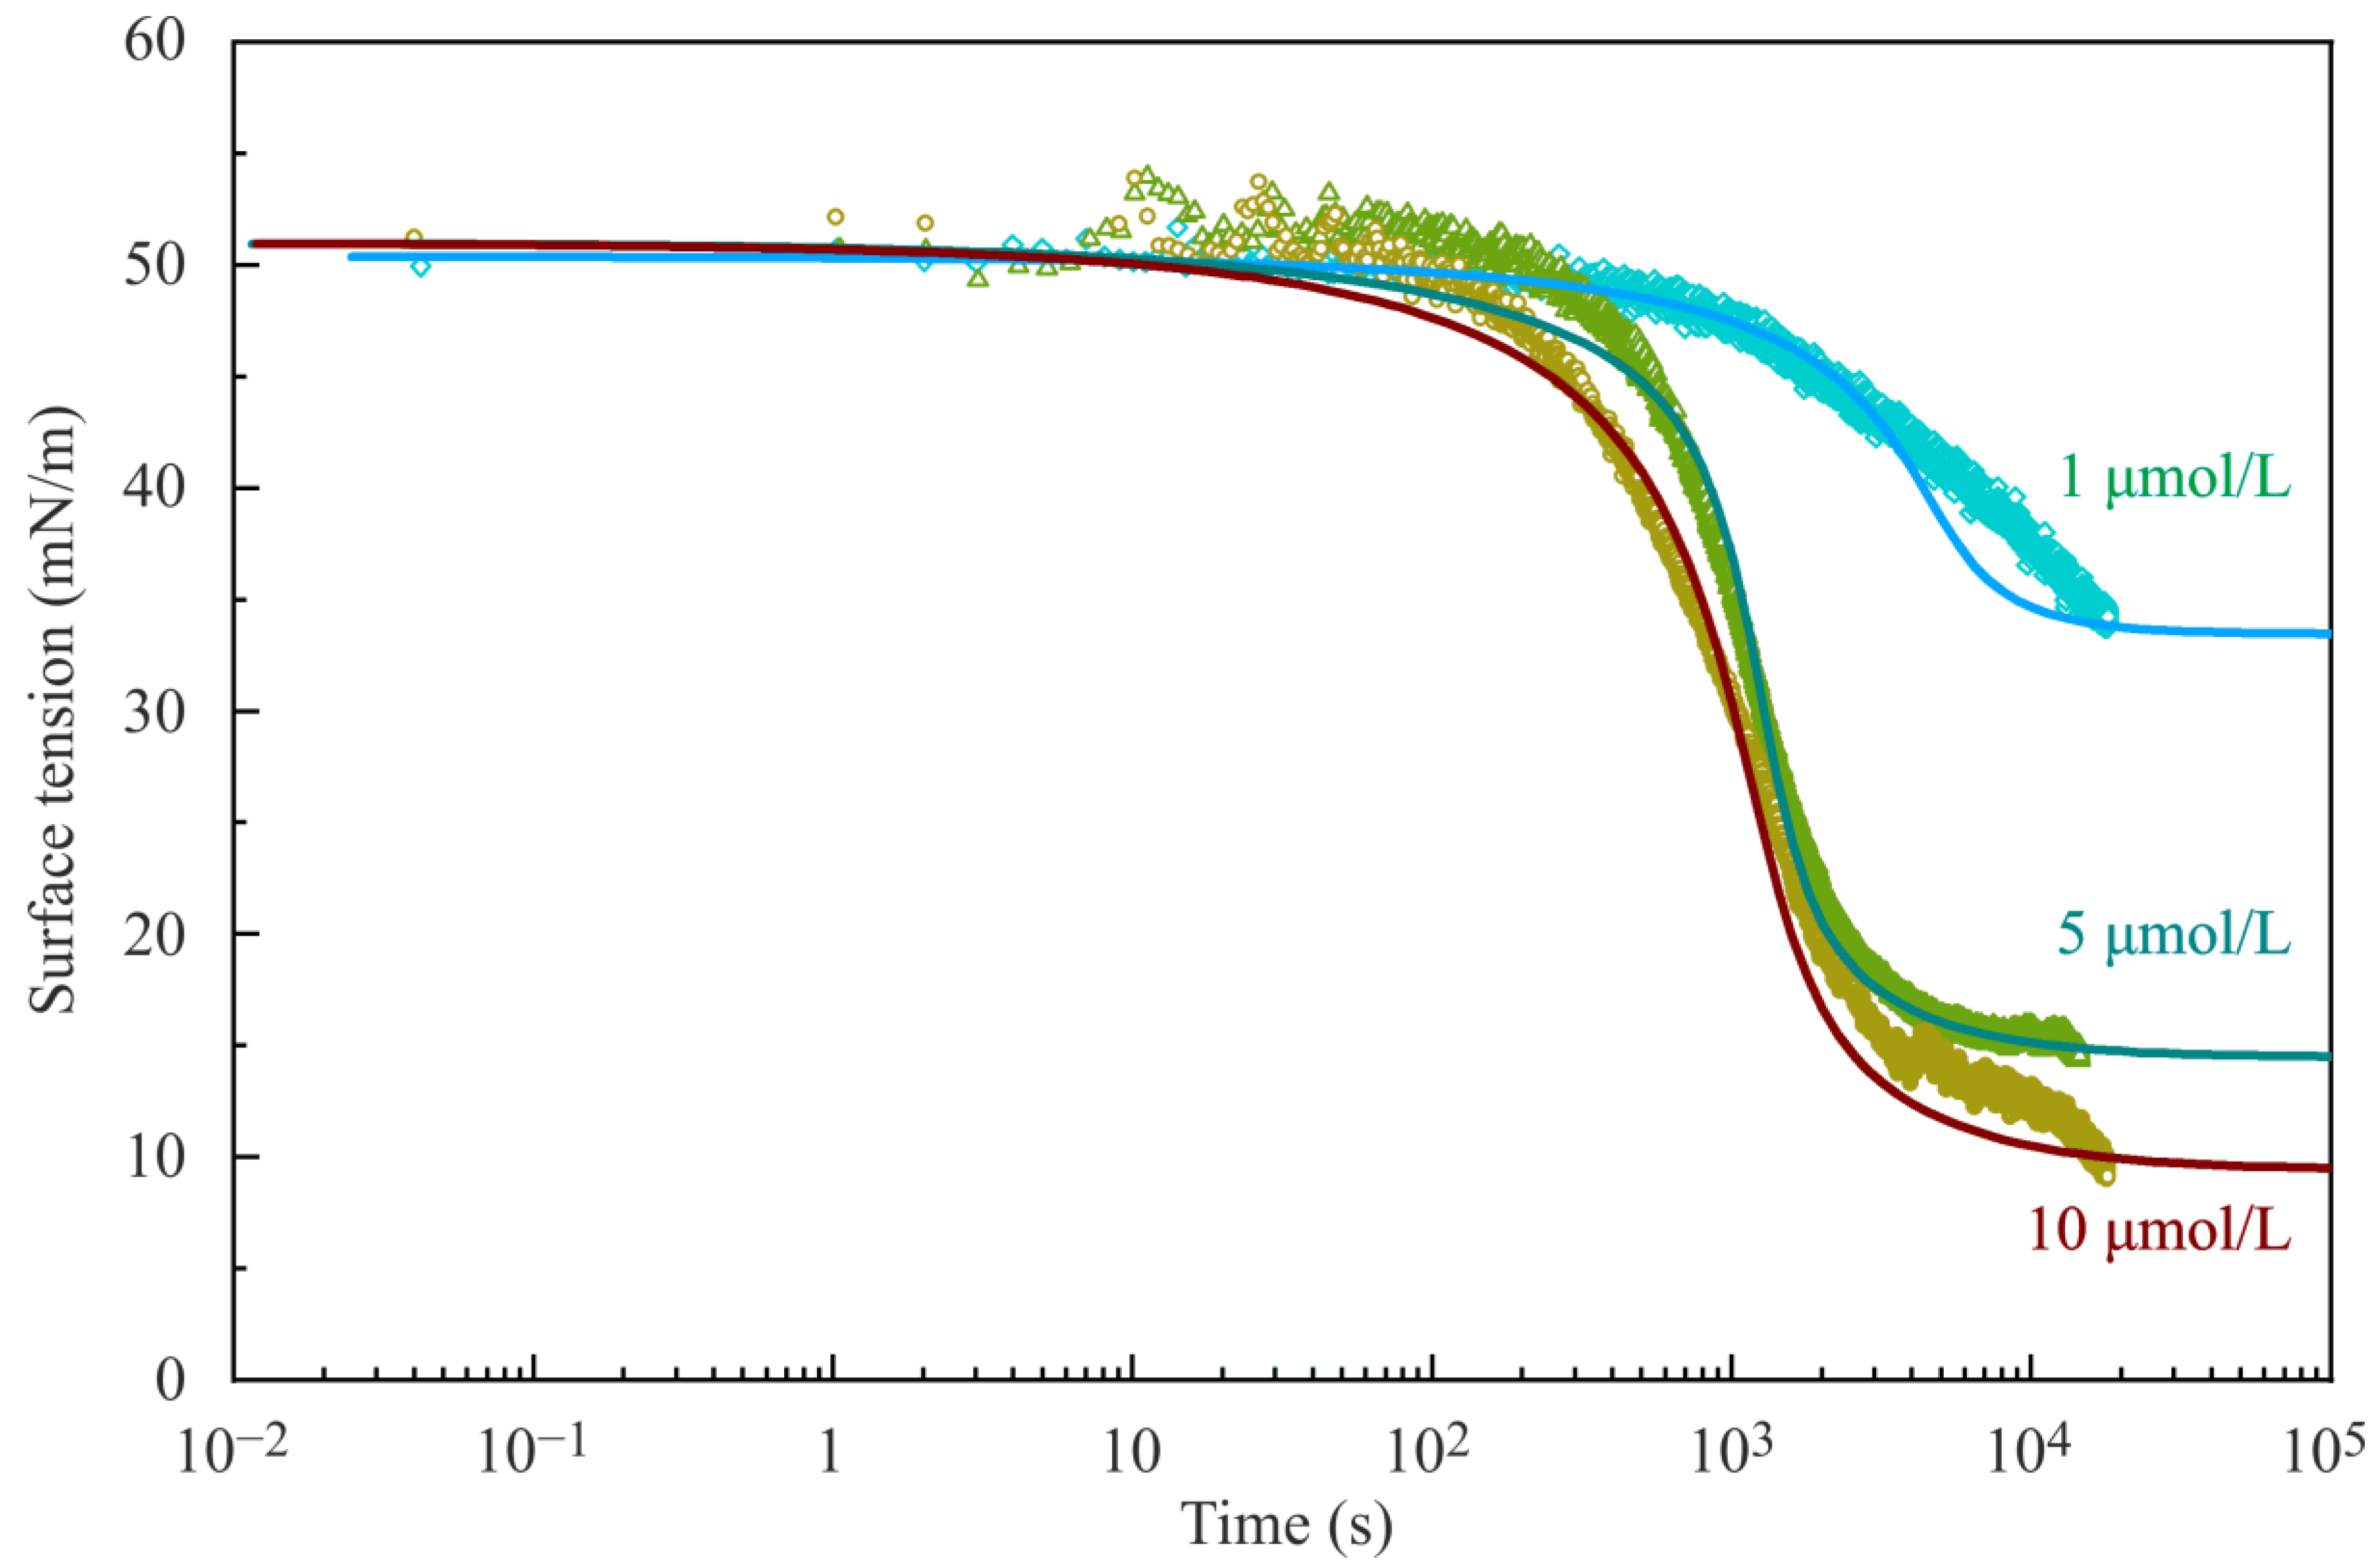
In
Figure 7 the dynamic interfacial tensions of [NaC
16SO
4 + C
12TAB] mixtures show relatively slow adsorption kinetics at concentrations close to adsorption saturation (5 μmol/L and 10 μmol/L). The interfacial tension decrease starts at about 100 s and reaches the equilibrium after about 3 h (10
4 s). However, the interfacial tension decrease is significant, Δγ > 40 mN/m. Thus, the dimers NaC
16SO
4 + C
12TAB in comparison with its single surfactants [
32] show much slower adsorption kinetics but the same interfacial effect, i.e., the same interfacial pressure.
The curves in
Figure 7 are fitted with the Frumkin model (see also
Figure S1 in the Supplementary Materials). Due to the relatively simple curve shapes, both models show similar fitting quality.
Table 7 and also
Table S1 in the Supplement summarize the model parameters. Note, however, that for a better fitting of dynamic dependencies, the parameters ω
0 and a should be slightly adjusted as compared to those used for fitting the isotherm. With thus corrected values of the model parameters, we can calculate the adsorption isotherms shown in
Figure 1 with almost the same quality.
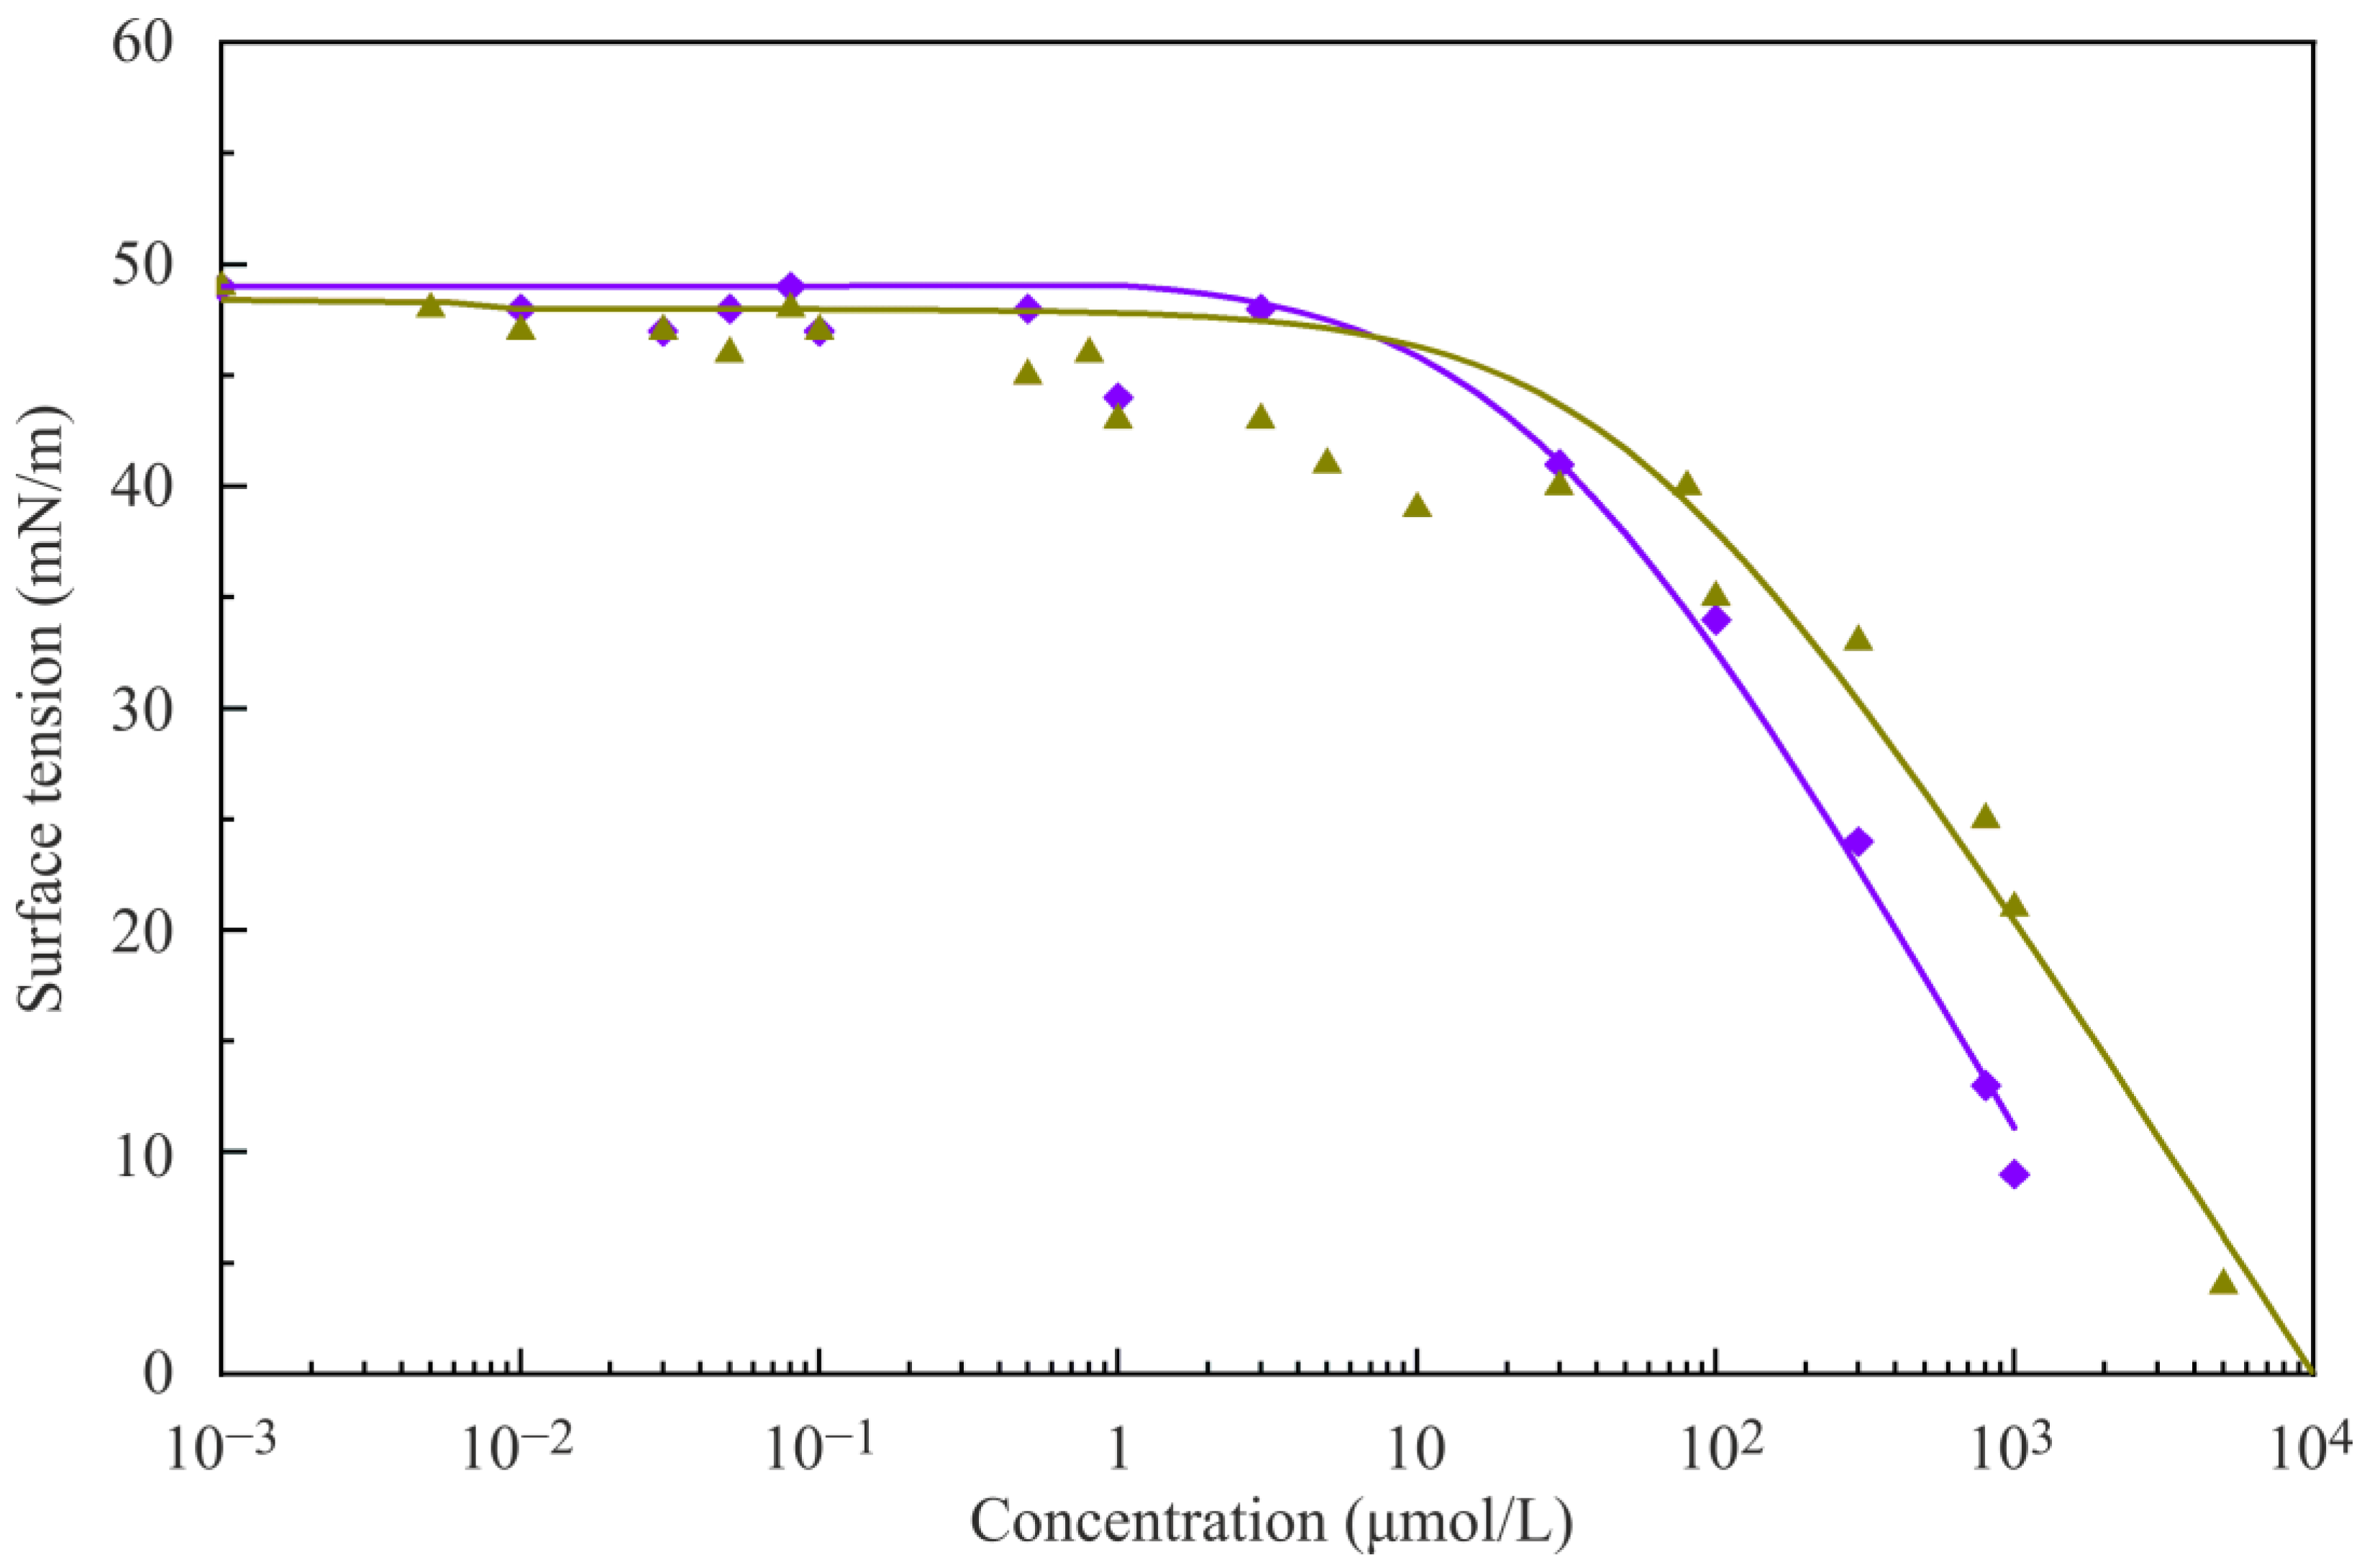
The kinetics obtained for NaC
12SO
4 + C
16TAB equimolar solutions are shown in
Figure 8. As for the NaC
16SO
4 + C
12TAB mixtures in
Figure 7, the curves display significant interfacial tension decrease and slow adsorption kinetics. Since the number of methylene groups per dimer is the same for both mixtures, they exhibit a similar kinetic behavior. The kinetic data in
Figure 8 were also fitted with the two adsorption models, and both show good agreement with the experimental data.
The parameters obtained for the Frumkin and reorientation models are listed in
Table 8 and
Table S2 (see Supplementary Materials), respectively. For all three concentrations, the model parameters were similar, except the values for D had to be changed in order to obtain a better fitting of the experimental data. Compared to the fitting parameters in the
Table 1 obtained for the thermodynamic equilibrium, the values corresponding to the kinetics in
Table 8 and
Table S2 are similar.
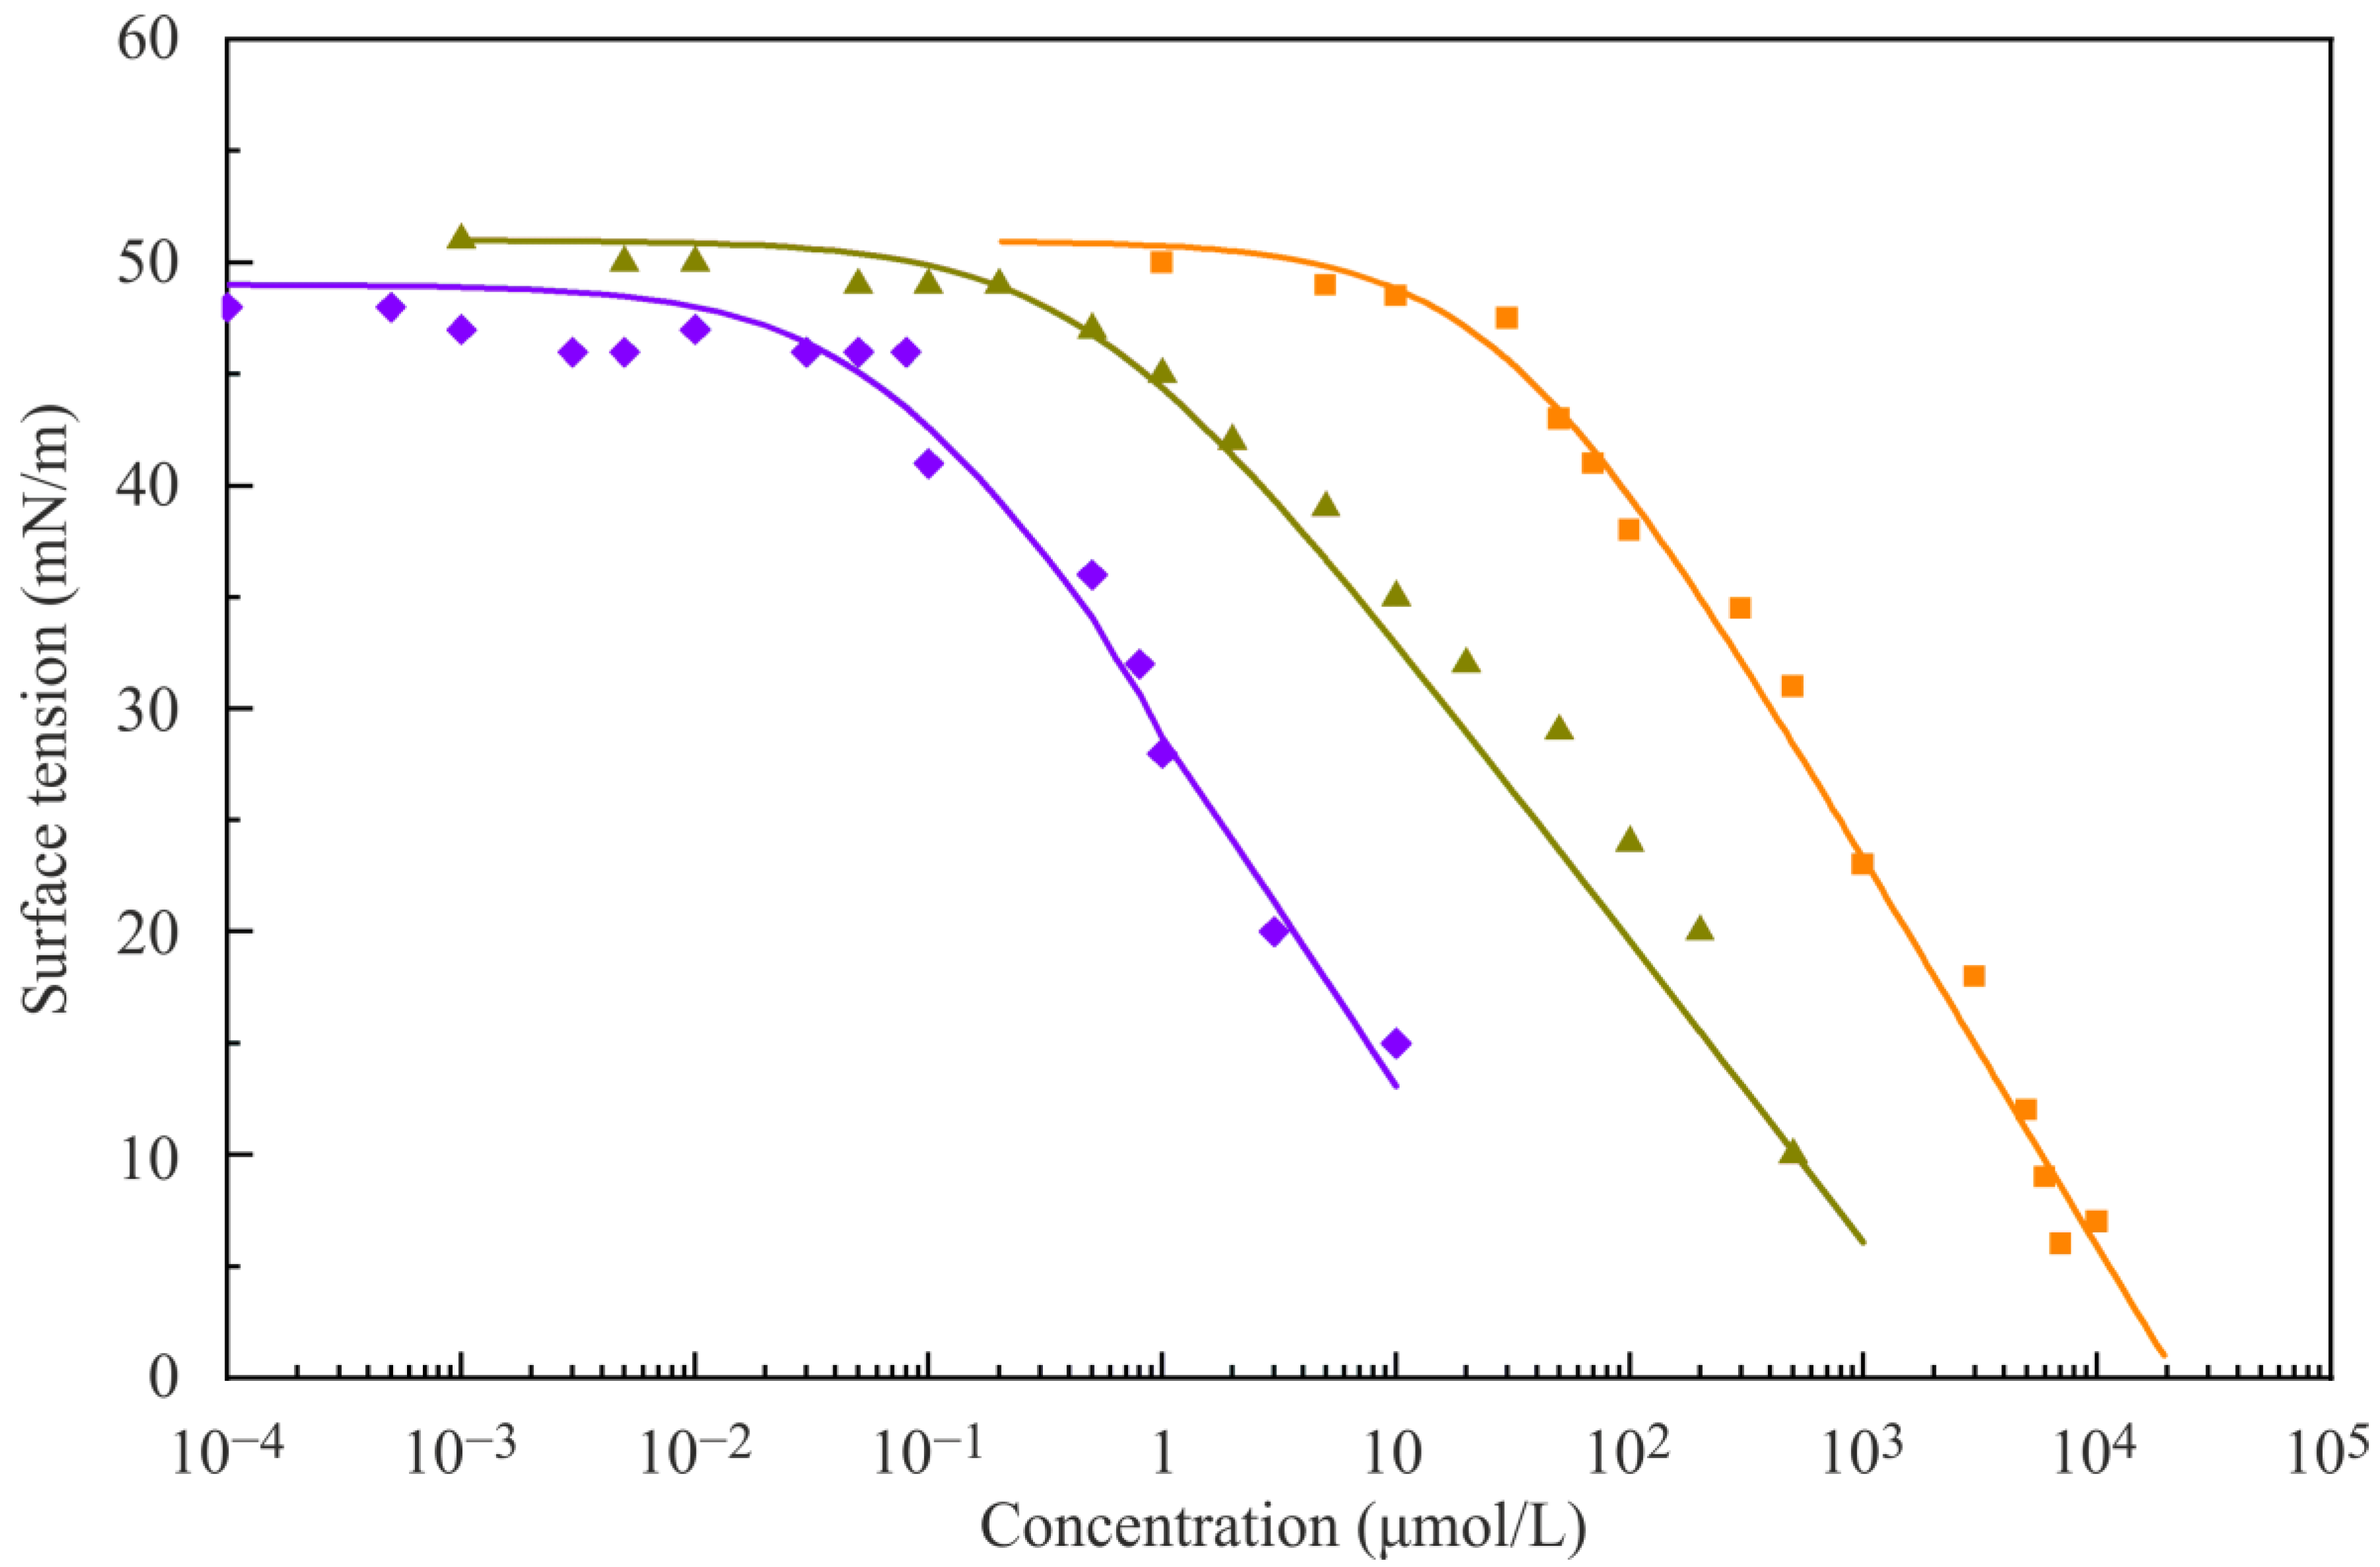
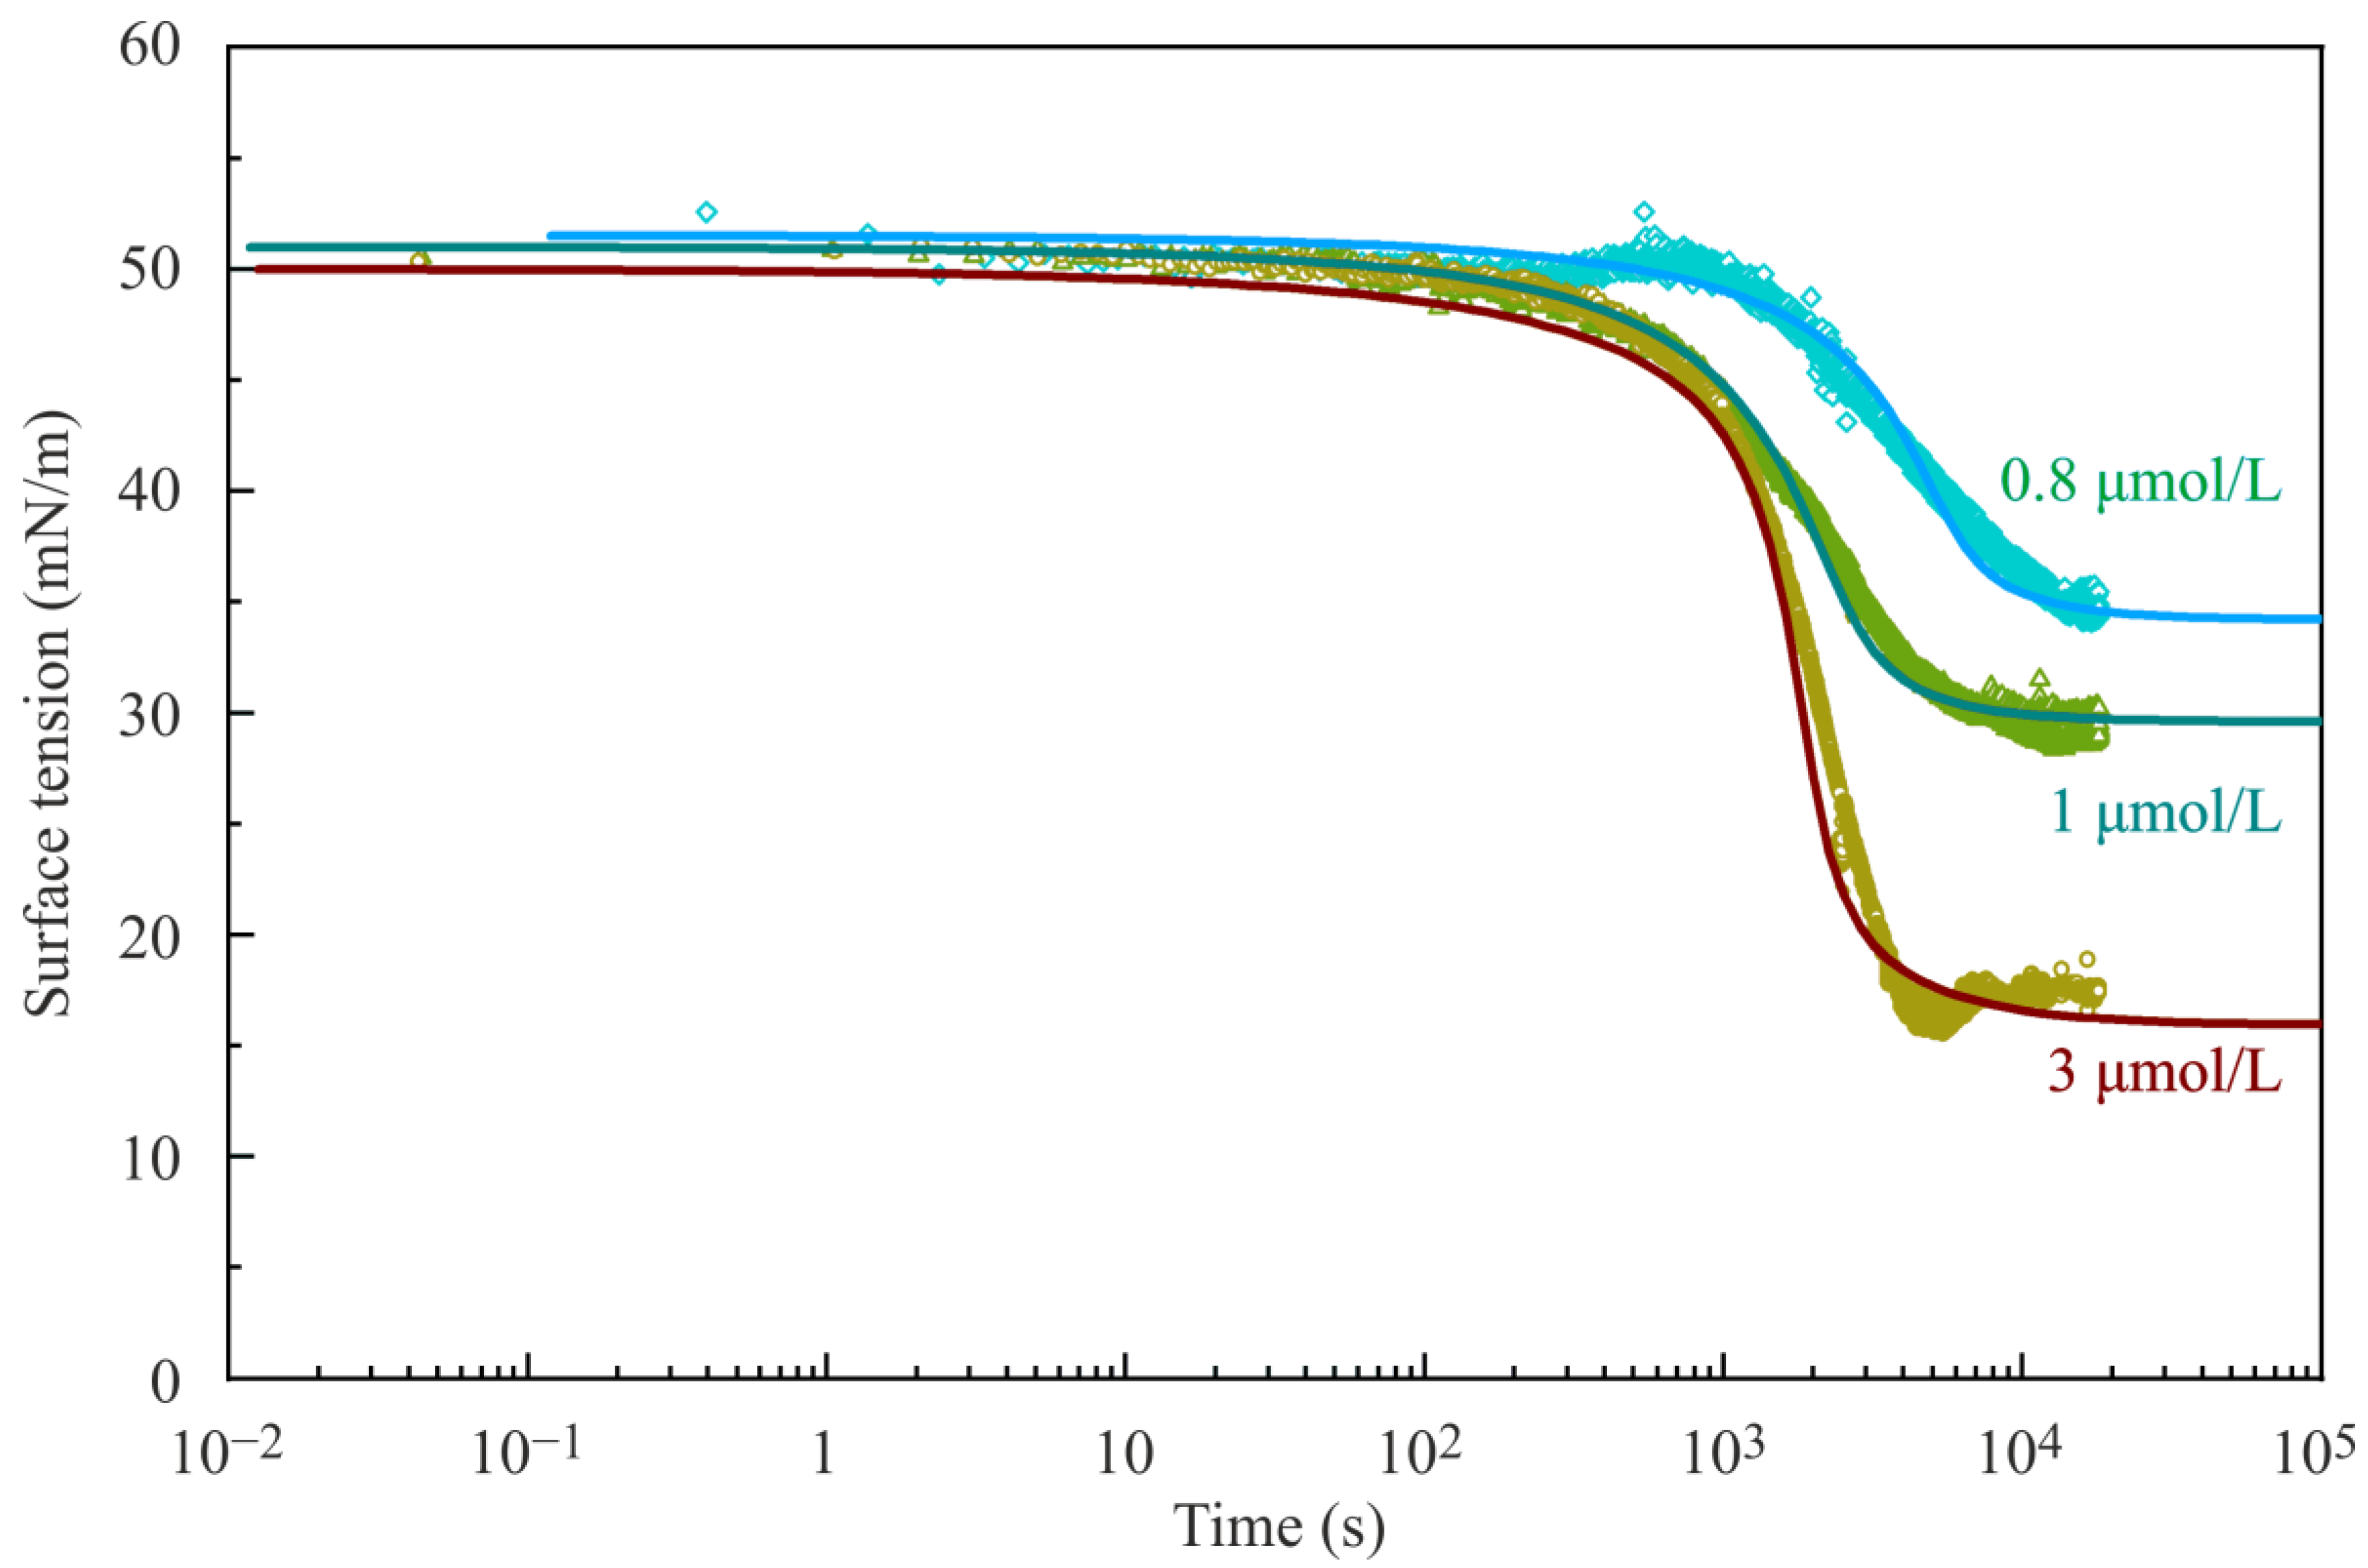
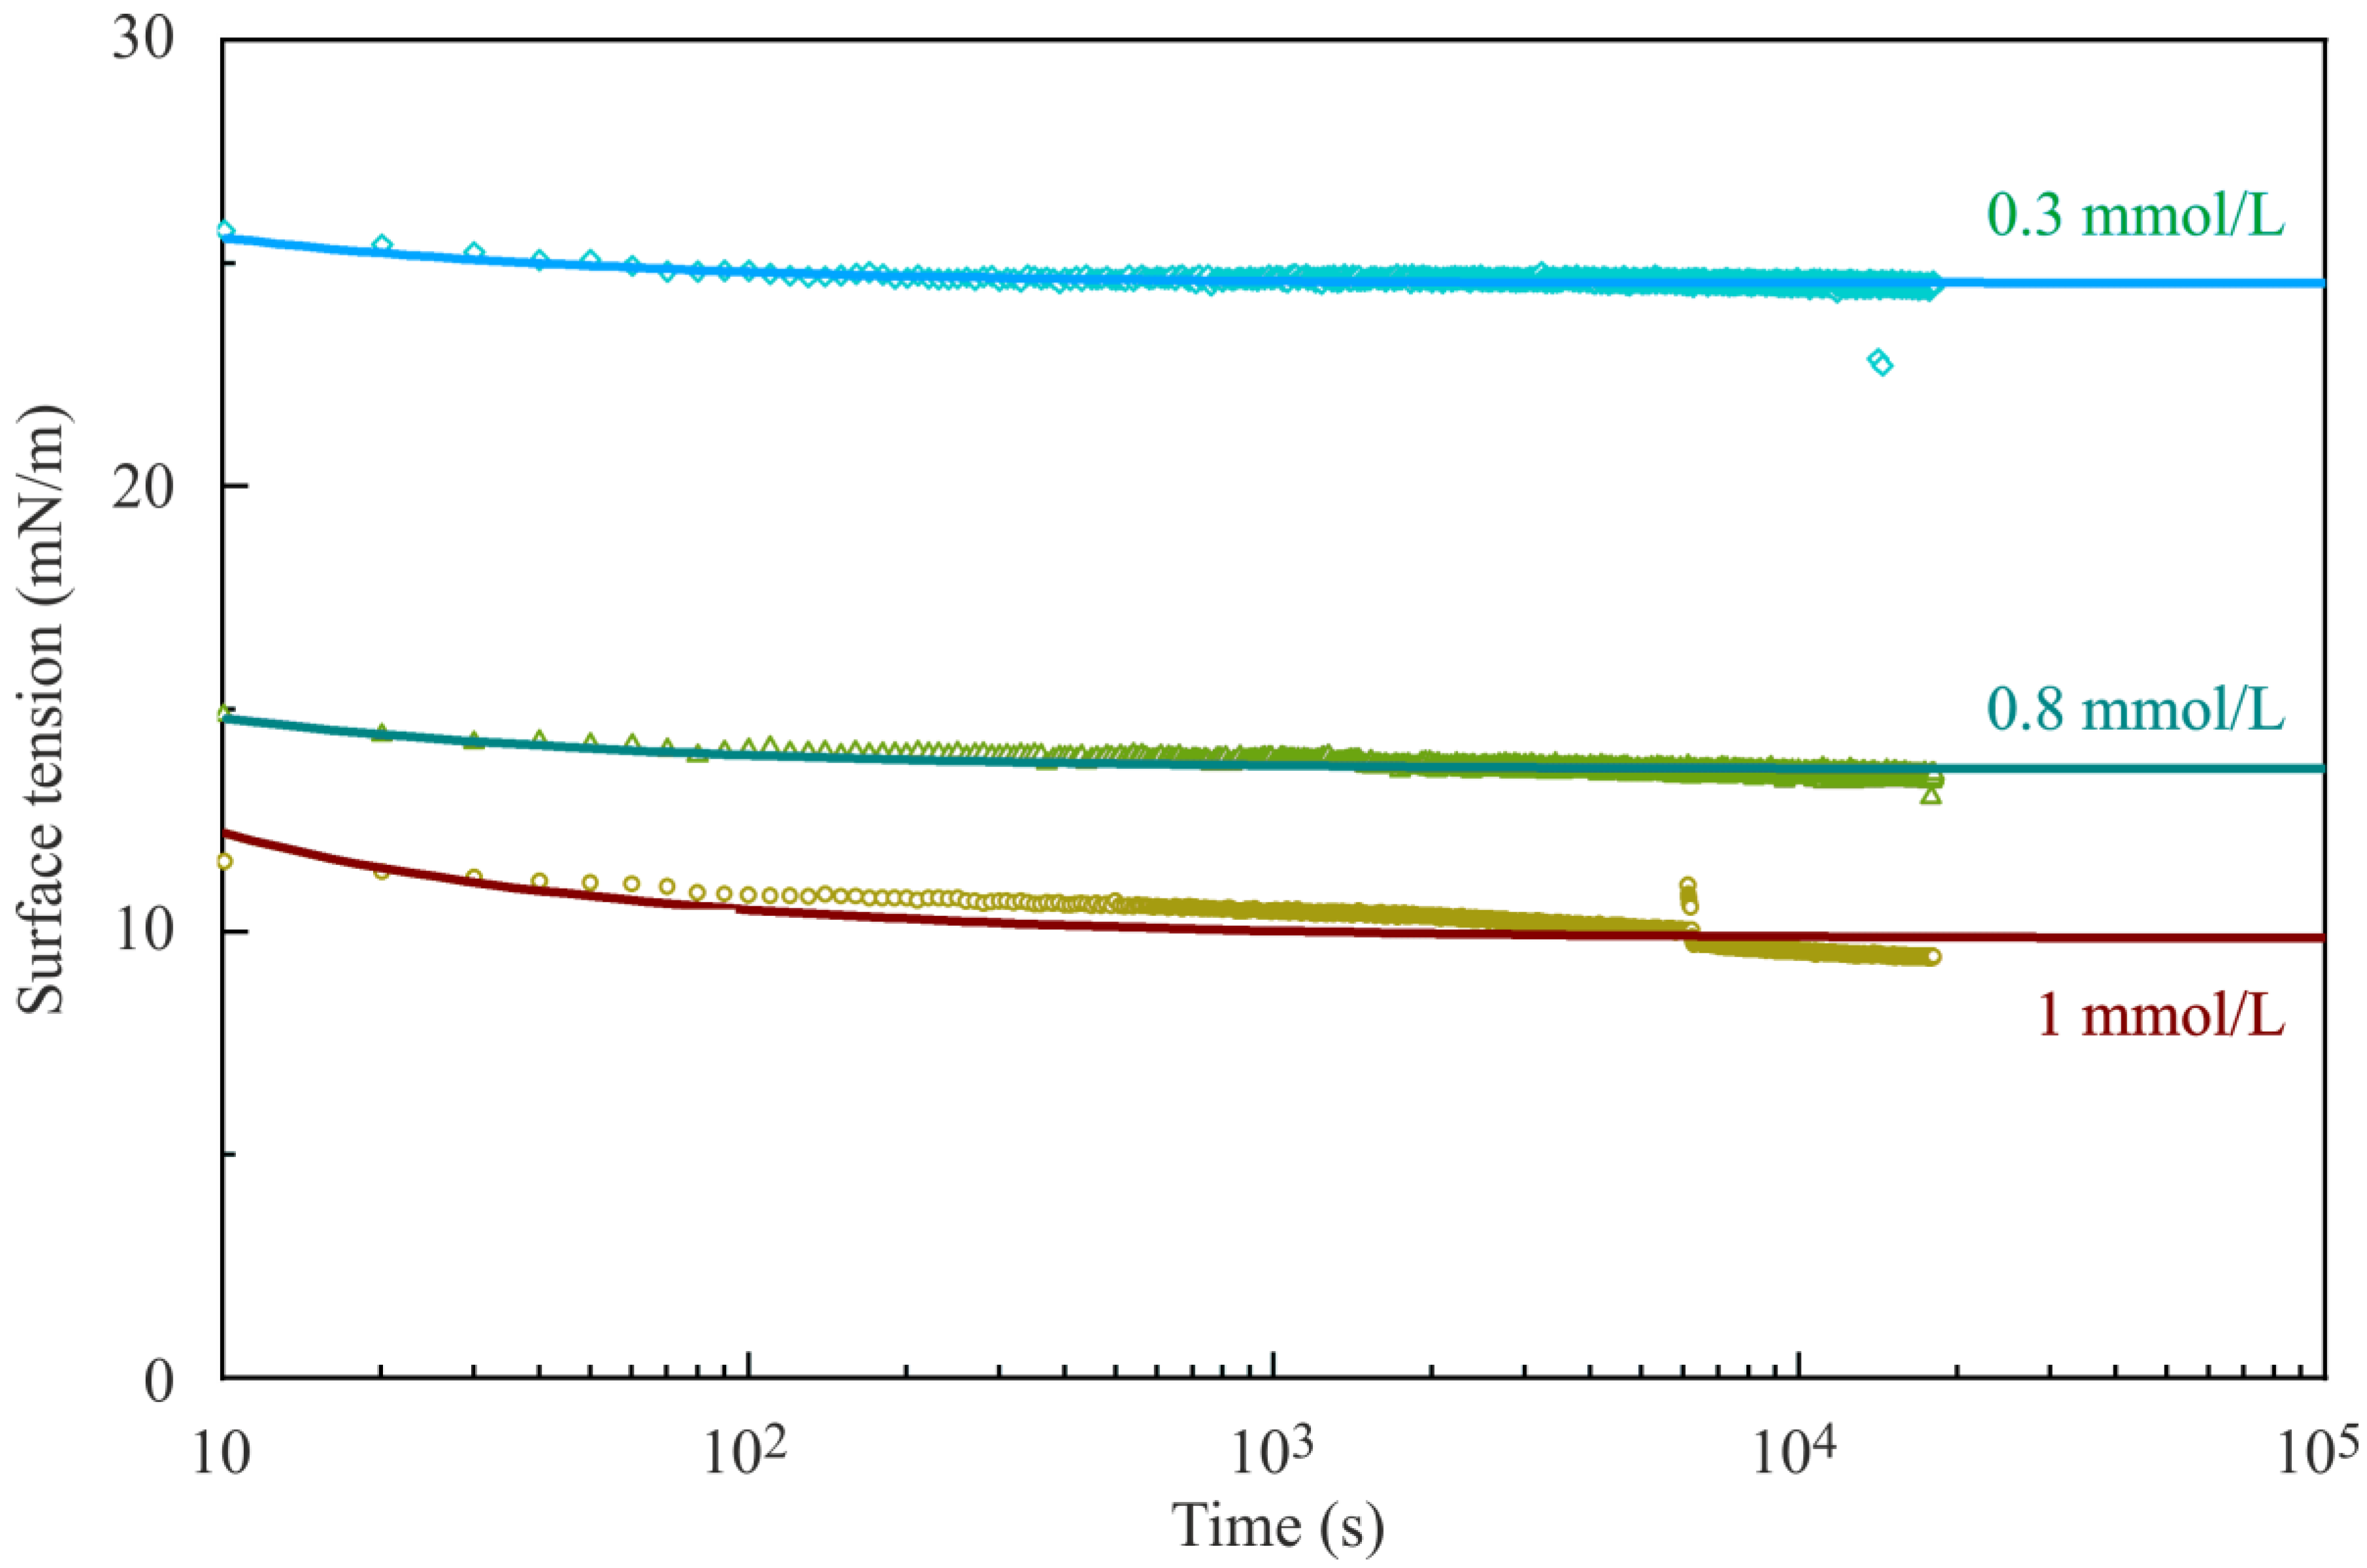
The curves in
Figure 9 show a rather fast adsorption kinetics. The NaC
12SO
4 + C
6TAB dimers in
Figure 5 show an adsorption isotherm located almost in the same concentration range as the single NaC
12SO
4 surfactant. Hence, the adsorption kinetics of the dimers are expected to be similar to those of the single NaC
12SO
4 molecules [
33]. Although in
Figure 9 we do not have the whole adsorption kinetics dependencies (the data are available from 10 s on), it was possible to fit them with the Frumkin model as well as the reorientation model.
The values of the model parameters are listed in
Table 9 and
Table S3 (see Supplementary Materials). It was not possible to measure the whole kinetic curves due to technical limitations at short adsorption times. Thus, the experimental kinetic curves at short times are systematically missed. As kinetic fitting parameters we used identical values for the model parameter at equilibrium, as shown in
Table 3 and only the diffusion coefficients were fitted.
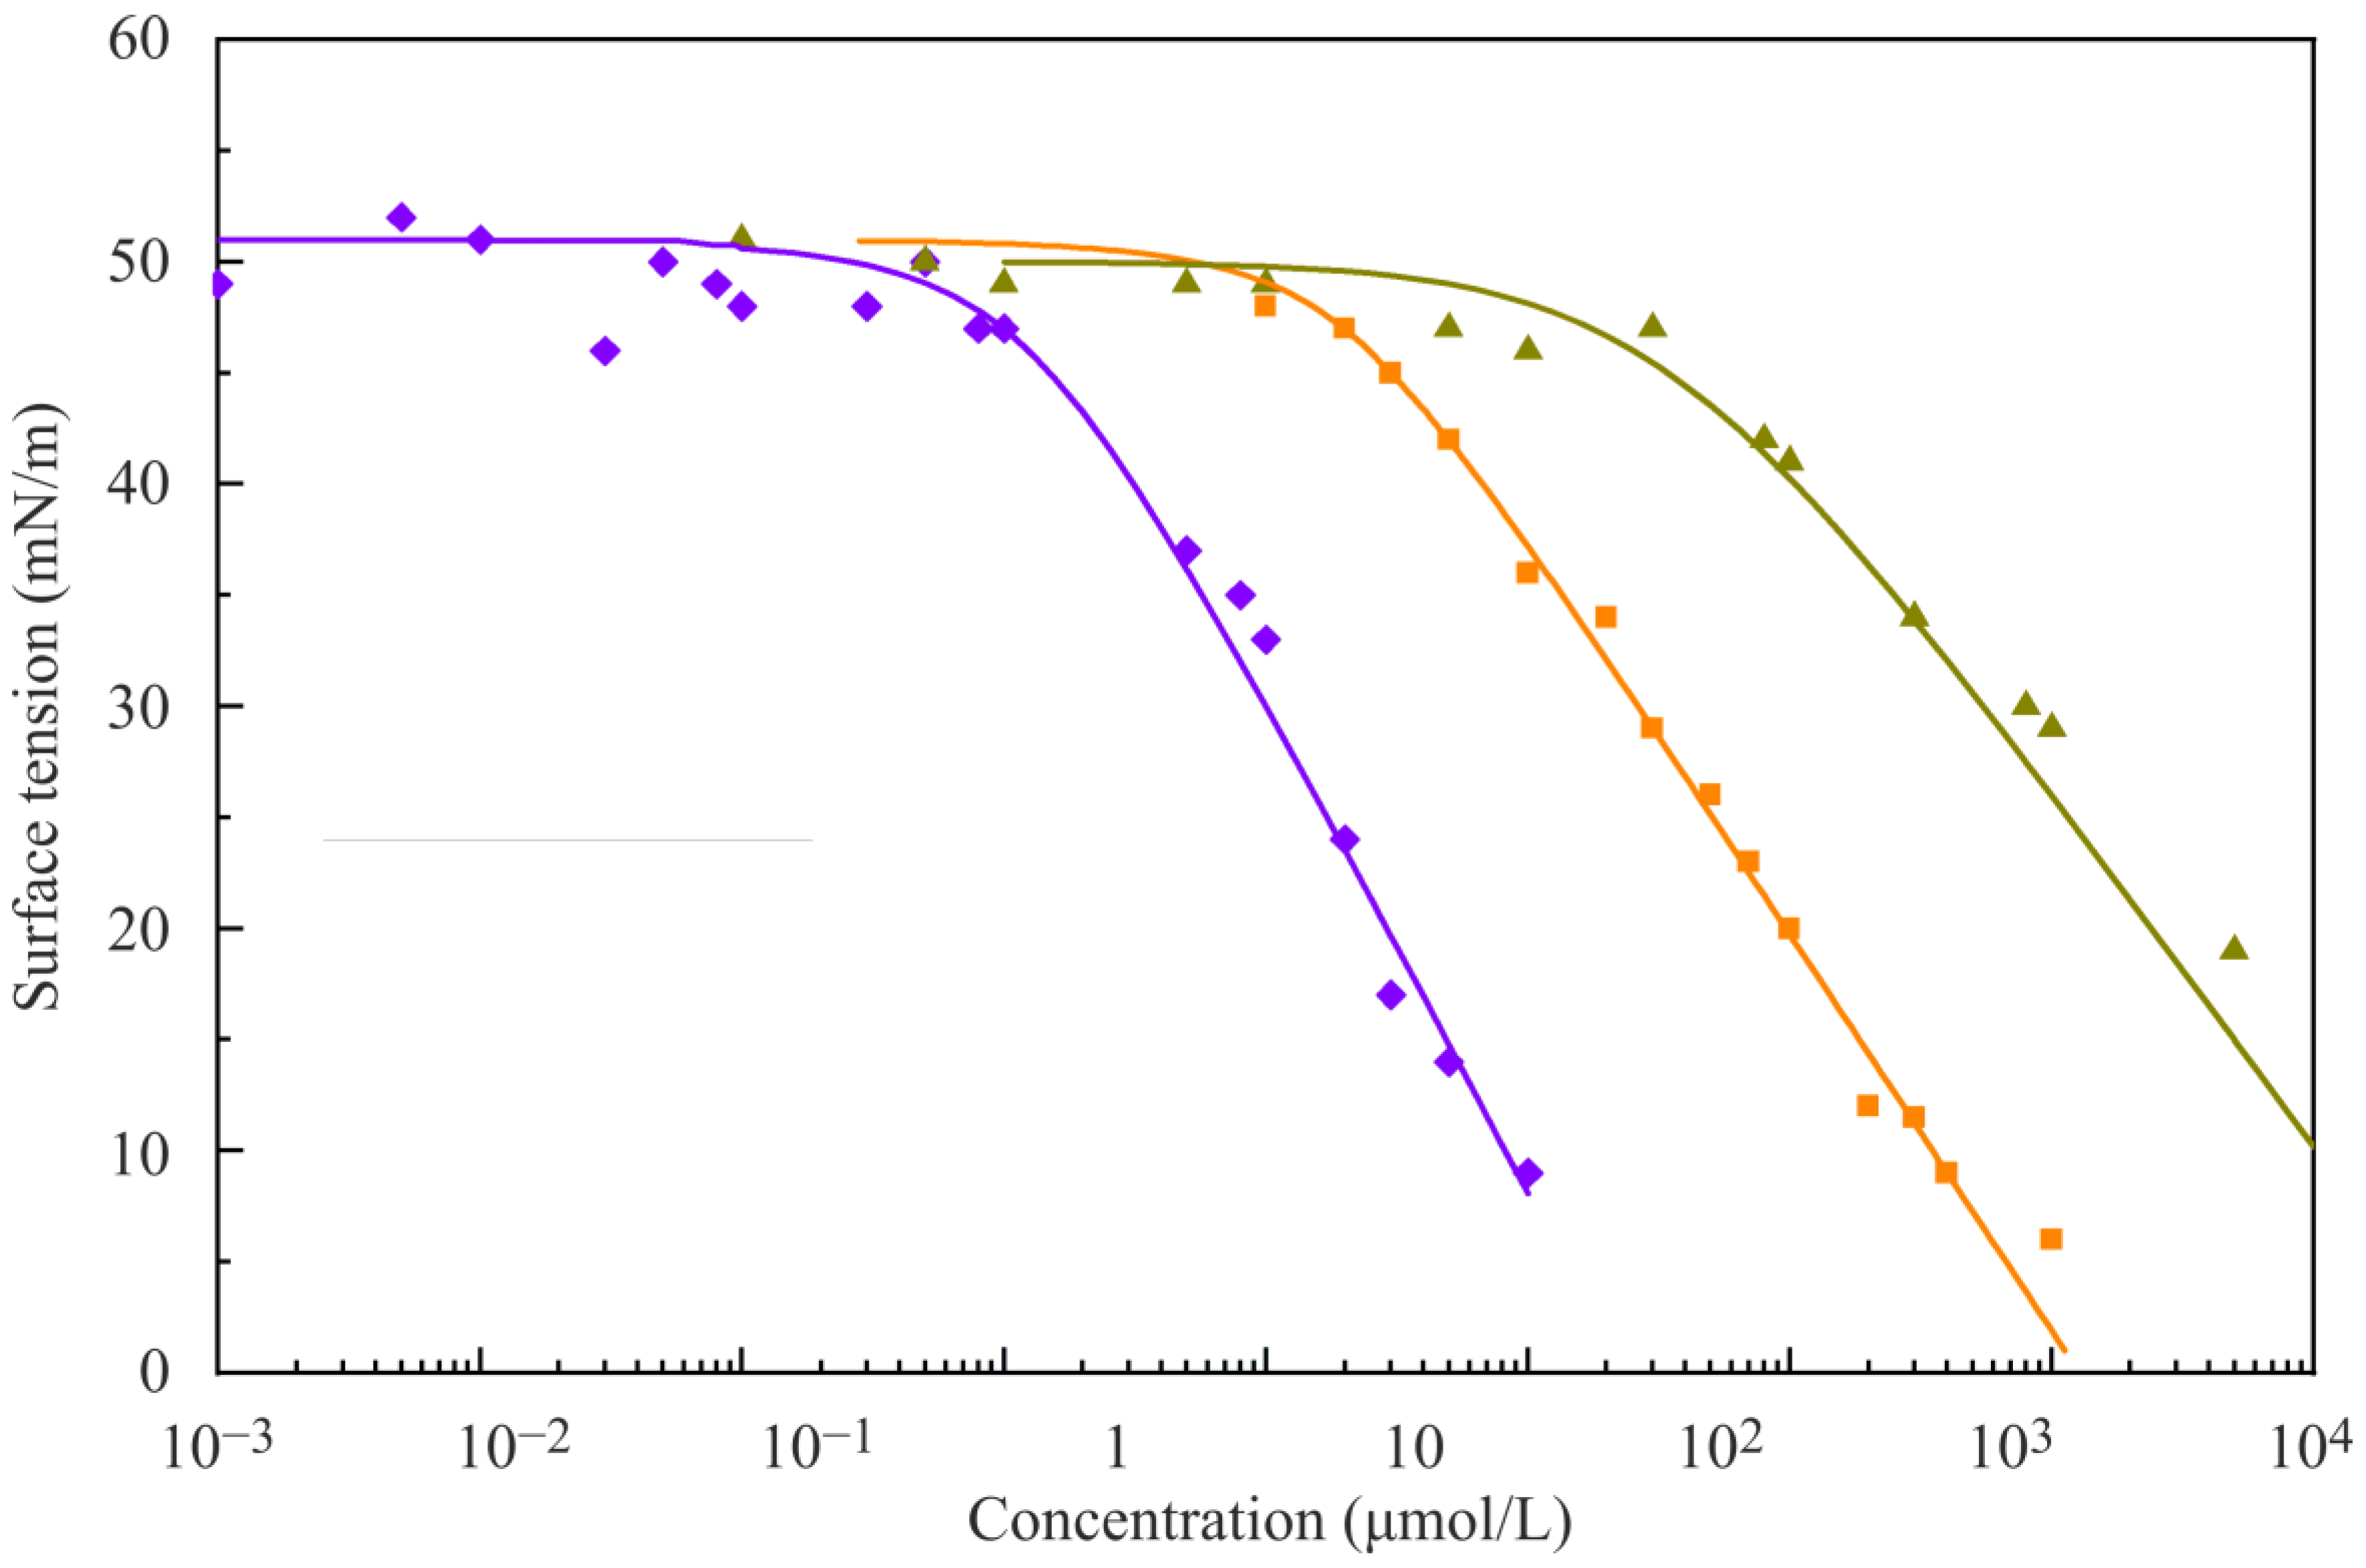
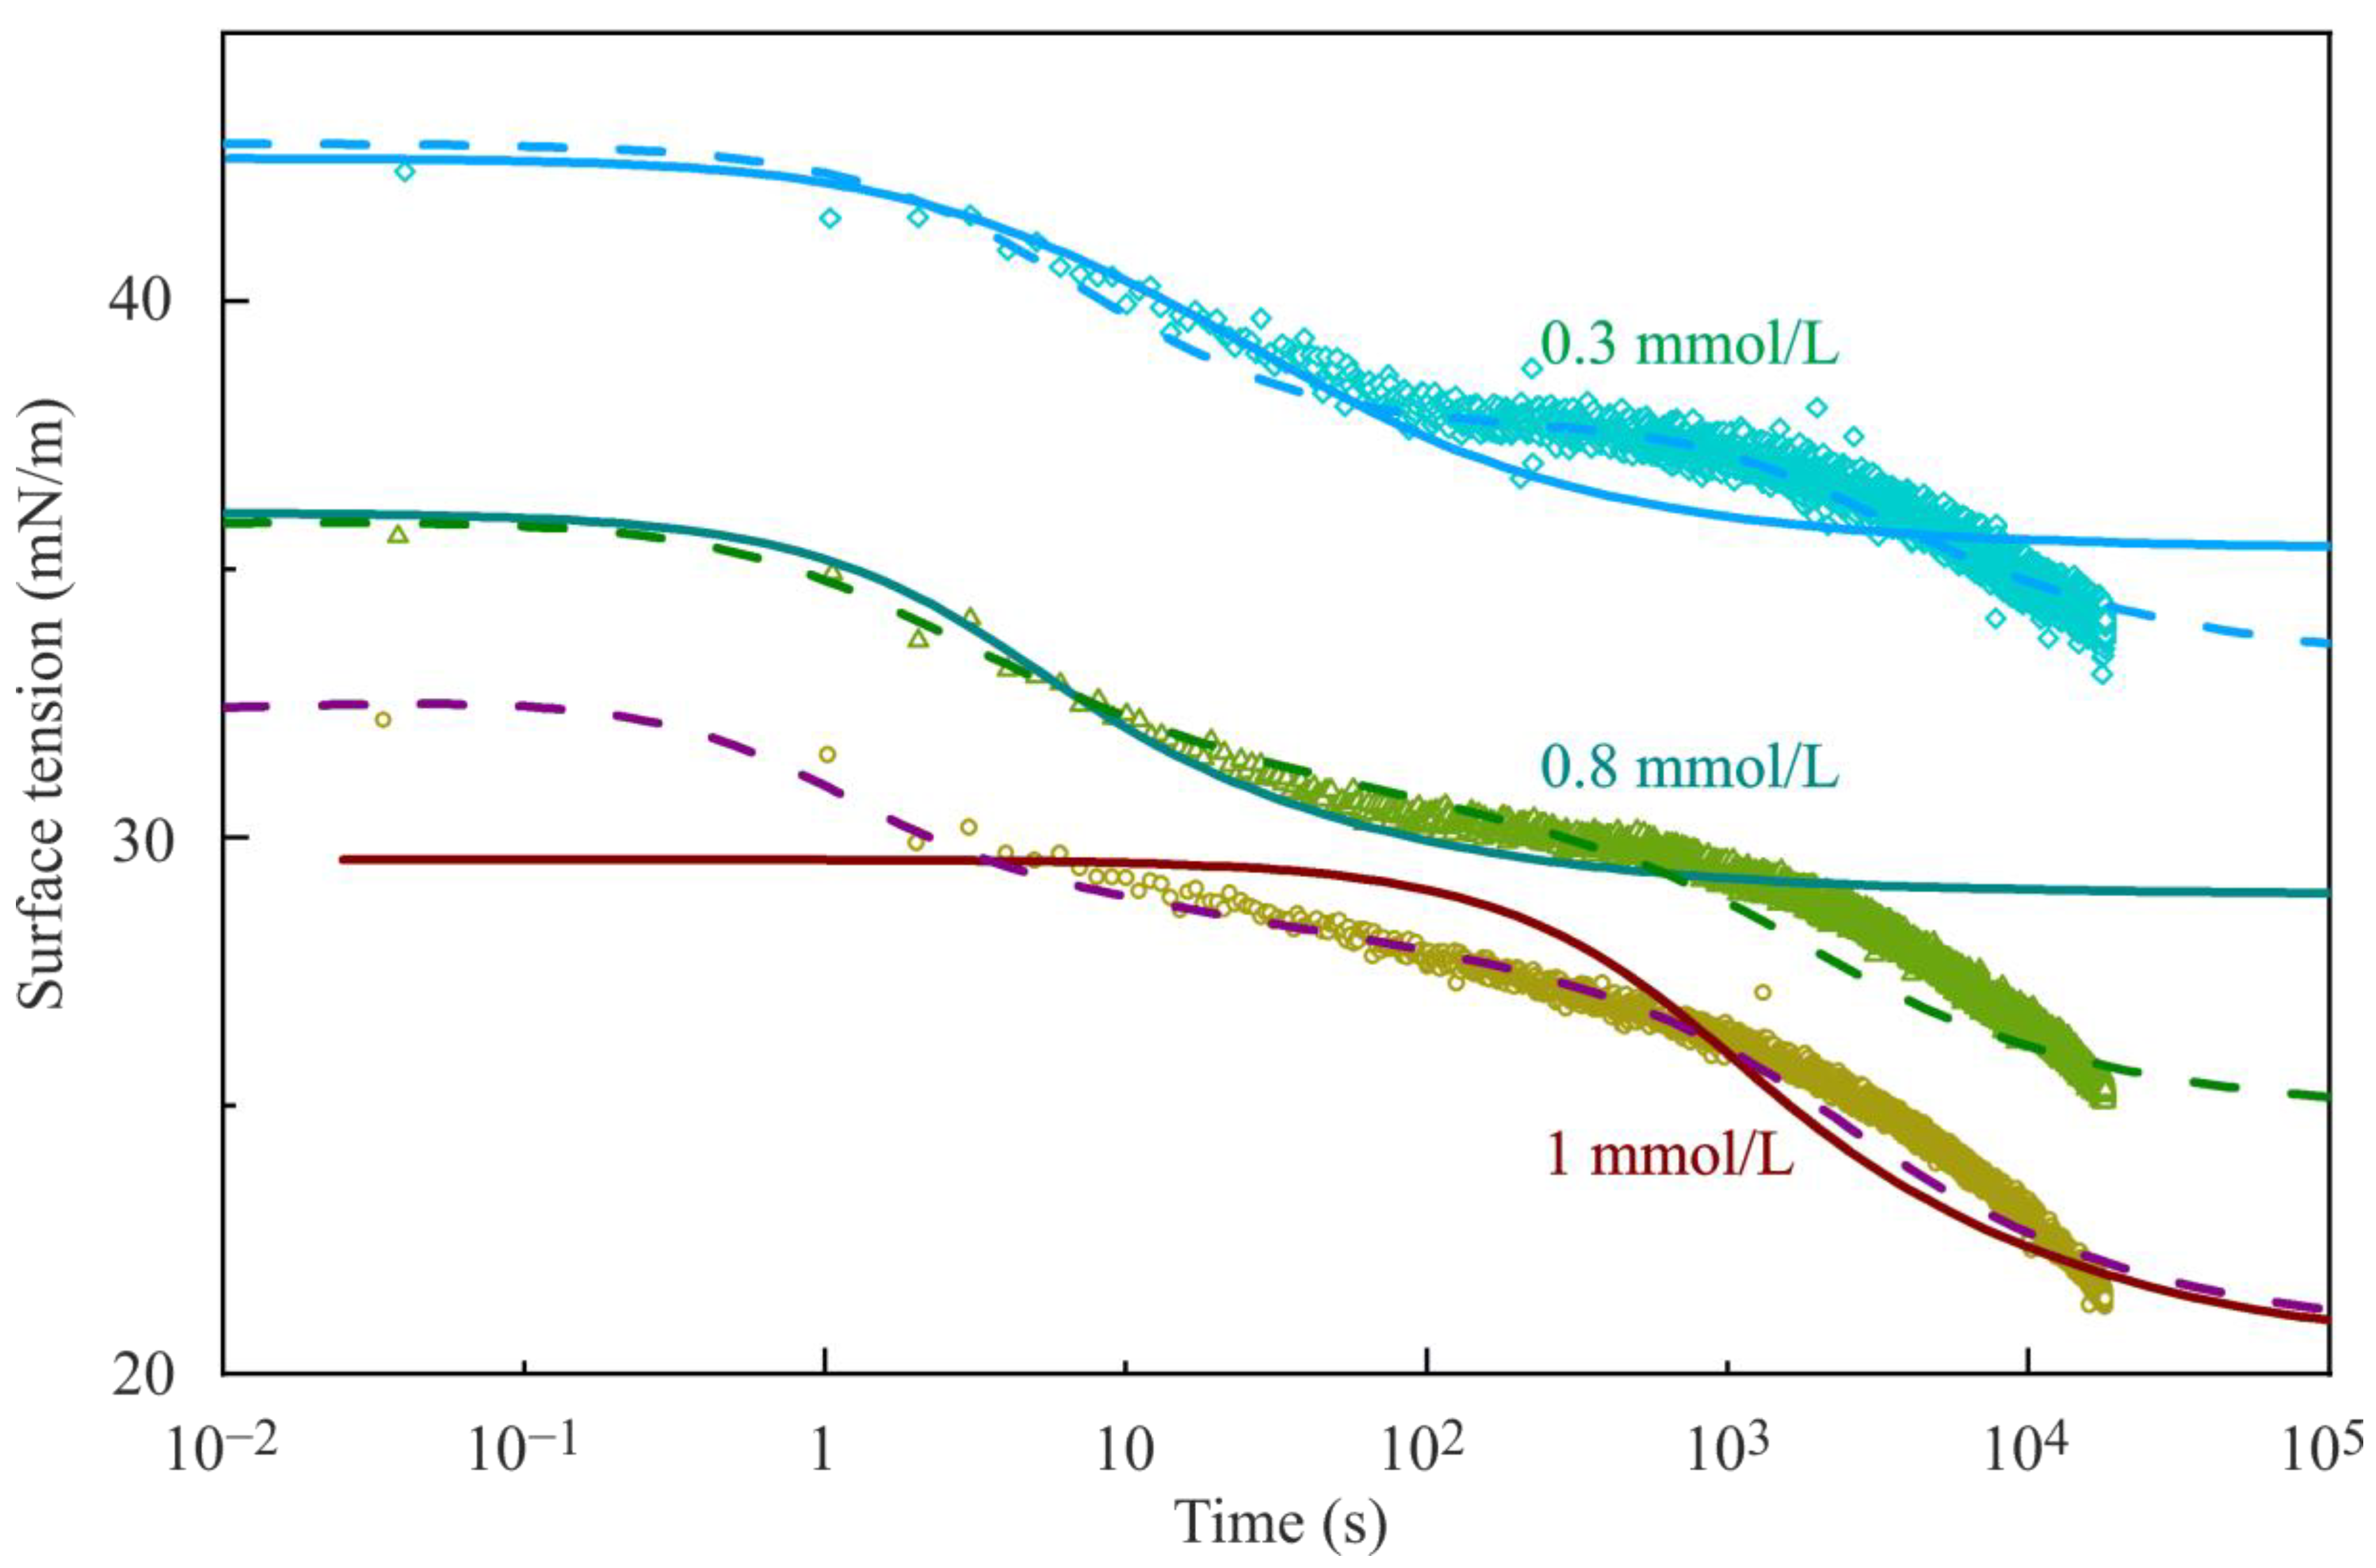
In contrast to the experimental results in
Figure 9, the experimental points shown in
Figure 10 were recorded systematically from about 0.04 s on, using a capillary pressure tensiometer [
34]. Note, as the experimental efforts for such short time interfacial tension measurements is rather time consuming, we did not apply it to the other systems under investigation, as only slightly more experimental data are available in this way. The adsorption kinetics of the catanionic dimers NaC
6SO
4 + C
12TAB show again a very fast adsorption kinetic, similar to the single C
12TAB molecules [
33].
As one can see in
Figure 10, after a first leveling off, a second decrease of the interfacial tension starts. From studies with mixed surfactants we know that this shoulder and the second decrease indicate the presence of a second surfactant compound adsorbing at the interface [
6]. At the studied bulk concentrations, we can exclude NaC
6SO
4 as this second adsorbing component because it adsorbs only at much higher concentrations. Another option would be the existence of the homologous alcohol of NaC
6SO4, i.e., hexanol, present as unavoidable impurity in aqueous solution. Hexanol would have a surface activity about 500 time higher than the homologous hexyl sulphate, however, it would not remarkably influence the interfacial tension due to its solubility in the oil phase hexane [
35].
Thus, the complex adsorption behavior presented in
Figure 10 can refer only to the dimers NaC
6SO
4 + C
12TAB and C
12TAB as unbound single surfactant with a sufficiently high surface activity as shown in
Figure 6 and discussed in [
30]. The corresponding parameter values of the two models are summarized in
Table 10 and
Table 11, respectively. Although the system obviously contains two different compounds that adsorb at the interface, we used only a one-component model because the dimers and the single cationic have almost the same surface activity. As one can see, while the Frumkin model does not appropriately describe the experimental curves, the reorientation model does and shows the shoulder and the second decrease in interfacial tension, probably caused by a change in the orientation of the adsorbed molecules.

 ,
, 


