One- and Two-Dimensional NMR in Studying Wood–Water Interaction at Moisturizing Spruce. Anisotropy of Water Self-Diffusion

Institute of Organic Chemistry, Johannes Kepler University Linz, Altenbergerstraße 69, 4040 Linz, Austria
†
Current Address: Glasgow Experimental MRI Centre, Institute of Neuroscience and Psychology, College of Medical, Veterinary and Life Sciences, University of Glasgow, Glasgow G61 1QH, UK.
Colloids Interfaces 2019, 3(3), 54; https://doi.org/10.3390/colloids3030054
Submission received: 6 June 2019
/
Revised: 28 July 2019
/
Accepted: 29 July 2019
/
Published: 2 August 2019
(This article belongs to the Special Issue Wetting on Micro/Nano-Scale: From Fundamentals to Application)
Abstract
:This paper examines how wetting the surface of wood affects characteristics of wood materials. An important question is how moisturizing wood has an effect on diffusion parameters of water, which will change conditions of the technological treatment of material. A fibrous structure of wood can result in different diffusivities of water in the perpendicular direction and along the wood fibers. The work explores how 1- and 2-dimensional NMR with pulsed field gradients (PFG) highlights an anisotropic diffusion of water when moisturizing spruce wood. The methods applied: T2-relaxation (CPMG) measurements with the application of inverse Laplace transform (ILT), cross-relaxation experiments (Goldman–Shen pulse sequence), 1D PFG NMR on oriented wood pieces or applying gradients in various orientation, and 2D diffusion-diffusion correlation spectroscopy (DDCOSY) with two pairs of colinear gradient pulses. The results showed anisotropic restricted diffusion correlating the size of tracheid cells. The experimental 2D diffusion-diffusion correlation maps were compared with model calculations based on parameters of 2D experiment on spruce and the theory of 2D DDCOSY with ILT. Moisturizing spruce wood resulted in anisotropic diffusion coefficient which can be monitored in 2D NMR to discover different diffusion coefficients of water along the axis of wood fibers and in orthogonal direction.
1. Introduction
Wood is a natural fibrous material with porous structure which allows a transfer of water through the pores [1,2]. This water transport corresponds to the wettability of the wood material, which changes for different kinds of wood and various surface and inner microstructures [3,4]. It can result in various moisture of wood and change in the properties of material [5,6,7,8]. Wood is anisotropic composite material [8,9]. Therefore, the properties of wood can be different in longitudinal (along the fiber direction), radial (across the grown rings) and tangential (at a tangent to the rings) orientations [6,7,8,9,10].
Moisture of wood is the critical parameter affecting technological regimes of treatment of wood materials [2,3,4,5,6]. It is important to know how wetting the wood affects porous microstructure and how to find suitable methods for estimation of pore-water interactions and water transport during changing moisture of wood [3,4,5,6,7,8,9]. Different methods including those based on the phenomenon of nuclear magnetic resonance (NMR spectroscopy and NMR Imaging) have been applied and developed to monitor wettability and saturation of different porous materials with water [1,4,11,12,13,14]. For instance, different NMR techniques (spin-spin relaxation time (T2) as a function of saturation, spin-lattice relaxation time (T1) NMR dispersion, T2 shift, NMR diffusion and T1/T2 ratio) have been probed for wettability measurements on chalk, rock, sandstone, coal [14,15,16,17]. Because NMR signal is sensitive to the interaction of liquid with solid surface, it is considered to be a suitable candidate for determination of wettability [11,12,14,15,16]. Advantages of magnetic resonance methods are associated with quickness of measurement, and the result of the measurement (diffusion coefficient D and T1 and T2 relaxation times) can be obtained in real time [16]. A correlation between these NMR parameters is also important in such experiments because wettability affects all those parameters [14,15]. NMR signal can be sensitive also to other different properties of a material. Therefore, in practice, information about wettability from NMR data obtained can be extracted if the NMR parameters (T1, T2 or D) have been already obtained and treated for proper analysis [14,15,16]. Considering the wettability as the interaction between the molecules of liquid and a solid surface, an intensity of these solid-water interactions can be clarified from the value of the T1/T2 ratio [11,12,16]. The ratio of spin-lattice relaxation time to spin-spin relaxation time is supposed to test the local wettability. Using the effective relaxivity, the authors of Reference [12] consider the T2–D data for obtaining the wetting surface coverage.
As for moisturizing wood materials, these considered NMR parameters have not been studied properly to obtain the details on wood–water interaction in pieces of felled mature spruce in a wide range of water contents. However, some published data on spruce [7,8,18] showed that a cross-relaxation process between protons of solid surface and the ones of water can affect the behaviour of T1 relaxation and should be considered for correct estimation of self-diffusion coefficients at various diffusion times with stimulated-echo pulse sequence [19,20]. Additionally, it was shown [18,21] that 2D correlation experiments with two pairs of gradient pulses applied in orthogonal directions to wood pieces can be valuable means to define an anisotropy of water self-diffusion. The current work is going further to study an interaction between water and spruce wood surface applying for one- and two-dimensional pulsed field gradients (PFG) NMR experiments. This is to show how cross-relaxation effect and diffusion-diffusion correlations should be considered in analysis of the results on water anisotropic diffusion at wetting the spruce wood. The work is looking for the details of wood–water interaction also at higher water amount than fiber saturation point (FSP). This point does mean such an amount of water in wood when only bound water is present in the spruce material, i.e., at FSP, there is no free water in the wood [8,21]. From the other side, if added water results in the range of moisture above the FSP, three T2 components (two are between 0.1 and 10 ms, and third one is in a slow relaxing range of 20–140 ms) can be observed [7,8].
The present work shows how the relaxation spectra of water components at moisturizing spruce wood and apparent diffusion coefficients measured in one dimensional PFG NMR experiments on wood with different orientation of the samples to the magnetic field or different direction of gradients produce valuable information about microstructure giving an estimation of cell sizes in conditions of restricted diffusion and anisotropic properties of water in spruce pieces. In addition to this, for model of water diffusion anisotropy with two different diffusion coefficients in two orthogonal directions, it was shown that 2D diffusion-diffusion correlation experiment with collinear pairs of gradients and the use of Inverse Laplace Transform result in 2D diffusion map with two spots on a diagonal as a reflection of two different diffusion coefficients. The results of 2D experiments were in line with theoretical calculations. That gave an opportunity to follow a change in diffusional anisotropy with moisturizing spruce wood. As this capacity is governed by moisture transport, the data obtained would clarify water–wood interaction and highlight more details about diffusivity and NMR relaxation parameters used in characterization of wettability properties.
2. Materials, Methods and Theory
Preparation of samples. Felled mature Sitka spruce (Picea sitchensis) pieces were used. The samples for NMR studies were cut from original pieces of wood, and they had a roughly shape of a cube (size 6 × 6 × 6 mm3 = longitudinal, radial and transverse) or a parallelepiped (size 6 × 6 × 10 mm3). Prepared samples were covered by the polymer film and kept in the fridge before the start of the experiment. They could be tested in an NMR probe at different moisture conditions including drying in oven until constant weight. Dried samples were used in wetting experiments. After moisturizing the samples, each of the pieces was then placed in a 10 mm NMR tube and sealed. A stopper was used on the top of each sample to prevent an evaporation of water from the sample during NMR experiment. A 400 MHz Chemagnetics Infinity spectrometer equipped with a 10 mm Fraunhofer Institute 1H probe and a vertical wide-bore (89 mm) Magnex superconducting magnet was used for measurements of free induction decay (FID), T1, T2 and cross relaxations, and PFG NMR diffusion [22,23,24,25].
Water content in the samples was made in opened supported system under atmosphere of relative water humidity (in desiccator) and measured in g H2O/g dry matter [20]. The samples were weighed before and after hydration. In wettability experiments, a placement of water drops on the surface of wood pieces was realised following equilibrium distribution of water inside the sample. The samples of both kinds were compared by FID and/T2 peaks distribution analysis for 6–36 h to monitor establishing equilibrium of water distribution across the sample.
NMR methods. The spin-lattice relaxation times were measured using the inversion recovery pulse sequence (180°–τ–90°) whereas T2 measurements have been carried out using Carr–Purcell–Meiboom–Gill (CPMG) pulse sequence [7,22,25]. The sample was placed within the volume of the probe coil to ensure RF field homogeneity. All measurements were performed at proton resonance frequency of 400 MHz and at room temperature. The 90° pulse length was 8–10 μs. The dead time was 6–8 μs. Time for repetition of pulse sequence was typically 1 s, and 1024 averages were acquired per spectrum. A signal from the probe with empty NMR tube was small. It was routinely subtracted from the total signal in the experiment. After measurements wood samples were kept in the fridge (5 °C).
FID. The FID signals measured in hydrated wood samples were also converted from the time domain to the frequency domain using the Fourier transform (for additional analysis of frequency spectra). The result of this transformation presented a spectral line of proton resonance signal. The signal of total time domain in hydrated wood sample is the sum of the signals of the water protons and the protons of macromolecules of wood. Figure 1 shows FID data from 1H NMR experiments on wood samples with different moisture content (one FID is for dry sample, and other FID is for the sample with big amount of added water). For hydrated wood sample (Figure 1), FID is characterized by the total amplitude of the protons of wood and the water protons, i.e., A = Awat + Awood. Gaussian-sinc function is normally fitted to the proton signal of the wood part of FID, whereas the water part can be described by exponential or Voigt functions [7,8,22].
CPMG. When measuring T2 in the wood with the CPMG pulse sequence, a time interval of 0.025 ms between pulses is commonly used. Normally, 8000 echoes are applied to cover the full range for CPMG decay in wet wood. For dry wood samples, about 1000–2000 echoes (or fewer) were often enough to perform correct CPMG experiment. For very wet spruce samples, the pulse gap interval in the CPMG experiment was increased up to 0.5 ms. Echo decays were inverted using the Inverse Laplace Transform algorithm. Alternatively, to get NMR relaxation times, the analysis of raw data sets was also conducted by performing the non-linear least squares fit (a sum of several exponential functions) to the data (using in-house MatLab® codes).
Figure 2 gives an example of CPMG measurement on wet wood sample and following treatment of findings to result in T2 distribution. This is a case with wettability higher FSP, when all T2 peaks are observed in the range from 2–3 ms to 80 ms testifying that a huge amount of water is still in mobile state, and no observable bound water with spin-spin relaxation times less than 1 ms. The Inverse Laplace Transform is used for extraction of f(T2) from the CPMG echo train [8,21], i.e., the data can be modelled applying ILT in one direction. The probability density f(T2) is calculated from the spin-echo signal Mt presented elsewhere [7,20,22].
PFG. The PFG NMR was applied in one and two dimensions [7,8,21,22,23,24,25,26]. In one-dimension PFG experiments, in order to cover a long range of diffusion times, spin-echo pulse sequence (SE) with two RF pulses (90° and 180°) and stimulated-echo (STE) pulse sequence with three 90° RF pulses were applied. After application of a pair of gradient pulses [8,22,23,27], the amplitudes of echo were monitored. The gradient pulses had a duration 2 ms and maximum amplitude Gmax = 1.2 T/m. Typically, 1024 averages with a repetition time of 1 s were recorded per echo spectrum.
In order to carry out experiments with the correct orientation of wood samples (longitudinal, transverse or radial) to direction of X- (Y-) gradients, it was necessary to detect the orientations of the gradient with respect to the sample in the coil. These correct directions of the gradients in relation to faces of the sample should be found before placement of NMR tube with wood sample into the coil for measurement. The wood samples were prepared in the manner of a cube with flat face. 1D Imaging (profile) experiments on two narrow glass capillaries with doped water were applied for finding the gradient orientation (Figure 3). At rotation of the sample with 2 vertical capillary tubes around Z-direction (magnetic field B0), the profile spectra were dependent on rotation angle and changed from 2 peaks to 1 peak. The targeted case in this rotation imaging experiment was a coalescence of two peaks into one peak that occurs at the orientation of the X- (Y-) gradient in the plane of 2 capillaries (Figure 3).
The PFG NMR methods (SE and STE) measure self-diffusion when the nuclear spins are labelled by their frequencies of Larmor precession in a varying magnetic field after applying a field gradient (with strength G and duration δ). NMR signal of echo is registered during increasing the gradient value. Echo intensity is smaller than that in absence of gradients. The measured signal is presented according to Equation (1) [22,23,24]:
Here, γ is the (1H) nuclear gyromagnetic ratio. Δ is the time interval between front edges of gradient pulses. I(0) is the echo intensity in absence of gradients. For free diffusion, this equation can be applied to calculate the diffusion coefficient from the dependence of expression 1 on G2. I(0) ~ exp(−τ1/T2) for SE pulse sequence (τ1 is the gap between 90° and 180° RF pulses), and I(0) ~ exp(−2τ1/T2).exp(−τ2/T1) for STE pulse sequence. In the case of STE, τ1 is the time gap between first 90° and second 90° RF pulses whereas τ2 is the time interval between second 90° and third 90° RF pulses). The stimulated echo is less sensitive to T2 relaxation. NMR STE diffusion experiment is sensitive to T1 relaxation.
Cross relaxation. The studies of wood samples showed that there is a proton exchange between the water and exchangeable protons of wood fibers. That is why spin-lattice relaxation shows two components, and the changes in the intensity of relaxing components are associated with this exchange [7,19,20]. Many macromolecular systems with low moisture content showed this cross-relaxation effect (CR) [8,19]. We implemented cross-relaxation experiments on wood pieces with different moisture content with the aid of Goldman–Shen (GS) pulse sequence (90°x–τo–90°−x–t–90°x) [19,20,28]. The sequence applies first two pulses to separate longitudinal magnetizations of macromolecular protons and water protons. After first π/2 RF pulse, i.e., when τ0 is varied, the wood signal disappears very fast whereas the water magnetization practically does not change. An application of the second RF pulse (90°−x) rotates the magnetization of water proton back to the steady magnetic field. In order to analyze the CR effect properly, we assume that wood with water can be described as two-phase system which consists from protons of water phase and protons of macromolecules (wood). According to accepted wisdom in the literature view on hydrated macromolecular systems, the equations describing the longitudinal relaxation of both phases in the presence of cross relaxation includes exchange terms in the Bloch equations for the Z magnetization of both phases [7,19]. Then, mw(t) and mm(t) can be defined as time-dependent Z magnetizations of the water protons and the protons of macromolecules (wood phase) with equilibrium values mwe and mme. R1w and R1m can be considered as intrinsic longitudinal relaxation rates, and kw and km are the exchange rate constants. pw = km/(kw + km) and pm = kw/(kw + km) are the fractions of the protons belonging to these two phases. The equations for the longitudinal relaxation of protons in these two phases in presence of cross relaxation are presented and discussed anywhere [8,19,20,21]. Reference [19] presents the complete expression for stimulated-echo attenuation in the presence of cross relaxation. The authors showed that when the combined parameter C = kw + R1w − km − R1m and the product kwkm are found, the diffusion coefficient can be determined by analysis of the echo-attenuation curve with the cross-relaxation factor [7,19].
2D DDCOSY. 2D diffusion-diffusion correlation NMR studies were carried out with combined two SE pulse sequences and two pairs of collinear gradients according previous description in References [7,18,24,25,26,27,28]. 2D ILT with algorithm from References [29,30,31,32] has been used to invert echo decays and produce 2D maps. Additionally, the parameters from 2D experiments on wood were used in simulations based on the theory of DDCOSY studies with collinear gradients [7,20,24,25,29]. In 2D studies, the signal is recorded as function of two variables. In common 2D spectroscopy, fast Fourier transform is used to produce 2D data. In Reference [31], the authors presented 2D T1 − T2 correlation experiment and described how to use 2D ILT to analyze the data acquired as two-dimensional array and to get 2D maps with T1 and T2. In [30], the authors solved the class of the 2D Fredholm integrals. These approaches have been developed further in studying diffusion-diffusion correlations in 2D experiments on different materials [25,29,33]. For the case of echo-attenuation in 2D diffusion experiment, the expressions for signals can be found in References [24,26,29]. In the works on diffusion-diffusion correlations in materials with anisotropic properties [24,29], the scheme with axial symmetry was assumed in order to apply the equations to the locally anisotropic diffusion domains which could be randomly oriented.
In wood pieces, the tracheid cells can be characterized by molecular frame with diffusion anisotropy [7,8,18]. The algorithm of the works [30,31] gives an opportunity to carry out two-dimensional numerical ILT for the 2D data measured on anisotropic samples. Targeting the echo signal, the algorithm solves the double integral equation for signal as a function of two variables q1 = (γGδ)1 and q2 = (γGδ)2 which can be varied independently. Therefore, based on the DDCOSY theory and published data on different anisotropic materials, it is reasonable to suggest that diffusion behavior in wood is characterized by the diffusion tensor with axial symmetry, i.e., by two diffusivities D1 and D2 along the local axes in molecular frame. The echo attenuation in 2D diffusion-diffusion correlation experiment can be described by Equation (2) [29,34]:
With this model approach, a distribution of the diffusion tensor elements in 2D (SE and STE) experiments has been calculated [7,25,33]. 2D ILT results in D1 and D2 as diffusion tensor elements [18]. When the matrices of echo signals are numerically calculated, then 2D ILT transforms them into spectral 2D maps. In simulation study, the matrices I(q12,q22) for various D1 and D2 with given ratios of D1/D2 = 1; 5; 10 have been calculated using such experimental parameters as values of gradients, diffusion times and gradient pulse length. Therefore, the parameters from two-dimensional DDCOSY experiments with two pairs of collinear gradients have been introduced into variables q1 and q2 (the wave vectors q1 and q2 were oriented in one direction) to produce the matrices of the echo signals. Next, a signal analysis applied 2D ILT to produce 2D map for diffusion tensor elements.
3. Results and Discussion
Figure 4 (top) presents intensity of the normalized deviation Δmw = (Mw(t) − Mweq)/Mweq from the equilibrium value of longitudinal magnetization of the water phase (Mweq) in spruce wood according to considered cross-relaxation model [8,18,20] in series of Equations (3)–(7):
From fitting the data to Equations (3)–(7), the values of c+, c−, R+, and R− are found. According to the Reference [19], the equations presented above may be rewritten as: (R+ − R−)(c+ − c−) = C Δmw(0) – 2kwΔmm(0) and (c+ + c−) = Δmw(0). It is easier to analyse CR equations when Δmm(0) will be the value of −1 (at chosen long time interval τ0 between 1st and 2nd 90° pulses). Then, this expression consists of a part (term CΔmw(0)) with linear dependence on Δmw(0) (Figure 4, bottom) and a term which approaches to constant value 2kw very fast [19].
Cross-relaxation effect was depending on the water content in the wood spruce. When wettability of the wood sample was very low, e.g., 0.03 g H2O/g dry matter, there was no any mobile component in T2 distribution. All observable water signals characterizing bound water had T2 about 1 ms or less. In these conditions, the cross-relaxation rate was estimated as kw ~39 s−1. The value of cross-relaxation rate was decreasing when water content was increasing. For instance, at wettability corresponding to ~0.55 g H2O/g dry matter, the GS experiment resulted in the cross-relaxation rate kw ~ 15 s−1. The CR was a reason for bi-exponential behavior of the longitudinal magnetization [7,20,34]. When the spin-lattice relaxation rate of water on the water-macromolecule boundary was less than the exchange rate of spin energy through the interface, the CR effect was significant [8,28]. With CR data obtained, apparent diffusion coefficient in spruce with different water content could be corrected using CR factor [8,19,21,34].
The raw data in 1D PFG NMR experiment have been measured and presented as the echo signals in the frequency domain. Figure 5 (left) shows how the echo intensities changed with increasing value of gradient. Further, the intensities of echoes were collected for all gradient steps and presented as echo attenuation vs G2. Figure 5 (right) shows the intensities of echoes as dependence on G2. Fitting linear part of echo-attenuation experimental curves by Equation (1) results in calculation of apparent diffusion coefficients D. With CR factor, the diffusion coefficients could be presented as a dependence on effective diffusion time Δ (Figure 6).
In the PFG experiments on spruce wood (e.g., in Figure 6), the orientation of the gradient in longitudinal (along magnetic field B0) or tangential (radial) direction to face of wood piece discovered anisotropy, i.e., difference in diffusion coefficients (1.82 times at Δ = 10 ms). When a wettability was increasing, e.g., exceeded 0.8 g H2O/g dry mass of wood sample, a diffusional anisotropy decreased, i.e., became equal to 1.6 (at Δ = 17 ms). At the same measurable conditions, the sample of bulk water showed the diffusion coefficient of 2.37 × 10⁻⁹ m2/s which was not changing with increasing Δ value within error of measurements. Therefore, this discovered anisotropic self-diffusion of water in spruce wood (self-diffusion coefficient D1 in direction of wood fibers oriented along the static magnetic field B0 and D2 in perpendicular direction) was in line with published data on diffusional anisotropy in fibrous materials, e.g., in collagenous tissues and natural silk [8,34,35,36,37].
In comparison with isotropic diffusion (e.g., in solutions, when all directions of motion are equivalent), water diffusion in spruce wood is with preferred direction along the wood fibers. Many factors, e.g., permeability of cell membranes, pore size and pore size distribution can affect an anisotropy [8,34,36]. Therefore, it is not obvious how to quantify a diffusion anisotropy in spruce pieces correctly. The nature of the wood sample and alignment of the tracheid cells are responsible for the barriers to diffusion. In the natural environment of wood cells, there is water transport along the length of the tracheid cell. Additionally, there are barriers to water movement in transverse direction. In the wood, the diffusion rates are not equal in different directions. Therefore, structural morphology in wood can result in diffusion anisotropy.
In the spruce wood, the tracheid cells are mostly vertical narrow ones. The length of the cells is circa ~2 mm whereas cell diameters are in the range of 20 to 40 µm. The walls of the tracheid cells cause the restrictions for water diffusion. Water diffusion along the length of the cell is less restricted than diffusion motion of water in tangential (radial) directions. Therefore, the orientation of the gradient to the wood cells effected on the dependence of echo intensity on gradient values. For direction of applied gradient along magnetic field B0 and in perpendicular one, different values of D have been measured. In comparative PFG experiments, when the gradient was applied in radial or tangential directions to faces of wood pieces, there was no discovered systematic variation in D values. Therefore, anisotropic diffusion motion has been found in spruce samples only at comparison of longitudinal (along tracheid cells) and perpendicular directions.
Diffusion coefficients were dependent on diffusion time (Figure 6): they were decreasing from 5.12 × 10⁻¹⁰ m2/s (at Δ = 7 ms) with increasing diffusion time to Δ = 1100 ms (D = 0.145 × 10⁻¹⁰ m2/s). References [8,28,34,35,36,37,38,39,40] showed also that barriers of macromolecular arrangement produce a restriction phenomenon for water diffusion. Reference [38] showed also that apparent diffusion coefficient of water in eastern white pine was decreasing with increasing Δ. The authors of Reference [38] considered also that small decrease of the diffusion coefficient in longitudinal direction with increasing Δ may indicate that a degree of restriction is small, i.e., this is less than that in tangential direction. A reduction of the diffusion coefficient with increased diffusion time (longitudinal direction) was dependent on the kind/type of wood and water content in wood sample [6,9,38]. In References [8,40], the findings on the Sitka spruce wood with variation of Δ from 60 ms to maximum = 200 ms have been considered. The experiments for the diffusion times >200 ms have not been carried out in that study [40]. The apparent diffusion coefficient ~1.75 × 10⁻⁹ m2/s (at 60 ms) measured on Sitka spruce at water content of 0.7 g H2O/g dry mass (60 MHz) [40] was lower than diffusion coefficient of free bulk water. From PFG STE findings (400 MHz) on the spruce wood with moisture of 0.84 g H2O/g dry matter [8], for longitudinal direction, apparent diffusion coefficient was about ~2.1 × 10⁻⁹ m2/s at Δ = 20 ms (this D value was decreasing with increasing Δ although not in such an extent, as it was obtained for tangential direction) showing that water diffusion experiences much less restriction than that in radial or tangential orientations. The tracheid cells in wood can have the length exceeding the width up to 100 times [6,9,38,40]. This can explain anisotropic diffusion dependence for water in the spruce wood. Some published works [6,9] studied the longitudinal wood cell structure using methane and absorbed water as a probe. They found that the diffusion data could be fitted by two structural components with mean lengths of 2.88 mm and 0.29 mm.
Water diffusivity in wood samples can follow to the dependence D~Δk−1 where k value is less than 1 [28,34,41]. Therefore, the water diffusion in the spruce wood could be considered as quasi-restricted [8]. For clarifying the water diffusion in wood, it is possible to consider a material medium with barrier spacing a and arbitrary permeability p. This approach has been applied in the publications before [23,34,39,41,42,43]. The apparent diffusion coefficient measured for the small Δ values could be considered as a free diffusion coefficient D0 [7,39,42,43]. When diffusion time is increasing to big Δ values, the diffusion coefficient approaches asymptotic value Dasym. The free diffusion coefficient D0, Dasym, barrier spacing a, and permeability p are combined by Equation (8) [8,35,42,43]:
Dasym, D0, ap can be estimated from the experiment using the approach suggested by Tanner [7,23,39]. Tanner considered relative apparent diffusion coefficient Dapp/D0 vs reduced diffusion time D0.t/a2. Within the approach, Dapp/D0 became equal to 1 at zero time. Additionally, the point in the dependency of Dapp on diffusion time where Dapp is equal to its average value is used. This is in order to obtain diffusion time t1/2 and to calculate further restriction size a, and permeability p.
The 1D PFG data on anisotropic diffusion of water in spruce wood have been confirmed in 2D PFG studies. 2D spectra are calculated for the local domain. It is considered that the diffusion tensor has axial symmetry in this domain. Two diffusivities D1 and D2 characterize parallel and perpendicular movement to the local principal axis in molecular frame. This is in line with the theory of two-dimensional diffusion-diffusion correlations [24,25,26,33].
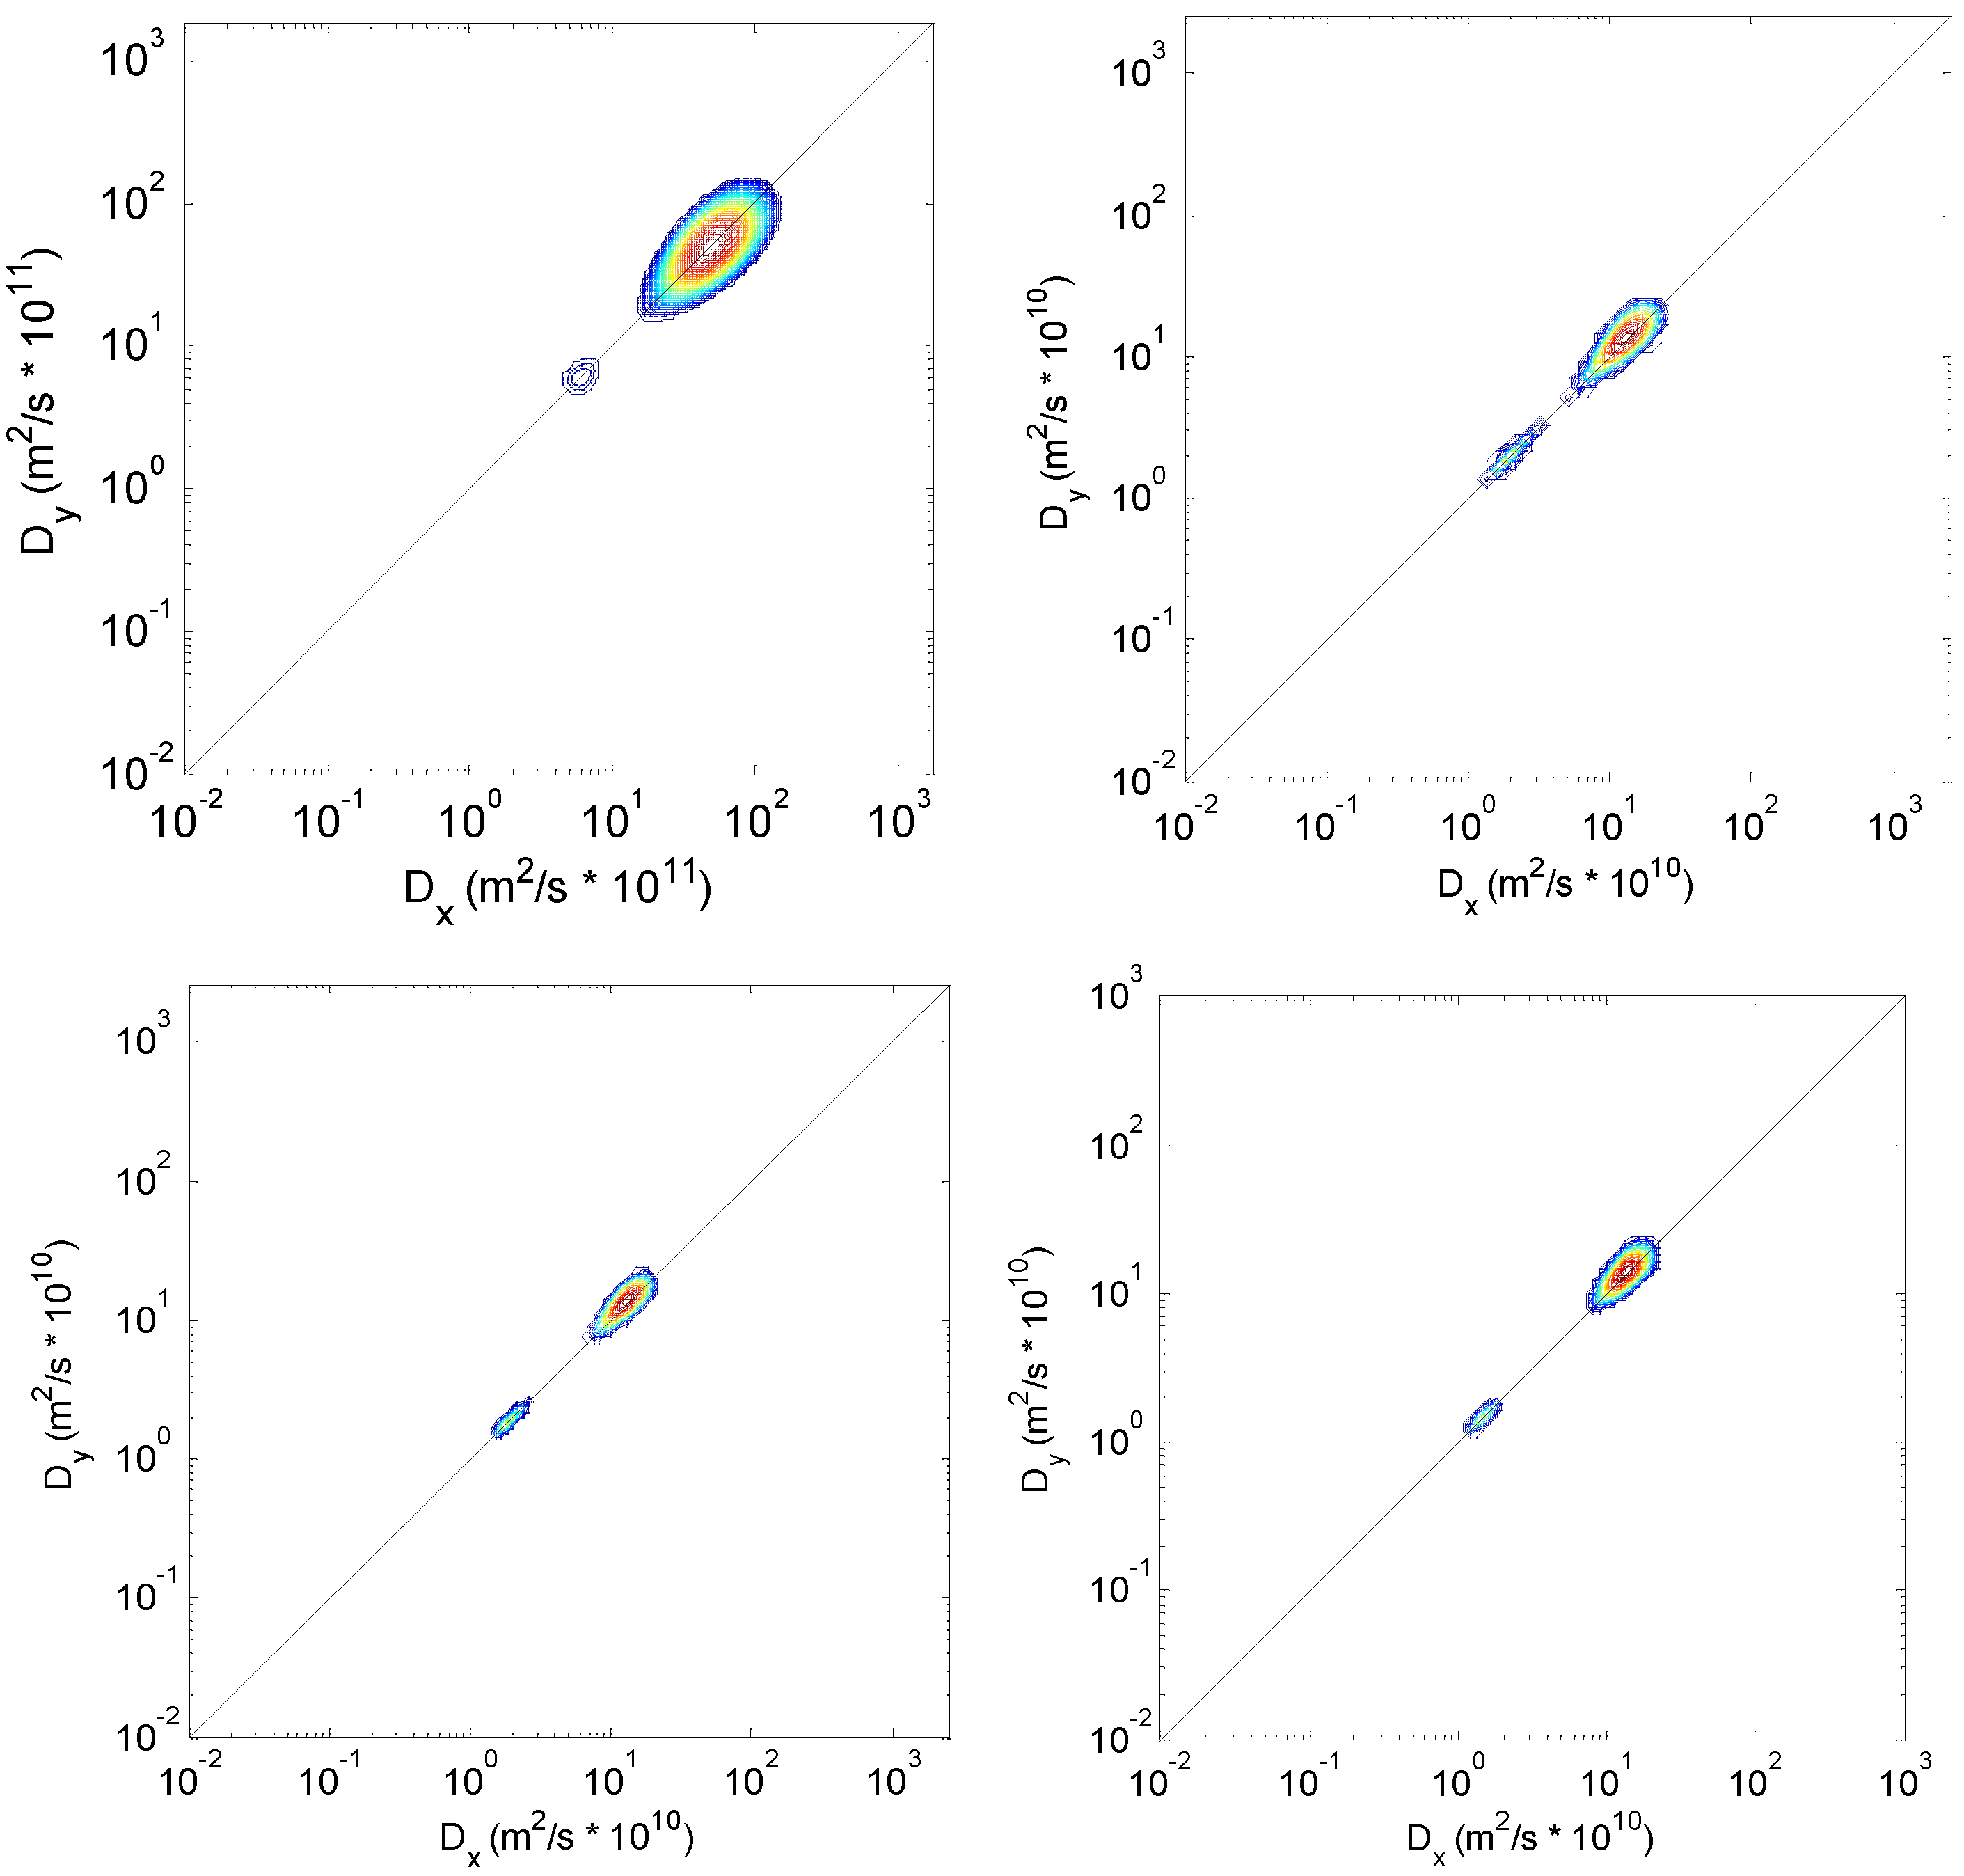
Figure 7 shows 2D diffusion-diffusion correlation maps obtained with 2D ILT on the numerically calculated 2D array at modelling anisotropic diffusion (simulation for D2 = 5D1 = 10−9 m2/s: top, left 2D spectrum) and for 2D diffusion-diffusion correlation experiments on spruce wood (top, right and bottom: three 2D spectra). Two diagonal peaks reflect diffusion anisotropy with diffusion constants D1 and D2. 2D map of isotropic diffusion with D1 = D2 = 10−9 m2/s showed one round spot on the diagonal. The 2D simulated spectra for the case of isotropic diffusion also showed one spot on the diagonal.
In previous publications on studying anisotropy in wood [7,18,21], it was shown that if the pairs of gradient pulses are oriented in perpendicular directions to each other, 2D DDCOSY experiment results in one peak (spot) on the diagonal and two long spots (wings) outside diagonal. Two diffusivities D1 and D2 are parallel and perpendicular to the local principal axis in molecular frame, and they characterize the diffusion tensor with an axial symmetry. Diffusion-diffusion correlation pulse sequence with two collinear pairs of gradients is another 2D method studying diffusion anisotropy that resulted in 2D maps with two spots on a diagonal. Moisturizing wood sample resulted in changes of distance between the diagonal peaks (Figure 7). A very wet sample could be characterized by only one spot on the diagonal.
Both DDCOSY methods have a target to look for anisotropy and local order in molecular frame whereas Diffusion-diffusion correlation experiment has a place in laboratory frame. According to these methods, the echo-attenuation function with D1 and D2 tensor elements (in molecular frame) is transferred into laboratory frame using relevant rotations. All possible orientations of local directors of molecular coordinate system are used to produce the total summary of echo attenuations. In diffusion-diffusion correlation experiments, two pairs of gradient pulses can be applied independently in different directions.
4. Conclusions
Water is the most important fluid that exists naturally in wood and reveals anisotropic properties. Moreover, wettability of wood materials changes these properties. Because of the importance of NMR parameters in characterization of wood–water interactions, there is need to clarify more details on effects of wettability/moisturizing wood. This work shows how the methods of NMR relaxation and NMR diffusion (1D and 2D) can be applied correctly in order to investigate wood–water interactions in the porous structure of spruce wood. The findings and discussion suggest new possibilities in developing NMR methods for characterization of wettability effects on wood. The results obtained clarify how NMR parameters (relaxation times and apparent diffusion coefficients) should be applied in studying and analysing wood.
Funding
This research received no external funding.
Acknowledgments
The author thanks Peter McDonald and Marc Jones.
Conflicts of Interest
The author declares no conflict of interest.
References
- Sedighi Moghaddam, M.; Wålinder, M.E.P.; Claesson, P.M.; Swerin, A. Wettability and swelling of acetylated and furfurylated wood analyzed by multicycle Wilhelmy plate method. Holzforschung 2015. [Google Scholar] [CrossRef]
- Arends, T.; Barakat, A.J.; Pel, L. Moisture transport in pine wood during one-sided heating studied by NMR. Exp. Therm. Fluid Sci. 2018, 99, 259–271. [Google Scholar] [CrossRef]
- Sedighi Moghaddam, M. Wettability of modified wood. Ph.D. Thesis, KTH Royal Institute of Technology, Stockholm, Sweden, 2015. [Google Scholar]
- Kudela, J. Wetting of wood surface by liquids of different polarity. Wood Res. 2014, 59, 11–24. [Google Scholar]
- Lindner, M.; Werhahn-Mees, W.; Suominen, T.; Vötter, D. Conducting sustainability impact assessments of forestry—Wood chains: Examples of ToSIA applications. Eur. J. For. Res. 2012, 131, 21–34. [Google Scholar] [CrossRef]
- Kekkonen, P. Characterization of thermally modified wood by NMR spectroscopy: Microstructure and moisture components. Ph.D. Thesis, University of Oulu, Oulu, Finland, 2014. [Google Scholar]
- Rodin, V.V. Methods of magnetic resonance in studying natural biomaterials. In Encyclopedia of Physical Organic Chemistry, 1st ed.; Wang, Z., Ed.; John Wiley & Sons, Inc.: New York, NY, USA, 2017; Volume 4, pp. 2861–2908. [Google Scholar] [CrossRef]
- Rodin, V.V. Magnetic Resonance in Studying Natural and Synthetic Materials, 1st ed.; Bentham Science Publishers: Sharjah, UAE, 2018; p. 244. [Google Scholar]
- Kekkonen, P.M.; Telkki, V.-V.; Jokisaari, J. Determining the Highly Anisotropic Cell Structures of Pinus sylvestris in Three Orthogonal Directions by PGSTE NMR of Absorbed Water and Methane. J. Phys. Chem. B 2009, 113, 1080–1084. [Google Scholar] [CrossRef] [PubMed]
- Javed, M.A.; Kekkonen, P.M.; Ahola, S.; Telkki, V.-V. Magnetic resonance imaging study of water absorption in thermally modified pine wood. Holzforschung 2015, 69, 899–907. [Google Scholar] [CrossRef]
- Al-muthana, A.S.; Hursan, G.G.; Ma, S.M.; Valori, A.; Nicot, B.; Singer, P.M. Wettability as a function of pore size by NMR. In Proceedings of the International Symposium of the Society of Core Analysts, Aberdeen, Scotland, UK, 27–30 August 2012. [Google Scholar]
- Wang, J.; Xiao, L.; Liao, G.; Zhang, Y.; Guo, L.; Arns, C.H.; Sun, Z. Theoretical investigation of heterogeneous wettability in porous media using NMR. Sci. Rep. 2018, 8, 13450. [Google Scholar] [CrossRef] [PubMed]
- Godefroy, S.; Korb, J.-P.; Fleury, M.; Bryant, R.G. Surface nuclear magnetic relaxation and dynamics of water and oil in macroporous media. Phys. Rev. E 2001, 64, 1–13. [Google Scholar] [CrossRef]
- Al-Mahrooqi, S.; Grattoni, C.; Moss, A.; Jing, X. An investigation of the effect of wettability on NMR characteristics of sandstone rock and fluid systems. J. Pet. Sci. Eng. 2003, 39, 389–398. [Google Scholar] [CrossRef]
- Johannesen, E.; Steinsbø, M.; Howard, J. Wettability characterization by NMR T2 measurements in chalk. In Proceedings of the International Symposium of the Society of Core Analysts, Trondheim, Norway, 12–16 September 2006. [Google Scholar]
- Valori, A.; Hursan, G.; Ma, S.M. Laboratory and downhole wettability from NMR T1/T2 ratio. Petrophysics 2017, 58, 352–365. [Google Scholar]
- Xu, C.; Zhou, G.; Qiu, H. Analysis of the microscopic mechanism of coal wettability evolution in different metamorphic states based on NMR and XPS experiments. RSC Adv. 2017, 7, 47954–47965. [Google Scholar] [CrossRef] [Green Version]
- Rodin, V.V.; McDonald, P.J.; Jones, M. Two-dimensional distribution function of diffusion in wood obtained using 2D Laplace inversion. App. Phys. Math. 2014, 6, 3–7. [Google Scholar]
- Peschier, L.; Bouwstra, J.; De Bleyser, J.; Junginger, H.; Leyte, J. Cross-Relaxation Effects in Pulsed-Field-Gradient Stimulated-Echo Measurements on Water in a Macromolecular Matrix. J. Magn. Reson. Ser. B 1996, 110, 150–157. [Google Scholar] [CrossRef]
- Rodin, V.V.; Foucat, L.; Renou, J.-P. Natural polymers according to NMR data: Cross relaxation in hydrated collagen macromolecules from two connective tissues. Biophysics 2004, 49, 608–616. [Google Scholar] [PubMed]
- Rodin, V.V. Macromolecular hydration: NMR studies. In Encyclopedia of Biophysics, 2nd ed.; Roberts, G.C.K., Watts, A., Eds.; Springer: Berlin, Germany, 2018; pp. 1–13. [Google Scholar] [CrossRef]
- Rodin, V.V. Magnetic Resonance Methods; Press MIPhT: Moscow, Russia, 2004; p. 95. [Google Scholar]
- Tanner, J.E.; Stejskal, E.O. Restricted self-diffusion of protons in colloidal systems by the pulsed gradient spin-echo method. J. Chem. Phys. 1968, 49, 1768–1777. [Google Scholar] [CrossRef]
- Callaghan, P.T.; Godefroy, S.; Ryland, B.N. Use of the second dimension in PGSE NMR studies of porous media. Magn. Reson. Imaging 2003, 21, 243–248. [Google Scholar] [CrossRef]
- Callaghan, P.T. Translational Dynamics and Magnetic Resonance; Oxford University Press: Oxford, UK, 2011; p. 547. [Google Scholar]
- Callaghan, P.T. How two pairs of gradient pulses give access to new information about molecular dynamics. Diffus. Fundam. 2005, 2, 1–18. [Google Scholar]
- Rodin, V.V.; McDonald, P.J.; Zamani, S. A nuclear magnetic resonance pulsed field gradient study of self-diffusion of water in hydrated cement pastes. Diffus. Fundam. 2013, 18, 1–7. [Google Scholar]
- Rodin, V.V.; Knight, D.P. Natural materials by NMR data: Cross-relaxation in macromolecules of natural silk. Mater. Sci. 2003, 10, 16–21. [Google Scholar]
- Callaghan, P.T.; Furó, I. Diffusion–diffusion correlation and exchange as a signature for local order and dynamics. J. Chem. Phys. 2004, 120, 4032–4038. [Google Scholar] [CrossRef]
- Venkataramanan, L.; Song, Y.-Q.; Hurlimann, M.D. Solving Fredholm integrals of the first kind with tensor product structure in 2 and 2.5 dimensions. IEEE Trans. Signal Process 2002, 50, 1017–1026. [Google Scholar] [CrossRef]
- Song, Y.-Q.; Venkataramanan, L.; Hurlimann, M.; Flaum, M.; Frulla, P.; Straley, C. T1–T2 Correlation Spectra Obtained Using a Fast Two-Dimensional Laplace Inversion. J. Magn. Reson. 2002, 154, 261–268. [Google Scholar] [CrossRef]
- Abu-Shumays, I.; Marinelli, L. A smoothing solution (unfolding) of a two dimensional density function from its measured spectrum. J. Comput. Phys. 1971, 7, 219–238. [Google Scholar] [CrossRef]
- Galvosas, P.; Qiao, Y.; Schönhoff, M.; Callaghan, P.T. On the use of 2D correlation and exchange NMR spectroscopy in organic porous materials. Magn. Reson. Imaging 2007, 25, 497–500. [Google Scholar] [CrossRef]
- Rodin, V.V.; Nikerov, V.A. NMR relaxation and PFG NMR studies of water dynamics in oriented collagens fibers with different degree of cross-linking. Curr. Tissue Eng. 2014, 3, 47–61. [Google Scholar] [CrossRef]
- Traore, A. Etude par RMM et Diffusion des Neutrons de la Dynamique de L’eau Dans le Collagene Nativ et Dénaturé. Ph.D. Thesis, Universite Blaise Pascal, Clermont-Ferrand, France, 1997. [Google Scholar]
- Henkelman, R.M.; Stanisz, G.J.; Kim, J.K.; Bronskill, M.J. Anisotropy of NMR properties of tissues. Magn. Reson. Med. 1994, 32, 592–601. [Google Scholar] [CrossRef]
- Szafer, A.; Zhong, J.; Gore, J.C. Theoretical model for water diffusion in tissues. Magn. Reson. Med. 1995, 33, 697–712. [Google Scholar] [CrossRef]
- Wycoff, W.; Pickup, S.; Cuter, B.; Miller, W.; Wong, T.C. The determination of the cell size in wood by nuclear magnetic resonance diffusion techniques. Wood Fiber Sci. 2000, 32, 72–80. [Google Scholar]
- Tanner, J.E. Self diffusion of water in frog muscle. Biophys. J. 1979, 28, 107–116. [Google Scholar] [CrossRef] [Green Version]
- Jones, M. Mobile nuclear magnetic resonance characterisation of water distribution and movement in living trees and felled timber. Ph.D. Thesis, University of Surrey, Guildford, UK, 2013. [Google Scholar]
- Knauss, R.; Fleischer, G.; Gründer, W.; Kärger, J.; Werner, A. Pulsed field gradient NMR and nuclear magnetic relaxation studies of water mobility in hydrated collagen II. Magn. Reson. Med. 1996, 36, 241–248. [Google Scholar] [CrossRef]
- Callaghan, P.T. Principles of Nuclear Magnetic Resonance Microscopy; Clarendon Press: Oxford, UK, 2001. [Google Scholar]
- Traore, A.; Foucat, L.; Renou, J.P. 1H‐NMR study of water dynamics in hydrated collagen: Transverse relaxation‐time and diffusion analysis. Biopolymers 2000, 53, 476–483. [Google Scholar] [CrossRef]
Figure 1.
FID signals of protons in two wood samples: dry (blue line) and wet (black line) with moisture > FSP. T = 298K, and the frequency is 400 MHz. The fast relaxing component of the FID characterized wood protons and could be fitted by the Gaussian-sinc function [21,25]. The shape of FID was sensitive to water content in the wood pieces. FID-based method provided the possibility to quantitatively estimate the water–wood interactions on the base of proton populations of the components with different T2 relaxation times.
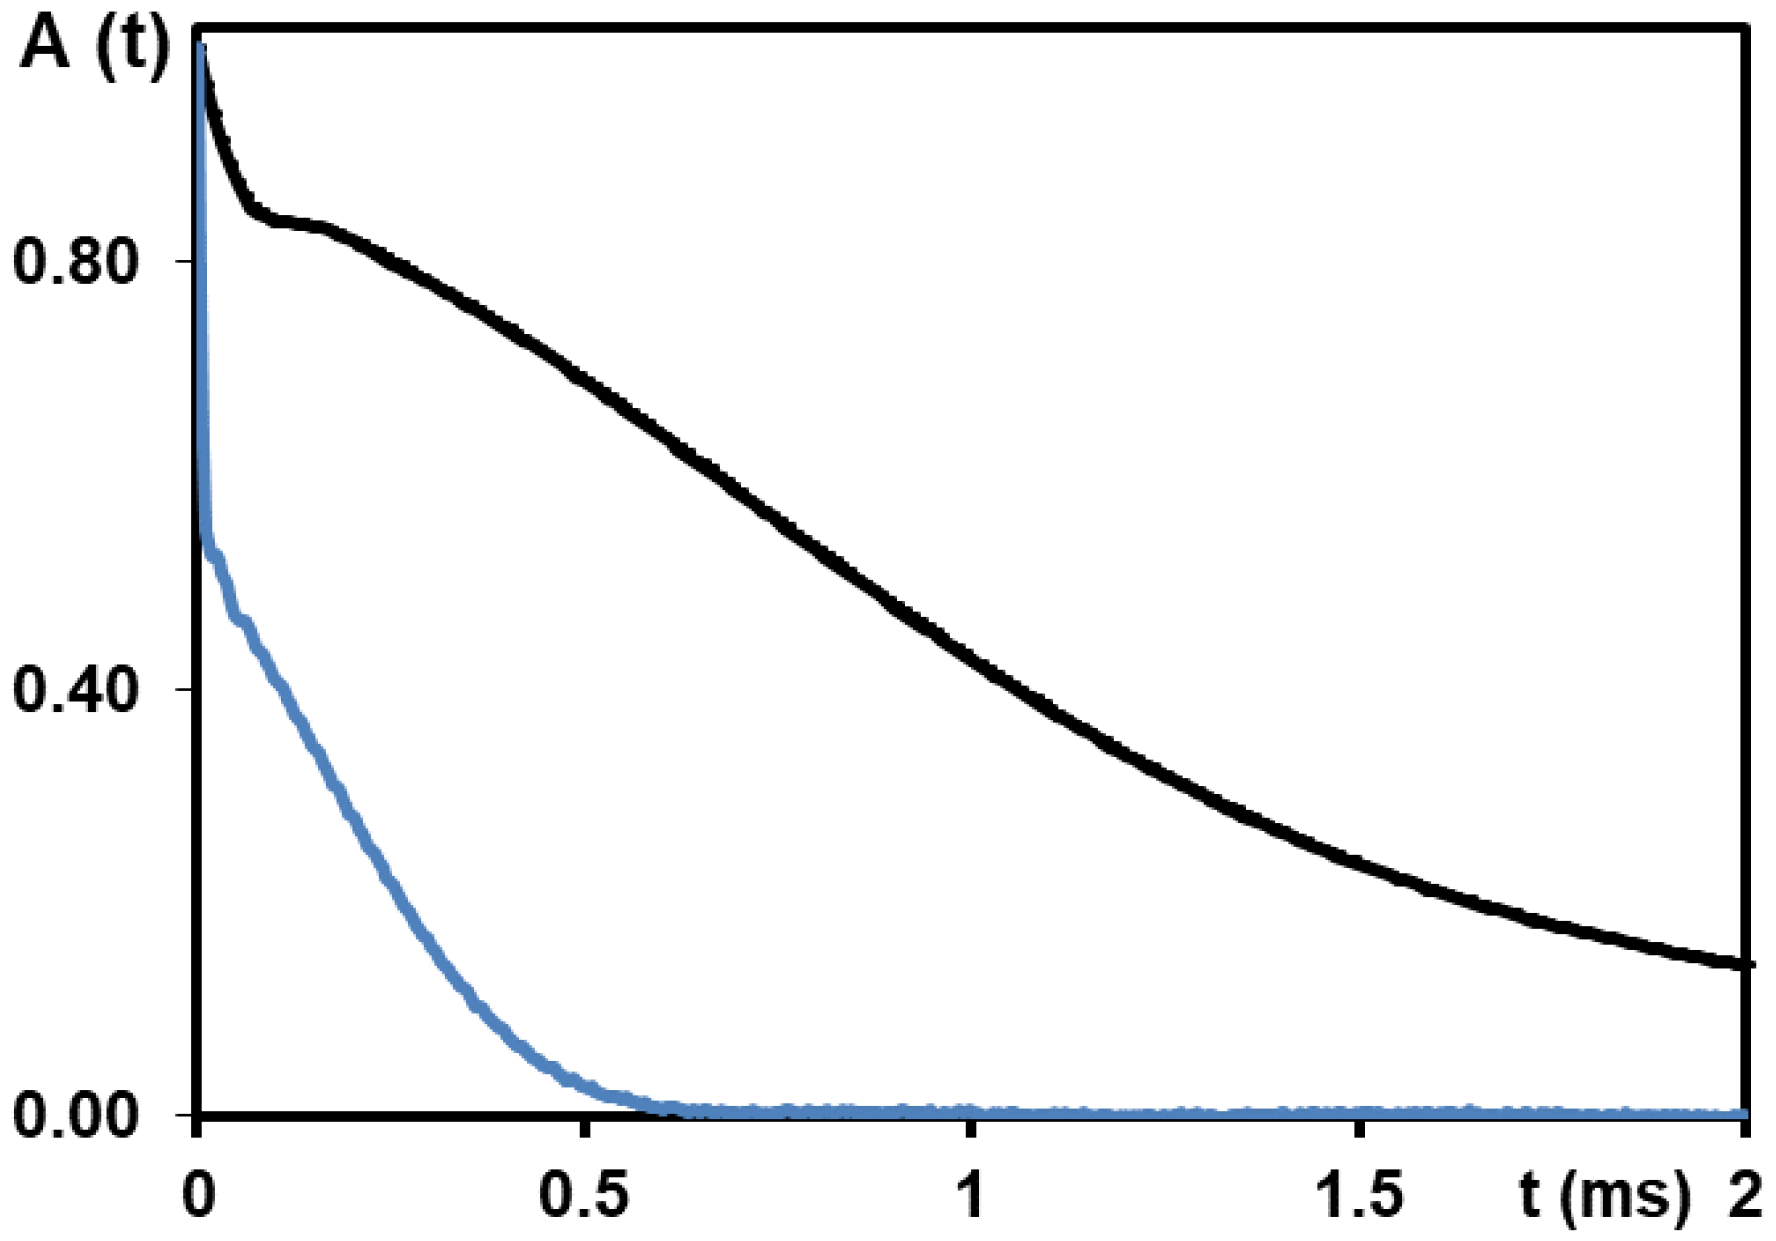
Figure 2.
The plots presenting the data from CPMG (T2) experiment on wood sample with moisture higher than FSP (T = 298K, proton resonance frequency is 400 MHz). Top: the experimental CPMG decay measured after moisturizing the piece of wood. The intensities in the top plot were normalized per 103. Bottom: T2 distribution obtained from CPMG echo train with the aid of inverse Laplace transformation.
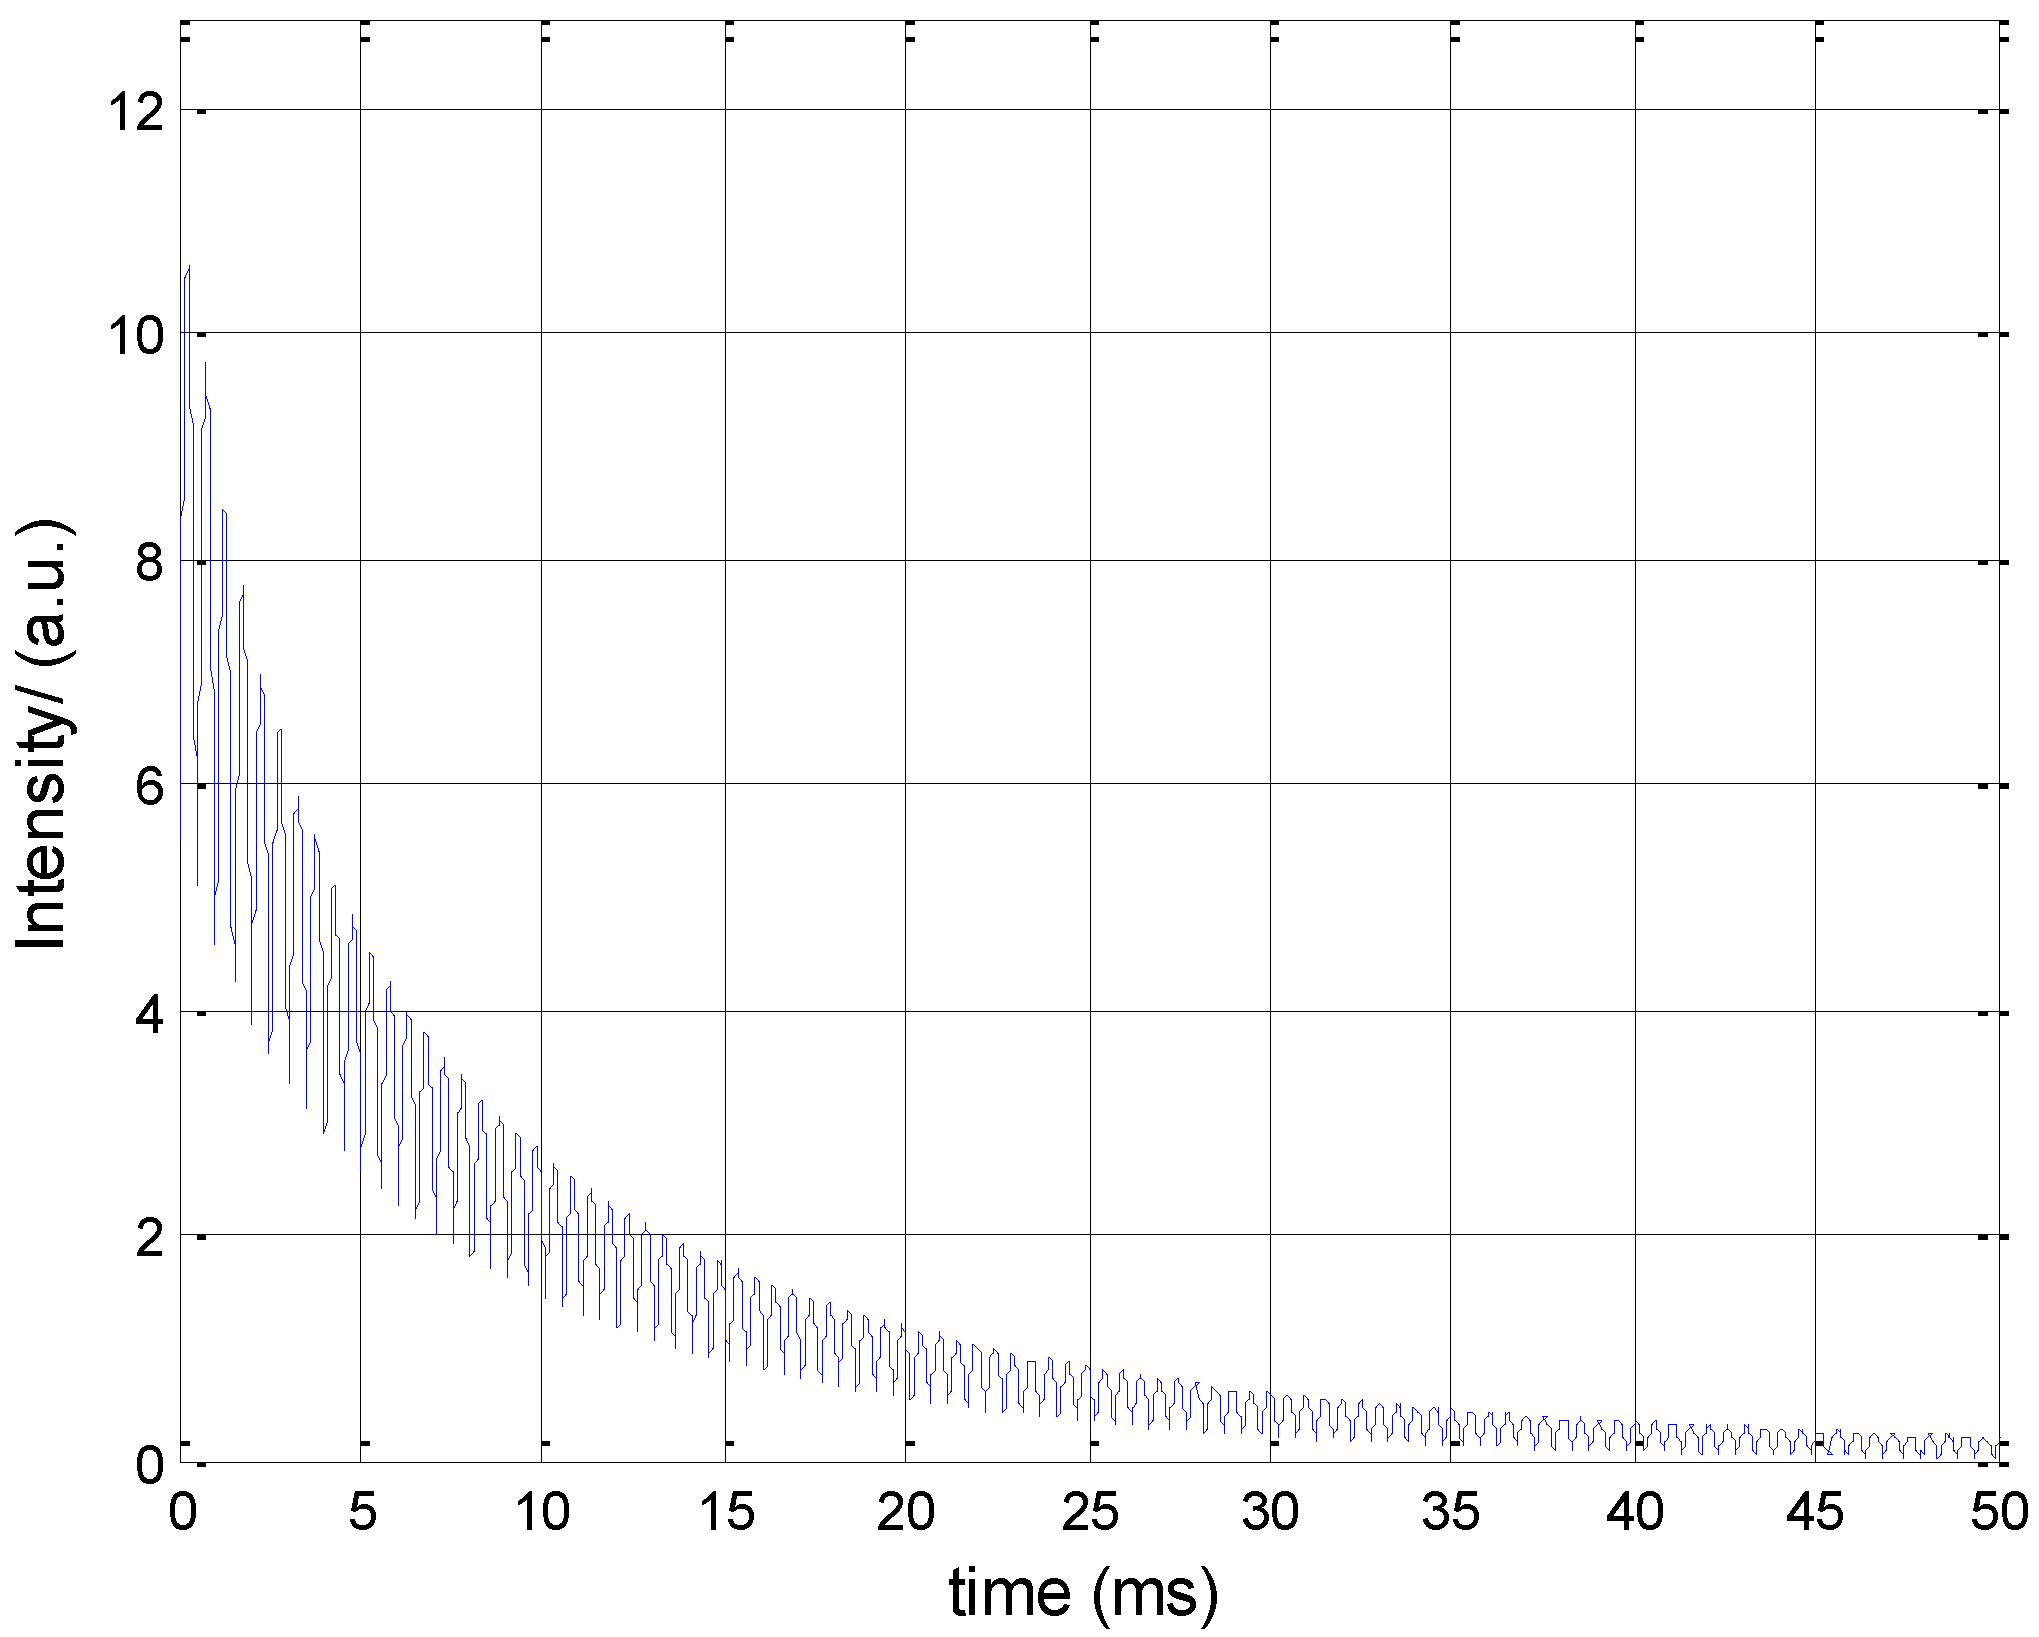
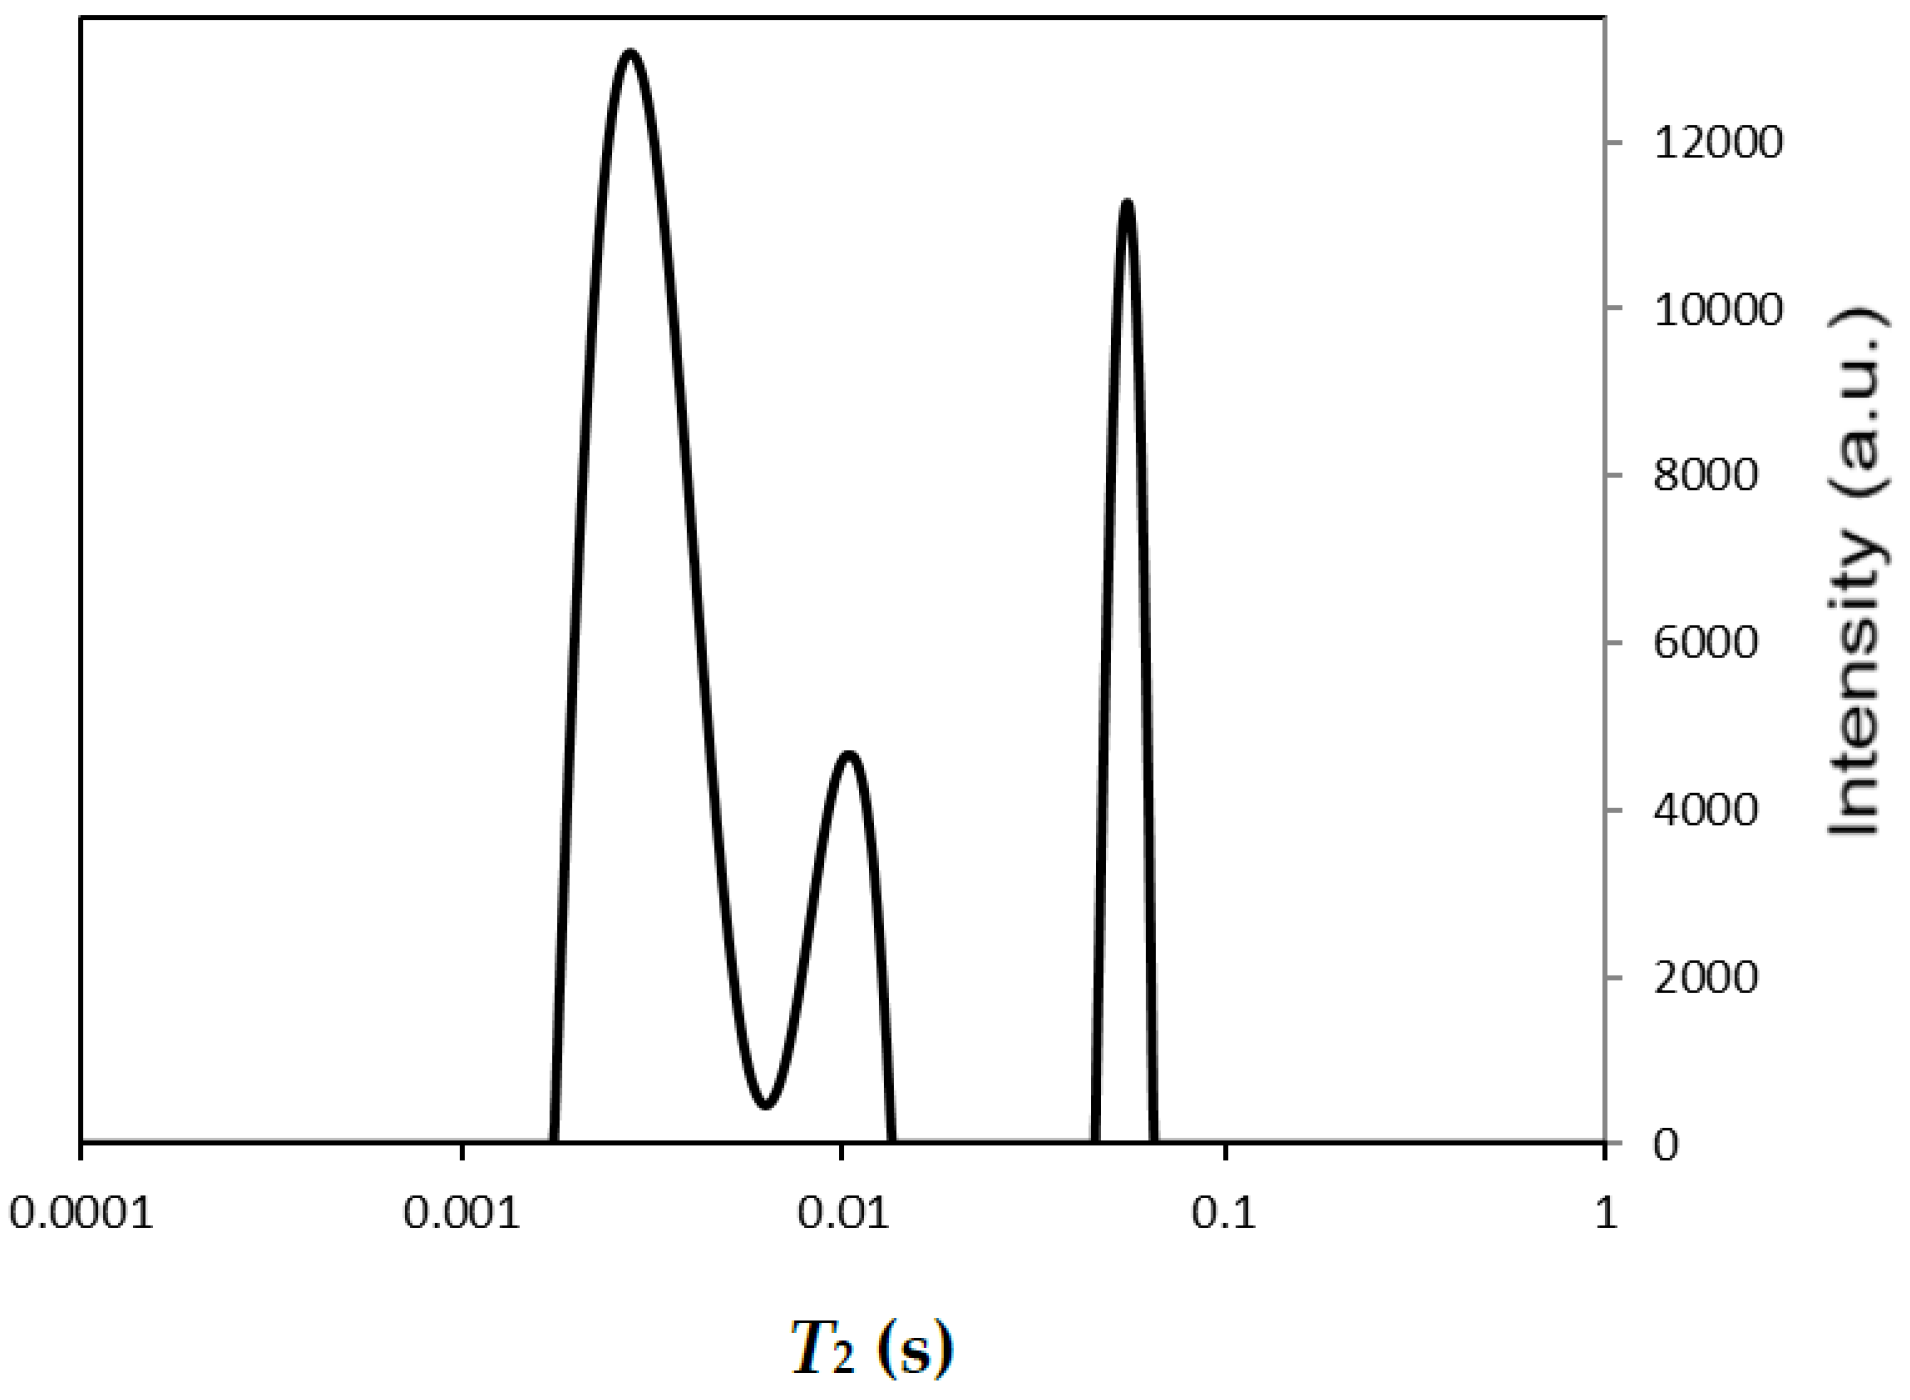
Figure 3.
Dependence of 1D imaging profile for 2 capillary tubes with doped (paramagnetic Mn2+) water on the position of the sample in the bore of magnet. The direction of X-(Y-) gradient was fixed. The data for 6 positions of the sample after the rotation around B0 are presented. When X-(Y-) gradient was orthogonal to the flat of the capillaries, maximal distance between two peaks of equal intensity has been observed in imaging profile. When the direction of the gradient was in the flat of two capillaries, the only one peak has been registered. 400 MHz. T = 298 K. The intensity (Y-axis) scale is in arbitrary units. X-axis scale is in points.
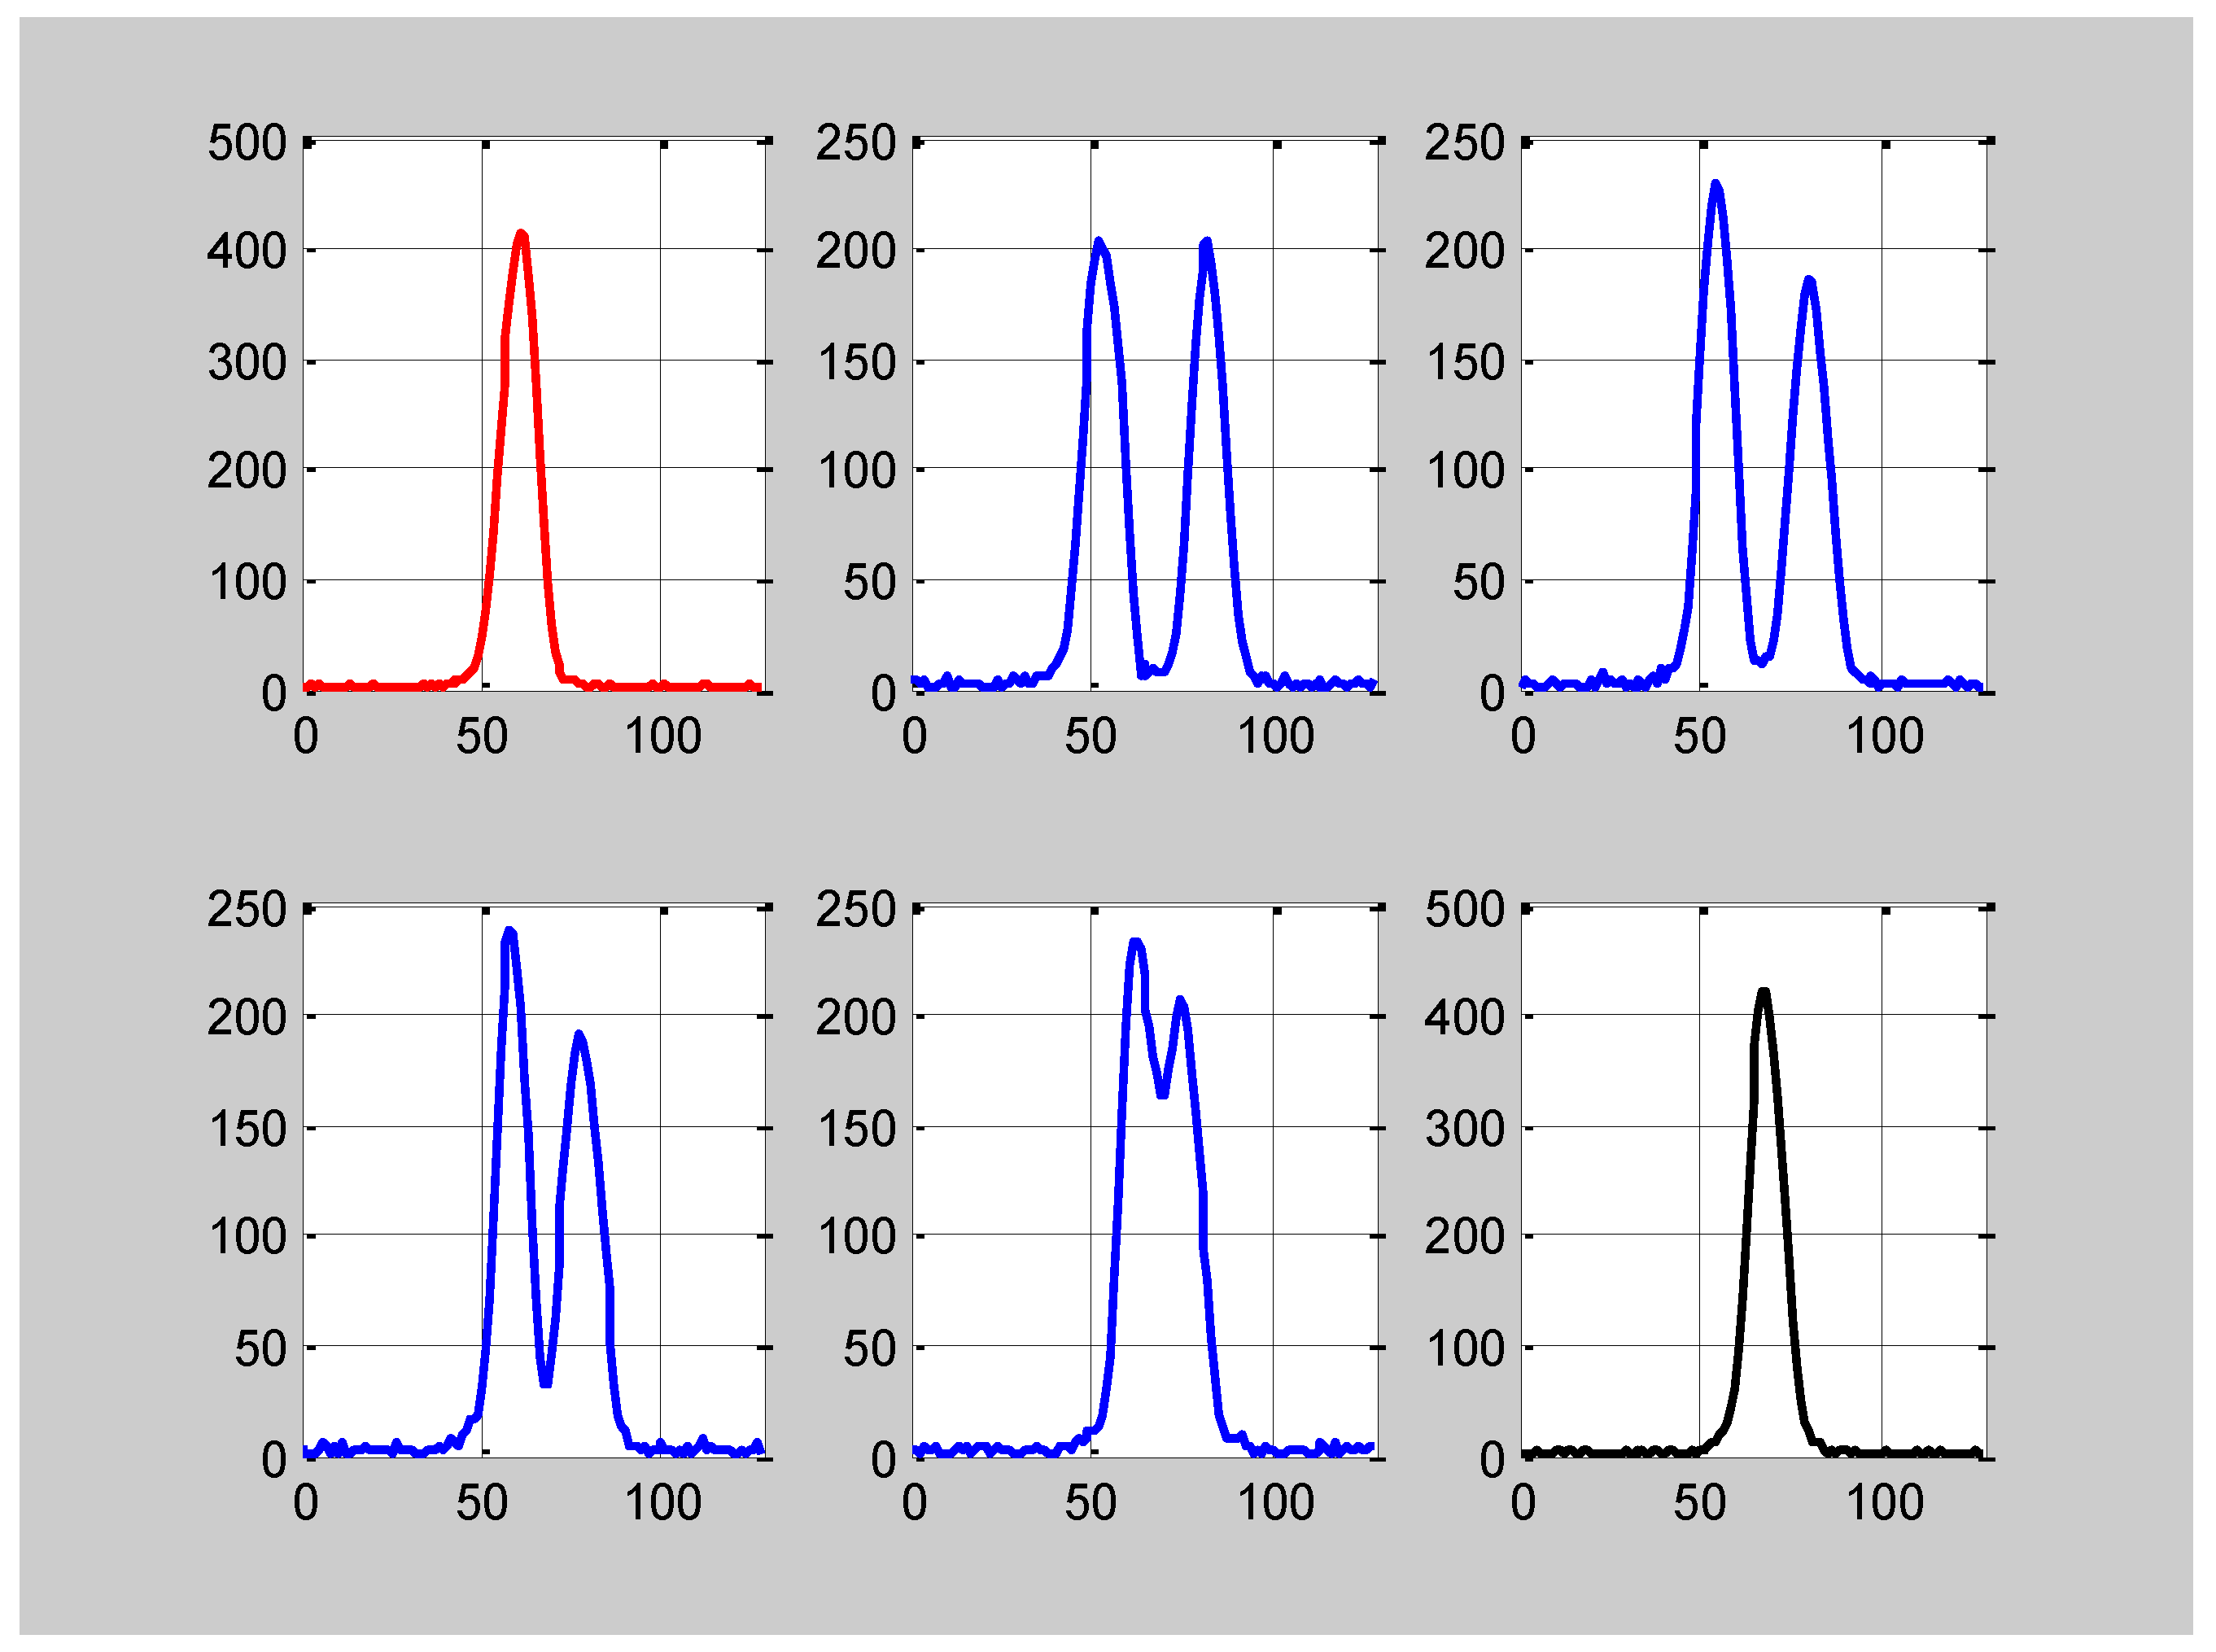
Figure 4.
top: The intensity of water protons as a function of spacing t between the 2nd and 3rd 90° pulses in GS sequence 90°x–τ0–90°−x–t–90°x for the spruce sample with water content of 0.03 g H2O per g dry matter at τ0 = 65 μs. Solid line is fitting the data to Equations (3)–(7) characterizing CR effect [7,19,20]. T = 298 K, frequency = 400 MHz. bottom: Determination of C and kw using the function (R+ − R−)(c+ − c−) in GS experiment.
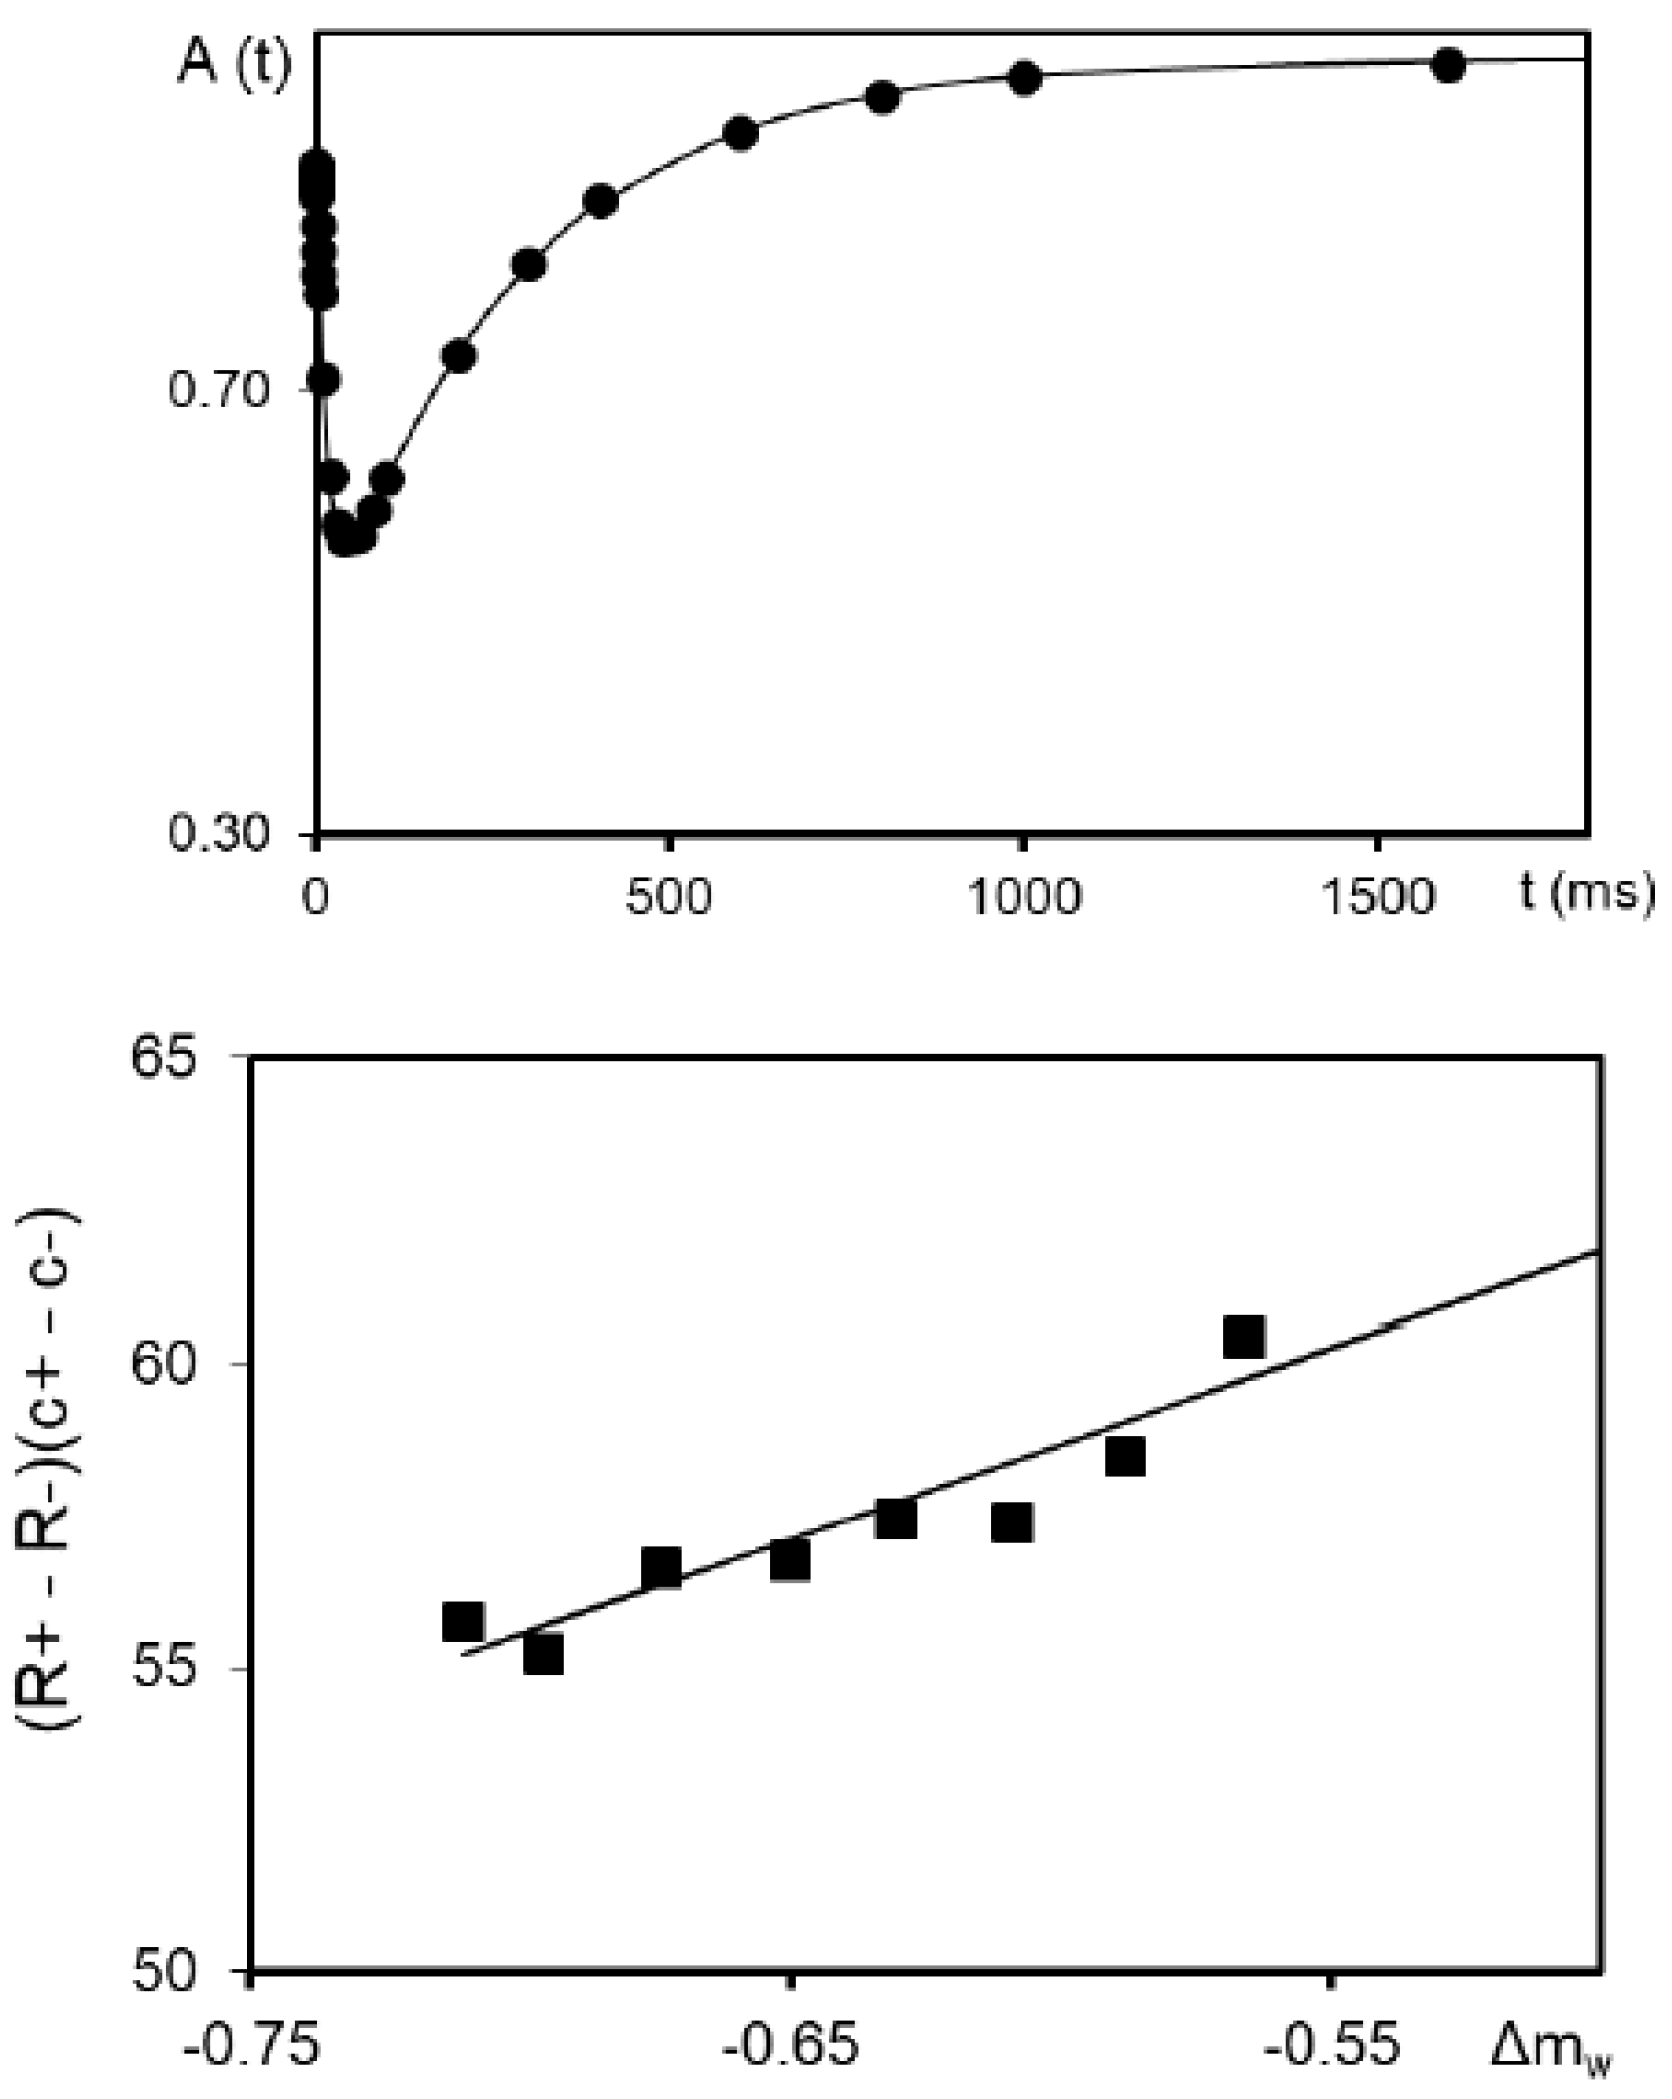
Figure 5.
Dependence of echo signals on gradient value in 1D NMR diffusion experiment on spruce piece with water content of 0.8 g H2O/g dry matter. MATLAB code was developed (Matrix 7 × 5) to get echo-attenuation value (magnitude with following calculation of integral area) for each gradient step. Wood sample was oriented along X-direction testing for diffusion in tangential direction. The diffusion time Δ = 200 ms. Frequency is 400 MHz, T = 298 K. For left Figure: The intensity (Y-axis) scale is in arbitrary units. X-axis scale is in points.
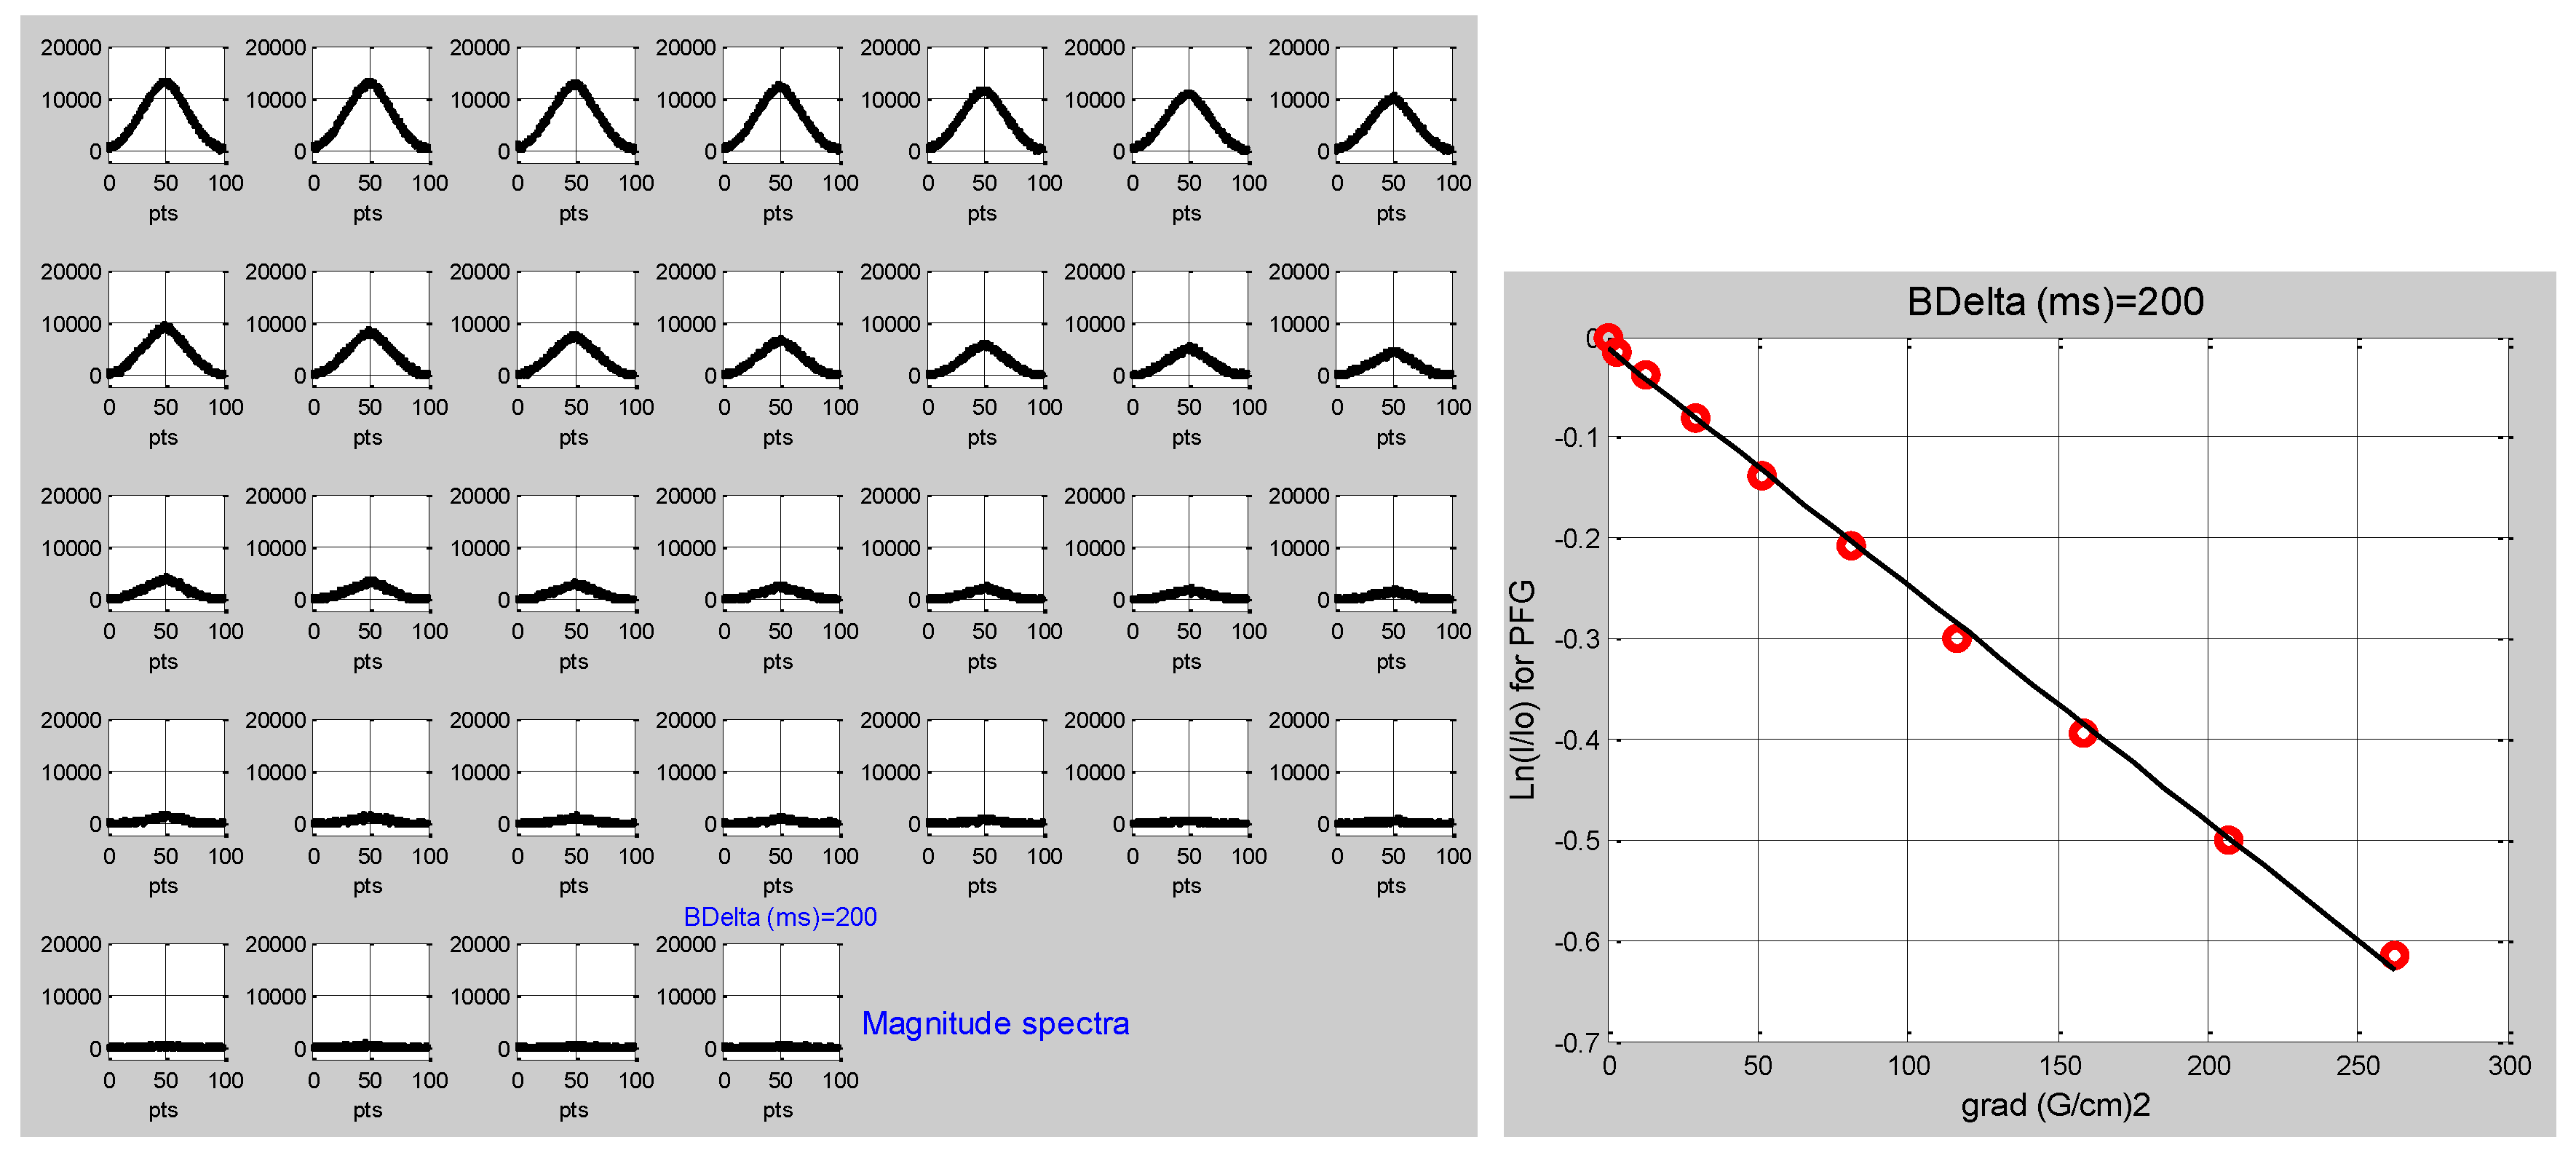
Figure 6.
A dependence of the apparent diffusion coefficient in spruce wood on effective diffusion time Δ at orientation of the gradient in the tangential direction. Frequency is 400 MHz. Water content in the spruce wood is 0.62 g H2O/g dry mass. T = 298 K. Δ is presented in logarithmic scale.
Figure 6.
A dependence of the apparent diffusion coefficient in spruce wood on effective diffusion time Δ at orientation of the gradient in the tangential direction. Frequency is 400 MHz. Water content in the spruce wood is 0.62 g H2O/g dry mass. T = 298 K. Δ is presented in logarithmic scale.
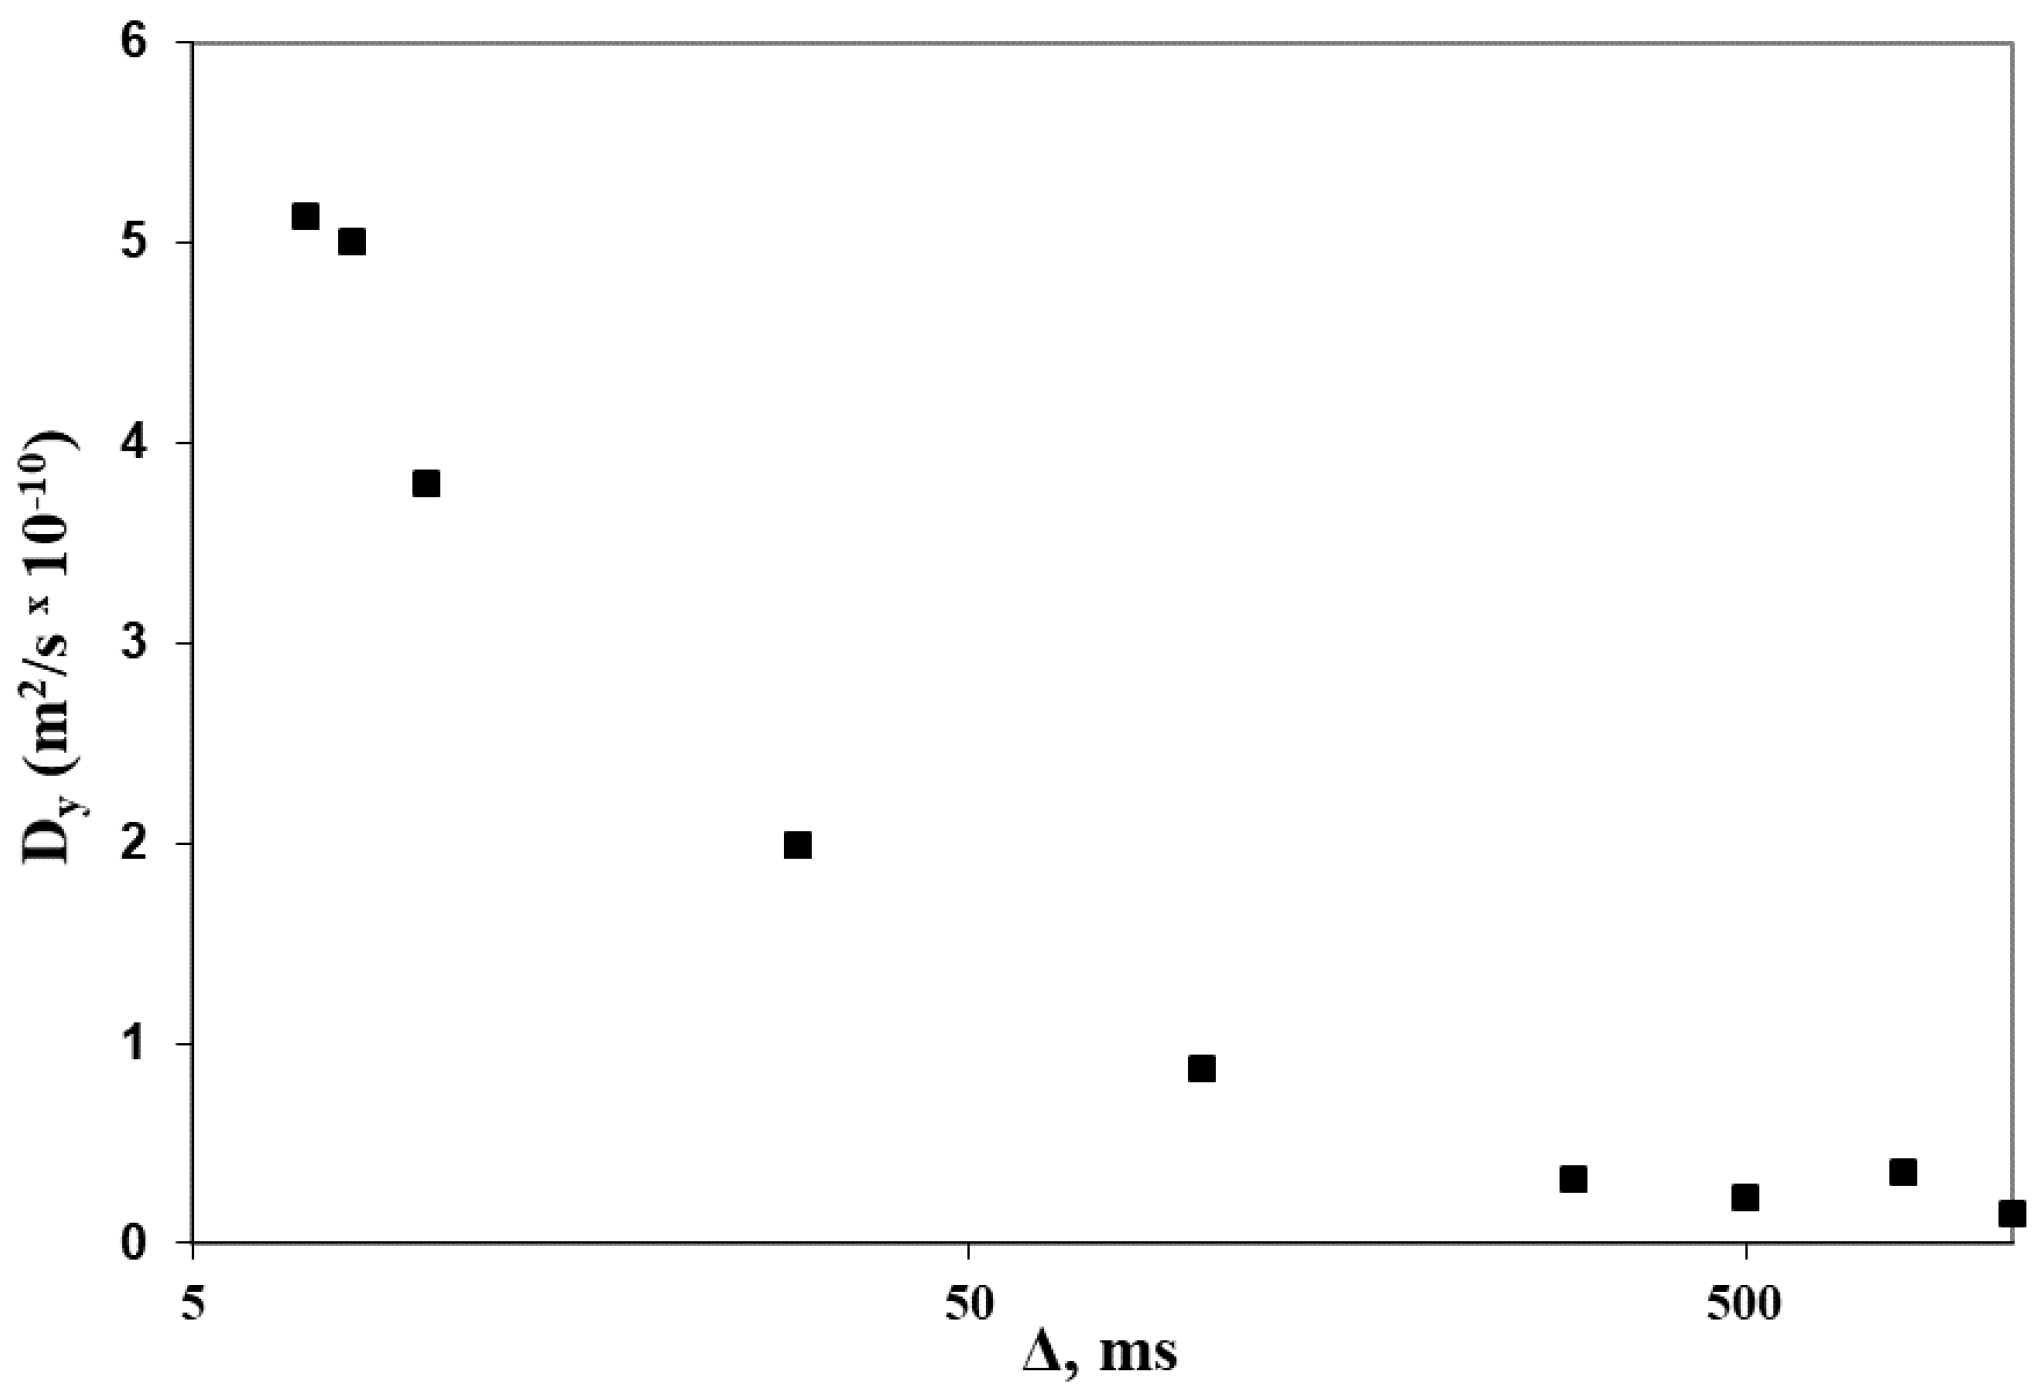
Figure 7.
2D diffusion-diffusion correlation maps obtained in simulated two-dimensional experiment (top, left) and 2D DDCOSY NMR experiments on three spruce samples (with variable moisture: 0.60 (top, right); 0.58 (bottom, left); 0.57 g H2O/g dry mass (bottom, right)) with the collinear pairs of the magnetic field gradient pulses. Simulation (top, left) has been done at D1 = 2 × 10⁻¹⁰ m2/s, D2 = 10−9 m2/s. Diffusion anisotropy is characterized by two stretched spots on the diagonal whereas in the case of isotropic diffusion one spot on the diagonal is observed.
© 2019 by the author. Licensee MDPI, Basel, Switzerland. This article is an open access article distributed under the terms and conditions of the Creative Commons Attribution (CC BY) license (http://creativecommons.org/licenses/by/4.0/).
Share and Cite
MDPI and ACS Style
Rodin, V.V. One- and Two-Dimensional NMR in Studying Wood–Water Interaction at Moisturizing Spruce. Anisotropy of Water Self-Diffusion. Colloids Interfaces 2019, 3, 54. https://doi.org/10.3390/colloids3030054
AMA Style
Rodin VV. One- and Two-Dimensional NMR in Studying Wood–Water Interaction at Moisturizing Spruce. Anisotropy of Water Self-Diffusion. Colloids and Interfaces. 2019; 3(3):54. https://doi.org/10.3390/colloids3030054
Chicago/Turabian StyleRodin, Victor V. 2019. "One- and Two-Dimensional NMR in Studying Wood–Water Interaction at Moisturizing Spruce. Anisotropy of Water Self-Diffusion" Colloids and Interfaces 3, no. 3: 54. https://doi.org/10.3390/colloids3030054