Article

Adsorption of Hyperbranched Arabinogalactan-Proteins from Plant Exudate at the Solid–Liquid Interface

by
Athénaïs Davantès
1,
Michaël Nigen
2,
Christian Sanchez
2,
Angelina d’Orlando
3 and
Denis Renard
1,*
1
UR1268 Biopolymères Interactions Assemblages, INRA, F-44300 Nantes, France
2
UMR IATE, UM-INRA-CIRAD-Montpellier Supagro, 2 Place Viala, F-34060 Montpellier CEDEX, France
3
BIBS, INRA, F-44300 Nantes, France
*
Author to whom correspondence should be addressed.
Colloids Interfaces 2019, 3(2), 49; https://doi.org/10.3390/colloids3020049
Submission received: 24 April 2019 / Revised: 14 May 2019 / Accepted: 15 May 2019 / Published: 17 May 2019

Abstract

:
Adsorption of hyperbranched arabinogalactan-proteins (AGPs) from two plant exudates, A. senegal and A. seyal, was thoroughly studied at the solid–liquid interface using quartz crystal microbalance with dissipation monitoring (QCM-D), surface plasmon resonance (SPR), and atomic force microscopy (AFM). Isotherms of the adsorption reveal that 3.3 fold more AGPs from A. seyal (500 ppm) are needed to cover the gold surface compared to A. senegal (150 ppm). The pH and salt concentration of the environment greatly affected the adsorption behavior of both gums, with the surface density ranging from 0.92 to 3.83 mg m−2 using SPR (i.e., “dry” mass) and from 1.16 to 19.07 mg m−2 using QCM-D (wet mass). Surprisingly, the mass adsorbed was the highest in conditions of strong electrostatic repulsions between the gold substrate and AGPs, i.e., pH 7.0, highlighting the contribution of other interactions involved in the adsorption process. Structural changes of AGPs induced by pH would result in swelling of the polysaccharide blocks and conformational changes of the polypeptide backbone, therefore increasing the protein accessibility and hydrophobic interactions and/or hydrogen bonds with the gold substrate.

Graphical Abstract

1. Introduction

Acacia gum (AG, E414), also called gum arabic, is a plant exudate used since the Stone Age in various applications, such as food, and the cosmetics and pharmaceutical industries, because of its stabilization, emulsification, encapsulation, and adhesion properties [1,2,3]. Acacia gums exudates are produced from the trunk and branches of two classical trees, Acacia senegal and Acacia seyal, and contain complex biopolymers made of highly glycosylated hydroxyproline-rich proteins with a high proportion of heavily branched neutral and charged sugars in the polysaccharide blocks. The structure, chemical compositions, and physico-chemical properties of Acacia gums have been recently reviewed [1]. These hyperbranched arabinogalactan-proteins (AGPs) display high added-value functionalities, particularly their ability to adsorb at solid–liquid (adhesion, adsorption) and liquid–liquid interfaces (emulsion stabilization). Acacia senegal gum is a highly heterogeneous material that can be separated into three main molecular fractions by hydrophobic interaction chromatography (HIC) [4,5,6]. Most of the gum (88.3% of total), an arabinogalactan-peptide (HIC-F1), has a very low protein content (0.49%) and a molecular mass of 3.5 × 10⁵ g mol−1. The second fraction (10.4% of total), an arabinogalactan-protein complex (HIC-F2), contains 6.3% protein and has a molecular mass of 15 × 105 g mol−1. The third fraction (1.3% of total gum), referred to as glycoproteins (HIC-F3), contains 14.4% protein and has a molecular mass of 16 × 105 g mol−1 [7]. These values may vary depending on the gum origin, age, storage conditions, etc. [8].
The surface properties of AG, and of a number of plant gum exudates, are unique in the polysaccharide world. By surface properties, we mean both the ability of AG to decrease the interfacial tension between gas–water, liquid–liquid, or solid–liquid interfaces, and to stabilize these interfaces through steric and electrostatic interactions and hydration forces [9]. These properties can be used to form and stabilize foams [10], emulsions, and solid nanoparticles. Studies on the foaming properties of AG are rare as compared to studies on the stabilization of liquid or solid particles, especially nanoparticles [11,12,13,14,15,16,17,18,19,20,21,22,23,24]. Obviously, the ability of AG to stabilize solid interfaces is the basis of ink and paint manufacturing [25,26,27]. AG was also used to stabilize latex nanoparticles as a model interface system with a surface coverage of about 0.5 to 5 mg/m2 depending on the solvent conditions and initial AG concentration [28,29]. The surface coverage was found to be similar at liquid–liquid interfaces in oil-in-water O/W emulsions [4]. The HIC-F2 fraction was found to be the most effective to be adsorbed while the HIC-F1 fraction was ineffective in the stabilization of the latex dispersions [29]. Currently, it is widely accepted that it is the arabinogalactan-protein complex, HIC-F2 and HIC-F3, which mainly provides the surface properties of gum. This statement comes from numerous studies on liquid–liquid interfaces, i.e., oil-in-water emulsions stabilized by acacia gums [30,31,32,33]. However, even if the applications of these AGPs are widely spread, little is known about the molecular mechanism underlying the adsorption properties of these hyperbranched AGPs. Indeed, to the best of our knowledge, there are no studies on the adsorption of AGP on 2D solid surfaces and their related interfacial properties to highlight the adsorption properties of gums and their molecular fractions.
The present study focuses on the adsorption of Acacia gums (A. senegal and A. seyal) at the solid–liquid interfaces of gold surfaces, as characterized with a quartz crystal microbalance with dissipation monitoring (QCM-D) and surface plasmon resonance (SPR). These powerful methods allow highly sensitive, quantitative, real-time, in situ, and non-invasive detection of molecule adsorption on a solid surface. QCM-D probes the variation of the shear rate of an oscillating piezoelectric sensor, caused by changes in the total mass of the adsorbed molecules, while SPR allows the determination of the mass of the adsorbed species from the change of refractivity of the gold film. Combining these two techniques can provide information on the sorption mechanisms, structural changes, and obtained state of hydration of the adsorbed film. These techniques have been widely used to investigate the adsorption properties of biopolymers, proteins, and polysaccharides on various type of surfaces with or without grafting [34,35,36,37,38,39,40,41,42,43,44,45,46]. A comparison of the two gums should allow their respective contribution to the surface interactions leading to adsorption to be deciphered. The effect of the pH and salt concentration on the adsorption behavior, the maximum coverage, and the thickness of the layer were investigated, and the fraction of water in the gum films was estimated. AFM was used to probe the morphology of the adsorbed AG layer both in wet, dry, and rehydrated states. These experimental investigations should lead to a better understanding of the adsorption behavior of the Acacia gum on solid surfaces.

2. Materials and Methods

2.1. Materials

The experiments were carried out using commercially available Acacia senegal (A. senegal, lot OF152413) and Acacia seyal (A. seyal, lot OF110724) soluble powders, provided by the Alland and Robert Company–Natural and Organic gums (Port Mort, France). The biochemical and structural properties of both gums are presented in a previous work [6]. All stock solutions and dispersions were prepared a day before each experiment at room temperature and filtered with a 0.2 µm membrane (GHP, Life Science, Merck, France) using fresh purified water (Milli-Q, Millipore, Staffordshire, UK) with a resistivity of 18.2 MΩ cm. Dilution of stock Acacia gum dispersions (C = 10 g/L) to the desired concentrations was performed in acetate buffer. The salt concentration was fixed with acetate buffer (VWR Chemicals, Fontenay-sous-Bois, France) at 1, 10, or 100 mM and pH values of 3.0, 5.0, or 7.0 were set with HCl or NaOH solutions (Merck, analytical grade, Molsheim, France). The concentrations of the Acacia gum in the stock dispersions were quantified by the dry matters method. A summary of the biochemical composition and structural parameters of the two Acacia gums, A. senegal and A. seyal, used in this study is provided in the supporting information, Table S1 [47].

2.2. Methods

2.2.1. Surface Preparation

Gold-coated quartz crystals and silicon wafers were cleaned in piranha solution of H2SO4/H2O2 (7:3, v/v) for 3 min, rinsed exhaustively with Milli-Q water, and dried under a stream of nitrogen. Because the Acacia gum films were difficult to remove even with the piranha treatment, the quartz crystals were additionally gently rubbed with a soft paper (KIMTECH, Nanterre, France) until the surface was visually cleaned before any reuse. Prior to use, all surfaces were treated with a plasma cleaning device (Harrick Plasma, Ithaca, NY, USA). The gum films on the silicon wafers for AFM observations were prepared by dipping for 2 h in a gum solution and rinsed with Milli-Q water before being analyzed in solution. Surfaces were then dried with a nitrogen stream for dehydration state studies and dipped again in water for eventual rehydration state observations.

2.2.2. Quartz Crystal Microbalance with Dissipation Monitoring (QCM-D)

QCM-D was used to probe the adsorbed mass, layer thickness, and viscoelastic properties of the the hydrated adsorbed film in different experimental conditions (pH and salt concentration). QCM-D experiments were carried out using a Q-Sense E4 instrument (Gothenburg, Sweden) using a piezoelectric AT-cut quartz crystal coated with gold electrodes on each side with a nominal resonance frequency of 5 MHz (QSX301, Q-Sense), and a peristaltic pump to maintain the flow of the liquid through the measurement chamber. The QCM-D principles are described in detail elsewhere [48,49]. The signal was recorded by the simultaneous measurement of changes of the resonance frequency (ΔF), which is related to the adsorbed mass, and dissipation of the oscillation energy of the piezoelectric quartz resonator (ΔD), which is directly connected to the viscoelastic properties of the adsorbed layer.
For adsorbed films with small changes in ΔD (i.e., < 1 × 10⁻⁶) and homogenous overtones, the adsorbed mass, Γ Q C M D (ng/cm²), is proportional to the change of frequency, ΔF, as described by Sauerbrey’s equation [50]:
Γ Q C M D = C Δ F n n ,
where C is the constant for the mass sensitivity of the quartz crystal (17.7 ng cm−2 Hz−1 at 5 MHz), and n is the overtone number equal to 1, 3, 5, and 7. The film thickness, d Q C M D (nm), was then calculated with the following equation:
d Q C M D = Γ Q C M D ρ ,
where ρ is the film density. The film density, ρ , is ill-defined in the literature and two opposite views are presented: One view for which the film density is equal to 1 g cm−3 when the adsorbed film is highly hydrated [51] and the other view for which film density values vary depending on the nature of the adsorbate and range typically from 1.009 to 1.77 g cm−3 [37,42]. In the present study, it was considered, in accordance with the refractive index value of a dry film corresponding to 100% of the adsorbed species (see Section 2.2.3), that the film density is assumed to be the inverse of the partial specific volume, ϑ , with ϑ = 0.5870 and 0.5767 cm3 g−1 for A. senegal and A. seyal, respectively [7]. The Sauerbrey equation is only valid for the adsorbed film considered as homogeneous and rigid on the surface. However, when there is a large change in the dissipation energy loss (ΔD > 1 × 10⁻⁶) and a high inhomogeneity between overtones, another theoretical model has to be applied to accurately determine the adsorbed mass values of the flexible film. In that case, Voigt viscoelastic modeling is generally applied [52,53,54], in which the adsorbed film is represented by a complex shear modulus, G , defined as:
G = G + i G = µ f + i 2 π f η f
where µ f is the film shear elastic modulus, f is the oscillation frequency, η f is the film shear viscosity, G is the apparent film storage modulus, and G is the apparent film loss modulus. The adsorbed film was assumed to have a uniform thickness and a uniform density. The data were fitted to obtain the film thickness, shear elastic modulus, and shear viscosity assuming a film density, ρ = 1 ϑ , of 1.703 and 1.734 g cm−3 for A. senegal and A. seyal, respectively, with at least four overtones with a good signal-to-noise s/n ratio (generally 3, 5, 7, and 9), using the Q-Sense Dfind software (version 1.2.1, Biolin Scientific, Q-Sense, Sweden). The adsorbed mass was calculated as follows:
Γ Q C M D = d Q C M D . ρ
The baseline corresponds to the values recorded in acetate buffer after at least one hour of stabilization. The temperature of the measuring chamber was stabilized at 25 °C, with a flow rate of 200 µL min−1. The gum solution was left in contact with the substrate until stabilization was reached during the adsorption process, and desorption was investigated by rinsing the system with pure buffer solution. All experiments were conducted at least three times with the adsorbed mass values corresponding to the mean ± standard deviation. For data representation, the third overtone was used, with the highest intensity and a good signal-to-noise ratio.

2.2.3. Surface Plasmon Resonance (SPR)

The SPR measurements were conducted on a Biacore × 100 instrument (Uppsala, Sweden) with gold sensor chip from GE Healthcare (SIA kit Au, Fontenay-sous-Bois, France). Briefly, the surface plasmon resonance technique (SPR) is based on the detection of changes of the refractive index (RI) sensed by the evanescent wave at the metal–liquid interface. When molecules are adsorbed on the gold chip surface, they produce a change in the refractive index at the interface, causing a change in the SPR angle, Δ a n g l e , which is related to the thickness and mass concentration of the adsorbed layer [53,55,56]. The thickness, d S P R   , of the adsorbed dry layers was calculated using the relationship:
d S P R = l d 2 Δ a n g l e m n a n s ,
where l d is a characteristic decay length of the evanescent electromagnetic field estimated at 0.37 of the light wavelength ( λ d = 281.2 nm), m is a sensitivity factor for the sensor obtained after calibration of the SPR (101.93°/RI), n s is the refractive index of the bulk solution ( n s = 1.33371 ), n a is the refractive index of the adsorbed species in condensed form, and Δ a n g l e is the change in the SPR angle. From the glycerol calibration curve, 1000 RU = 0.1°, with RU corresponding to the response unit (arbitrary angle unit) of the system of detection. In this work, we assumed the refractive index, n a , for gums to be 1.481, obtained from both calibration curves on a refractometer operating at λ = 589   nm (RFM 300 refractometer, Belingham and Stanley Limited, Farnborough, Hants, UK), and considering that a “dry” film is made of 100% of the adsorbed species on the surface (supporting information, Figure S1). It should be noted that the refractive indices varied by less than 2% with the salt concentration in the range 1–100 mM. The dry mass adsorbed, Γ S P R   (ng/cm²), on the gold surface was then calculated according to Equation (6):
Γ S P R = d S P R . ρ ,
where ρ is the film density. The baseline was obtained after 2 h of stabilization with the buffer solution. The temperature was set at 25 °C with a flow rate of 5 µL/min. The gum solution was left in contact with the substrate until stabilization was reached during adsorption. Then, the system was rinsed with the pure buffer solution to measure the desorption process.

2.2.4. Hydration State of the Adsorbed Film

Generally, the adsorbed amount detected by QCM-D is higher than that detected from SPR. Indeed, SPR is sensitive to the “dry” mass adsorbed related to refractive index changes, while QCM-D is proportional to the hydrated mass adsorbed on the surface, which consists of the adsorbed molecules and their associated “bound” water molecules involved in hydration shells as well as the “trapped” water inside the layer structure [36,40,41].
By comparing the SPR and QCM-D techniques, the hydration state, Γ H 2 O % ,   of the adsorbed gum film can be estimated according to the following equation:
Γ H 2 O % = Γ Q C M D     Γ S P R Γ Q C M D   ×   100 .

2.2.5. Electrophoretic Mobility

The electrophoretic mobility (μe) of acacia gum dispersions was determined at 25 °C using a Zetasizer Nano ZS90 (Malvern, Orsay, France). Data were calculated using the Smoluchowski equation with the Zetasizer software (version 7.11, Malvern). All dispersions were prepared at 1 g/L in acetate buffer at different pH values and salt concentrations, and experiments were at least triplicated.

2.2.6. Atomic Force Microscopy (AFM)

Height, error-signal, and phase images of gum adsorbed layers on silicon wafers were registered in air and liquid by AFM using both INNOVA and BioScope Catalyst AFM from Bruker (Palaiseau, France). Images were recorded with low scan rates (0.1 to 0.3 Hz), employing conventional nitride coated silicon tips in the tapping mode and scanasyst tips from Bruker for scanasyst modes, whose spring constants are, respectively, 2.8 N m−1 and 0.7 N m−1. Samples were scanned following three steps: The hydrated surface directly after 2 h of sorption, dry surface (N2), hydrated surface after drying, and rehydration. In each case, several surface areas were examined from 1 µm × 1 µm to 40 µm × 40 µm. Height distribution histograms were systematically measured by removing as much noisy background as possible, and adsorption boundaries were observed for surfaces analyzed directly after sorption.

3. Results

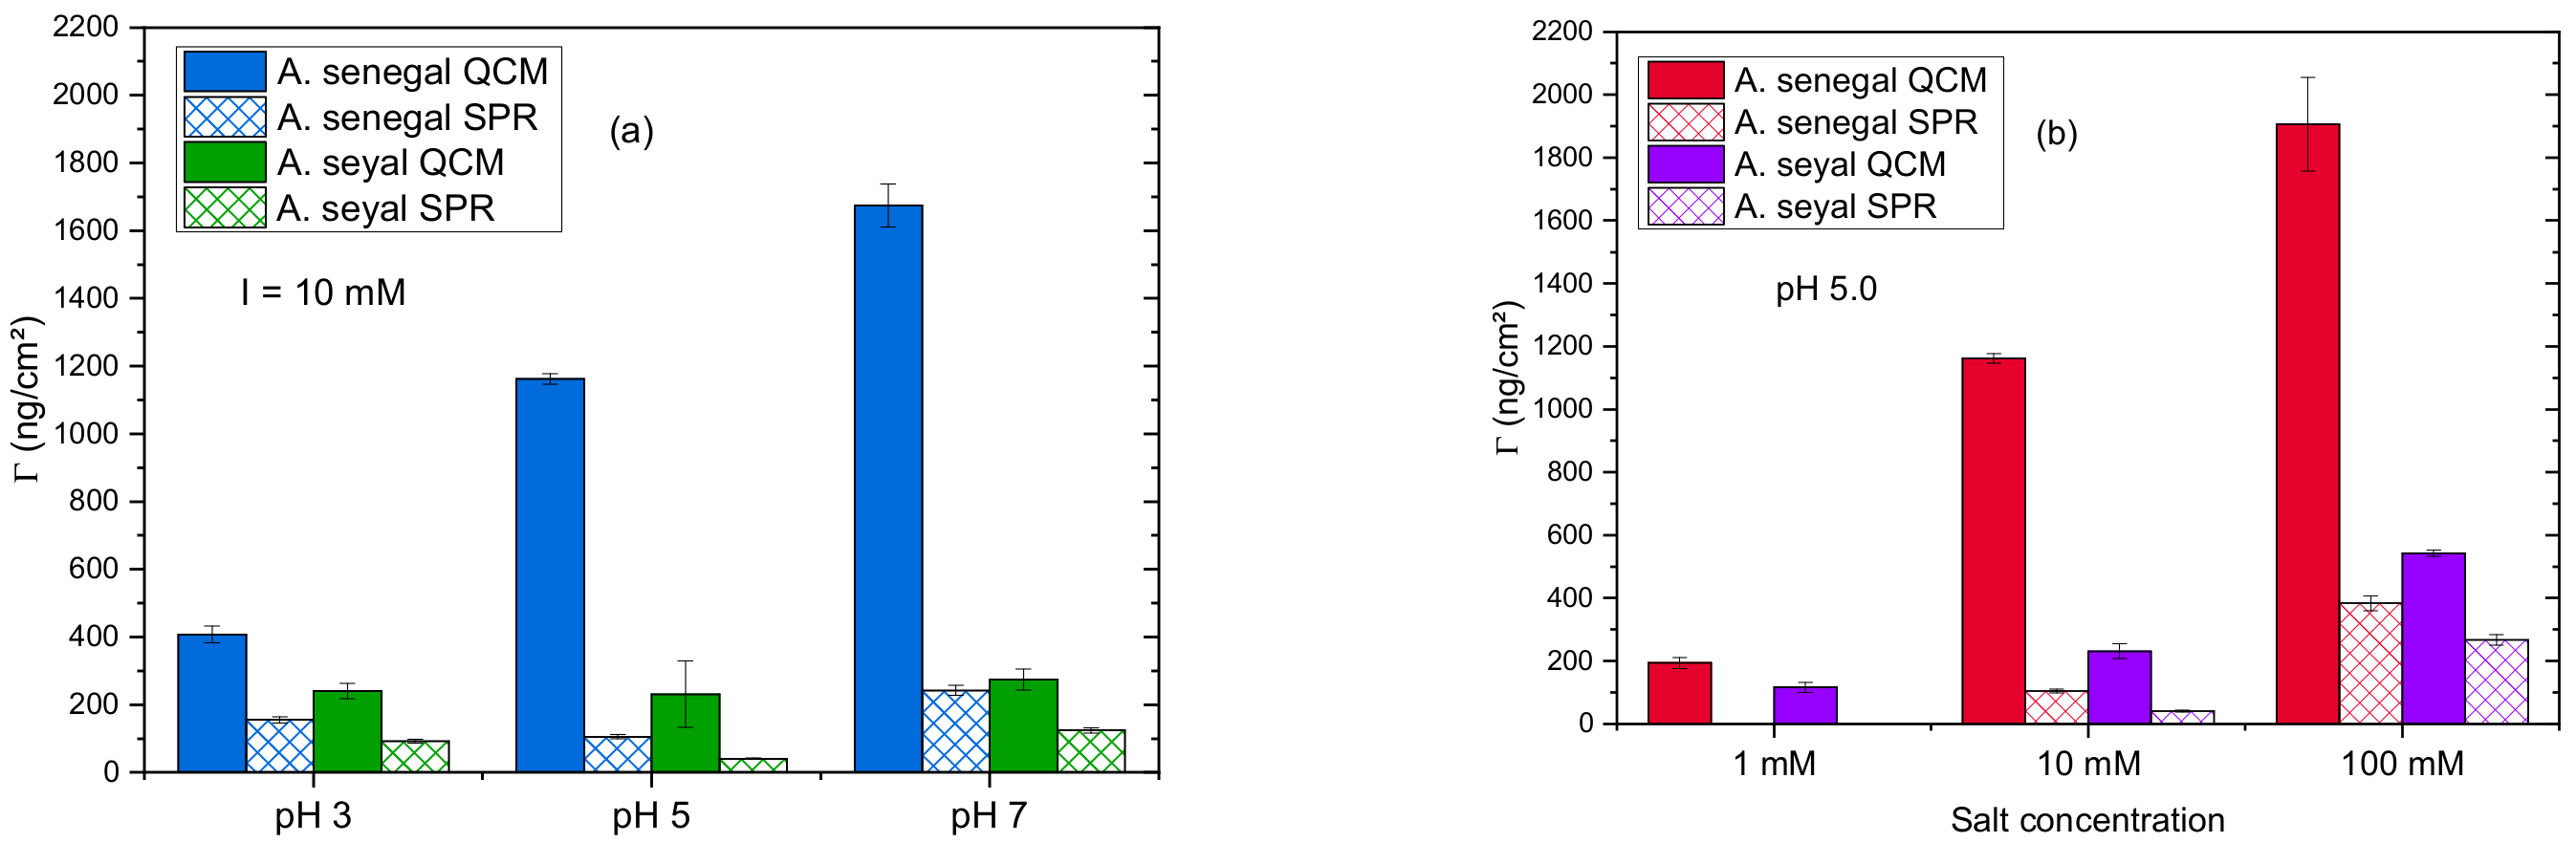
3.1. A. senegal Gum Adsorption Behavior

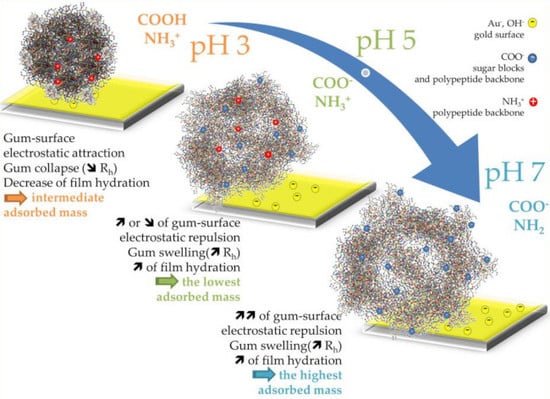
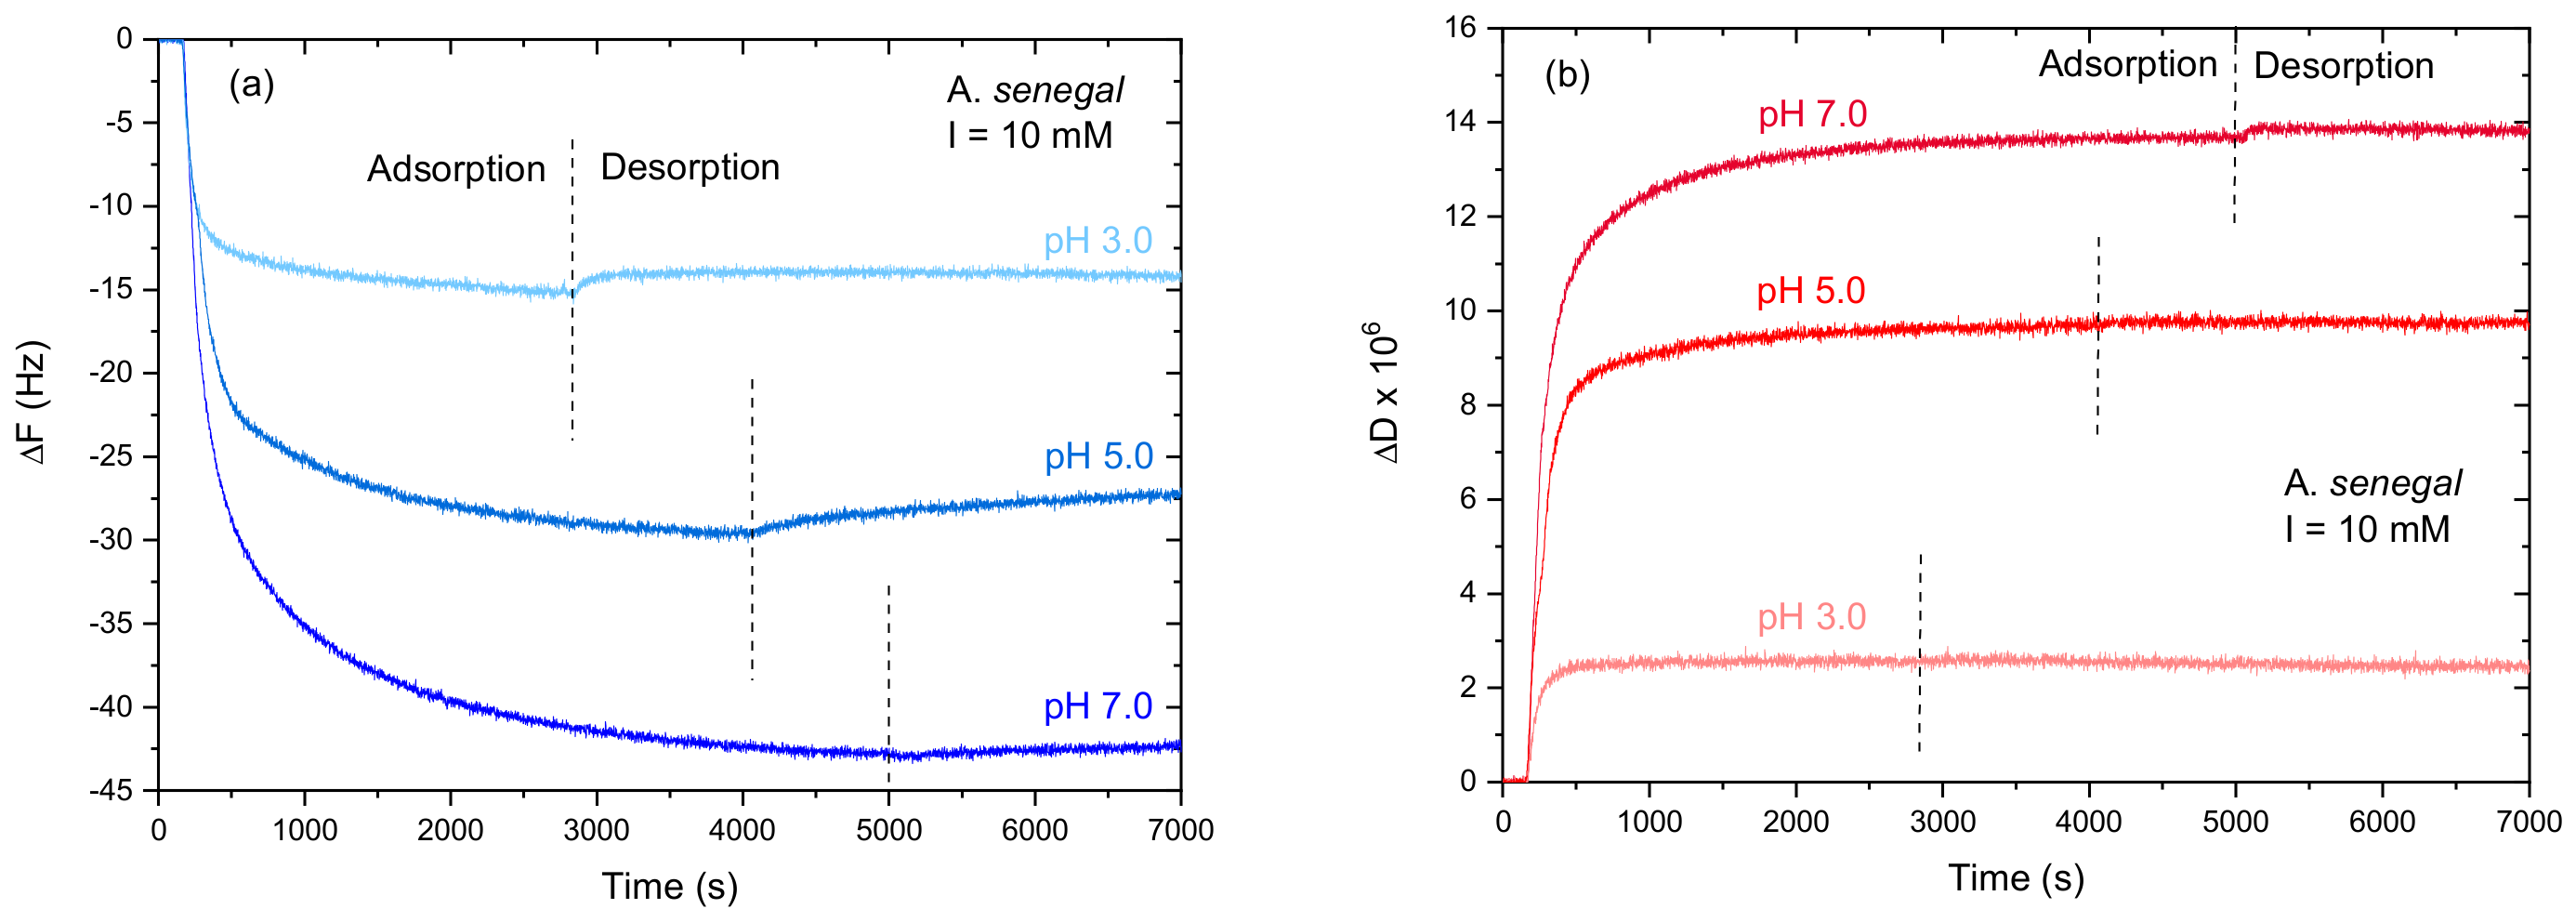
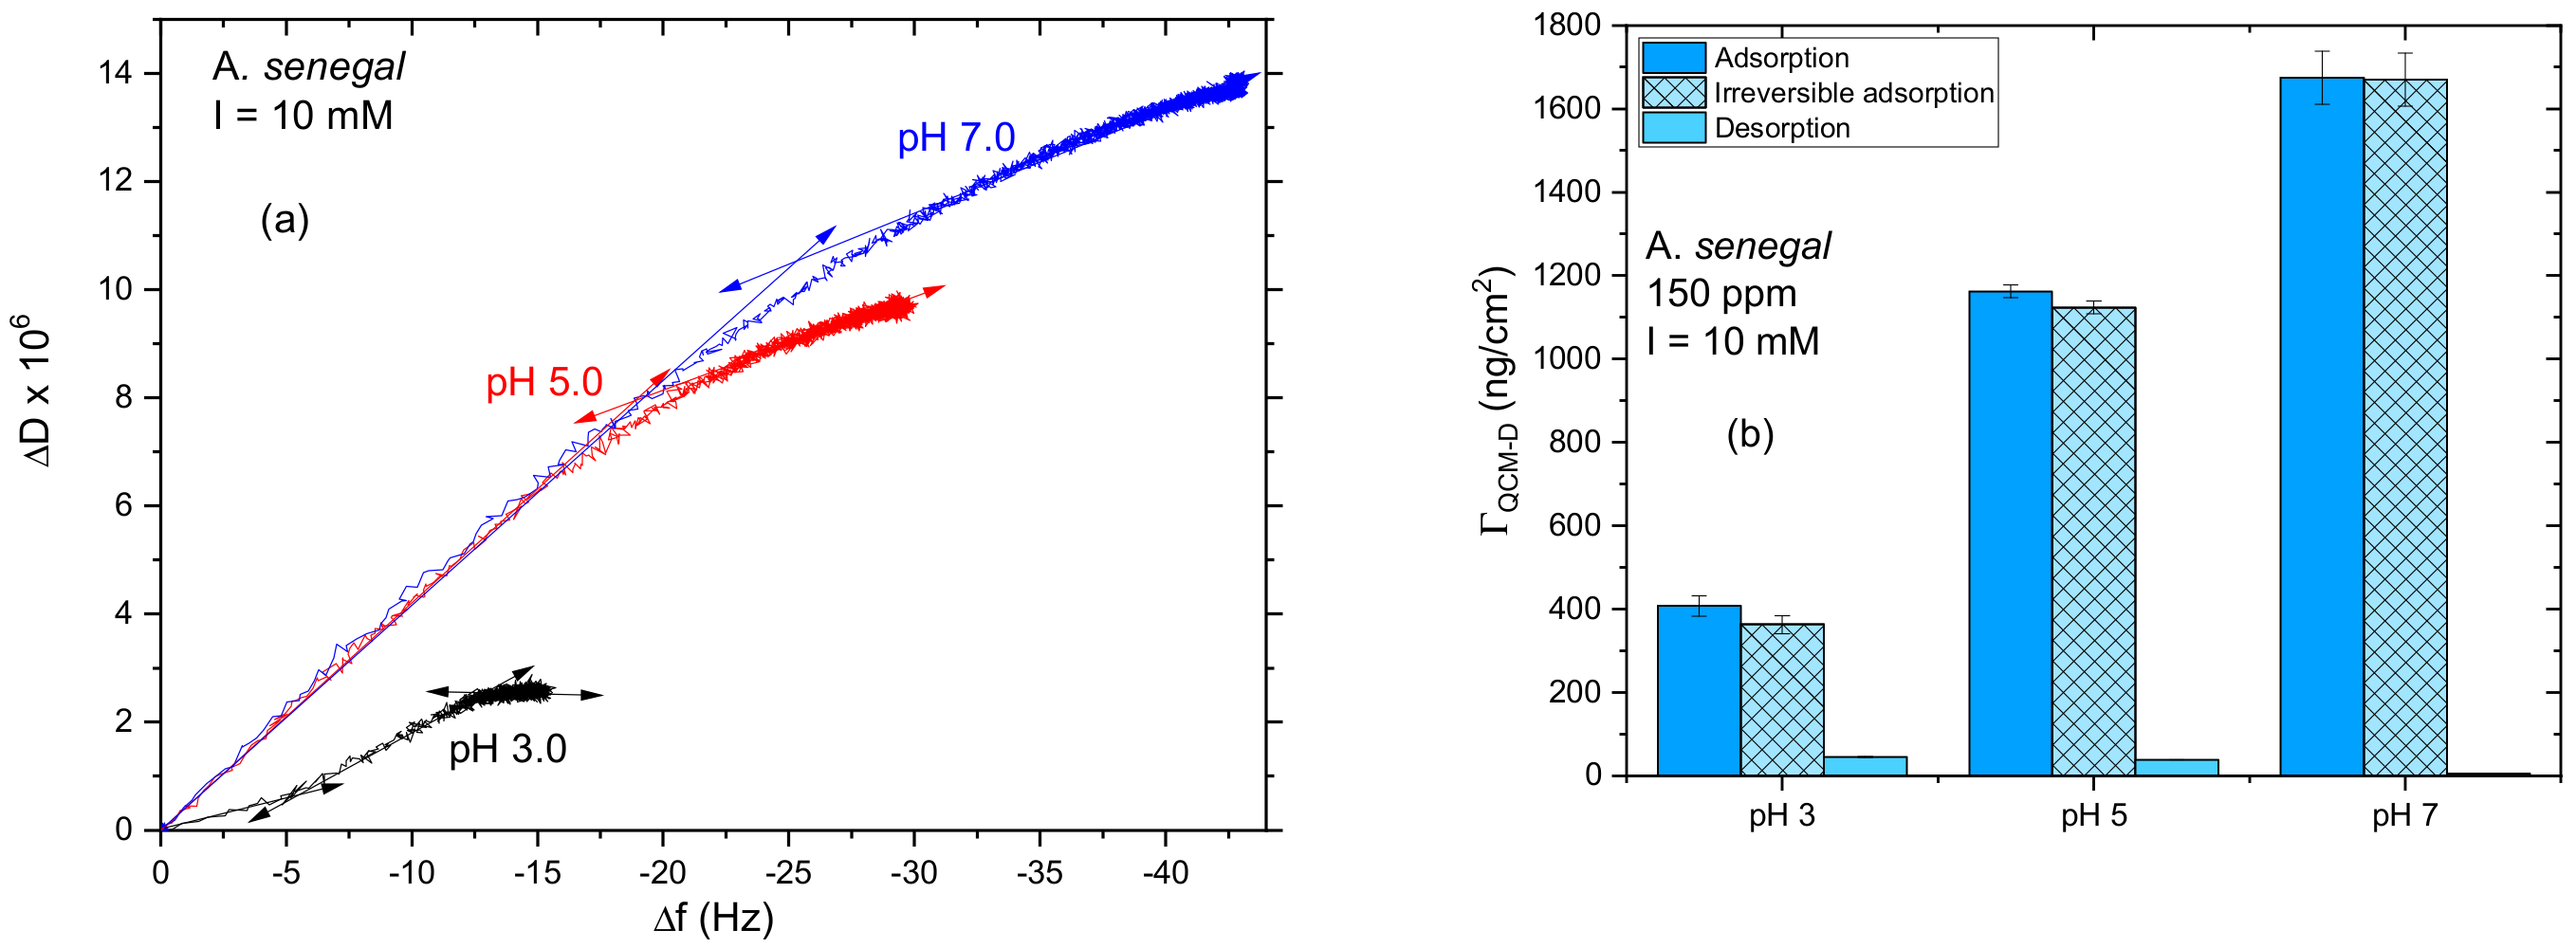
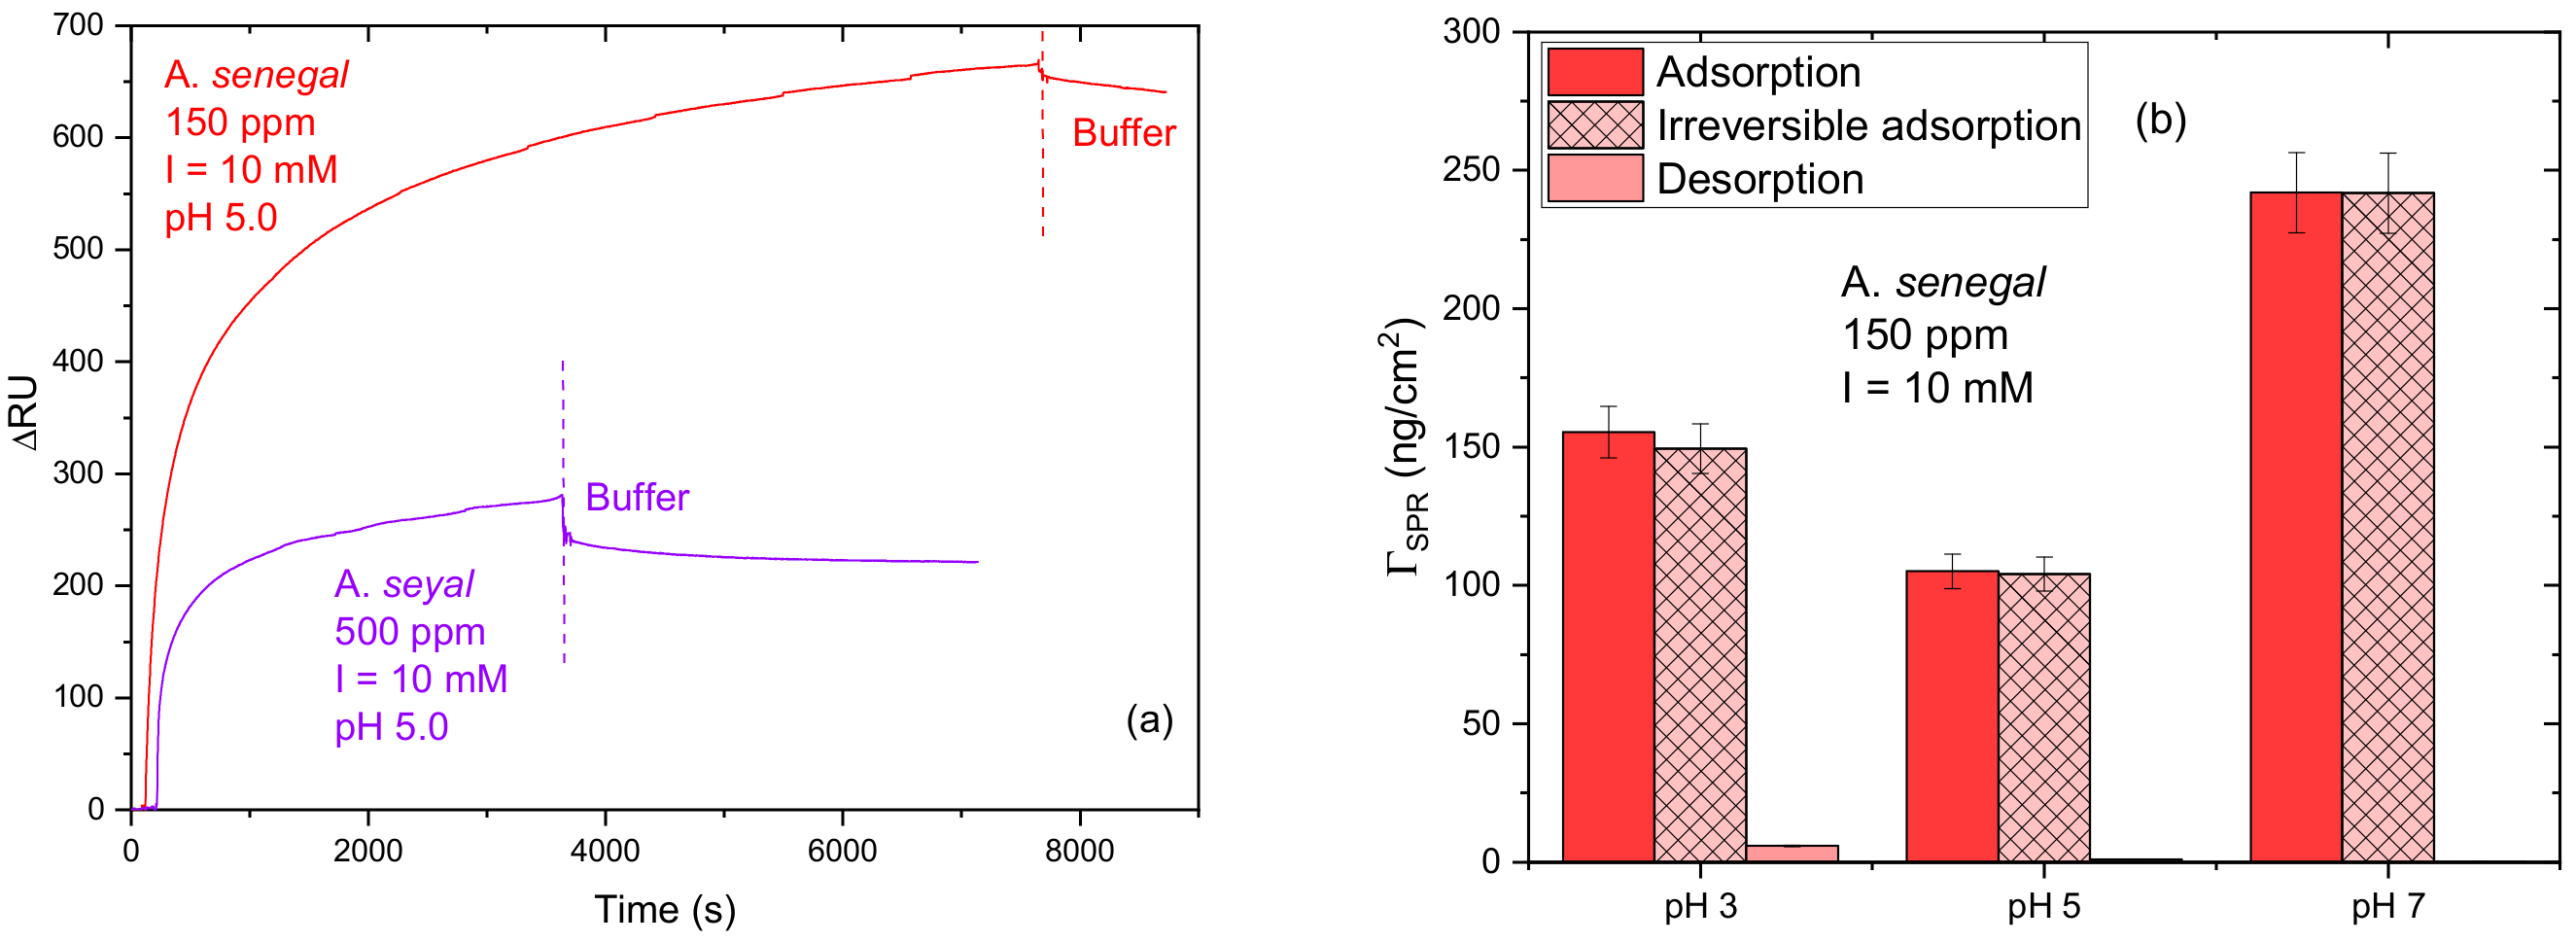
3.1.1. Influence of pH

The impact of the pH on gum adsorption was studied using two types of experiments by QCM-D: Adsorption isotherms were first performed in order to determine the gum concentration for a maximum surface adsorption; adsorption kinetics at the maximum coverage concentration were then performed at different pH values.
The adsorption isotherms for A. senegal gum on the gold surface were determined at three different pH values for 10 mM acetate buffer (Figure 1). Data were acquired by sequentially increasing the gum concentration and after each increase, allowing the adsorption to reach equilibrium, at which point the values of the frequency change (ΔF) and dissipation energy loss (ΔD) were reported.
The adsorption isotherms for the three pH values produced a decrease in ΔF and an increase of ΔD with increasing gum concentration, indicating the formation of an adsorbed layer on the gold substrate, until stabilization. According to both the ΔF and ΔD values, a plateau was reached for the 150 ppm gum concentration regardless of the pH values. The adsorption kinetics of A. senegal gum at 150 ppm in 10 mM acetate buffer at pH 3.0, 5.0, and 7.0 are presented in Figure 2, with ΔF and ΔD variations in time.
Vertical dashed lines indicate the switch of the solution for the desorption process with acetate buffer. The impact of pH on A. senegal gum adsorption is clearly visible, with a significant change of ΔF and ΔD with increasing pH, even if the electrostatic repulsion is favored between the gold substrate and the gum. Indeed, between pH 3.0 and 7.0, A. senegal gum displays a negative electrophoretic mobility (see Table S1, supporting information) with a value close to zero at pH 2 [57,58]. Gold substrate is reported by Schrems et al. [59] to have an isoelectric point pI of 2.9 and a negative zeta potential at high pH. A. senegal gum and gold substrate are therefore both negatively charged between pH 3.0 and 7.0. The gum is, however, adsorbed on the gold substrate and surprisingly adsorbed more at pH 7.0 while more negative charges are present. The more mass adsorbed, the longer the time needed to reach equilibrium on the substrate: From 30 min at pH 3.0 to >45 min at pH 7.0 to reach 95% of the stable state.
It is worth noting that the discrepancies in the ΔF and ΔD values between the isotherms and kinetics came from the differences in the time of adsorption between the experiments: More than 5 h was needed to obtain the ΔF and ΔD values in the adsorption isotherm at C = 150 ppm while the ΔF and ΔD values during the kinetics of adsorption at the same concentration were obtained after approximately one hour. In addition, the mechanism of adsorption could be different during isotherm experiments, with multilayer structures formed on the gold substrate, due to the prolonged time of adsorption and to the gradual increase of the gum concentration in solution.
Conformational changes or changes in the hydration water content can be observed in the QCM-D experiments by plotting the D-f plot, ΔD vs. ΔF [39]. The D-f plots for A. senegal gum adsorption as a function of pH are presented in Figure 3a. It can be clearly observed that the extent of adsorption (as determined by the maximum ΔF) is more limited at pH 3.0 compared to pH 5.0 and 7.0. For pH 5.0 and 7.0, the initial slopes are considerably higher than at pH 3.0, signaling more dissipation per added gum macromolecule during the initial adsorption stage. In addition, the pH 5.0 and 7.0 D-f plots present the same behavior with one slope change and similar slope values, indicating that a similar adsorption mechanism takes place. The D-f plot at pH 3.0 presents, however, a different behavior with two slope changes and a lower slope value, indicating a more compact conformation of the adsorbed film. It is therefore suggested that all these observations indicate that structural alterations occurred within the individual gum macromolecules or within the gum layer as the adsorption proceeded. In other words, the different slope values signal different adsorption phases. ΔD was very high for the three pH values (>2 × 10⁶), and all overtones were highly inhomogeneous (supporting information, Figure S2), which is related to the viscoelastic film. Therefore, the Voigt model was used to analyze data and the results are presented in Figure 3b. The adsorbed mass increases with increasing pH. From pH 3.0 to 5.0, the mass increases 2.85 fold from 407 ± 24 ng cm−2 to 1162 ± 16 ng cm−2, while the increase is less important between pH 5.0 to 7.0 with a 1.44 fold increase, leading to 1675 ± 64 ng cm−2. The thickness of the A. senegal hydrated layer varies from 2.4 nm at pH 3.0 to 9.8 nm at pH 7.0. A. senegal gum film therefore has a very high swelling capacity with increasing pH, probably in line with the increase of the charge density with pH.
The difference between the complete adsorption of gum and the irreversible adsorption after washing the system shows that the level of gum desorption gradually decreases with increasing pH until a highly irreversible adsorption occurs at pH 7.0. This indicates that the more mass adsorbed, the more stable the adsorbed layer is. Indeed, there no gum or water loss occurred during the desorption process at high pH values. Therefore, the viscoelastic layer is able to stabilize water molecules inside and outside the adsorbed layer.
While the QCM-D experiment is related to the “hydrated” mass of the adsorbed molecules, the SPR technique allows observations of the “dry” adsorbed mass. The SPR sensorgram of A. senegal adsorption on gold substrate at pH 5.0 and 10 mM acetate buffer is presented in Figure 4a as an example. The gum adsorption causes the fast increase of the SPR signal with time (ΔRU), until a plateau is reached. Gum is thus directly adsorbed on the gold substrate with a fast-starting kinetic adsorption. The mass of the dry A. senegal gum film adsorbed on the gold substrate for the three pH values is presented in Figure 4b. Compare to the QCM-D results, weaker adsorption occurs at pH 5.0, with 105 ± 6 ng cm−2, and the maximum adsorption is again at pH 7.0 with 242 ± 15 ng cm−2, which corresponds to a 2.3 fold increase compared to pH 5.0. The calculated thickness is between 0.62 nm to 1.42 nm, which is very low compared to the QCM-D derived layer thicknesses. Nevertheless, the same desorption behavior is observed compared to QCM-D experiments with an irreversible adsorption with increasing pH.

3.1.2. Influence of Salt Concentration

The adsorption isotherms for A. senegal gum on gold substrate were determined at pH 5.0 for three salt concentrations (1, 10, and 100 mM) and are presented in Figure S3. The three salt concentrations produced a decrease in the ΔF values and an increase of ΔD values with the increase of the gum concentration, in accordance with the previous pH study. According to both the ΔF and ΔD data, a plateau is reached at around 200 ppm in the solution. For a better comparison with the pH results, a kinetics study was performed at 150 ppm. The adsorption kinetics of A. senegal gum at 150 ppm and pH 5.0 for 1, 10, or 100 mM acetate buffer are presented in Figure S4. The influence of the salt concentration on the A. senegal gum adsorption is clearly visible with a significant change of ΔF and ΔD with increasing salt concentration. Unlike with pH adsorption, the stronger the adsorption, the faster the equilibrium is reached on the gold substrate: In total, 95% of the stable state is reached in 90 min for 1 mM and in 26 min for 100 mM. The D-f plot, presented in Figure 5a, shows that a similar adsorption behavior occurs with one unique slope change regardless of the salt concentration. It can be seen that the extent of adsorption (as determined by the maximum ΔF) is more limited at low salt concentrations. For 10 mM acetate buffer, the initial slope is considerably higher than at the other two salt concentrations, signaling more dissipation per added gum macromolecule during the initial adsorption stage. In addition, the adsorbed film at 10 mM acetate buffer presents a less compact conformation.
Results obtained from the Voigt model calculations are presented in Figure 5b, where the adsorbed mass increases with salt concentration. The adsorption with the 1 mM salt concentration was very low with only 193 ± 18 ng cm−2 of the adsorbed mass, while the amount is 10 times higher at 100 mM with 1907 ± 148 ng cm−2 of A. senegal gum adsorbed on the gold substrate. The thickness of the hydrated layer was found to vary from 1.1 nm at 1 mM to 11.2 nm at 100 mM acetate buffer, a 10-fold increase in agreement with the 10-fold increase of the adsorbed mass. The layer formed in the pH 5.0 100 mM acetate buffer is the thickest and has the highest adsorbed mass. The degree of desorption gradually decreases with salt concentration until an irreversible adsorption occurs, as previously observed. The greater the amount of gum adsorbed at the substrate, the more stable the layer is. An increase in the salt concentration leads to a screening of both gum charges and gold substrate, reducing both the intra- and intermolecular electrostatic repulsions between gum macromolecules and the repulsion between the gold substrate and the gum. The adsorption on the substrate is therefore increased as well as the surface accessibility, leading to faster adsorption kinetics. The adsorbed amount of A. senegal gum (150 ppm) observed by SPR at pH 5.0 is presented in Figure S5. Gum adsorption at low salt concentrations (1 mM) was not achieved using the SPR method for two reasons: First, the very low adsorption of gum reaches the detection limit of the SPR technique; second, the refractive index change is not as stable as the gum adsorbed on the gold substrate, leading to a highly noisy sensorgram. The 3.6 fold increase of the adsorbed mass between 10 and 100 mM from 105 ± 6 ng cm−2 to 383 ± 23 ng cm−2 is in agreement with the decrease of the electrostatic repulsions between the gold substrate and the gum. The thickness also increases 3.6 fold from 0.6 nm to 2.3 nm at high salt concentrations. Interestingly, desorption is higher for the 100 mM salt concentration with a 7.5% of mass loss. Therefore, electrostatic screening is not sufficient to suppress the desorption process. The hydrated state of the film decreases from 91.0% at 10 mM to 79.9% at 100 mM. This result is in agreement with the more compact conformation of gum with the increase of the salt concentration, as previously observed using QCM-D. The effect of the salt concentration was previously observed with a decrease of the macromolecule hydration through partial shielding of the charges of the gum in solution [7].

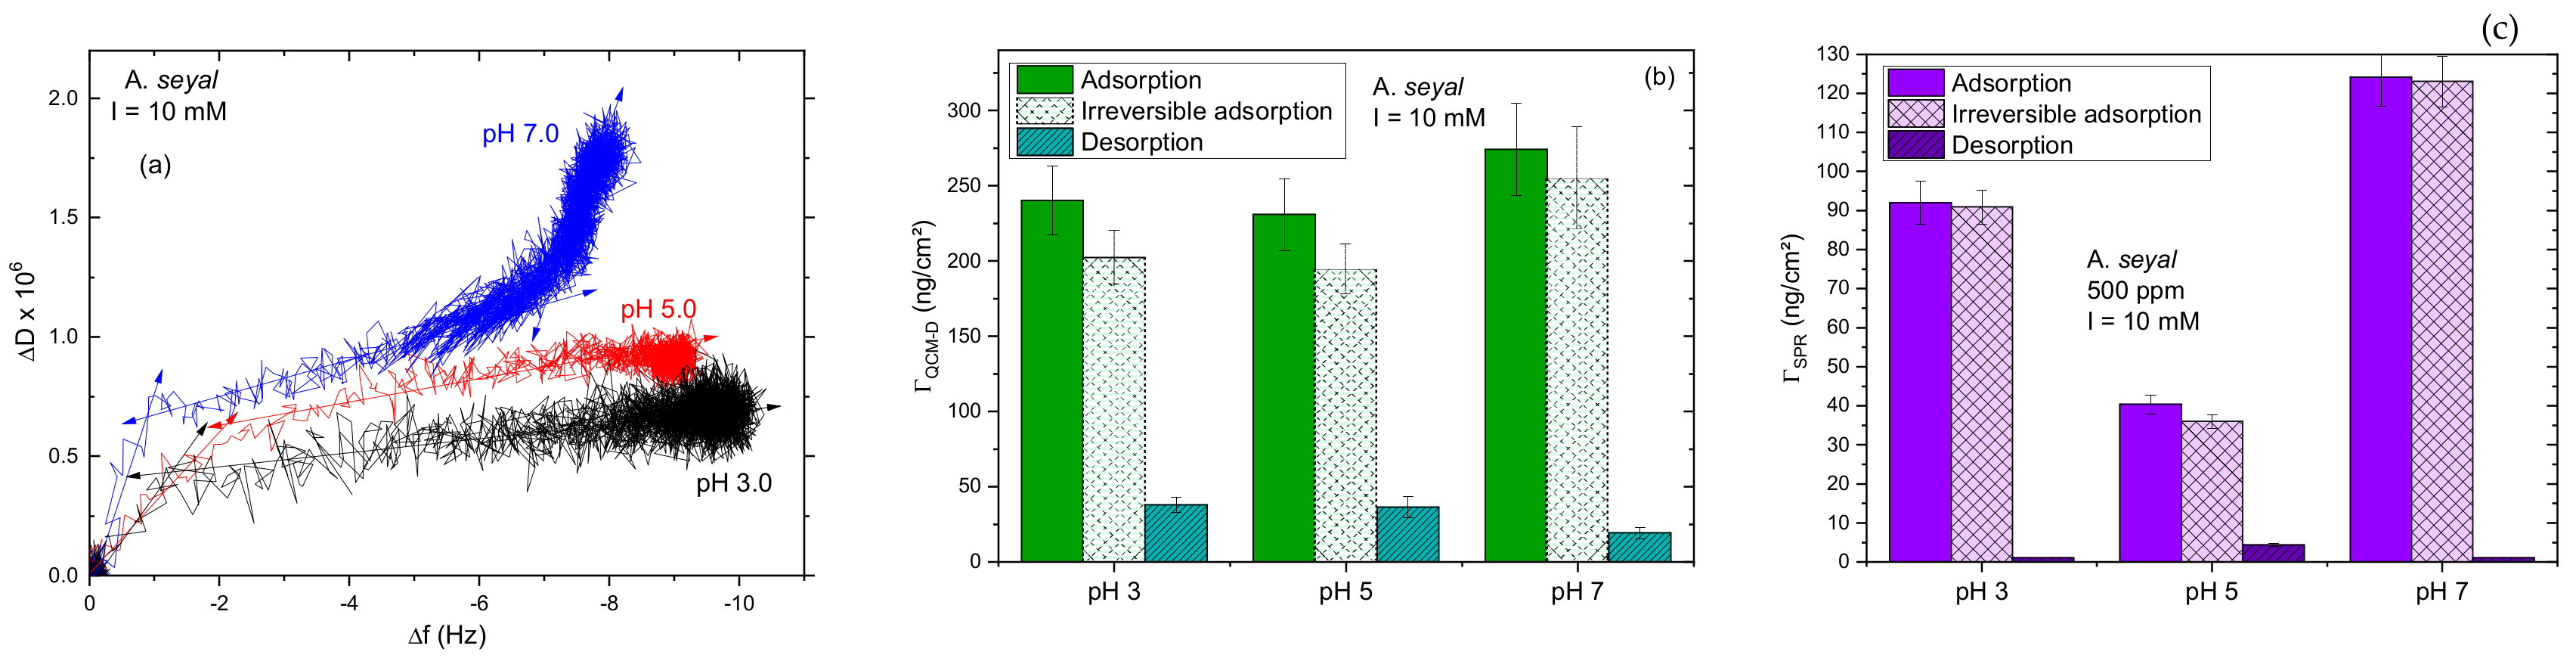
3.2. A. seyal Gum Adsorption Behavior

3.2.1. Influence of pH

The adsorption isotherms for A. seyal gum on the gold substrate were determined at three different pH values for 10 mM acetate buffer (Figure S6). The data are very noisy and represent very small ΔF and ΔD values, indicating a very low adsorption. The changes observed between 400 ppm and 500 ppm are very slow (1 h) and present a ΔF variation < 0.5 Hz. This small shift can therefore be associated to the natural frequency shift of the quartz crystal in time; therefore, a plateau was reached around 500 ppm for the three pH values. Moreover, 3.3 times more A. seyal gum was needed to reach the maximum surface adsorption as compared to A. senegal gum. The adsorption kinetics of A. seyal gum at 500 ppm with 10 mM acetate buffer for pH 3.0, 5.0, and 7.0 are presented in Figure S7, with ΔF and ΔD vs. time. As observed for the adsorption isotherms, A. seyal adsorption is quite low and noisy and there was no significant change of ΔF or ΔD regardless of the pH except at pH 7.0, where ΔD > 1 × 10⁶. The same adsorption time was needed to reach equilibrium regardless of the pH: ~30 min to reach 95% of the stable state. The D-f plot of A. seyal at the three pH values with 10 mM acetate buffer in solution is presented in Figure 6a. The pH 3.0 and pH 5.0 adsorption presents the same adsorption behavior with one slope change and a very compact conformation, while pH 7.0 displays two slope changes and a conformation that is slightly viscoelastic. The A. seyal adsorbed layer presents a rigid behavior compared to the A. senegal layer in the same conditions (i.e., ΔD ≤ 1 × 10⁶ and homogeneous overtones). However, it seems that the layer formed by A. seyal is quite viscoelastic for Sauerbrey’s model, which underestimates the adsorbed amount of gum on the gold substrate, with 157 ± 6 ng cm−2 found using Sauerbrey’s model while 231 ± 24 ng cm−2 was calculated using Voigt’s model at pH 5.0. Voigt’s model was therefore used to analyze the data and the results are presented in Figure 6b. The adsorbed mass is quite constant regardless of pH value, with an average surface concentration of 248 ± 20 ng cm−2 and an average layer thickness of 1.4 nm. Despite electrostatic repulsions between the gum macromolecules and substrate, A. seyal was weakly adsorbed on the substrate, indicating that other interactions may occur. In addition, A. seyal gum has a lower protein content and is more structured and compact compared to A. senegal gum with the lowest intrinsic viscosity (see Table S1), giving rise both to a lower adsorption and lower accessibility of the protein backbone for the gold surface. Interestingly, the desorption process is important at pH 3.0 and 5.0 with around a 16% mass loss, while a loss of only 7.0% was observed at pH 7.0. The layer formed at pH 7.0 is more stable than that formed at pH 3.0 and 5.0. To summarize, the more viscoelastic the layer is, the more stable the adsorbed layer is.
The SPR sensorgram of A. seyal adsorption on a gold substrate at pH 5.0 and 10 mM is presented in Figure 4a, with a fast increase of the SPR signal (ΔRU) with time, until a plateau is reached. The SPR signal is half that for A. seyal gum compared to A. senegal gum. The mass of the “dry” A. seyal gum adsorbed on the gold substrate for the three pHs values is presented in Figure 6c. The adsorbed “dry” mass probed by SPR displays a different behavior than the hydrated mass probed by QCM-D with a minimum value found at pH 5.0 (40 ± 2 ng cm−2) and a maximum value found at pH 7.0 (124 ± 8 ng cm−2). The calculated thickness ranges from 0.2 nm to 0.7 nm. Desorption follows the adsorption amount with a high mass loss at pH 5.0 (11%) and an irreversible adsorption for the two other pH values. The hydration of the adsorbed layer is the highest at pH 5.0, as for A. senegal gum, with 82.5% of water, while a decrease was observed at pH 3.0 (61.7%) and pH 7.0 (54.7%). The high hydration at pH 5.0 is related to the lowest amount of adsorbed gum and therefore the lowest film stability on the gold substrate. As for A. senegal gum, the swelling capacity of A. seyal film is characteristic of the polyelectrolyte character of the polysaccharide blocks and therefore of the numerous hydrophilic interactions taking place with water. Interestingly, contrary to what was observed for the A. senegal film, the decrease of hydration of the A. seyal film observed at pH 7.0 comes directly from the rigid behavior of the film for which, at the molecular level, some structural rearrangements or conformational changes specific to A. seyal gum would occur.
A preliminary conclusion, according to these results, is that the adsorption process of A. seyal gum as a function of the pH is similar to A. senegal gum, with hydrophobic forces taking place between the protein backbone and the gold substrate, and hydrophilic interactions occurring between the polysaccharide blocks and water, leading to more or less hydrated films. A detailed comparison of the adsorption behavior of both gums will be discussed later.

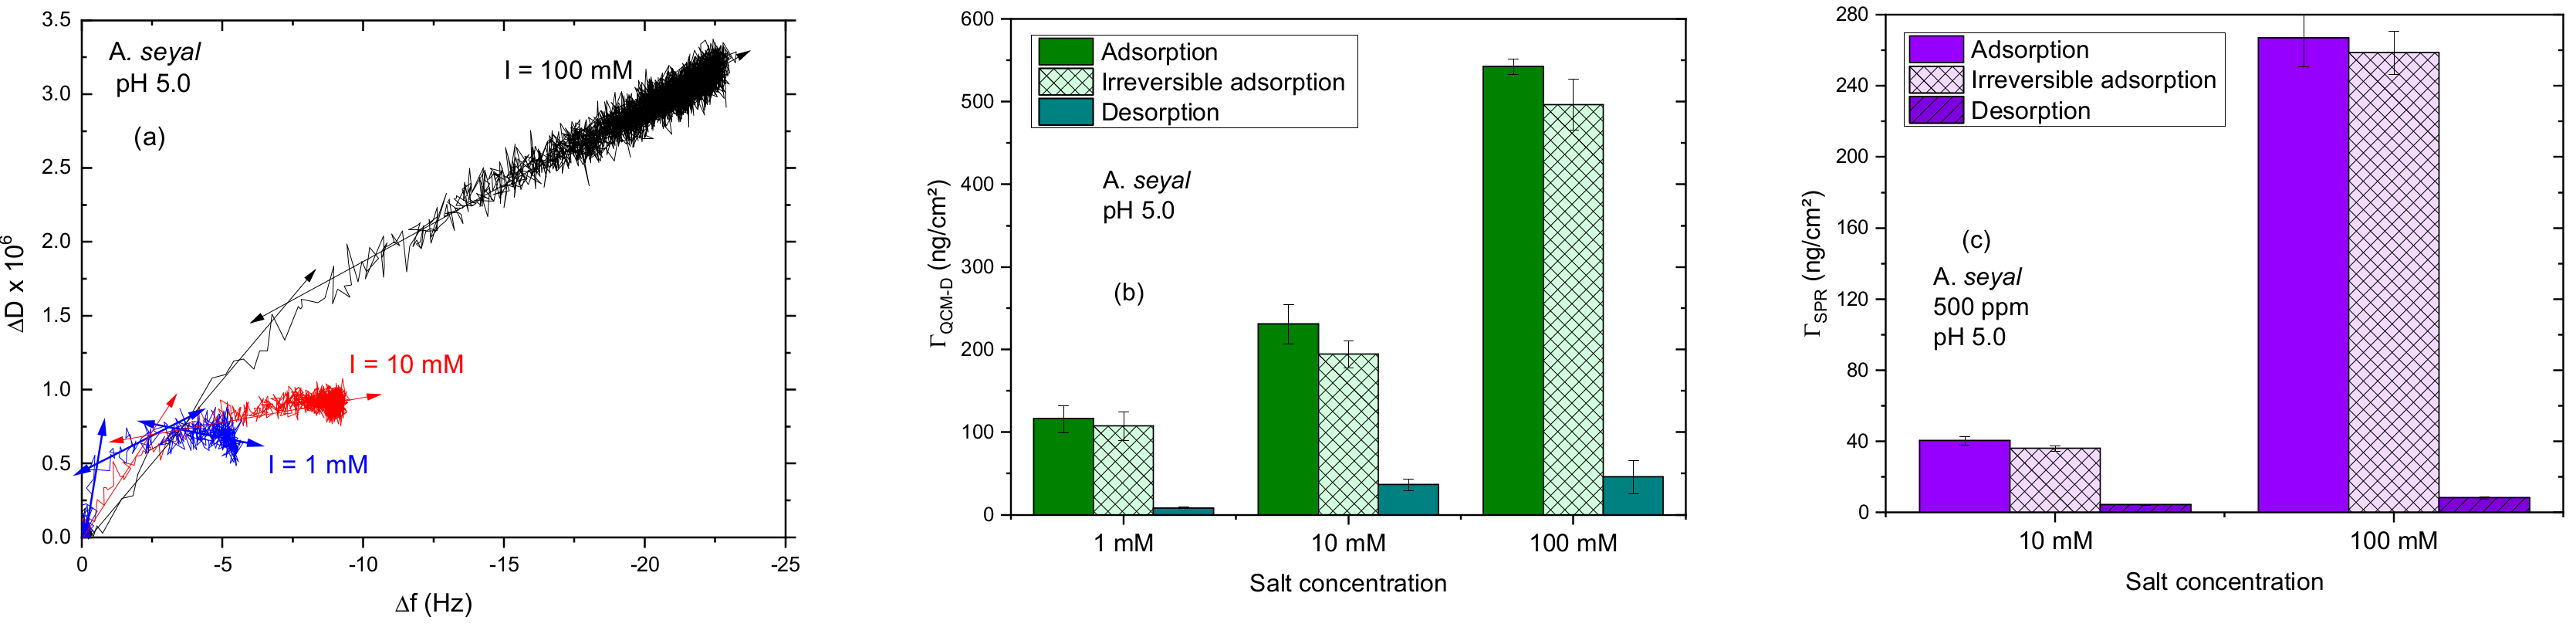
3.2.2. Impact of the Salt Concentration

The adsorption isotherms for A. seyal gum on the gold substrate were determined at pH 5.0 10 mM and 100 mM and are presented in Figure S8. According to both the ΔF and ΔD data, plateaus are reached at C~500 ppm. The lowest salt concentration of 1 mM displays a very weak and noisy adsorption in the QCM-D isotherms, which is in the detection limits of the method (data not shown). The signal was significantly higher than the detection limit for the kinetic experiments at C = 500 ppm. The adsorption kinetics of A. seyal gum at 500 ppm and pH 5.0 for 1, 10, or 100 mM acetate buffer are presented in Figure S9, with ΔF and ΔD monitored vs. time. The impact of the salt concentration on the A. seyal gum adsorption is clearly visible with a significant change of the ΔF and ΔD values with an increasing salt concentration, especially between 10 and 100 mM, with a high frequency change (ΔF) and a dissipation energy loss of ΔD > 1 × 10⁶, representative of a viscoelastic film. Therefore, the salt concentration clearly has an important impact on the A. seyal gum adsorption process compare to the pH. It takes approximately the same time to reach 95% of the stable state for 1 and 10 mM (about 34 min), while 56 min are needed at high salt concentrations.
The D-f plot, presented in Figure 7a, shows a similar adsorption behavior for the 10 and 100 mM salt concentration in solution with one conformational change (one slope change), while two slope changes were observed for the lowest salt concentration. The adsorbed amount of the hydrated mass of A. seyal gum on the gold substrate at pH 5.0 as a function of the salt concentration is presented in Figure 7b. However, it should be noted that despite many attempts, the Voigt model always failed at 1 mM acetate buffer because the data was too noisy, and the Sauerbrey model was therefore used in this case. The adsorption of gum on the gold substrate with the 1 mM salt concentration was very low with only 116 ± 16 ng cm−2 of the A. seyal adsorbed mass, while the amount was almost five times higher at 100 mM with 543 ± 9 ng cm−2. The thickness of the hydrated layer varied from 0.67 nm at 1 mM to 3.13 nm in the 100 mM acetate buffer. The layer formed in the 100 mM acetate buffer and pH 5.0 was the thickest and has the highest adsorbed mass. The desorption process is the most important for 10 mM with a 15.8% mass loss, while it decreased by half when the 1 or 100 mM salt concentration was used. As previously observed for A. senegal gum adsorption, increasing the salt concentration reduces electrostatic repulsions and increases the A. seyal adsorption capacity. The adsorbed amount of A. seyal gum observed by the SPR method at pH 5.0, 500 ppm, and 10 or 100 mM salt concentration is presented in Figure 7c. A 6.6-fold increase of the adsorbed amount was observed between 10 mM and 100 mM (40 ± 2 ng cm−2 and 267 ± 16 ng cm−2). The layer thickness increased from 0.23 nm to 1.54 nm with the salt concentration. An irreversible adsorption was observed for a high adsorbed amount with only a 3.1% mass loss while a 11.0% mass loss was observed at the 10 mM salt concentration. Therefore, electrostatic forces have a huge impact on A. seyal adsorption and stabilization of the structure. The hydrated state shows a decrease of the water content at high adsorption, with only 50.8% of water in the 100 mM and 82.5% in the 10 mM acetate buffer, probably due to the increase of the ions’ hydration with the increase of the salt concentration and therefore a decrease of the macromolecule hydration as previously observed for A. senegal gum. The consequence would therefore be a decrease of the water content or of the hydration double layer in the adsorbed layer.

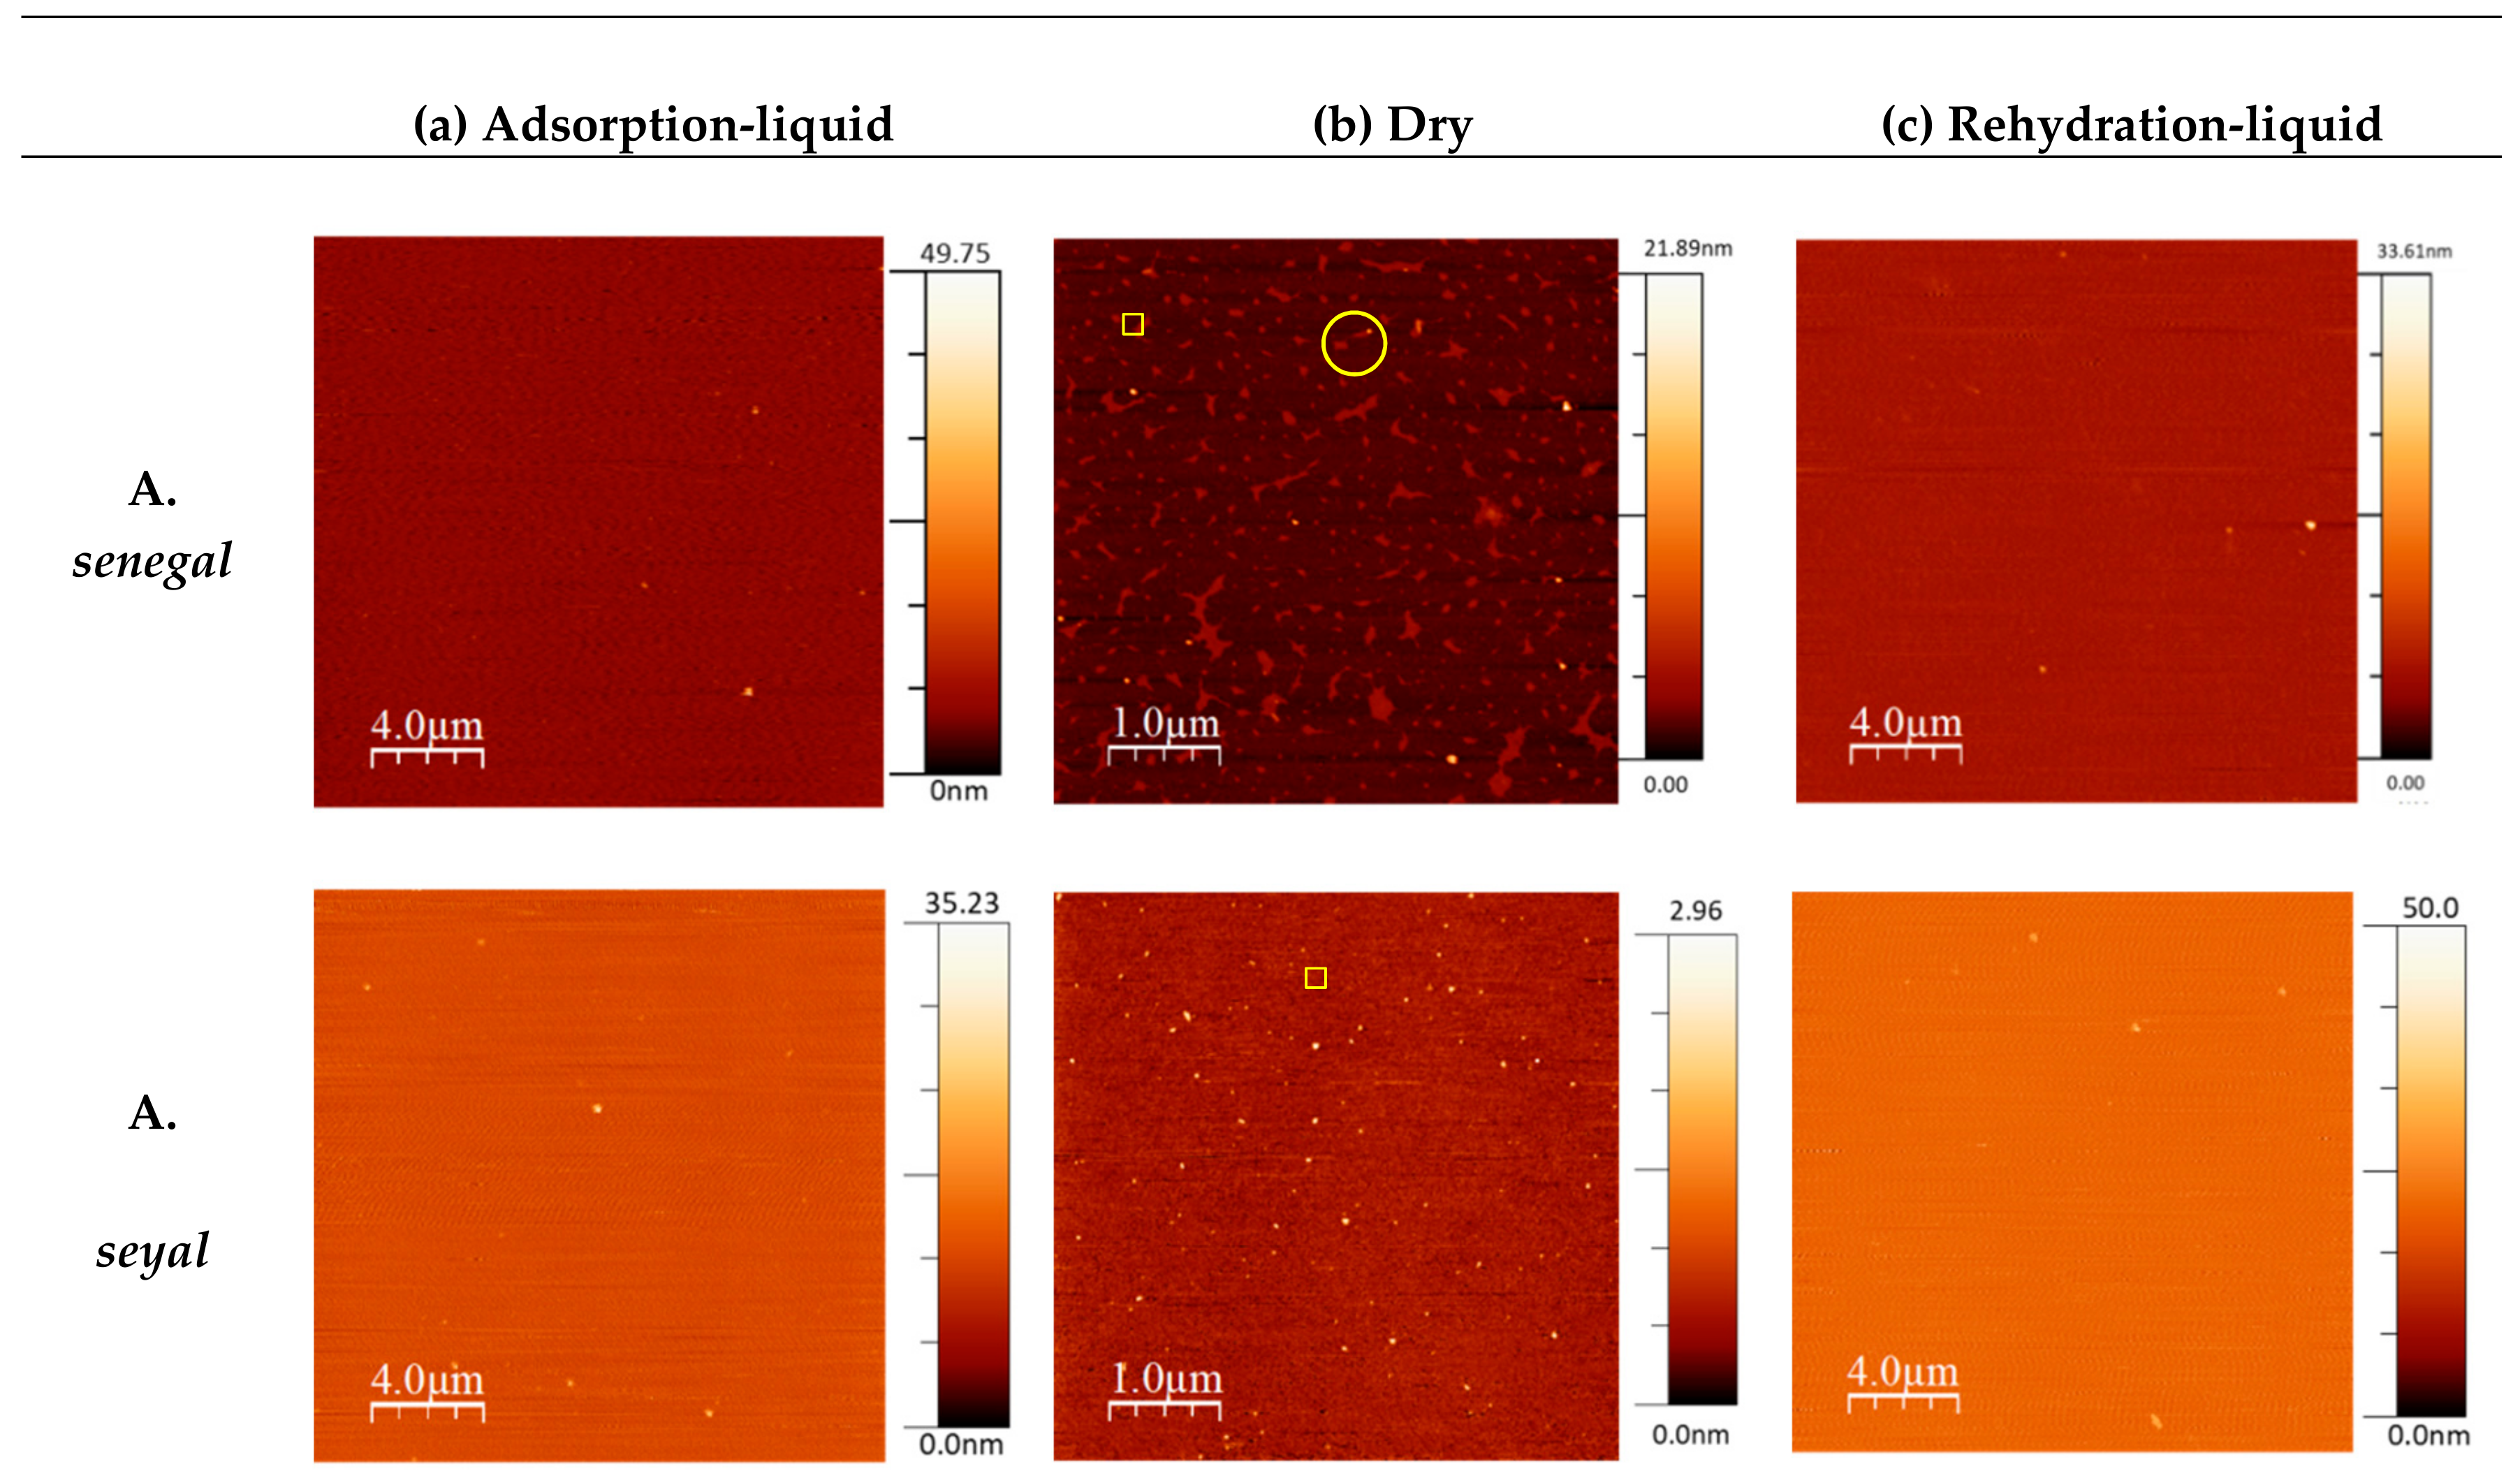
3.3. Morphological Characterization of Gum Films

AFM was performed to analyze the surface topography and roughness of the acacia gum adsorbed layers on the silicon wafer in the liquid state just after adsorption, in a dry state, and after rehydration (Figure 8). It should be pointed out that gold and silicon surfaces are both negatively charged, but they differ in the degree of hydrophobicity. Additional AFM topography images of dry adsorbed layers and height distributions are presented in Figures S10 and S11. After 2 h of adsorption, all adsorbed layers in the liquid state presented a homogeneous surface with very few “spheroidal-like” aggregates (thickness ranging from 5 to 35 nm). The presence of a homogeneous layer was confirmed with the phase images and height profiles, showing almost no contrast (data not shown). However, the AFM images of adsorbed layers after drying reveal a different surface topography. The A. senegal gum adsorbed layer presents a non-uniform surface coverage with two different populations: Very few white spots corresponding to “spheroidal-like” aggregates with thicknesses higher than 10 nm and numerous small aggregates with a “puddle-like” structure with a thickness of 1.3 nm. The A. seyal gum dry adsorbed layer presents only few white spots of “spheroidal-like” aggregates with a thickness of 0.87 nm and few aggregates with a thickness of 1.3 nm. The A. senegal gum adsorbed layer therefore presents a higher thickness after frying and a different morphology compared to the A. seyal gum adsorbed layer. The thicknesses observed using AFM on dry adsorbed layers are in agreement with the calculated thicknesses from the SPR measurements. It can therefore be concluded from the AFM measurements that A. senegal and seyal gums formed uniform layers during the adsorption process with the presence of a few aggregates on the surface. The A. senegal dry adsorbed layer presents two different populations. The A. seyal dry adsorbed layer therefore only presents aggregates with a “spheroidal-like” morphology.
The layer formation has reversibility after drying and rehydration, however, with a higher inhomogeneity on the surface and with the presence of swollen “spheroidal-like” aggregates.

4. Discussion

A comparison of the mass adsorption of both gums on a gold substrate using QCM-D and SPR methods at various pH and salt concentrations is presented in Figure 9. The calculated data obtained for these experiments using both techniques are shown in Tables S2 and S3 for pH and salt concentration variations, respectively. From a general point of view, A. senegal gum adsorption is much higher than for A. seyal gum on the hydrophobic and negatively charged gold substrate. This first observation comes from the adsorption isotherm results, where it is clearly shown that, in the same conditions, three times less A. senegal gum is needed to reach the maximum surface adsorption compared to A. seyal gum. In addition, at the maximum adsorption coverage for both gums, A. senegal still adsorbs much more than A. seyal. A. senegal gum therefore has a greater adsorption capacity regardless of the experimental conditions. Interestingly, the concentration (mg cm−3) obtained at equilibrium for each experimental condition for both gums can be roughly calculated taking into account the surface concentration and the layer thickness. It was found that a constant concentration of ~1720 mg cm−3 is obtained regardless of the gum nature, pH, or salt concentration. This concentration value corresponds to the density of the film, ρ, taken for calculations and equals 1703 and 1734 kg m−3 for A. senegal and A. seyal, respectively. First, this result confirms the isotherm adsorption results, and, second, it shows that both gums have a tendency to form a monolayer on the gold substrate. Indeed, if a multilayer was formed, regardless of the experimental conditions, the concentration would be higher and no stabilization would be reached during isothermal experiments. However, the fact that the ΔD vs. ΔF plots are not straight is indicative of a multi-layer of gum at the surface [42]. However, further investigations are needed to distinguish between a mono or a multilayer of gum adsorbed at the surface.
Both gums have the same adsorption behavior in the “dry” state (see SPR results), with a maximum adsorption at pH 7.0 and a minimum at pH 5.0. This behavior is in contradiction with the increase of the repulsive interactions between COO driven by the carboxylic groups of the polysaccharide blocks at high pH values and the negatively charged gold substrate, and could be explained by the hydrophobic contribution of the polypeptide backbone. However, to try to rationalize why the adsorption is greater at pH 7.0 while electrostatic repulsions prevail, calculations of the Debye screening length were made in acetate buffer 10 mM taking into account the effective ionic strength brought by the buffer at the three studied pH values.
Table 1 clearly reveals that the ionic strength brought by the buffer leads to an ~8-fold decrease of the screening Debye length. This simple calculation could therefore explain in a first attempt the substantial increase of adsorption with increasing pH and/or salt concentration. Other interactions can, however, not be neglected and in particular the hydrophobic contribution coming from the polypeptide backbone and/or the hydrogen bonds coming from the polysaccharide blocks. The adsorption is therefore impacted more for A. seyal gum with a 6.6-fold increase of the mass adsorbed with the salt concentration and a more stable film while a 3.6-fold increase was observed for A. senegal gum with a less stable film. This result seems in contradiction with the lower number of the negative charges of A. seyal (−452 e) compared to A. senegal (−560 e) gum. This would simply mean that interactions other than electrostatic ones and/or conformational changes are involved in the adsorption process. As a preliminary conclusion, it can thus be said that as A. seyal gum has a lower protein content (1%) compared to A. senegal gum (2.15%) with a more compact structure, leading to a lesser solvent and surface accessibility of the protein backbone, its adsorption capacity would be at least twice lower, a hypothesis that was confirmed by the SPR results.
From the QCM-D results, it was observed that A. seyal films are less stable and display a more compact and less viscoelastic behavior than A. senegal films regardless of the experimental conditions. This behavior may be related to the differences in the flexibility of each gum in solution [6,7], and the present study confirms that the A. senegal film has a more flexible and deformable structure than the more rigid A. seyal film. A. seyal films have close similarities to locust bean gum (LBG) films [41].
Both gums present a relative high hydration state of the adsorbed film, mainly due to hydrophilic interactions between the polysaccharide blocks and water (Figure S12). A high hydration state was also found on other polysaccharide films, such as pectin, xanthan, LBG, and gellan films [41], while the adsorption takes place on more or less hydrophobic surfaces (bare gold sensor in our study or PolyDiMethylSiloxane PDMS spin coated gold sensor in [41]). These results question the mechanism of adsorption of polysaccharides with molecular structures being totally different in terms of the molecular weight, persistence length, linear or branched structure, and the presence of a protein fraction in the macromolecule.
The mass of the adsorbed gum, Γ, evaluated as per unit of the geometrical unit in ng/cm2 can be evaluated from the following equation:
Γ a d = M w S g A v Θ ,
where M w is the molecular weight; S g is the cross-section area, which for the near spherical macromolecule is S g =   π r 2 ; A v is the Avogadro number; and Θ is the coverage. Using the molecular weight and hydrodynamic radii values from Table S1, one can calculate that Γ = 87.8 and 122.1 ng cm−2 for A. senegal and A seyal, respectively, at the maximum coverage of Θ = 0.55 (the jamming limit for a random sequential adsorption (RSA)). Assuming that the hydration of water contributes to the Acacia gum macromolecule by ca. 52% [7], the mass of the saturated film, corrected for the molecule hydration, should be 131.7 and 183.2 ng cm−2 for A. senegal and A. seyal, respectively. The mass obtained from the QCM-D measurements for the adsorbed gum films is 1.3 to 12.7 times greater than the saturation Γ value calculated according to Equation (8). This discrepancy indicates that part of the film mass determined with the QCM-D technique is contributed by water bound at the interfacial areas free of the adsorbate. The other reasons for the enhanced mass of the film may be the formation of multilayer areas in the gum film or surface aggregation of the gum macromolecules. The latter phenomenon may cause the trapping of an additional amount of water inside the aggregates. The comparison between masses obtained from the QCM-D and SPR experiments to determine the hydration degree of the films, assuming that the excess mass measured in QCM-D compared to SPR is due to trapped water molecules, clearly indicates that Acacia gum films are highly hydrated films (Figure S12). In particular, in agreement with the higher uronic acid content, A. senegal film presents a higher water content than A. seyal, film leading to a higher swelling capacity. The lowest hydration degrees were obtained for both gums at pH 3.0 I = 10 mM (~61%), where uronic acids were fully protonated and pH 5.0 I = 100 mM (79.9% for A. senegal and 55% for A. seyal), where dissociated uronic acids were partly screened by counter-ions. The modulated swelling process as a function of the pH and salt concentration was also clearly demonstrated in polyelectrolyte branched dendrimer films [35,36]. In addition, it was clearly observed that the film shear elastic modulus and shear viscosity of A. senegal gum are rather constant while those of A. seyal gum decrease with increasing pH (Figure S13a) (see also Table S2). The film viscoelastic behavior is rather more complex with increasing salt concentration (Figure S13b) (see also Table S3). A decrease of shear viscosity and an increase of shear elastic modulus were therefore observed with the increase of salt concentration (see also Table S3). The viscoelastic properties of films would therefore not be directly related to their hydration degree, but would arise from other parameters, such as conformational changes associated to the film rearrangements. However, the observed rise in the layer viscosity by the decreasing pH or increasing salt concentration, for instance, is directly related to a decrease of the layer hydration. To summarize, A. senegal films always display a viscoelastic behavior regardless of the pH and salt concentration used while A. seyal films shifts from a rigid to a viscoelastic behavior with increasing pH while increasing salt concentration slightly increases the film shear viscosity while an increase of the film shear elastic modulus is observed.
Interestingly, Mejia Tamayo et al. [7] found that A. seyal gum is more hydrated in solution than A. senegal, despite a smaller content in charged sugars (see Table S1). This lower hydrated state was explained as being due to a higher protein and mineral contents in A. senegal and a higher arabinose content in A. seyal. Furthermore, the lower flexibility of A. seyal macromolecules and therefore the increase of the film rigidity would induce a shrinking and/or a blockage of the polysaccharide blocks when the polypeptide backbone unfolds during adsorption on the substrate, leading to a decrease of the swelling capacity. This change of flexibility is illustrated through the D-f plots for which one or two rearrangements took place depending on the pH and salt concentration (see Tables S2 and S3 and Figure 3, Figure 5, Figure 6, Figure 7). It could be summarized by the more flexible the film is, the more hydrated the film will be.
Grein-Iankovski et al. [60] recently determined the acid dissociation constant (pKa) of Acacia gum, resulting in two characteristic pKa values: pKa1 between 3 and 4 corresponding to the carboxylic group of the uronic acid fraction of the gum (i.e., polysaccharide functional groups) and a pKa2 around 6.5 corresponding to the amine group of the protein fraction (Lys, Arg, His). Note also that an additional pKa can also be taken into account with the carboxylic groups present on the protein backbone (Glu, Asp) with a pKa3 = 3.9–4.2. Therefore, by looking at the dry adsorbed mass (i.e., without water), it can be observed that there seems to be an impact of these chemical functions on the adsorption process. At pH 5.0, where the dry adsorbed mass is the lowest, carboxylate groups become negatively charged while amine groups become positively charged. These protonation state changes can therefore have two opposite effects: An increase of the electrostatic repulsions between the gold substrate and the gum if the polysaccharide blocks are directly concerned by the adsorption process or an increase of the electrostatic attractions between the gold substrate and the gum if the protein backbone is directly involved in the adsorption process. In addition, the coexistence of negatively and positively charged groups on gum macromolecules may induce intra-molecular interactions between the polysaccharide and protein moieties, leading to some conformational constraints and therefore a contraction of the whole gum. At pH 7.0, the amine groups become neutral while more carboxylic groups are dissociated and more negative ions are present on the gold substrate. This chemical situation may lead to an increase of the electrostatic repulsions between the gold substrate and the gum macromolecules but also to a conformational relaxation between polysaccharide blocks and polypeptide backbone leading finally to a structural rearrangement and therefore an increase of substrate accessibility for the gold substrate of the hydrophobic amino acids carried by the protein backbone. At pH 3.0, where the dry adsorbed mass is intermediate between pH 5.0 and pH 7.0, carboxylic groups are protonated (COOH) while amine groups are dissociated in NH3+, leading to an increase of the electrostatic attraction between the gold substrate and the gum macromolecules, but also to a strong conformational constraint, as no or few charges are present on the polysaccharide and polypeptide moieties. The consequence is that the whole gum would collapse leading to a reduced surface accessibility. These conformational changes with the pH together with the branching nature of the carbohydrate blocks were also recently reported by Ma, Bell, and Davis [61] to explain the differences in the emulsification properties of A. senegal and seyal gums.
From the SPR and QCM-D data, it is possible to calculate the hydration state of adsorbed films. A. senegal films present a very high hydration state on the gold substrate, with a maximum of 91% at pH 5.0 while 85.5% is found at pH 7.0 and 61.9% at pH 3.0. Three types of water may be distinguished in the film structure, which is considered by the QCM-D method: Water molecules within the internal structure of gums films, water molecules from the outer shell of hydration, and water molecules that are weakly bound or associated with the gum film. Nevertheless, one can observe that the hydration state is the lowest at pH 3.0 and quite constant at pH 5.0 and 7.0. This swelling capacity of A. senegal gum is characteristic of the hydrophilic interactions between the polysaccharide blocks and water and therefore of the protonation of the carboxylic groups as for classical polyelectrolytes. Thereby, according to these results, the adsorption process of A. senegal gum as a function of the pH may be governed by hydrophobic interactions between the protein part and the gold substrate, but also by hydrophilic interactions between the polysaccharide part and the solvent, leading to varied swelling states and surface accessibility with the pH. A scheme showing the different contributions of interactions and conformational changes as a function of the pH is displayed on Figure 10.

5. Conclusions

In the present study, a thorough investigation of the effect of the pH and salt concentration on the adsorption of Acacia senegal and seyal gums on a gold surface was performed. The results highlight some important differences in the adsorption capacity and behavior of both gums, the highest adsorption capacity being for A. senegal gum. The adsorption process is generally driven by hydrophobic interactions between the polypeptide backbone and the gold surface, while the swelling of the adsorbed film is mainly dependent on the hydrophilic interactions between polysaccharide blocks and water. These assumptions led to the preliminary conclusion that A. senegal gum adsorbs better onto the gold surface due to its higher protein content compared to A. seyal gum. By increasing the pH of the solution, the increase of electrostatic repulsions between AGPs and gold surface led to an increase of the adsorbed amount, a result that is in agreement with the involvement of other interactions in the adsorption process. As a consequence, the shielding of charges on both the gold surface and Acacia gums by increasing the salt concentration led to a greater adsorption on the substrate, however, this increase was more pronounced with the A. seyal gum. The adsorbed layers of both gums displayed a high hydration state, with the swelling capacity being higher for A. senegal film due to its more flexible and stable structure. AFM imaging shows the formation of a homogeneous film during the adsorption process regardless of the substrate used. The drying of the adsorbed layer highlighted the different behavior between the two gums: Two populations of aggregates were present for the A. senegal film while the A. seyal film was only composed of one type of aggregate. In any case, a reversibility of the adsorbed layer after drying and rehydration was clearly observed and the swelling ability of the different aggregates was confirmed. AFM-derived thickness analyses confirm the calculated SPR thickness and highlight the morphological differences between the adsorbed layers.

Supplementary Materials

The following data are available online at https://www.mdpi.com/2504-5377/3/2/49/s1, Table S1. Biochemical composition and structural parameters of A. Senegal and A. seyal gums, Table S2. Electrophoretic mobility of A. senegal and A. seyal gums in solution (µe), films characteristics calculated from QCM-D and SPR data, and % water content (ΓH2O) of A. senegal and A. seyal gum films after adsorption on gold substrate as a function of pH for a salt concentration of 10 mM, Table S3. Electrophoretic mobility of A. senegal and A. seyal gums in solution (µe), films characteristics calculated from QCM-D and SPR data, and % water content (ΓH2O) of A. senegal and A. seyal gum films after adsorption on gold substrate as a function of salt concentration for a constant pH 5.0, Figure S1. Refractive index (λ = 589 nm) of A. senegal and A. seyal in 10 mM acetate buffer pH 5.0 as a function of concentration. Linear fits give the slope corresponding to the refractive index increment dn/dC and extrapolation to C = 1 gives na, the refractive index of the adsorbed species in condensed form (i.e., corresponding to a “dry” film where 100% of gum species are adsorbed on gold surface), Figure S2. Adsorption of A. senegal gum at 150 ppm 10 mM acetate buffer pH 5.0 on gold substrate: frequency change (ΔF) and dissipation energy loss (ΔD) in time for five overtone frequencies, Figure S3. Adsorption isotherms of A. senegal gum on gold substrate presented as (a) frequency change (ΔF) and (b) dissipation energy loss (ΔD) at pH 5.0 and different salt concentrations (1, 10 and 100 mM), Figure S4. Adsorption kinetics of A. senegal gum at 150 ppm on gold substrate at pH 5.0: (a) frequency change (ΔF) and (b) dissipation energy loss (ΔD) for 1, 10 and 100 mM acetate buffer. Dashed lines represent the switch of solution from adsorption to desorption process with acetate buffer, Figure S5. Comparison of the adsorbed amount ΓSPR (ng/cm2) at equilibrium on gold substrate of A. senegal gum at pH 5.0 in function of salt concentration after adsorption and desorption (washed with buffer solution), Figure S6. Adsorption isotherms of A. seyal gum on gold substrate presented as (a) frequency change (ΔF) and (b) dissipation energy loss (ΔD) in function of pH (3.0, 5.0 and 7.0) and a constant salt concentration of 10 mM acetate buffer, Figure S7. Adsorption kinetics of A. seyal gum at 500 ppm 10 mM acetate buffer on gold substrate in function of pH: (a) frequency change (ΔF) and (b) dissipation energy loss (ΔD). Dashed lines represent the switch of solution from adsorption to desorption process with acetate buffer, Figure S8. Adsorption isotherms of A. seyal gum on gold substrate presented as (a) frequency change (ΔF) and (b) dissipation energy loss (ΔD) with two salt concentrations: 10 and 100 mM at pH 5.0, Figure S9. Adsorption of A. seyal gum at 500 ppm on gold at pH 5.0: (a) frequency change (ΔF) and (b) dissipation energy loss (ΔD) for 1, 10 and 100 mM acetate buffer. Dash lines represent the switch of solution from adsorption to desorption process with acetate buffer, Figure S10. AFM topography images of Acacia senegal and Acacia seyal gums dry adsorbed layers on solid substrates at 1 × 1 µm, Figure S11. AFM topography images and height distributions of Acacia senegal and Acacia seyal gums dry adsorbed layers on solid substrates at 5 x 5 µm, Figure S12. Hydration degree (ΓH2O, %) of A. senegal and A. seyal gum films in function of pH (a) and salt concentration at pH 5.0 (b), Figure S13. Viscoelastic properties derived from Sauerbrey equation of A. senegal and A. seyal films in function of pH (a) and salt concentration (b).

Author Contributions

A.D. contributed by designing, performing the experiments, analyzing data and writing the paper. M.N., C.S. and D.R. contributed by analyzing data and writing the paper. A.D. contributed by performing the AFM experiments and analyzing data.

Funding

This work was financially supported by the Alland and Robert Company.

Acknowledgments

Authors would like to thank Ana Vilares and Céline Moreau for fruitful QCM-D technical assistance and Nathalie Geneix for technical assistance on SPR measurements.

Conflicts of Interest

The authors declare no conflict of interest.

References

  1. Sanchez, C.; Nigen, M.; Mejia Tamayo, V.; Doco, T.; Williams, P.; Amine, C.; Renard, D. Acacia gum: History of the future. Food Hydrocoll. 2018, 78, 140–160. [Google Scholar] [CrossRef]
  2. Verbeken, D.; Dierckx, S.; Dewettinck, K. Exudate gums: Occurrence, production, and applications. Appl. Microbiol. Biotechnol. 2003, 63, 10–21. [Google Scholar] [CrossRef]
  3. Nussinovitch, A. Plant Gum Exudates of the World: Sources, Distribution, Properties, and Applications; CRC Press: Boca Raton, FL, USA, 2009; ISBN 978−1-4200-5224-4. [Google Scholar]
  4. Randall, R.C.; Phillips, G.O.; Williams, P.A. Fractionation and characterization of gum from Acacia senegal. Food Hydrocoll. 1989, 3, 65–75. [Google Scholar] [CrossRef]
  5. Renard, D.; Lavenant-Gourgeon, L.; Ralet, M.-C.; Sanchez, C. Acacia senegal Gum:  Continuum of Molecular Species Differing by Their Protein to Sugar Ratio, Molecular Weight, and Charges. Biomacromolecules 2006, 7, 2637–2649. [Google Scholar] [CrossRef] [PubMed]
  6. Lopez-Torrez, L.; Nigen, M.; Williams, P.; Doco, T.; Sanchez, C. Acacia senegal vs. Acacia seyal gums—Part 1: Composition and structure of hyperbranched plant exudates. Food Hydrocoll. 2015, 51, 41–53. [Google Scholar] [CrossRef]
  7. Mejia Tamayo, V.; Nigen, M.; Apolinar-Valiente, R.; Doco, T.; Williams, P.; Renard, D.; Sanchez, C. Flexibility and Hydration of Amphiphilic Hyperbranched Arabinogalactan-Protein from Plant Exudate: A Volumetric Perspective. Colloids Interfaces 2018, 2, 11. [Google Scholar] [CrossRef]
  8. Al-Assaf, S.; Andres-Brull, M.; Cirre, J.; Phillips, G.O. Structural Changes Following Industrial Processing of Acacia Gums. In Gum Arabic; RSC Publishing: Cambridge, UK, 2011; pp. 153–168. [Google Scholar]
  9. Adamson, A.W.; Gast, A.P. Physical Chemistry of Surfaces, 6th ed.; Wiley-Blackwell: New York, NY, USA, 1997; ISBN 978-0-471−14873-9. [Google Scholar]
  10. Redgwell, R.J.; Schmitt, C.; Beaulieu, M.; Curti, D. Hydrocolloids from coffee: Physicochemical and functional properties of an arabinogalactan-protein fraction from green beans. Food Hydrocoll. 2005, 19, 1005–1015. [Google Scholar] [CrossRef]
  11. Amiri, A.; Shanbedi, M.; Eshghi, H.; Heris, S.Z.; Baniadam, M. Highly Dispersed Multiwalled Carbon Nanotubes Decorated with Ag Nanoparticles in Water and Experimental Investigation of the Thermophysical Properties. J. Phys. Chem. C 2012, 116, 3369–2275. [Google Scholar] [CrossRef]
  12. Bandyopadhyaya, R.; Nativ-Roth, E.; Regev, O.; Yerushalmi-Rozen, R. Stabilization of Individual Carbon Nanotubes in Aqueous Solutions. Nano Lett. 2002, 2, 25–28. [Google Scholar] [CrossRef]
  13. Dror, Y.; Pyckhout-Hintzen, W.; Cohen, Y. Conformation of Polymers Dispersing Single-Walled Carbon Nanotubes in Water: A Small-Angle Neutron Scattering Study. Macromolecules 2005, 38, 7828–7836. [Google Scholar] [CrossRef]
  14. Edri, E.; Regev, O. Cryo-staining techniques in cryo-TEM studies of dispersed nanotubes. Ultramicroscopy 2010, 110, 751–757. [Google Scholar] [CrossRef]
  15. Kim, M.T.; Park, H.S.; Hui, D.; Rhee, K.Y. Carbon Nanotube Modification Using Gum Arabic and Its Effect on the Dispersion and Tensile Properties of Carbon Nanotubes/Epoxy Nanocomposites. J. Nanosci. Nanotechnol. 2011, 11, 7369–7373. [Google Scholar] [CrossRef]
  16. Krishna Kumar, M.; Leela Mohana Reddy, A.; Ramaprabhu, S. Exfoliated single-walled carbon nanotube-based hydrogen sensor. Sens. Actuators B Chem. 2008, 130, 653–660. [Google Scholar] [CrossRef]
  17. Najeeb, C.K.; Lee, J.-H.; Chang, J.; Kim, J.-H. The effect of surface modifications of carbon nanotubes on the electrical properties of inkjet-printed SWNT/PEDOT–PSS composite line patterns. Nanotechnology 2010, 21, 385302. [Google Scholar] [CrossRef] [PubMed]
  18. Batalha, I.L.; Hussain, A.; Roque, A.C.A. Gum Arabic coated magnetic nanoparticles with affinity ligands specific for antibodies. J. Mol. Recognit. 2010, 23, 462–471. [Google Scholar] [CrossRef] [PubMed]
  19. Gils, P.S.; Ray, D.; Sahoo, P.K. Designing of silver nanoparticles in gum arabic based semi-IPN hydrogel. Int. J. Biol. Macromol. 2010, 46, 237–244. [Google Scholar] [CrossRef]
  20. Kannan, R.; Zambre, A.; Chanda, N.; Kulkarni, R.; Shukla, R.; Katti, K.; Upendran, A.; Cutler, C.; Boote, E.; Katti, K.V. Functionalized radioactive gold nanoparticles in tumor therapy. Wiley Interdiscip. Rev. Nanomed. Nanobiotechnol. 2012, 4, 42–51. [Google Scholar] [CrossRef]
  21. Kattumuri, V.; Katti, K.; Bhaskaran, S.; Boote, E.J.; Casteel, S.W.; Fent, G.M.; Robertson, D.J.; Chandrasekhar, M.; Kannan, R.; Katti, K.V. Gum arabic as a phytochemical construct for the stabilization of gold nanoparticles: In vivo pharmacokinetics and X-ray-contrast-imaging studies. Small Weinh. Bergstr. Ger. 2007, 3, 333–341. [Google Scholar] [CrossRef] [PubMed]
  22. Ma, R.; Levard, C.; Marinakos, S.M.; Cheng, Y.; Liu, J.; Michel, F.M.; Brown, G.E.; Lowry, G.V. Size-controlled dissolution of organic-coated silver nanoparticles. Environ. Sci. Technol. 2012, 46, 752–759. [Google Scholar] [CrossRef]
  23. Roque, A.C.A.; Wilson, O.C. Adsorption of gum Arabic on bioceramic nanoparticles. Mater. Sci. Eng. C 2008, 28, 443–447. [Google Scholar] [CrossRef]
  24. Song, J.E.; Phenrat, T.; Marinakos, S.; Xiao, Y.; Liu, J.; Wiesner, M.R.; Tilton, R.D.; Lowry, G.V. Hydrophobic interactions increase attachment of gum Arabic- and PVP-coated Ag nanoparticles to hydrophobic surfaces. Environ. Sci. Technol. 2011, 45, 5988–5995. [Google Scholar] [CrossRef]
  25. Balantrapu, K.; Goia, D.V. Silver nanoparticles for printable electronics and biological applications. J. Mater. Res. 2009, 24, 2828–2836. [Google Scholar] [CrossRef]
  26. Song, J.K.; Choi, H.J.; Chin, I. Preparation and properties of electrophoretic microcapsules for electronic paper. J. Microencapsul. 2007, 24, 11–19. [Google Scholar] [CrossRef] [PubMed]
  27. Wang, D.W.; Zhao, X.P. Microencapsulated electric ink using gelatin/gum arabic. J. Microencapsul. 2009, 26, 37–45. [Google Scholar] [CrossRef]
  28. Gashua, I.B.; Williams, P.A.; Baldwin, T.C. Molecular characteristics, association and interfacial properties of gum Arabic harvested from both Acacia senegal and Acacia seyal. Food Hydrocoll. 2016, 61, 514–522. [Google Scholar] [CrossRef]
  29. Snowden, M.J.; Phillips, G.O.; Williams, P.A. Functional characteristics of gum arabic. Food Hydrocoll. 1987, 1, 291–300. [Google Scholar] [CrossRef]
  30. Nishino, M.; Katayama, T.; Sakata, M.; Al-Assaf, S.; Phillips, G.O. Effect of AGP on Emulsifying Stability of Gum Arabic. In Gum Arabic; RSC Publishing: Cambridge, UK, 2011; pp. 269–274. [Google Scholar]
  31. Al-Assaf, S.; Phillips, G.O.; Aoki, H.; Sasaki, Y. Characterization and properties of Acacia senegal (L.) Willd. var. senegal with enhanced properties (Acacia (sen) SUPER GUMTM): Part 1—Controlled maturation of Acacia senegal var. senegal to increase viscoelasticity, produce a hydrogel form and convert a poor into a good emulsifier. Food Hydrocoll. 2007, 21, 319–328. [Google Scholar]
  32. Aoki, H.; Al-Assaf, S.; Katayama, T.; Phillips, G.O. Characterization and properties of Acacia senegal (L.) Willd. var. senegal with enhanced properties (Acacia (sen) SUPER GUMTM): Part 2—Mechanism of the maturation process. Food Hydrocoll. 2007, 21, 329–337. [Google Scholar] [CrossRef]
  33. Aoki, H.; Katayama, T.; Ogasawara, T.; Sasaki, Y.; Al-Assaf, S.; Phillips, G.O. Characterization and properties of Acacia senegal (L.) Willd. var. Senegal with enhanced properties (Acacia (sen) SUPER GUMTM): Part 5. Factors affecting the emulsification of Acacia senegal and Acacia (sen) SUPER GUMTM. Food Hydrocoll. 2007, 21, 353–358. [Google Scholar] [CrossRef]
  34. Jachimska, B.; Świątek, S.; Loch, J.I.; Lewiński, K.; Luxbacher, T. Adsorption effectiveness of β-lactoglobulin onto gold surface determined by quartz crystal microbalance. Bioelectrochemistry 2018, 121, 95–104. [Google Scholar] [CrossRef]
  35. Jachimska, B.; Łapczyńska, M.; Zapotoczny, S. Reversible Swelling Process of Sixth-Generation Poly(amido amine) Dendrimers Molecule As Determined by Quartz Crystal Microbalance Technique. J. Phys. Chem. C 2013, 117, 1136–1145. [Google Scholar] [CrossRef]
  36. Jachimska, B.; Tokarczyk, K. Combining Surface Plasmon Resonance and Quartz Crystal Microbalance to Determine Hydration of Dendrimer Monolayers. J. Phys. Chem. C 2016, 120, 19678–19685. [Google Scholar] [CrossRef]
  37. Orelma, H.; Filpponen, I.; Johansson, L.-S.; Laine, J.; Rojas, O.J. Modification of Cellulose Films by Adsorption of CMC and Chitosan for Controlled Attachment of Biomolecules. Biomacromolecules 2011, 12, 4311–4318. [Google Scholar] [CrossRef] [PubMed]
  38. Choi, J.-H.; Kim, S.-O.; Linardy, E.; Dreaden, E.C.; Zhdanov, V.P.; Hammond, P.T.; Cho, N.-J. Adsorption of hyaluronic acid on solid supports: Role of pH and surface chemistry in thin film self-assembly. J. Colloid Interface Sci. 2015, 448, 197–207. [Google Scholar] [CrossRef] [PubMed]
  39. Sedeva, I.G.; Fornasiero, D.; Ralston, J.; Beattie, D.A. Reduction of Surface Hydrophobicity Using a Stimulus-Responsive Polysaccharide. Langmuir 2010, 26, 15865–15874. [Google Scholar] [CrossRef] [PubMed]
  40. Tokarczyk, K.; Jachimska, B. Quantitative interpretation of PAMAM dendrimers adsorption on silica surface. J. Colloid Interface Sci. 2017, 503, 86–94. [Google Scholar] [CrossRef] [PubMed]
  41. Stokes, J.R.; Macakova, L.; Chojnicka-Paszun, A.; de Kruif, C.G.; de Jongh, H.H.J. Lubrication, Adsorption, and Rheology of Aqueous Polysaccharide Solutions. Langmuir 2011, 27, 3474–3484. [Google Scholar] [CrossRef] [PubMed]
  42. Malmström, J.; Agheli, H.; Kingshott, P.; Sutherland, D.S. Viscoelastic Modeling of Highly Hydrated Laminin Layers at Homogeneous and Nanostructured Surfaces:  Quantification of Protein Layer Properties Using QCM-D and SPR. Langmuir 2007, 23, 9760–9768. [Google Scholar] [CrossRef] [PubMed]
  43. Hoypierres, J.; Dulong, V.; Rihouey, C.; Alexandre, S.; Picton, L.; Thébault, P. Two Methods for One-Point Anchoring of a Linear Polysaccharide on a Gold Surface. Langmuir 2015, 31, 254–261. [Google Scholar] [CrossRef]
  44. Mohan, T.; Rathner, R.; Reishofer, D.; Koller, M.; Elschner, T.; Spirk, S.; Heinze, T.; Stana-Kleinschek, K.; Kargl, R. Designing Hydrophobically Modified Polysaccharide Derivatives for Highly Efficient Enzyme Immobilization. Biomacromolecules 2015, 16, 2403–2411. [Google Scholar] [CrossRef]
  45. Villares, A.; Moreau, C.; Dammak, A.; Capron, I.; Cathala, B. Kinetic aspects of the adsorption of xyloglucan onto cellulose nanocrystals. Soft Matter. 2015, 11, 6472–6481. [Google Scholar] [CrossRef] [PubMed]
  46. Bano, F.; Carril, M.; Di Gianvincenzo, P.; Richter, R.P. Interaction of Hyaluronan with Cationic Nanoparticles. Langmuir 2015, 31, 8411–8420. [Google Scholar] [CrossRef]
  47. Apolinar-Valiente, R.; Williams, P.; Nigen, M.; Tamayo, V.M.; Doco, T.; Sanchez, C. Recovery, structure and physicochemical properties of an aggregate-rich fraction from Acacia senegal gum. Food Hydrocoll. 2018, 89, 864–873. [Google Scholar] [CrossRef]
  48. Höök, F.; Rodahl, M.; Brzezinski, P.; Kasemo, B. Energy Dissipation Kinetics for Protein and Antibody−Antigen Adsorption under Shear Oscillation on a Quartz Crystal Microbalance. Langmuir 1998, 14, 729–734. [Google Scholar] [CrossRef]
  49. Rodahl, M.; Höök, F.; Krozer, A.; Brzezinski, P.; Kasemo, B. Quartz crystal microbalance setup for frequency and Q-factor measurements in gaseous and liquid environments. Rev. Sci. Instrum. 1995, 66, 3924–3930. [Google Scholar] [CrossRef]
  50. Sauerbrey, G. Verwendung von Schwingquarzen zur Wägung dünner Schichten und zur Mikrowägung. Z. Für Phys. 1959, 155, 206–222. [Google Scholar] [CrossRef]
  51. Saftics, A.; Prósz, G.A.; Türk, B.; Peter, B.; Kurunczi, S.; Horvath, R. In situ viscoelastic properties and chain conformations of heavily hydrated carboxymethyl dextran layers: A comparative study using OWLS and QCM-I chips coated with waveguide material. Sci. Rep. 2018, 8, 11840. [Google Scholar] [CrossRef]
  52. Voinova, M.V.; Rodahl, M.; Jonson, M.; Kasemo, B. Viscoelastic Acoustic Response of Layered Polymer Films at Fluid-Solid Interfaces: Continuum Mechanics Approach. Phys. Scr. 1999, 59, 391. [Google Scholar] [CrossRef]
  53. Höök, F.; Kasemo, B.; Nylander, T.; Fant, C.; Sott, K.; Elwing, H. Variations in Coupled Water, Viscoelastic Properties, and Film Thickness of a Mefp−1 Protein Film during Adsorption and Cross-Linking:  A Quartz Crystal Microbalance with Dissipation Monitoring, Ellipsometry, and Surface Plasmon Resonance Study. Anal. Chem. 2001, 73, 5796–5804. [Google Scholar] [CrossRef]
  54. Reviakine, I.; Johannsmann, D.; Richter, R.P. Hearing What You Cannot See and Visualizing What You Hear: Interpreting Quartz Crystal Microbalance Data from Solvated Interfaces. Anal. Chem. 2011, 83, 8838–8848. [Google Scholar] [CrossRef]
  55. Jung, L.S.; Campbell, C.T.; Chinowsky, T.M.; Mar, M.N.; Yee, S.S. Quantitative interpretation of the response of surface plasmon resonance sensors to adsorbed films. Langmuir 1998, 14, 5636–5648. [Google Scholar] [CrossRef]
  56. Stenberg, E.; Persson, B.; Roos, H.; Urbaniczky, C. Quantitative Determination of Surface Concentration of Protein with Surface Plasmon Resonance Using Radiolabeled Proteins. J. Colloid Interface Sci. 1991, 143, 513–526. [Google Scholar] [CrossRef]
  57. Lopez Torrez, D.L. Characterisation of Acacia Gums (A. senegal and A. seyal) and Development of Heat-Induced Acacia Gum/Potato Protein Microparticles; Montpellier SupAgro: Montpellier, France, 2017. [Google Scholar]
  58. Jayme, M.L.; Dunstan, D.E.; Gee, M.L. Zeta potentials of gum arabic stabilised oil in water emulsions. Food Hydrocoll. 1999, 13, 459–465. [Google Scholar] [CrossRef]
  59. Schrems, A.; Kibrom, A.; Küpcü, S.; Kiene, E.; Sleytr, U.B.; Schuster, B. Bilayer Lipid Membrane Formation on a Chemically Modified S-Layer Lattice. Langmuir 2011, 27, 3731–3738. [Google Scholar] [CrossRef] [PubMed]
  60. Grein-Iankovski, A.; Ferreira, J.G.L.; Orth, E.S.; Sierakowski, M.-R.; Cardoso, M.B.; Simas, F.F.; Riegel-Vidotti, I.C. A comprehensive study of the relation between structural and physical chemical properties of acacia gums. Food Hydrocoll. 2018, 85, 167–175. [Google Scholar] [CrossRef]
  61. Ma, F.; Bell, A.E.; Davis, F.J. Effects of high-hydrostatic pressure and pH treatments on the emulsification properties of gum arabic. Food Chem. 2015, 184, 114–121. [Google Scholar] [CrossRef]
Figure 1. Adsorption isotherms of A. senegal gum on gold substrate presented as (a) frequency change (ΔF) and (b) dissipation energy loss (ΔD) for pH 3.0, 5.0, and 7.0 at a salt concentration of 10 mM acetate buffer. Time of adsorption between each concentration ranged from 30 to 60 min.
Colloids 03 00049 g001
Figure 2. Adsorption kinetics of A. senegal gum at 150 ppm in 10 mM acetate buffer on gold substrate as a function of pH: (a) frequency change (ΔF) and (b) dissipation energy loss (ΔD). Dashed lines represent the switch of the solution from the adsorption to desorption process with acetate buffer.
Colloids 03 00049 g002
Figure 3. Adsorption of A. senegal gum at 150 ppm in 10 mM acetate buffer on gold substrate as a function of the pH: (a) D-f third normalized overtone profiles upon adsorption and (b) comparison of the adsorbed amount (ΓQCM-D) onto the gold substrate at equilibrium after adsorption and desorption.
Colloids 03 00049 g003
Figure 4. (a) Surface Plasmon Resonance SPR sensorgram illustrating the immobilization of A. senegal and A. seyal gums at pH 5.0 and 10 mM acetate buffer on gold substrate. (b) Comparison of the adsorbed amount (ΓSPR) of A. senegal gum on the gold substrate at equilibrium after adsorption and desorption (washed with buffer solution) at pH 3.0, 5.0, and 7.0.
Colloids 03 00049 g004
Figure 5. Adsorption of A. senegal gum at 150 ppm on gold substrate at pH 5.0 as a function of the salt concentration: (a) D-f third normalized overtone profiles upon adsorption and (b) comparison of the adsorbed amount (ΓQCM-D) at equilibrium after adsorption and desorption (washed with buffer solution).
Colloids 03 00049 g005
Figure 6. Adsorption of A. seyal gum at 500 ppm on gold with 10 mM acetate buffer as a function of the pH: (a) D-f third normalized overtone profiles upon adsorption and (b) comparison of the adsorbed amount, ΓQCM-D (ng/cm2) and (c) ΓSPR (ng/cm2), of A. seyal gum at the gold substrate at equilibrium after adsorption and desorption (washed with the buffer solution). Time of adsorption approximately lasted 60 min between each data point.
Colloids 03 00049 g006
Figure 7. Adsorption of A. seyal gum at 500 ppm on gold at pH 5.0 as a function of the salt concentration: (a) D-f third normalized overtone profiles upon adsorption and (b) comparison of the adsorbed amount, ΓQCM-D (ng/cm2) and (c) ΓSPR (ng/cm2), of A. seyal gum on the gold substrate at equilibrium after adsorption and desorption (washed with the buffer solution).
Colloids 03 00049 g007
Figure 8. Atomic Force Microscopy AFM topography images of adsorbed layers on solid silicon substrates. Two surfaces are presented: A. senegal and A. seyal gums at C = 500 ppm pH 7.0 with 10 mM acetate. Three states of the surface are presented: (a) after 2 h of adsorption in the hydrated state, (b) dry surface (N2), and (c) the hydrated state after drying and rehydration. Yellow square: aggregate with a “spheroidal-like” morphology; yellow circle: aggregate with a “puddle-like” morphology.
Colloids 03 00049 g008
Figure 9. Comparison of the adsorbed mass amount of A. senegal and A. seyal gums on gold substrate obtained using QCM-D and SPR techniques: (a) as a function of the pH with a salt concentration of 10 mM acetate buffer and (b) as a function of the salt concentration with a constant pH 5.0.
Colloids 03 00049 g009
Figure 10. Scheme showing the electrostatic interactions and conformational changes as a function of the pH occurring when A. senegal gum adsorbed onto the gold substrate. Note that the hydrodynamic radii (Rh) changes as a function of the pH were experimentally demonstrated (data not shown).
Colloids 03 00049 g010
Table 1. Screening Debye length, κ−1, calculated as a function of the pH in acetate buffer 10 mM.
Ibuffer (M) 11.75 × 10−46.4 × 10−39.94 × 10⁻³
pH 3pH 5pH 7
κ (nm) 223.03.83.0
1 I b u f f e r = C t o t * 10 p H p K a 1 + 10 p H p K a with Ctot = 0.01 M and pKa = 4.75; 2 κ−1 = 0.304/I1/2

