Self-Assembly of the Bio-Surfactant Aescin in Solution: A Small-Angle X-ray Scattering and Fluorescence Study

 ,
,  , , , and
Abstract
:
1. Introduction
2. Experimental
2.1. Materials and Sample Preparation
2.2. Fluorescence Spectroscopy
2.3. Tensiometry
2.4. Transmission Electron Microscopy
2.5. Small-Angle X-ray Scattering
3. Results
3.1. Determination of the Critical Micelle Concentration of Aescin
3.1.1. Determination of by Fluorescence Spectroscopy
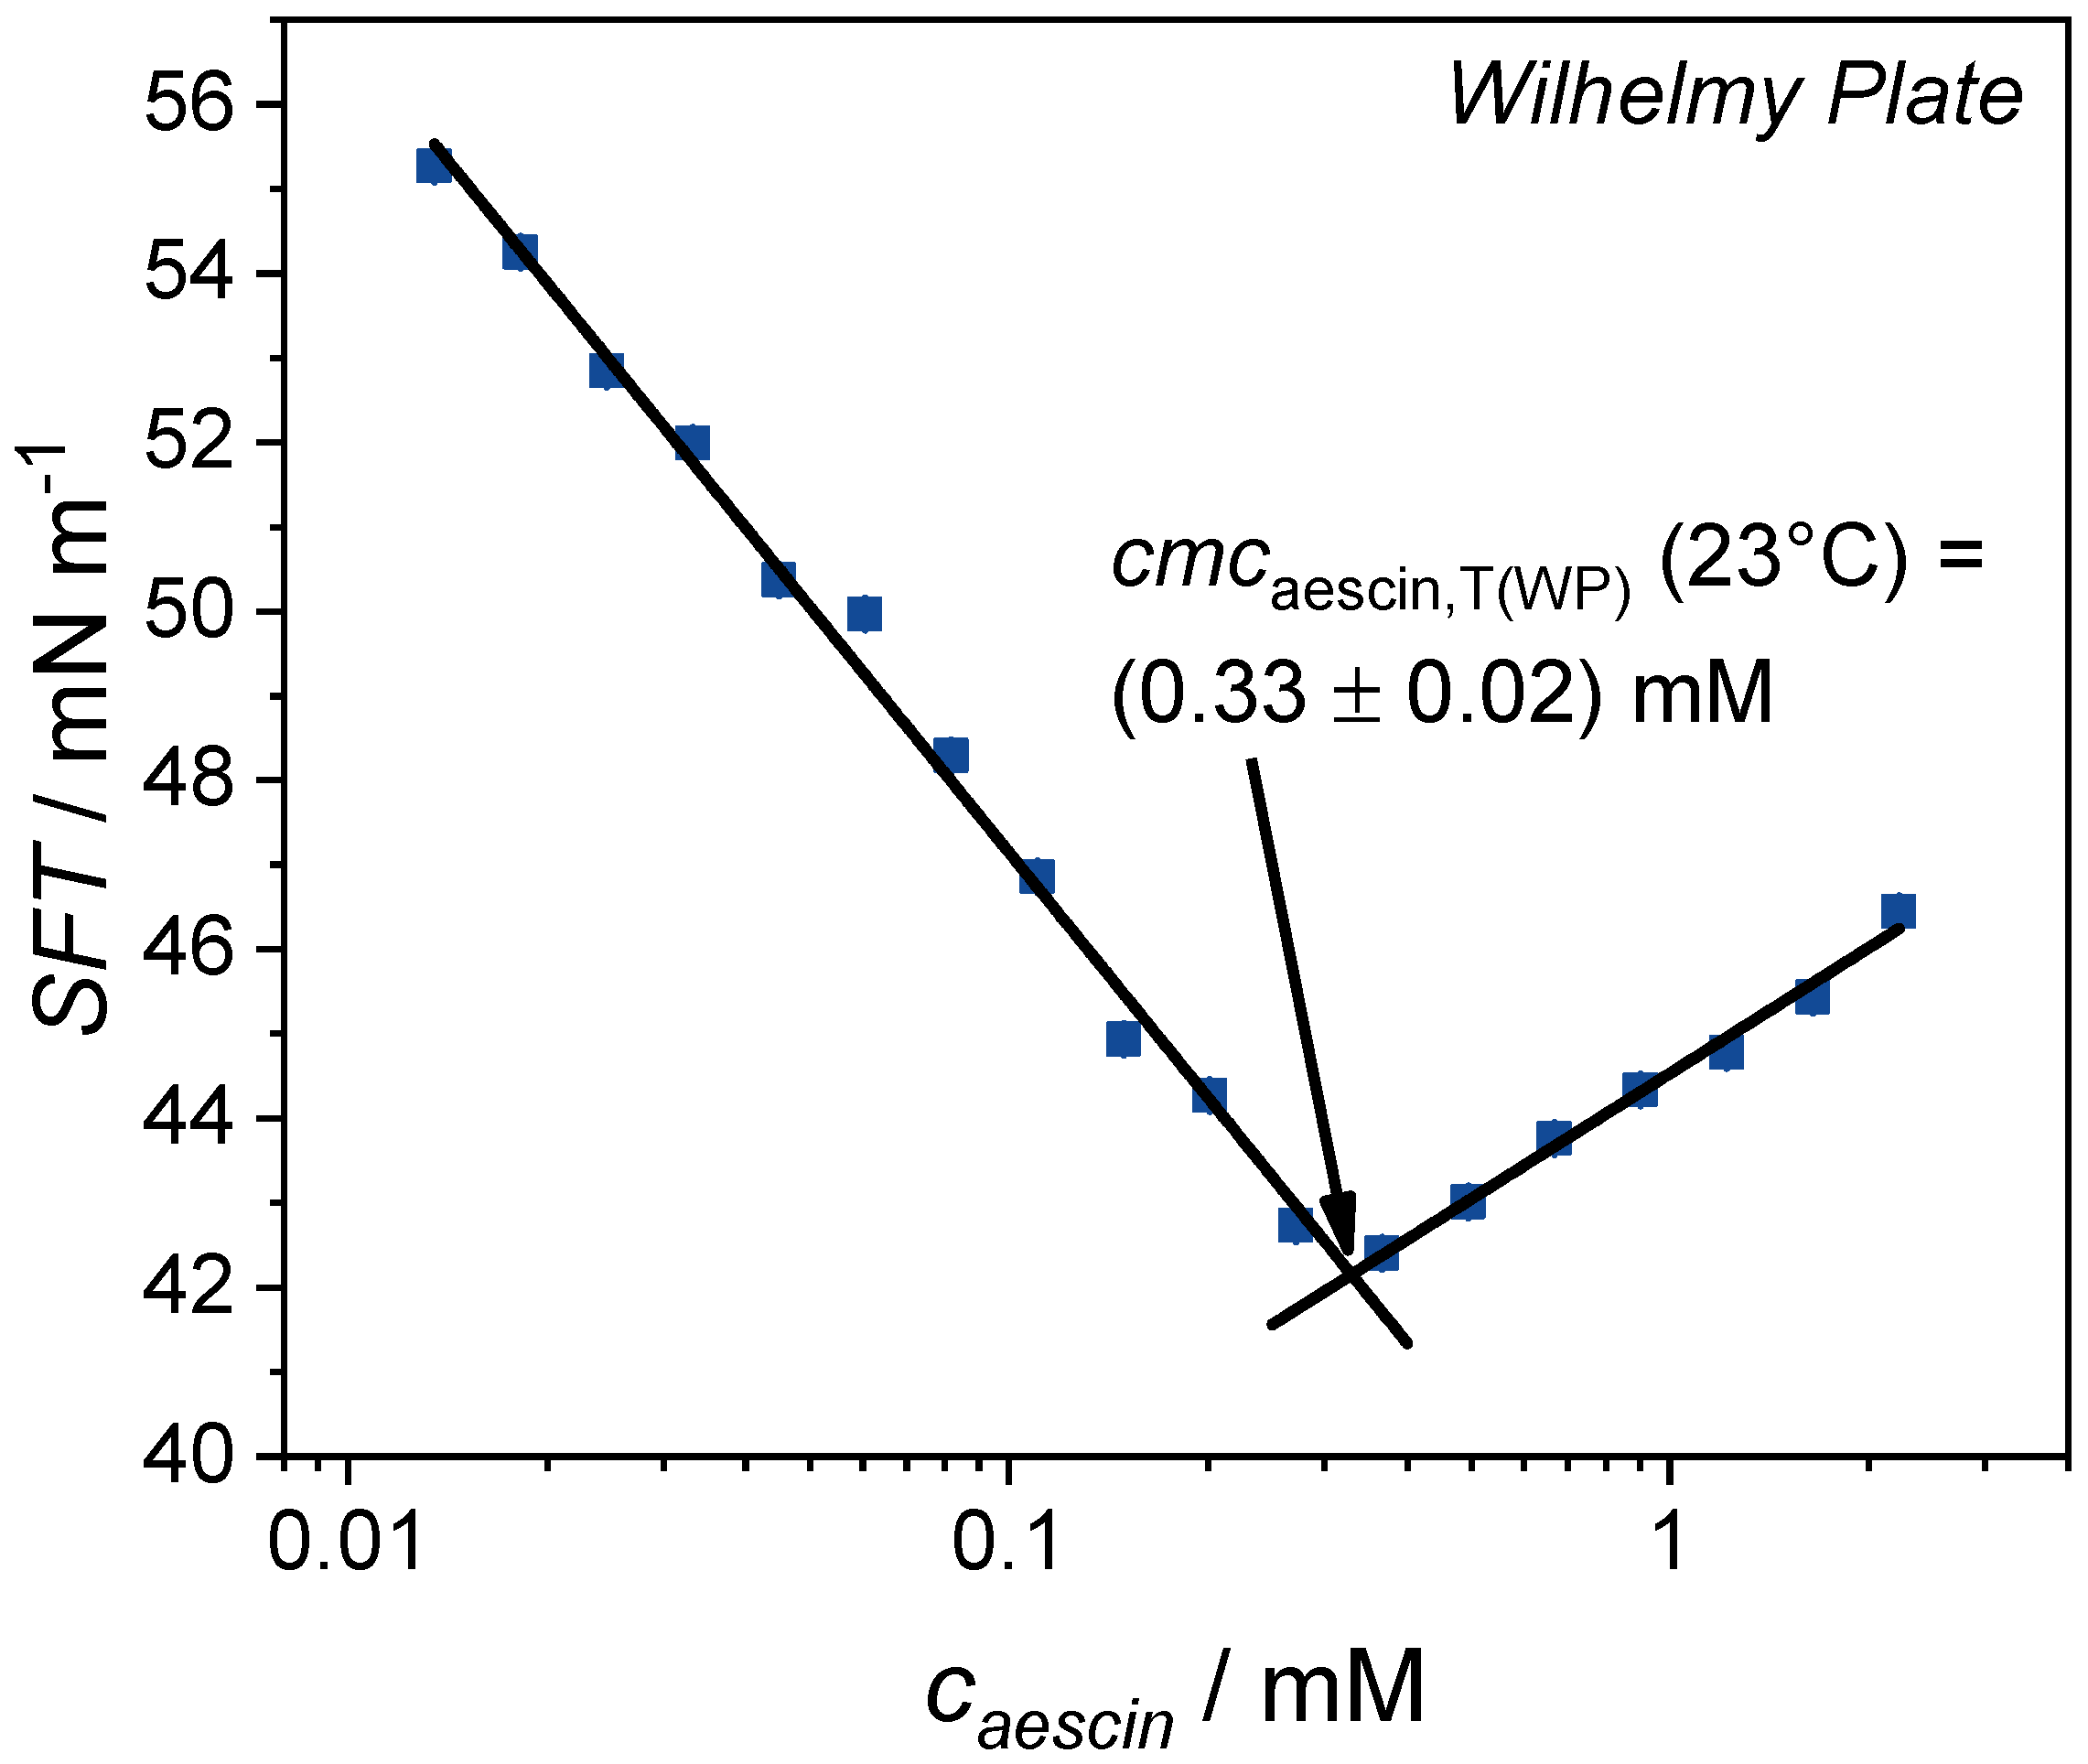
3.1.2. Determination of by Tensiometry
3.2. Structural Investigation of Aescin Micelles
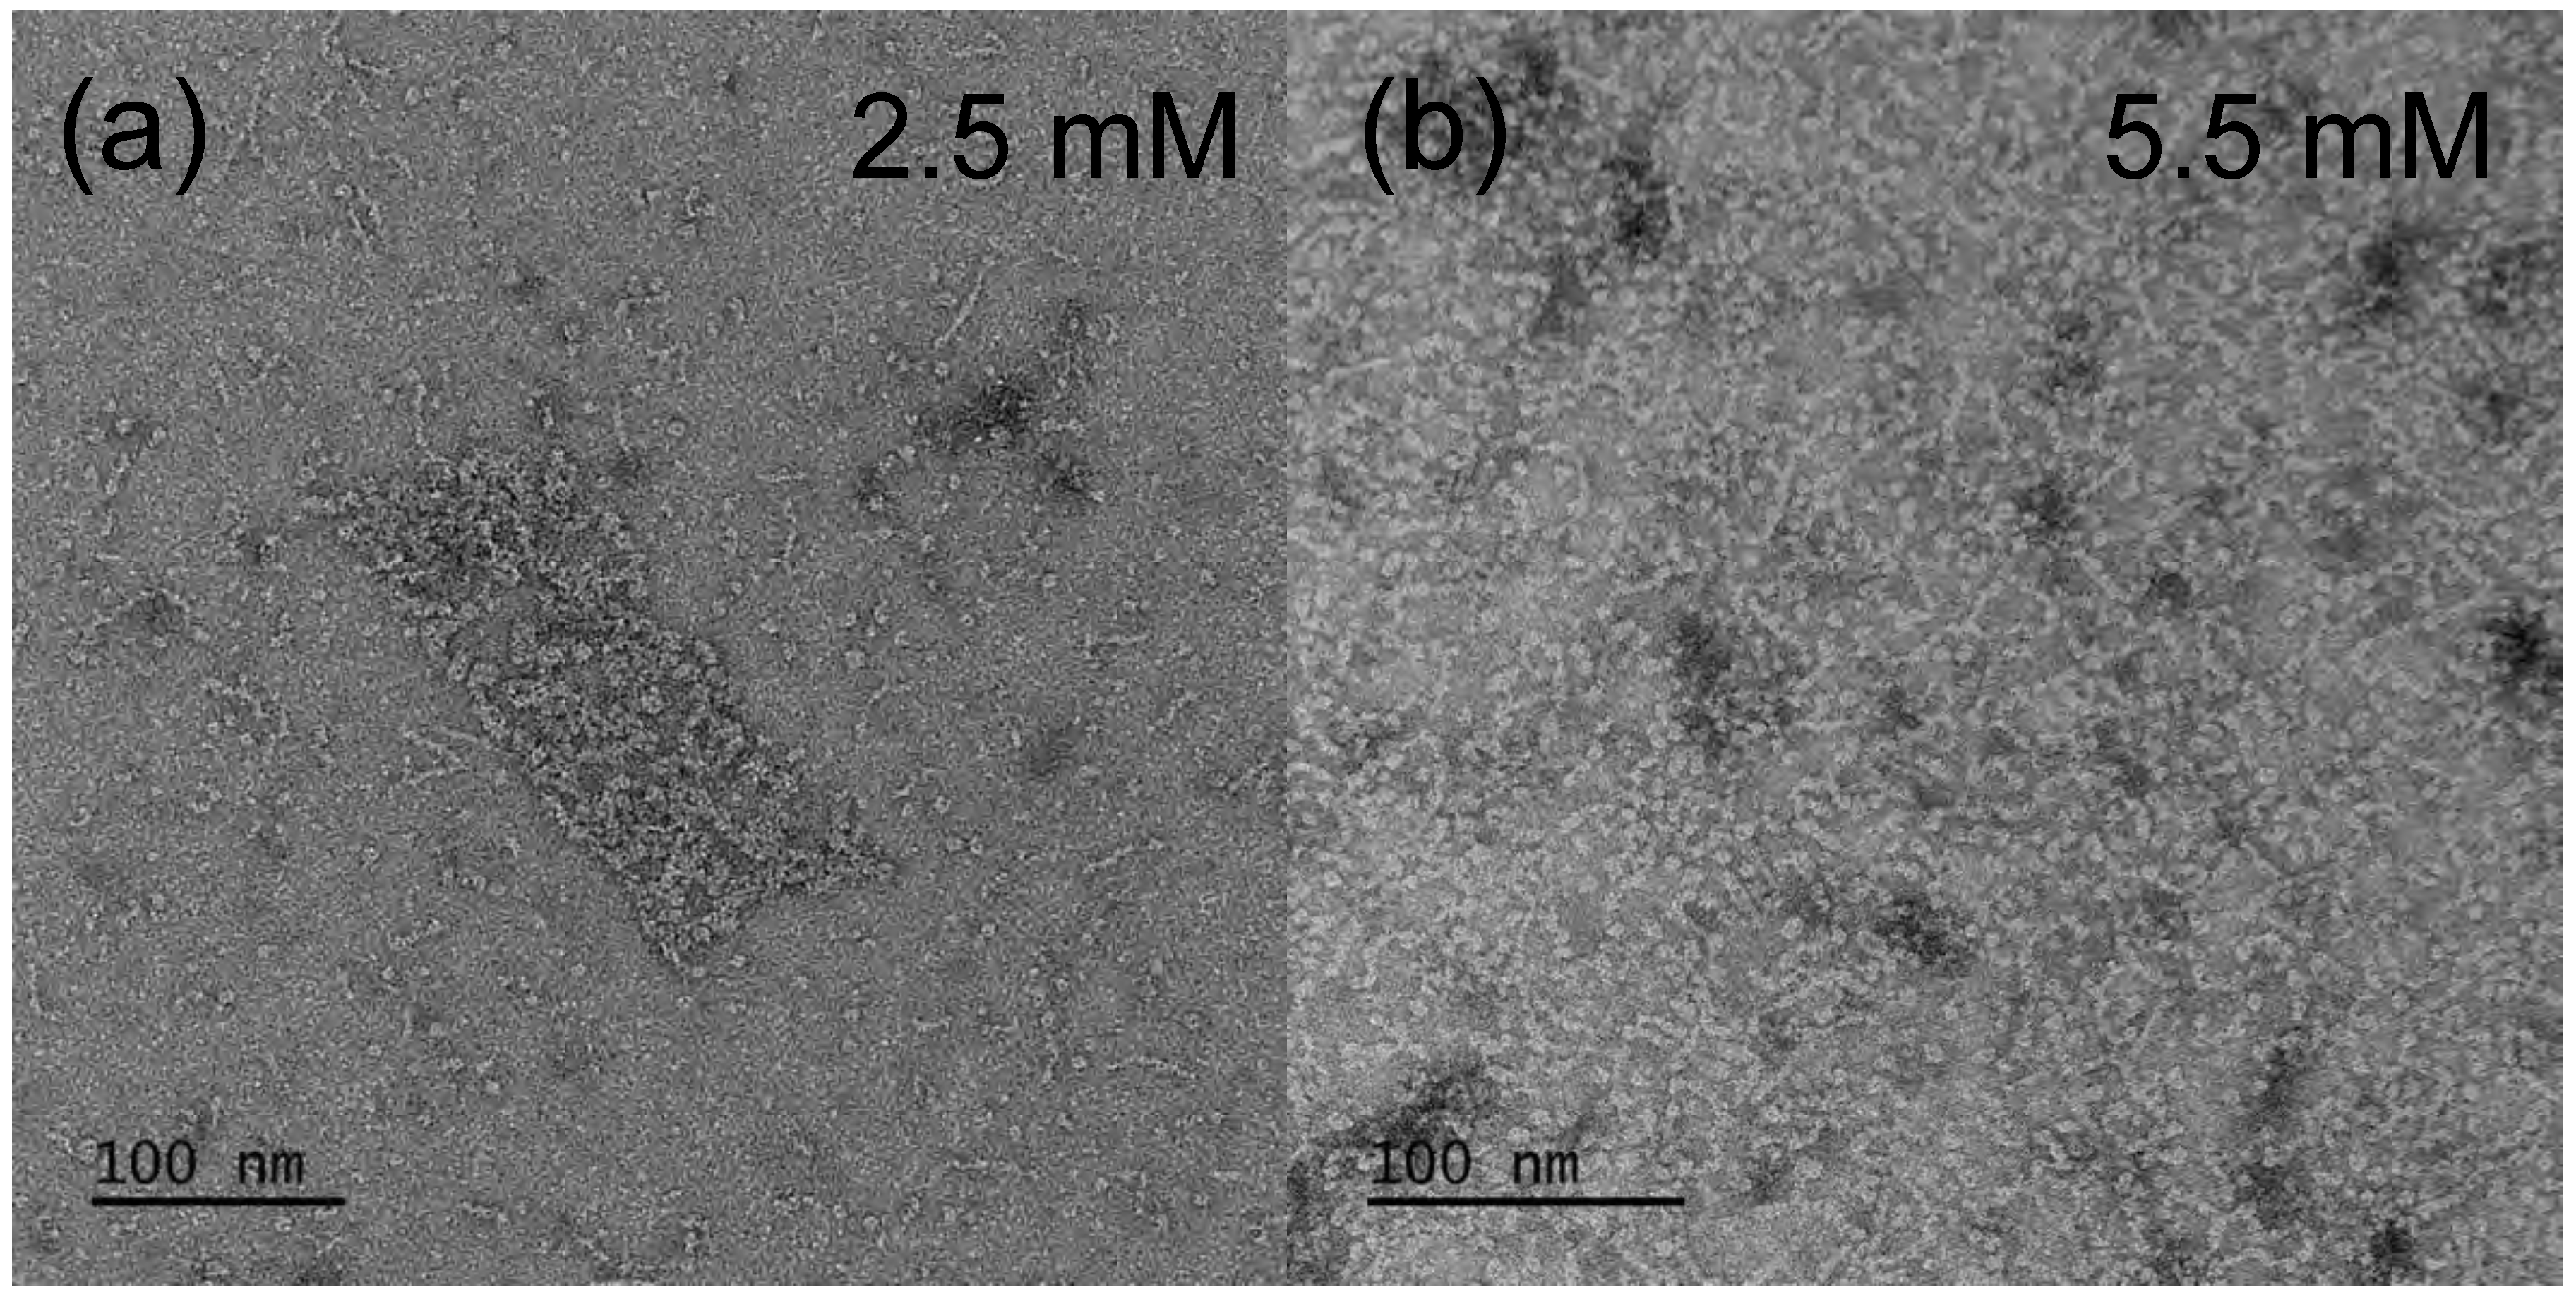
3.2.1. TEM—Aescin Micelle Structure at Low Temperature
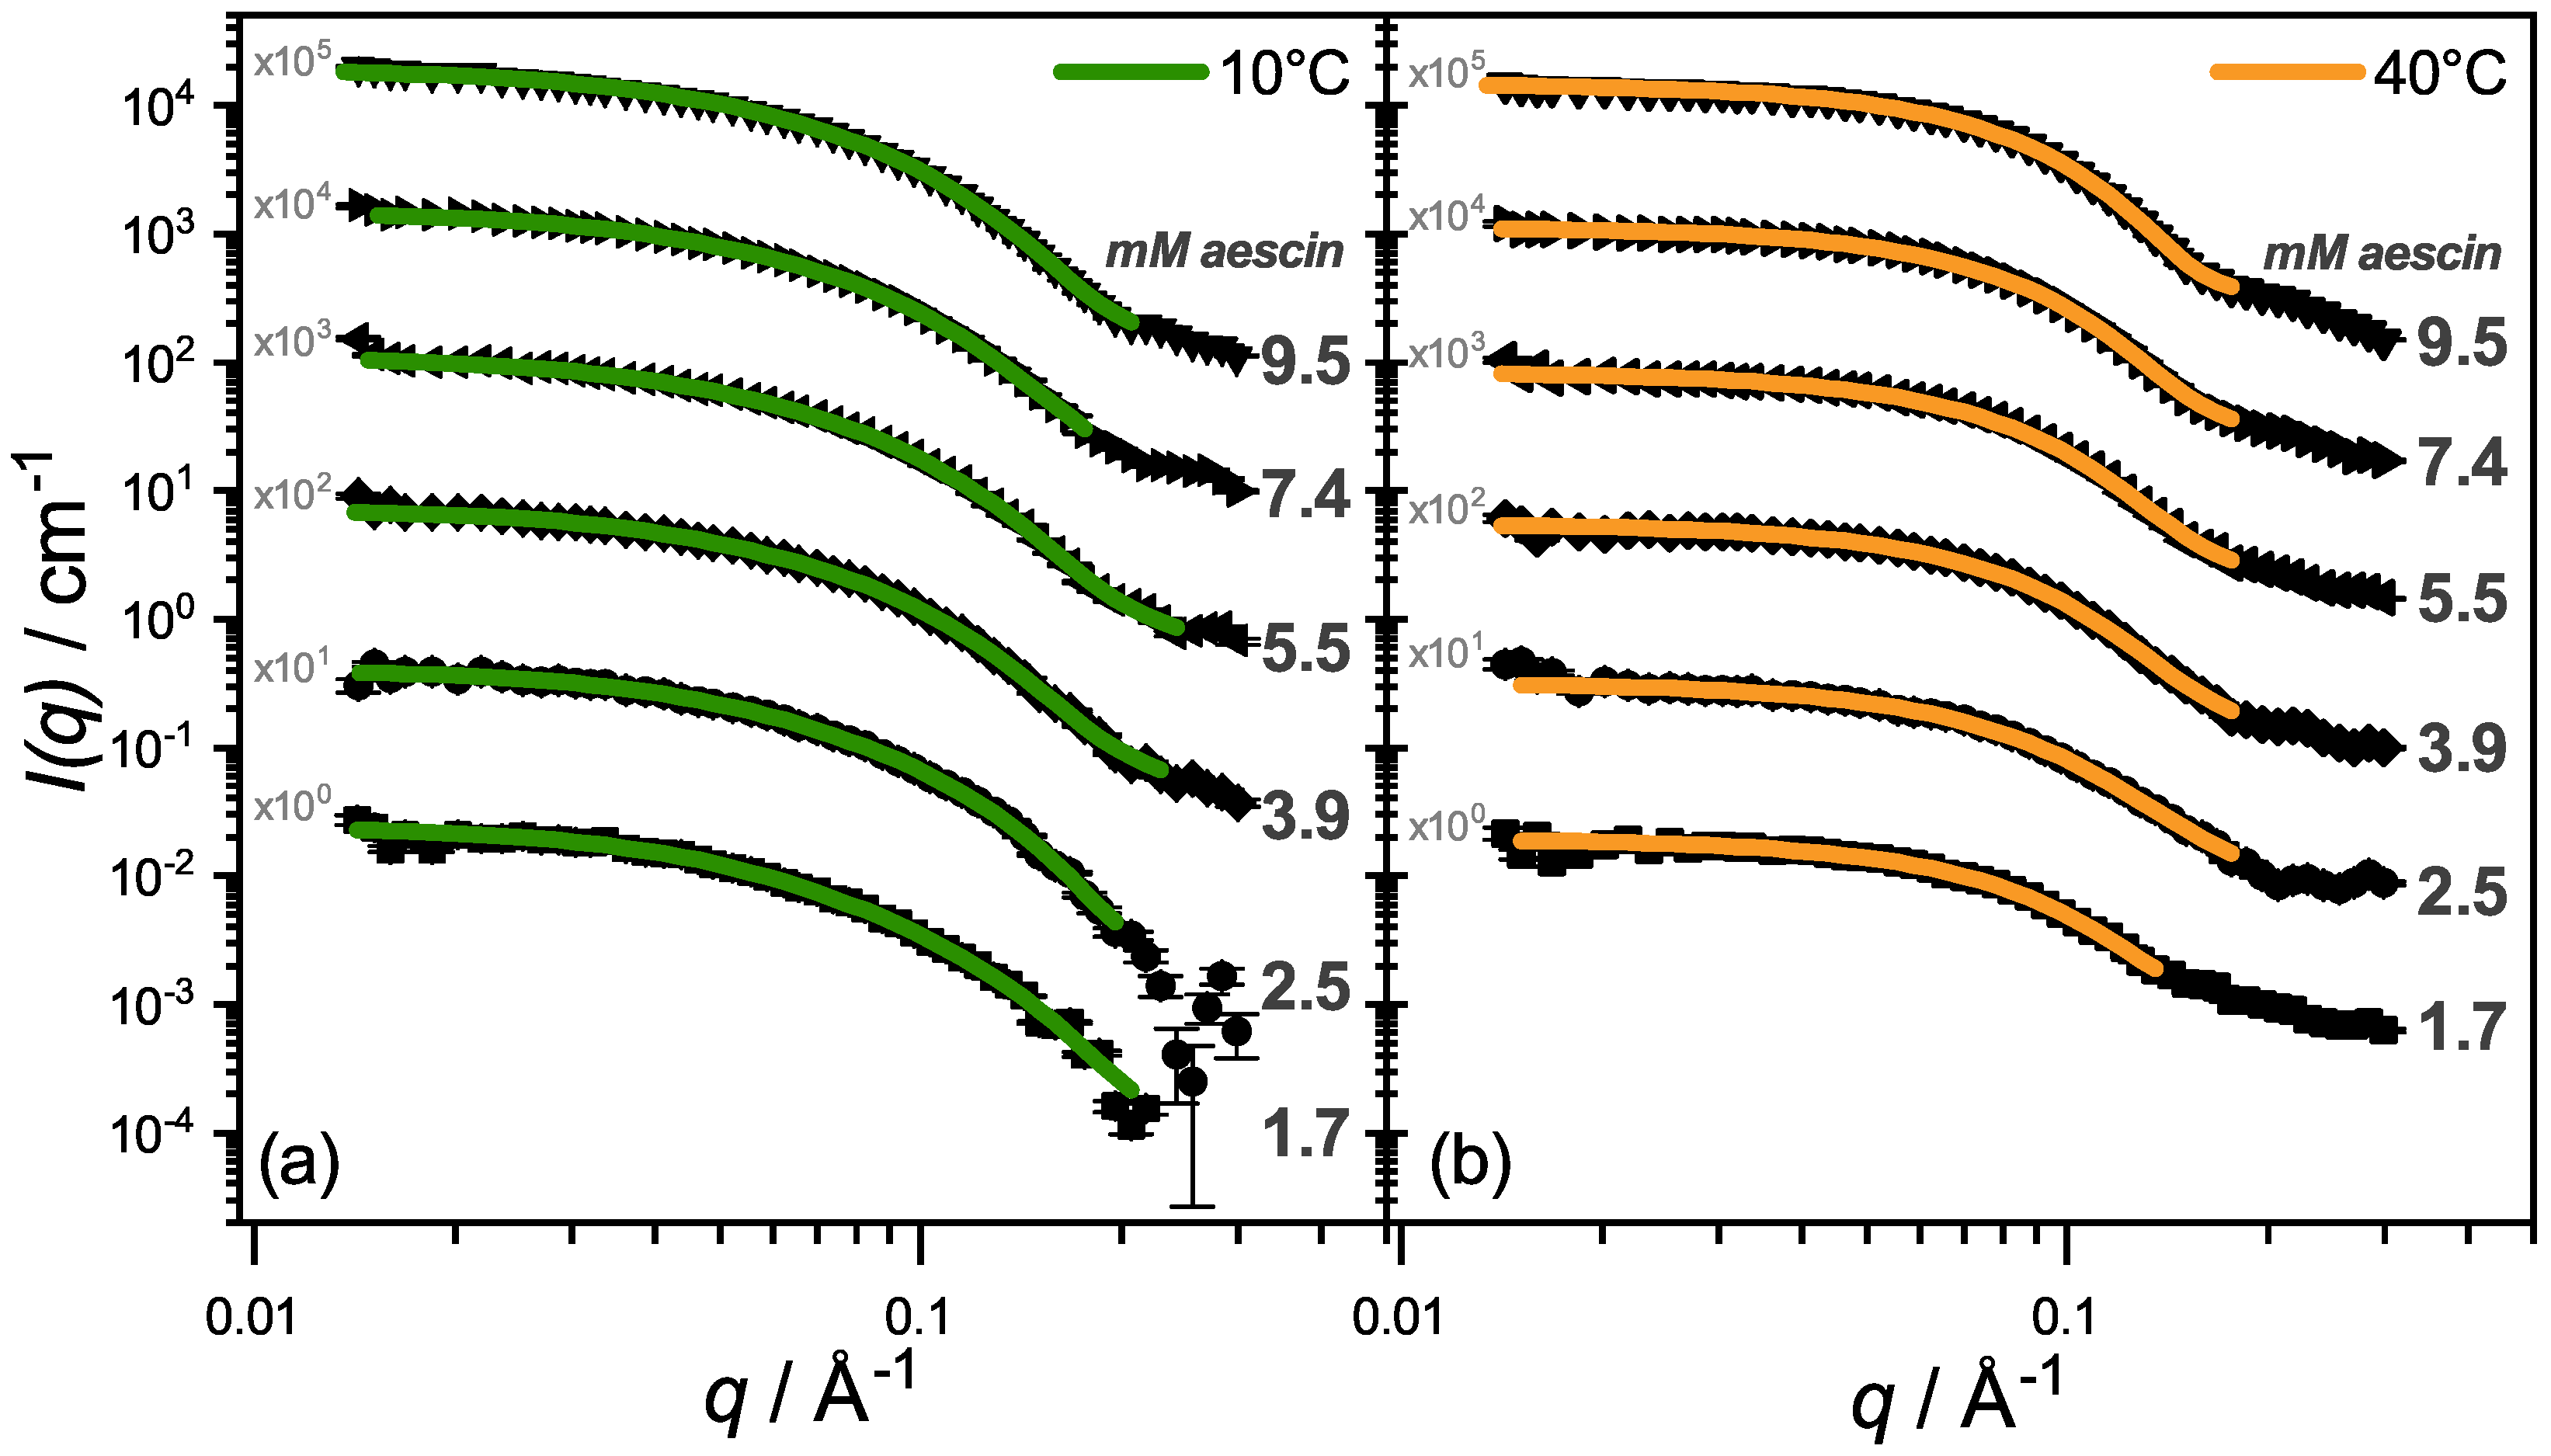
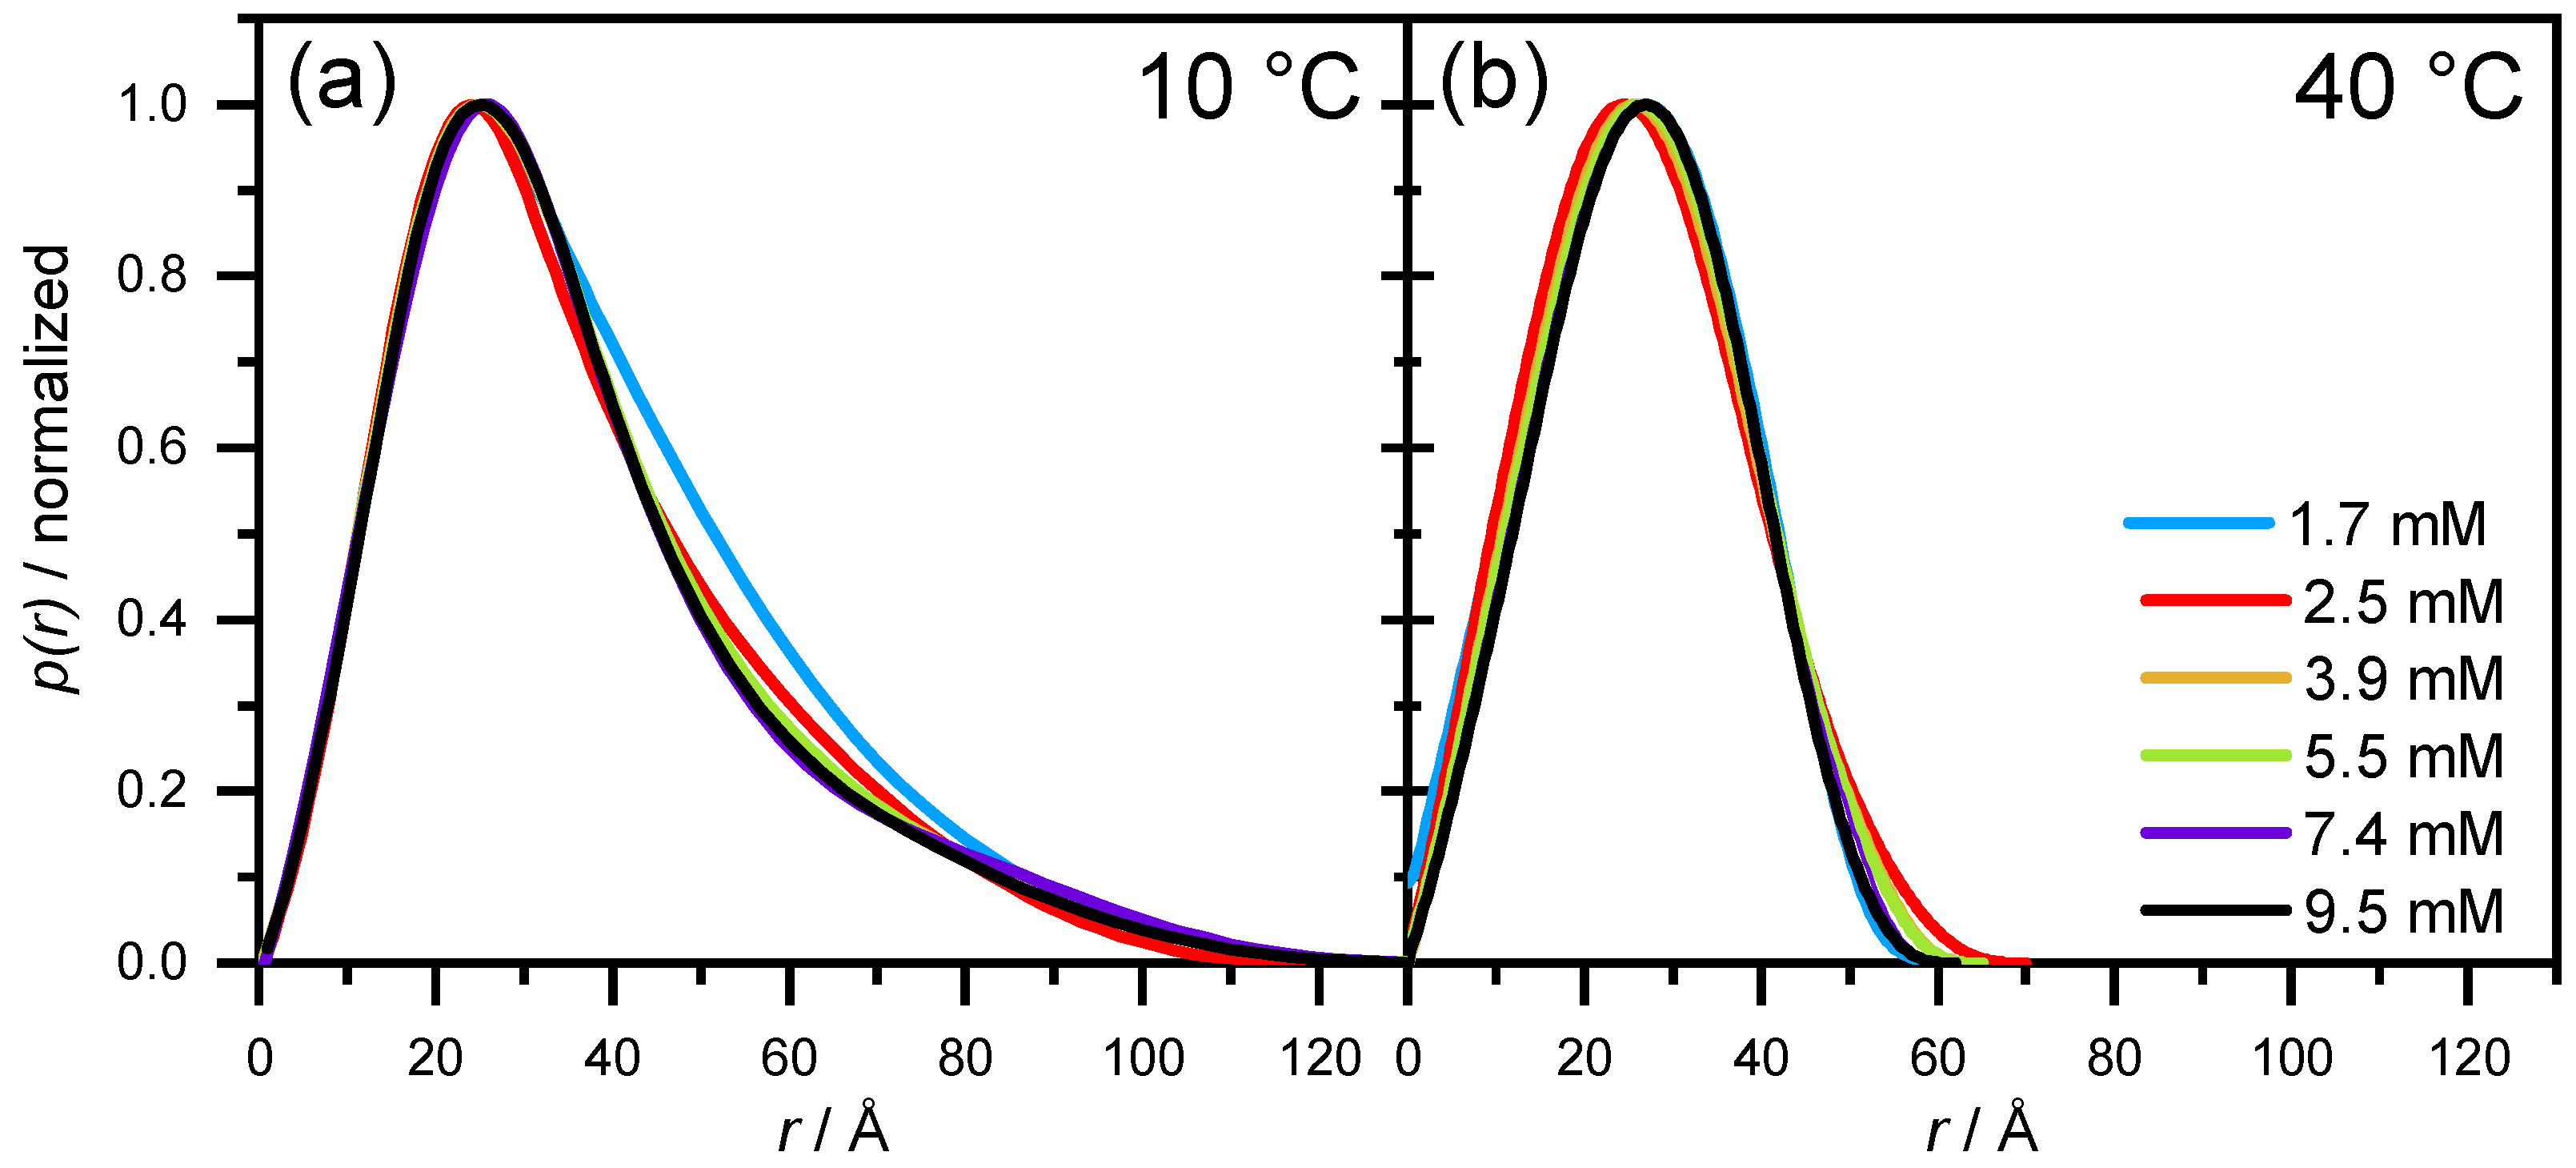
3.2.2. SAXS—Shape of Aescin Micelles
3.2.3. SAXS: Model-Dependent Fitting of Aescin Micelles
4. Conclusions and Outlook
Supplementary Materials
Author Contributions
Funding
Acknowledgments
Conflicts of Interest
References
- Watzl, B. Saponine: Charakteristik, Vorkommen, Aufnahme, Stoffwechsel, Wirkungen. Ernährungs-Umschau 2001, 48, 251–253. [Google Scholar]
- Francis, G.; Kerem, Z.; Makkar, H.P.S.; Becker, K. The biological action of saponins in animal systems: A review. Br. J. Nutr. 2002, 88, 587–605. [Google Scholar] [CrossRef] [PubMed]
- Güçlü-Üstündağ, Ö.; Mazza, G. Saponins: Properties, applications and processing. Crit. Rev. Food Sci. Nutr. 2007, 47, 231–258. [Google Scholar] [CrossRef] [PubMed]
- Golemanov, K.; Tcholakova, S.; Denkov, N.; Pelan, E.; Stoyanov, S.D. Remarkably high surface visco-elasticity of adsorption layers of triterpenoid saponins. Soft Matter 2013, 9, 5738–5752. [Google Scholar] [CrossRef]
- Vincken, J.P.; Heng, L.; de Groot, A.; Gruppen, H. Saponins, classification and occurrence in the plant kingdom. Phytochemistry 2007, 68, 275–297. [Google Scholar] [CrossRef] [PubMed]
- Hostettmann, K.; Marston, A. Saponins; Cambridge University Press: Cambridge, UK; New York, NY, USA, 1995. [Google Scholar]
- Sparg, S.G.; Light, M.E.; van Staden, J. Biological activities and distribution of plant saponins. J. Ethnopharmacol. 2004, 94, 219–243. [Google Scholar] [CrossRef]
- Cheok, C.Y.; Salman, H.A.K.; Sulaiman, R. Extraction and quantification of saponins: A review. Food Res. Int. 2014, 59, 16–40. [Google Scholar] [CrossRef]
- Sirtori, C.R. Aescin: Pharmacology, pharmacokinetics and therapeutic profile. Pharmacol. Res. 2001, 44, 183–193. [Google Scholar] [CrossRef]
- Vasiliauskas, A.; Leonavičienė, L.; Vaitkienė, D.; Bradūnaitė, R.; Lukšienė, A. Anti-inflammatory effects of Aesculus hippocastanum L. tincture and the pro-/antioxidant bodily state of rats with adjuvant arthritis. Acta Med. Litu. 2010, 17, 123–132. [Google Scholar] [CrossRef]
- Miyakoshi, M.; Tamura, Y.; Masuda, H.; Mizutani, K.; Tanaka, O.; Ikeda, T.; Ohtani, K.; Kasai, R.; Yamasaki, K. Antiyeast Steroidal Saponins from Yucca schidigera (Mohave Yucca), a New Anti-Food-Deteriorating Agent. J. Nat. Prod. 2000, 63, 332–338. [Google Scholar] [CrossRef]
- Anisimov, M.M.; Shentsova, E.B.; Shcheglov, V.V.; Shumilov, Y.N.; Rasskazov, V.A.; Strigina, L.I.; Chetyrina, N.S.; Elyakov, G.B. Mechanism of cytotoxic action of some triterpene glycosides. Toxicon 1978, 16, 207–218. [Google Scholar] [CrossRef]
- Gauthier, C.; Legault, J.; Girard-Lalancette, K.; Mshvildadze, V.; Pichette, A. Haemolytic activity, cytotoxicity and membrane cell permeabilization of semi-synthetic and natural lupane- and oleanane-type saponins. Bioorg. Med. Chem. 2009, 17, 2002–2008. [Google Scholar] [CrossRef] [PubMed]
- Fukuda, K.; Utsumi, H.; Shoji, J.; Hamada, A. Saponins can cause the agglutination of phospholipid vesicles. Biochim. Biophys. Acta Biomembr. 1985, 820, 199–206. [Google Scholar] [CrossRef]
- Lorent, J.H.; Quetin-Leclercq, J.; Mingeot-Leclercq, M.P. The amphiphilic nature of saponins and their effects on artificial and biological membranes and potential consequences for red blood and cancer cells. Org. Biomol. Chem. 2014, 12, 8803–8822. [Google Scholar] [CrossRef] [PubMed]
- Paepenmüller, T.; Müller-Goymann, C.C. Influence of Quil A on liposomal membranes. Int. J. Pharm. 2014, 475, 138–146. [Google Scholar] [CrossRef] [PubMed]
- Böttcher, S.; Drusch, S. Saponins—Self-assembly and behavior at aqueous interfaces. Adv. Colloid Interface Sci. 2017, 243, 105–113. [Google Scholar] [CrossRef] [PubMed]
- Böttger, S.; Hofmann, K.; Melzig, M.F. Saponins can perturb biologic membranes and reduce the surface tension of aqueous solutions: A correlation? Bioorg. Med. Chem. 2012, 20, 2822–2828. [Google Scholar] [CrossRef] [PubMed]
- Balakrishnan, S.; Varughese, S.; Deshpande, A. Micellar characterisation of saponin from Sapindus mukorossi. Tenside Surfactants Deterg. 2006, 43, 262–268. [Google Scholar] [CrossRef]
- Liu, J.; Harms, M.; Garamus, V.M.; Müller-Goymann, C.C. Reentrant structural phase transition in amphiphilic self-assembly. Soft Matter 2013, 9, 6371. [Google Scholar] [CrossRef]
- Matsuoka, K.; Miyajima, R.; Ishida, Y.; Karasawa, S.; Yoshimura, T. Aggregate formation of glycyrrhizic acid. Colloids Surf. A Physicochem. Eng. Asp. 2016, 500, 112–117. [Google Scholar] [CrossRef]
- Pedebos, C.; Pol-Fachin, L.; Pons, R.; Teixeira, C.V.; Verli, H. Atomic model and micelle dynamics of QS-21 saponin. Molecules 2014, 19, 3744–3760. [Google Scholar] [CrossRef] [PubMed]
- Peixoto, M.P.G.; Treter, J.; de Resende, P.E.; da Silveira, N.P.; Ortega, G.G.; Lawrence, M.J.; Dreiss, C.A. Wormlike micellar aggregates of saponins from Ilex paraguariensis A. St. Hil. (mate): A characterisation by cryo-TEM, rheology, light scattering and small-angle neutron scattering. J. Pharm. Sci. 2011, 100, 536–546. [Google Scholar] [CrossRef]
- Demana, P.H.; Davies, N.M.; Vosgerau, U.; Rades, T. Pseudo-ternary phase diagrams of aqueous mixtures of Quil A, cholesterol and phospholipid prepared by the lipid-film hydration method. Int. J. Pharm. 2004, 270, 229–239. [Google Scholar] [CrossRef] [PubMed]
- Dai, X.; Shi, X.; Yin, Q.; Ding, H.; Qiao, Y. Multiscale study on the interaction mechanism between ginsenoside biosurfactant and saikosaponin A. J. Colloid Interface Sci. 2013, 396, 165–172. [Google Scholar] [CrossRef] [PubMed]
- Dreiss, C.A.; Feng, Y. Wormlike Micelles; Royal Society of Chemistry: Cambridge, UK, 2017. [Google Scholar]
- Wang, Y.G.; Dai, X.X.; Shi, X.Y.; Qiao, Y.J. The simulation on self-aggregated glycyrrhizin structures. Int. J. Appl. Math. Stat. 2013, 50, 272–279. [Google Scholar]
- Wang, Y.; Zhao, B.; Wang, S.; Liang, Q.; Cai, Y.; Yang, F.; Li, G. Formulation and evaluation of novel glycyrrhizic acid micelles for transdermal delivery of podophyllotoxin. Drug Deliv. 2016, 23, 1623–1635. [Google Scholar] [CrossRef] [PubMed]
- Costantini, A. Escin in pharmaceutical oral dosage forms: Quantitative densitometric HPTLC determination. Il Farmaco 1999, 54, 728–732. [Google Scholar] [CrossRef]
- Golemanov, K.; Tcholakova, S.; Denkov, N.; Pelan, E.; Stoyanov, S.D. The role of the hydrophobic phase in the unique rheological properties of saponin adsorption layers. Soft Matter 2014, 10, 7034–7044. [Google Scholar] [CrossRef] [PubMed]
- Wilkinson, J.A.; Brown, A.M.G. Horse chestnut aesculus hippocastanum: Potential applications in cosmetic skin-care products. Int. J. Cosmet. Sci. 1999, 21, 437–447. [Google Scholar] [CrossRef] [PubMed]
- Sipos, W.; Reutterer, B.; Frank, M.; Unger, H.; Grassauer, A.; Prieschl-Grassauer, E.; Doerfler, P. Escin inhibits type I allergic dermatitis in a novel porcine model. Int. Arch. Allergy Immunol. 2013, 161, 44–52. [Google Scholar] [CrossRef]
- Zhou, X.Y.; Fu, F.H.; Li, Z.; Dong, Q.J.; He, J.; Wang, C.H. Escin, a natural mixture of triterpene saponins, exhibits antitumor activity against hepatocellular carcinoma. Planta Medica 2009, 75, 1580–1585. [Google Scholar] [CrossRef] [PubMed]
- Dudek-Makuch, M.; Studzińska-Sroka, E. Horse chestnut—Efficacy and safety in chronic venous insufficiency: An overview. Rev. Bras. Farmacogn. 2015, 25, 533–541. [Google Scholar] [CrossRef]
- Khan, L.; Kifayatullah, Q.; Ahmad, K.D.; Arfan, M. Preparation of water-soluble aescin from aesculus-indica seeds. J. Chem. Soc. Pak. 1994, 16, 269–272. [Google Scholar]
- Wulff, G.; Tschesche, R. Über Triterpene-XXVI: Über die Struktur der Rosskastaniensaponnie (Aescin) und die aglykone verwandter Glykoside. Tetrahedron 1969, 25, 415–436. [Google Scholar] [CrossRef]
- Pittler, M.H.; Ernst, E. Horse-Chestnut Seed Extract for Chronic Venous Insufficiency. Arch. Dermatol. 1998, 134, 1356–1360. [Google Scholar] [CrossRef] [PubMed]
- Arnould, T.; Janssens, D.; Michiels, C.; Remacle, J. Effect of aescine on hypoxia-induced activation of human endothelial cells. Eur. J. Pharmacol. 1996, 315, 227–233. [Google Scholar] [CrossRef]
- Sreij, R.; Dargel, C.; Geisler, P.; Hertle, Y.; Radulescu, A.; Pasini, S.; Perez, J.; Moleiro, L.H.; Hellweg, T. DMPC vesicle structure and dynamics in the presence of low amounts of the saponin aescin. Phys. Chem. Chem. Phys. 2018, 20, 9070–9083. [Google Scholar] [CrossRef] [PubMed]
- Sreij, R.; Dargel, C.; Hannappel, Y.; Jestin, J.; Prévost, S.; Dattani, R.; Wrede, O.; Hellweg, T. Temperature Dependent Self-Organization of DMPC Membranes Promoted by Intermediate Amounts of the Saponin Aescin. Biochim. Biophys. Acta Biomembr. 2019, 1861, 897–906. [Google Scholar] [CrossRef]
- Sreij, R.; Dargel, C.; Moleiro, L.H.; Monroy, F.; Hellweg, T. Aescin Incorporation and Nanodomain Formation in DMPC Model Membranes. Langmuir 2017, 33, 12351–12361. [Google Scholar] [CrossRef]
- De Groot, C.; Müsken, M.; Müller-Goymann, C.C. Novel Colloidal Microstructures of β-Escin and the Liposomal Components Cholesterol and DPPC. Planta Medica 2018, 84, 1219–1227. [Google Scholar] [CrossRef] [PubMed]
- Penfold, J.; Thomas, R.K.; Tucker, I.; Petkov, J.T.; Stoyanov, S.D.; Denkov, N.; Golemanov, K.; Tcholakova, S.; Webster, J.R.P. Saponin Adsorption at the Air-Water Interface-Neutron Reflectivity and Surface Tension Study. Langmuir 2018, 34, 9540–9547. [Google Scholar] [CrossRef] [PubMed]
- Pekdemir, T.; Ishigami, Y.; Uchiyama, H. Characterization of Aescin as a biosurfactant for environmental remediation. J. Surfactants Deterg. 1999, 2, 337–341. [Google Scholar] [CrossRef]
- Yoshikawa, M.; Murakami, T.; Matsuda, H.; Yamahara, J.; Murakami, N.; Kitagawa, I. Bioactive saponins and glycosides. III. Horse chestnut.(1): The structures, inhibitory effects on ethanol absorption, and hypoglycemic activity of escins Ia, Ib, IIa, IIb, and IIIa from the seeds of Aesculus hippocastanum L. Chem. Pharm. Bull. 1996, 44, 1454–1464. [Google Scholar] [CrossRef] [PubMed]
- Yoshikawa, M.; Murakami, T.; Yamahara, J.; Matsuda, H. Bioactive saponins and glycosides. XII. Horse chestnut.(2): Structures of escins IIIb, IV, V, and VI and isoescins Ia, Ib, and V, acylated polyhydroxyoleanene triterpene oligoglycosides, from the seeds of horse chestnut tree (Aesculus hippocastanum L., Hippocastanaceae). Chem. Pharm. Bull. 1998, 46, 1764–1769. [Google Scholar] [PubMed]
- Zhang, F.; Ilavsky, J.; Long, G.G.; Quintana, J.P.G.; Allen, A.J.; Jemian, P.R. Glassy carbon as an absolute intensity calibration standard for small-angle scattering. Metall. Mater. Trans. A 2010, 41A, 1151–1158. [Google Scholar] [CrossRef]
- Viguier, G.; Girardot, R.; Perez, J. Foxtrot 3.3.4. 2016. [Google Scholar]
- Nakahara, Y.; Kida, T.; Nakatsuji, Y.; Akashi, M. New fluorescence method for the determination of the critical micelle concentration by photosensitive monoazacryptand derivatives. Langmuir 2005, 21, 6688–6695. [Google Scholar] [CrossRef] [PubMed]
- Abuin, E.B.; Lissi, E.A.; Aspée, A.; Gonzalez, F.D.; Varas, J.M. Fluorescence of 8-Anilinonaphthalene- 1-sulfonate and Properties of Sodium Dodecyl Sulfate Micelles in Water–Urea Mixtures. J. Colloid Interface Sci. 1997, 186, 332–338. [Google Scholar] [CrossRef]
- Asakawa, T.; Mouri, M.; Miyagishi, S.; Nishida, M. Probe methods for the second cmc of fluorocarbon and hydrocarbon surfactant mixtures. Langmuir 1989, 5, 343–348. [Google Scholar] [CrossRef]
- Tsibranska, S.R.; Ivanova, A.; Tcholakova, S.; Denkov, N.D. Self-Assembly of Escin Molecules at the Air-Water Interface as Studied by Molecular Dynamics. Langmuir 2017, 33, 8330–8341. [Google Scholar] [CrossRef]
- El-Hefian, E.A.; Yahaya, A.H. Investigation on Some Properties of SDS Solutions. Aust. J. Basic Appl. Sci. 2011, 5, 1221–1227. [Google Scholar]
- Janek, T.; Czyżnikowska, Ż.; uczyński, J.; Gudiña, E.J.; Rodrigues, L.R.; Gałęzowska, J. Physicochemical study of biomolecular interactions between lysosomotropic surfactants and bovine serum albumin. Colloids Surf. B Biointerfaces 2017, 159, 750–758. [Google Scholar] [CrossRef] [PubMed]
- Milanović, M.; Krstonošić, V.; Dokić, L.; Hadnađev, M.; Dapčević Hadnađev, T. Insight into the interaction between carbopol® 940 and ionic/nonionic surfactant. J. Surfactants Deterg. 2015, 18, 505–516. [Google Scholar] [CrossRef]
- Stanimirova, R.; Marinova, K.; Tcholakova, S.; Denkov, N.; Stoyanov, S.; Pelan, E. Surface rheology of saponin adsorption layers. Langmuir 2011, 27, 12486–12498. [Google Scholar] [CrossRef] [PubMed]
- Bergmann, A.; Fritz, G.; Glatter, O. Solving the generalized indirect Fourier transformation (GIFT) by Boltzmann simplex simulated annealing (BSSA). J. Appl. Crystallogr. 2000, 33, 1212–1216. [Google Scholar] [CrossRef]
- SASView, Freeware Version 4.20 beta. 2018. Available online: http://www.sasview.org (accessed on 20 July 2018).
- ACD/ChemSketch, Freeware Version; Advanced Chemistry Development, Inc.: Toronto, ON, Canada, 2015; Available online: http://www.acdlabs.com (accessed on 12 March 2018).
- Sreij, R.; Prévost, S.; Dattani, R.; Dargel, C.; Hertle, Y.; Wrede, O.; Hellweg, T. Interaction of the saponin aescin with ibuprofen in DMPC model membranes. Mol. Pharm. 2018, 15, 4446–4461. [Google Scholar] [CrossRef] [PubMed]
- Israelachvilli, J.N. Thermodynamic and Geometric Aspects of Amphiphile Aggregation into Micelles, Vesicles and Bilayers, and the Interactions between Them; North-Holland: Amsterdam, The Netherlands, 1985; pp. 24–58. [Google Scholar]
- Israelachvilli, J.N. Intermolecular and Surface Forces, 2nd ed.; Academic Press: New York, NY, USA, 1992. [Google Scholar]


| T | aescin,AF |
|---|---|
| C | mM |
| 10 | 0.38 ± 0.09 |
| 15 | 0.38 ± 0.10 |
| 20 | 0.38 ± 0.10 |
| 25 | 0.38 ± 0.10 |
| 30 | 0.37 ± 0.11 |
| 35 | 0.37 ± 0.12 |
| 40 | 0.35 ± 0.13 |
| 45 | 0.35 ± 0.14 |
| 50 | 0.32 ± 0.13 |
| caescin | R | L | |||
|---|---|---|---|---|---|
| mM | Å | Å | % | Å | Å |
| 1.7 | 17.8 ± 0.02 | 90.9 ± 0.4 | 4 | 13.2 ± 0.10 | 31.9 ± 0.07 |
| 2.5 | 16.8 ± 0.04 | 90.9 ± 0.4 | 14 | 13.4 ± 0.10 | 31.1 ± 0.07 |
| 3.9 | 17.4 ± 0.03 | 86.6 ± 0.2 | 23 | 15.0 ± 0.04 | 31.1 ± 0.05 |
| 5.5 | 17.8 ± 0.01 | 77.9 ± 0.2 | 26 | 15.4 ± 0.06 | 31.2 ± 0.04 |
| 7.4 | 18.5 ± 0.02 | 76.3 ± 0.2 | 27 | 15.7 ± 0.04 | 31.1 ± 0.03 |
| 9.5 | 18.5 ± 0.01 | 74.0 ± 0.0 | 26 | 16.8 ± 0.02 | 30.8 ± 0.02 |
© 2019 by the authors. Licensee MDPI, Basel, Switzerland. This article is an open access article distributed under the terms and conditions of the Creative Commons Attribution (CC BY) license (http://creativecommons.org/licenses/by/4.0/).
Share and Cite
Dargel, C.; Geisler, R.; Hannappel, Y.; Kemker, I.; Sewald, N.; Hellweg, T. Self-Assembly of the Bio-Surfactant Aescin in Solution: A Small-Angle X-ray Scattering and Fluorescence Study. Colloids Interfaces 2019, 3, 47. https://doi.org/10.3390/colloids3020047
Dargel C, Geisler R, Hannappel Y, Kemker I, Sewald N, Hellweg T. Self-Assembly of the Bio-Surfactant Aescin in Solution: A Small-Angle X-ray Scattering and Fluorescence Study. Colloids and Interfaces. 2019; 3(2):47. https://doi.org/10.3390/colloids3020047
Chicago/Turabian StyleDargel, Carina, Ramsia Geisler, Yvonne Hannappel, Isabell Kemker, Norbert Sewald, and Thomas Hellweg. 2019. "Self-Assembly of the Bio-Surfactant Aescin in Solution: A Small-Angle X-ray Scattering and Fluorescence Study" Colloids and Interfaces 3, no. 2: 47. https://doi.org/10.3390/colloids3020047
APA StyleDargel, C., Geisler, R., Hannappel, Y., Kemker, I., Sewald, N., & Hellweg, T. (2019). Self-Assembly of the Bio-Surfactant Aescin in Solution: A Small-Angle X-ray Scattering and Fluorescence Study. Colloids and Interfaces, 3(2), 47. https://doi.org/10.3390/colloids3020047