Article

Systematic Characterization of DMPC/DHPC Self-Assemblies and Their Phase Behaviors in Aqueous Solution

1
Division of Chemical Engineering, Graduate School of Engineering Science, Osaka University, 1-3 Machikaneyama-cho, Toyonaka, Osaka 560-8531, Japan
2
Department of Chemical Engineering, National Institute of Technology, Nara College, Japan, 22 Yata-cho, Yamatokoriyama, Nara 639-1080, Japan
3
Center for Food and Bioconvergence, Seoul National University, Bldg 203#409, 1, Gwanak-ro, Gwanak-gu, Seoul 08826, Korea
*
Author to whom correspondence should be addressed.
Colloids Interfaces 2018, 2(4), 73; https://doi.org/10.3390/colloids2040073
Submission received: 22 November 2018 / Revised: 10 December 2018 / Accepted: 11 December 2018 / Published: 14 December 2018

Abstract

:
Self-assemblies composed of 1,2-dimyristoyl-sn-glycero-3-phosphocholine (DMPC) and 1,2-dihexanoyl-sn-glycero-3-phosphocholine (DHPC) form several kinds of structures, such as vesicle, micelle, and bicelle. Their morphological properties have been studied widely, but their interfacial membrane properties have not been adequately investigated. Herein, we report a systematic characterization of DMPC/DHPC assemblies at 20 °C. To investigate the phase behavior, optical density OD500, size (by dynamic light scattering), membrane fluidity 1/PDPH (using 1,6-diphenyl-1,3,5-hexatriene), and membrane polarity GP340 (using 6-dodecanoyl-N,N-dimethyl-2-naphthylamine) were measured as a function of molar ratio of DHPC (XDHPC). Based on structural properties (OD500 and size), large and small assemblies were categorized into Region (i) (XDHPC < 0.4) and Region (ii) (XDHPC ≥ 0.4), respectively. The DMPC/DHPC assemblies with 0.33 ≤ XDHPC ≤ 0.67 (Region (ii-1)) showed gel-phase-like interfacial membrane properties, whereas DHPC-rich assemblies (XDHPC ≥ 0.77) showed disordered membrane properties (Region (ii-2)). Considering the structural and interfacial membrane properties, the DMPC/DHPC assemblies in Regions (i), (ii-1), and (ii-2) can be determined to be vesicle, bicelle, and micelle, respectively.

Graphical Abstract

1. Introduction

Phospholipids form a self-assembled membrane in aqueous solution to reduce the exposure of hydrophobic acyl chain groups. 1,2-Dimyristoyl-sn-glycero-3-phosphocholine (DMPC, C14:0) molecules form a bilayer vesicle (liposome), whereas 1,2-dihexanoyl-sn-glycero-3-phosphocholine (DHPC, C6:0) molecules form a micelle at a total lipid concentration higher than the critical micelle concentration (cmc: 15 mM [1]). Depending on the chemical structure of the phospholipids, the self-assemblies form various morphologies such as vesicle, micelle, etc. [2,3]. In general, the self-assembly behavior of amphiphilic molecules is discussed based on the critical packing parameter, in which the head group area, length of hydrocarbon chain, and volume of molecules are dominant factors that determine the self-assembly structure. Owing to the hydrophobic region at the interior of the membrane, phospholipid assemblies are utilized as a platform to integrate various kinds of nanomaterials [4]. The lipid bilayer structure is desirable to study membrane proteins; generally, discoidal self-assemblies, called “bicelles” [5,6], are applied to reconstruct membrane peptides and proteins [7,8,9]. Basically, a bicelle structure is composed of a mixture of lipid and detergent, as in DMPC/DHPC systems [10]. Since the stability of a bicelle is sensitive to the lipid composition and temperature [11,12,13,14], it is important to investigate the thermodynamic behavior of bicelles.
The cmc value of DHPC is ca. 15 mM [1,10], whereas the critical vesicle concentration (cvc) of DMPC is ca. 6 nM. Due to the difference in critical aggregation concentrations, the stability of a bicelle is also sensitive to the total lipid concentration [10,11,12,15,16]. Upon dilution of a small bicelle assembly, the transformation from bicelle to vesicle was observed. To avoid this, a chemically modified detergent can be utilized, making the bicelle structure stable toward heating or dilution [17,18]. To characterize bicelle properties, experiments have been carried out with high concentrations of lipid (1–10%, w/w); by employing such conditions, the structural properties of bicelles can be evaluated using cryo-electron microscopy (Cryo-EM) [10,15]. With regard to the rupture of bicelles in the dilution process, a direct deposition of lipids onto a solid support, wherein the bicelles are used as carriers for lipid sources, becomes more successful [19,20]. Statically, the phase behavior of lipid mixture systems (e.g., DMPC/DHPC) can be controlled by focusing on parameters such as lipid composition, lipid concentration, and temperature. Then, the self-assembly morphology can be controlled in a dynamic process, such as heating/cooling and dilution, based on the phase equilibrium. However, the phase behavior of DMPC/DHPC mixture systems at low lipid concentrations (total lipid < 20 mM) has not been adequately investigated.
Interfacial membrane properties such as membrane fluidity and membrane polarity, which are evaluated using fluorescent probes, are also important factors to characterize self-assemblies [21,22,23]. In lipid bilayer vesicles, the interfacial properties can be used to determine the phase states [22,24]; the solid-ordered phase (gel phase) and liquid-disordered phase (liquid-crystalline phase) show quite different membrane fluidity and polarity. These properties reflect the microscopic phase state and phase separation behavior [24]. Saturated phospholipids are in gel phase below the phase transition temperature (Tm), whereas the membrane turns into liquid-crystalline phase at temperatures above the Tm. To date, bicelles (such as DMPC/DHPC mixture systems) have been hardly studied based on their interfacial properties, especially at low lipid concentrations (less than 1% lipids (ca. 20 mM). In fluorescent probe studies, the interfacial membrane properties can be investigated at a total lipid concentration of 100 μM [21,24]. Therefore, this could be suitable to evaluate the interfacial membrane properties and structural properties of DMPC/DHPC mixture systems.
The packing state of a lipid membrane is dominantly related to the function of the membrane: for example, molecular permeability and interaction of proteins [25,26]. In our previous study, significant chiral selective amino acid adsorption onto a liposome membrane was observed in a gel phase [27]. The state of a lipid bilayer can be classified as gel phase (most ordered state, like a solid), ripple-gel phase (ordered state), and liquid-crystalline phase (disordered state). Considering the membrane fluidity and membrane polarity of micelles [28], they can be categorized as a disordered membrane. In gel phase, the surface pressure is up to ~50 mN/m in monolayer systems (planar membrane (no curvature)), whereas it decreases to ~30 mN/m in vesicular bilayer systems [29]. This may be due to the membrane curvature of the vesicles, which could decrease lipid packing. It is hence worthwhile to investigate the interfacial properties of such a flat bilayer system.
The aim of this study was to clarify the self-assembly behavior of DMPC/DHPC mixtures containing various total lipid concentrations and fractions of lipids. The DMPC/DHPC assemblies were prepared with different molar fractions of DHPC (XDHPC). Analyses of the turbidity (optical density, OD500) and size distribution (using dynamic light scattering (DLS)), and of the interfacial membrane properties, using fluorescent probes, 1,6-diphenyl-1,3,5-hexatriene (DPH) and 6-dodecanoyl-N,N-dimethyl-2-naphthylamine (Laurdan), were systematically carried out. The obtained results are summarized as a diagram to show the relationship between the lipid concentrations and morphologies of the DMPC/DHPC self-assemblies.

2. Materials and Methods

2.1. Materials

DHPC and DMPC (Tm = 23 °C) were purchased from Avanti Polar Lipids, Inc. (Alabaster, AL, USA). DPH and Laurdan were purchased from Sigma-Aldrich (St. Louis, MO, USA). Sodium dihydrogenphosphate (anhydrous) and disodium hydrogenphosphate were purchased from Wako Pure Chemical (Osaka, Japan), and were used to prepare phosphate buffer (50 mM, pH 7.0). Ultrapure water was prepared with the Millipore Milli-Q system (EMD Millipore Co., Darmstadt, Germany). Other chemicals were used without further purification.

2.2. Vesicle Preparation

DMPC vesicles were prepared as a reference (standard self-assembly), based on literature [24]. Briefly, a chloroform solution of phospholipids was dried in a round-bottom flask by rotary evaporation under vacuum. The obtained lipid films were dissolved in chloroform once more, and the solvent was evaporated. This operation was repeated at least twice. The obtained lipid thin film was kept under high vacuum for at least 3 h, and then hydrated with phosphate buffer at room temperature. The obtained DMPC suspension was frozen at −80 °C and then thawed at 40 °C (over the Tm of DMPC); this freeze-thaw cycle was repeated five times. Notably, the DMPC vesicle suspensions were extruded through 2 layers of polycarbonate membranes with a mean pore diameter of 100 nm, using as extruding device (Liposofast; Avestin Inc., Ottawa, ON, Canada). The prepared unilamellar vesicles were kept at 4 °C until use.

2.3. Preparation of DMPC/DHPC Self-Assembly in an Aqueous Solution.

Lipid thin films of DMPC/DHPC mixtures were prepared by the mothed described on the above. Firstly, the self-assembly solution was prepared at the total lipid concentration of 20 mM, with various DHPC fractions, XDHPC: 0.17–0.95. The obtained lipid thin films were hydrated with phosphate buffer at 20 °C. No mechanical treatments (sonication, extrusion) were applied for DMPC/DHPC assemblies, to keep their spontaneous structures. In dilution of the DHPC/DMPC solution (20 mM), an aliquot amount of buffer solution was gently added to adjust the total lipid concentration, wherein the final lipid concentrations were set at 15 mM, 10 mM, 9 mM, and 8 mM. The obtained self-assembly solutions were applied for monitoring the optical density (see Section 2.4), and dynamic light scattering (see Section 2.5). If necessary, the extrusion (see Section 2.2) was performed before fluorescent spectroscopic measurements (see Section 2.6 and Section 2.7).

2.4. Turbidity Measurements of Self-Assembly Solution

To assess the morphological insights for DMPC/DHPC assemblies, the turbidities of DMPC/DHPC mixtures at 500 nm (OD500) were monitored by UV-1800 Spectrophotometer (Shimazu, Kyoto, Japan), in various total lipid concentrations. A thin quart cell (light path length: 1 mm) was employed to record the varied turbidity. An increased turbidity in the suspension could be evidence for the growth of self-assembly in size [30,31,32]. Thus, the morphological transition from bicelles to vesicles could be assessed by a jump-up of the OD500 values, in dilution.

2.5. Dynamic Light Scattering

The apparent sizes of mixtures (total lipid concentration: 20 mM) were determined by dynamic light scattering (DLS). Measurements were performed with the particle size analyzer (Zetasizer Nano ZS, Malvern Panalytical, Grovewood Rd, UK). The average diameters were calculated based on a number-average diameter.

2.6. Evaluation of Membrane Fluidity

As interfacial properties, the membrane fluidity was investigated by using DPH, based on previously described methods [21,33]. DPH was added to DMPC/DHPC assemblies with a molar ratio of lipid/DPH = 250/1. After incubation for 30 min, the fluorescence polarization of DPH was measured using a fluorescence spectrophotometer (FP-8500, Jasco, Tokyo, Japan) (Ex. = 360 nm, Em. = 430 nm). Fluorescence polarizers were set on the excitation and emission light pathways. With the emission polarizer angle of 0°, the fluorescence intensities obtained with the emission polarizer angle 0° and 90° were defined as I and I, respectively. With the emission polarizer angle of 90°, the fluorescence intensities obtained with the emission polarizer angle 0° and 90° were defined as i and i, respectively. The polarization (PDPH) of DPH was then calculated by using the following equations:
P D P H = ( I G I ) / ( I + G I ) ,
G = i / i ,
where G is the correction factor. The membrane fluidity was evaluated based on the reciprocal of polarization, 1/PDPH.

2.7. Evaluation of Membrane Polarity

Fluorescent probe Laurdan is sensitive to the polarity around itself, which allows the local polarity in lipid membranes to be determined [34,35]. Laurdan emission spectra exhibit a red shift caused by solvent attack and by solvent relaxation, thus its emission spectrum reflects the polarity (hydration state) of the self-assembly membrane. The Laurdan emission spectra were measured with an excitation wavelength of 340 nm, and the general polarization (GP340), the membrane polarity, was calculated as follows:
G P 340 = ( I 440 I 490 ) / ( I 440 + I 490 ) ,
where I440 and I490 are the emission intensities of Laurdan excited at 340 nm. The obtained emission spectrum was furthermore analyzed by using Peakfit software (v.4.12, Systat Software Inc., San Jose, CA, USA) [28]. After deconvolution, the area fraction of each component was compared.

3. Results and Discussion

3.1. Systematic Characterization of DMPC/DHPC Assemblies Focusing on Turbidity, Size, Membrane Fluidity, and Membrane Polarity.

For DMPC/DHPC suspensions at a total lipid concentration of 20 mM, the solution turbidity varied depending on the XDHPC. The transparency of the suspension was dependent on the size of the assemblies; the vesicles were relatively large (diameter > 30 nm: Region (i)), whereas the micelles or bicelles were small (diameter < 30 nm: Region (ii)) (Figure 1a). By employing fluorescent probes (DPH and Laurdan), the membrane fluidity (1/PDPH) and membrane polarity (GP340) values were determined. The DHPC micelle was categorized as disordered membrane (1/PDPH > 6, GP340 < 0.3). At 20 °C (< Tm of DMPC); some small assemblies (in Region (ii)) as well as the gel-phase DMPC vesicle showed rather ordered interfacial membrane properties (Figure 1b). The group of Region (ii) can be further divided into “ordered phase (ii-1)” and “disordered phase (ii-2).” The bicelle of DMPC/DHPC probably consisted of a micelle-like edge (rich in DHPC) and bilayer (rich in DMPC); therefore, the ordered phase found in Region (ii-1) could have been derived from the bilayer region of the bicelle. To classify each self-assembly, the threshold values of size, OD500, 1/PDPH, and GP340 are summarized in Table 1. Based on the systematic characterization, a phase diagram of DMPC/DHPC at 20 mM is described in Figure 1c. The assembled states of DMPC/DHPC were confirmed as vesicle (Region (i)), bicelle (Region (ii-1)), and micelle (Region (ii-2)).

3.2. Structural Properties of DMPC/DHPC Assemblies in Dilute Conditions

The turbidities of DMPC/DHPC suspensions are dependent on the morphology. Micelle solutions are transparent, whereas vesicle, cylindrical micelle, and holey lamellar suspensions are turbid [10]. The DHPC micelle solution, wherein the average micelle size was 3–4 nm, was transparent. This suggests a rough correlation between turbidity and size of the self-assembly; therefore, the OD500 (Figure 2) and size distribution (Figure 3) were investigated at different total lipid concentrations.

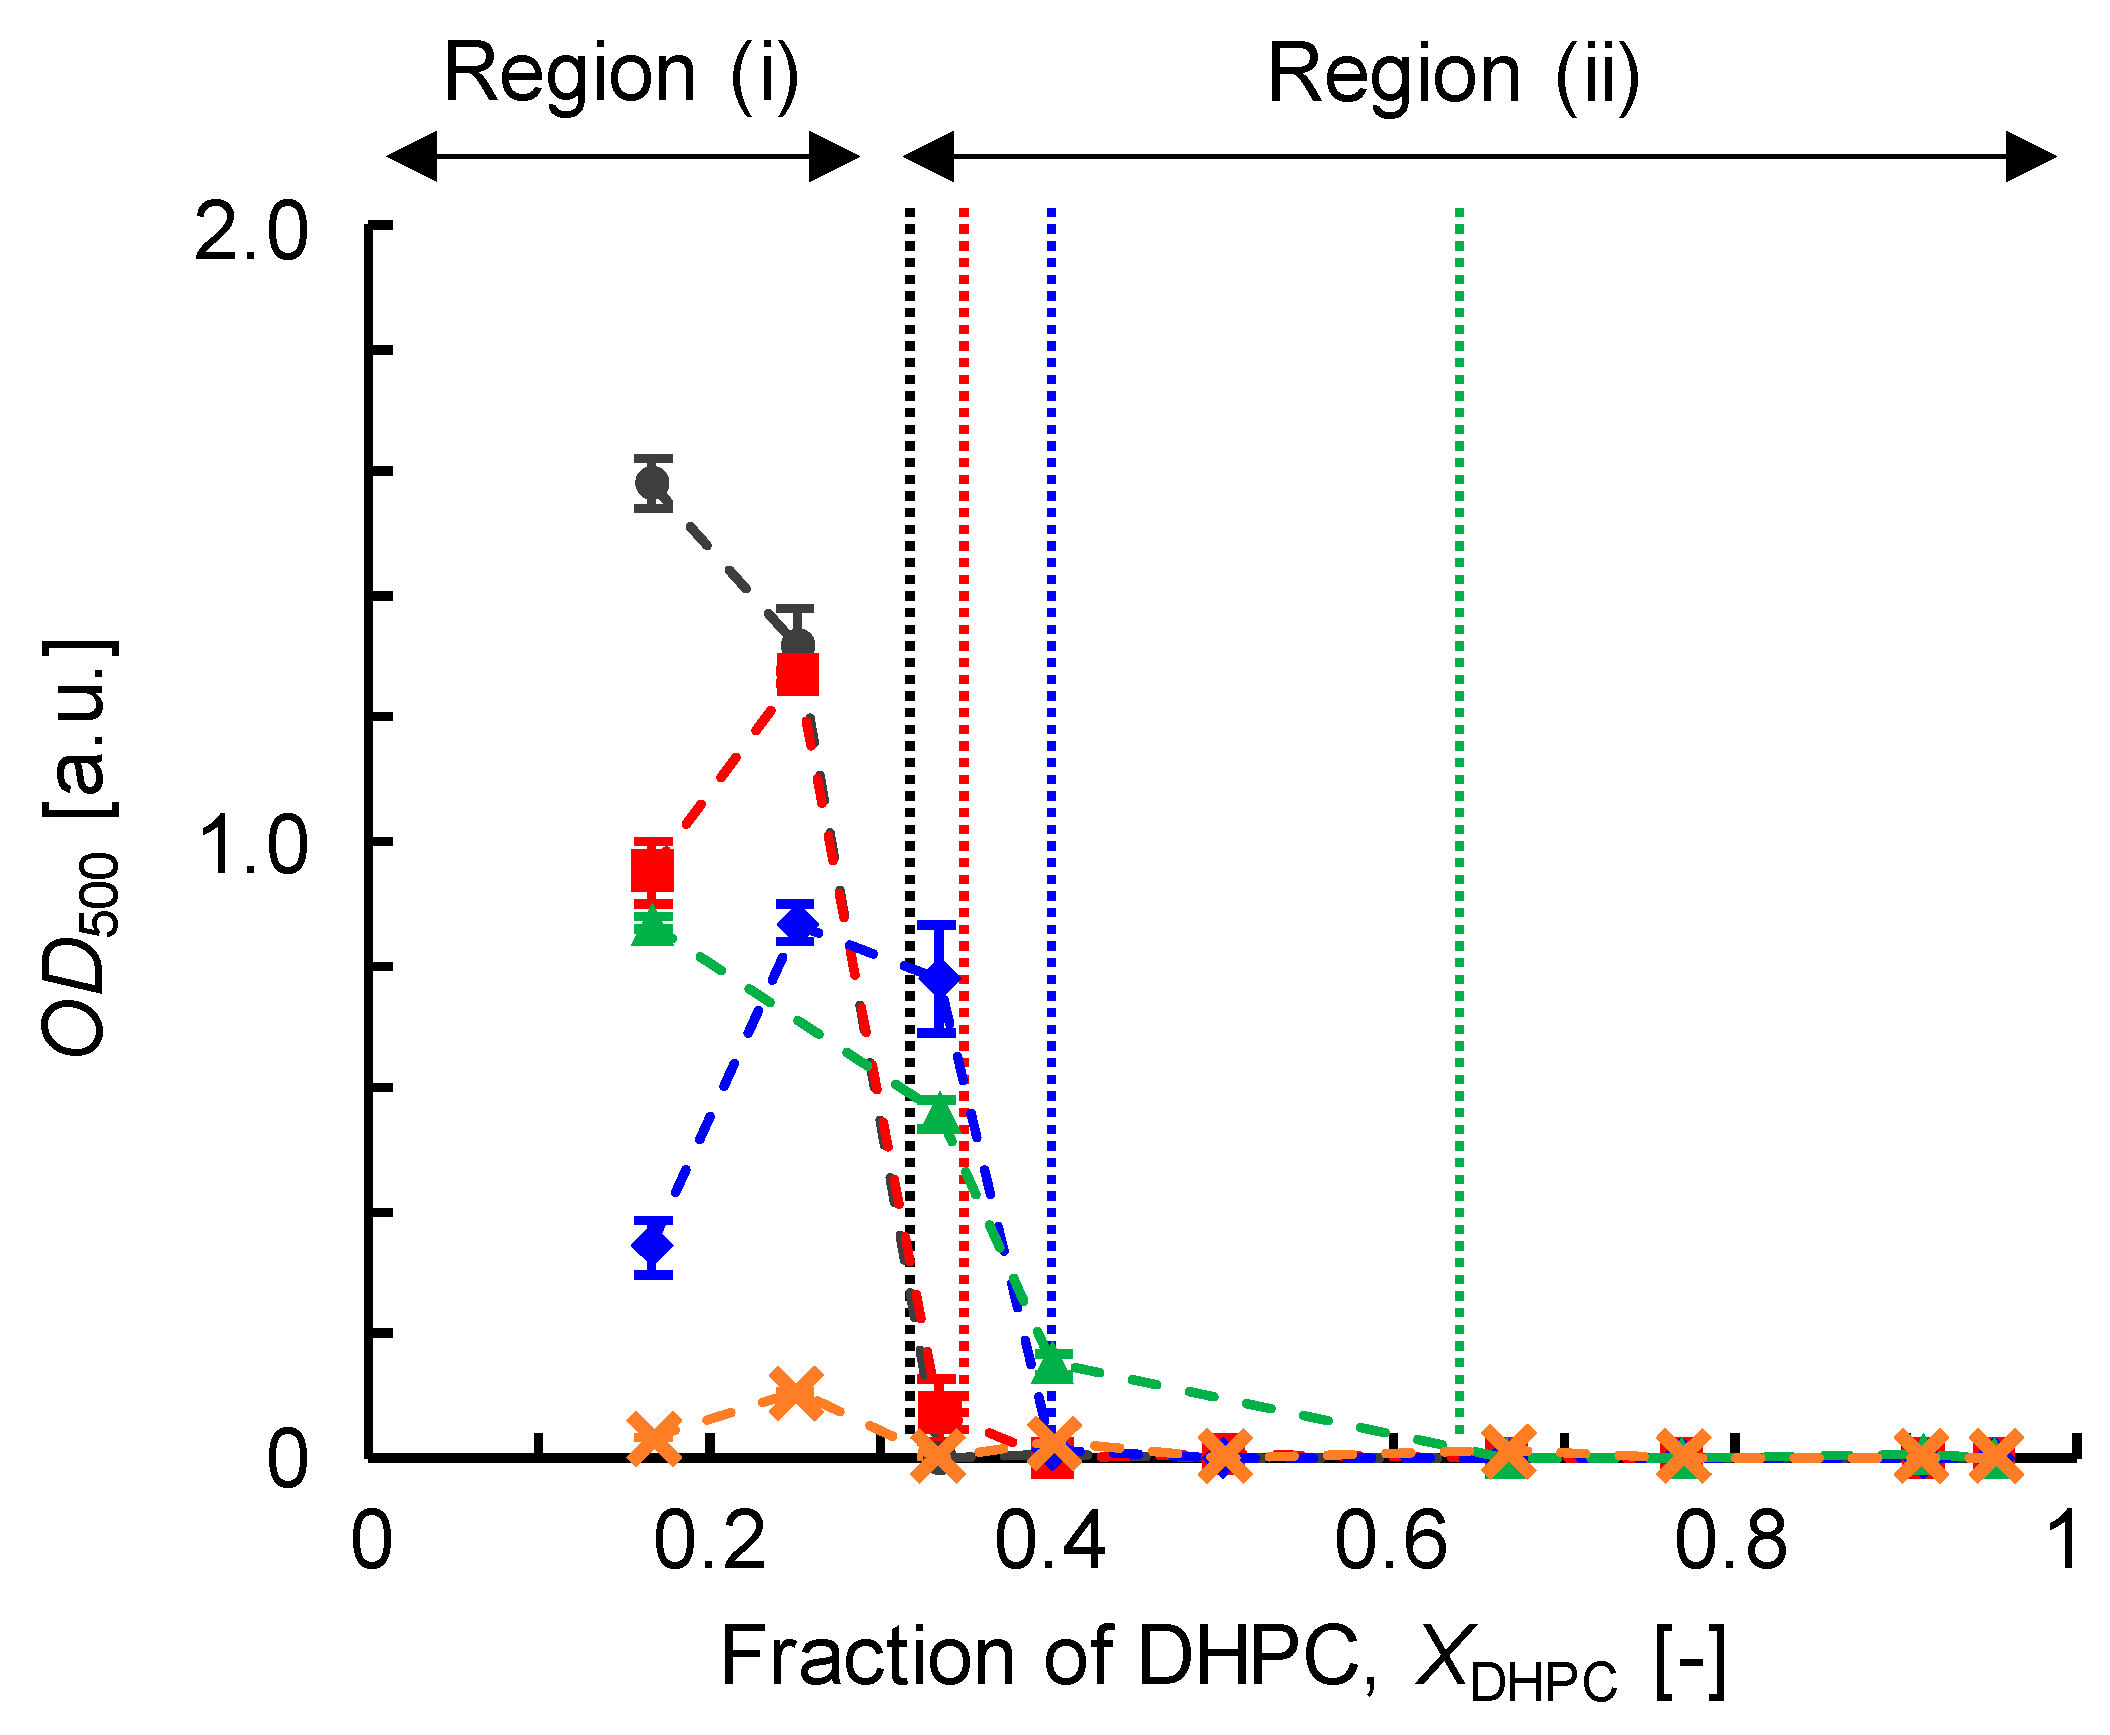
3.2.1. Optical Density (OD500)

Figure 2 shows the OD500 values for DHPC/DMPC assemblies with different XDHPC ratios, and at various total lipid concentrations. As a trend, a higher OD500 value was obtained with an XDHPC value lower than 0.4, in the total lipid concentration range of 8 to 20 mM. A similar tendency was observed at a total lipid concentration of 1 mM, although the OD500 value was relatively low. At any total lipid concentration, a critical XDHPC value, with an increase in the OD500 value, was observed. Herein, the XDHPC range for “turbid” suspensions is shown as Region (i), and that for “transparent” ones as Region (ii). For the samples with high total lipid concentrations (15 and 20 mM), the critical XDHPC was around 0.3. With a decrease in the total lipid concentration, the value shifted to a higher DHPC fraction; the critical XDHPC values for 10, 8, and 1 mM systems were around 0.4, 0.7, and 0.9, respectively. It was therefore considered that an increase in the ratio of long-chained DMPC molecules (decrease in XDHPC) caused the formation of larger self-assemblies. Consequently, the morphology of DMPC/DHPC assemblies is roughly indicated by the turbidity; the formation of small-sized self-assemblies can be confirmed using the transparency of the suspension (XDHPC > 0.6). It was thus shown that there were two types of regions from the viewpoint of turbidity of the solution.

3.2.2. Average Size Estimated Using DLS Analysis

The size distribution of the self-assemblies formed in the DMPC/DHPC mixtures was confirmed using DLS. As an example, the size distribution of the self-assembly at a total lipid concentration of 8 mM is shown in Figure 3a. In all the conditions tested, a mono-dispersed distribution was obtained. The average size of the self-assembly was affected by the variation in the XDHPC value. As shown in Figure 3b, the average size of the DHPC/DMPC assembly was plotted against the DHPC fraction at various concentrations of total lipids. Self-assemblies with larger sizes (>1 μm) were obtained for lower DHPC fractions (XDHPC < 0.3–0.4) at high total lipid concentrations (10–20 mM). In contrast, the average sizes were 10–20 nm when the XDHPC was higher than 0.4. A similar tendency was observed for a total lipid concentration of 8 mM, except for the self-assembly with XDHPC = 0.4. With a threshold value of 100 nm, self-assemblies were size-dependently classified: larger-sized assemblies (>100 nm) as Region (i) and smaller-sized assemblies (10–20 nm) as Region (ii). The critical XDHPC values are denoted as dotted lines in Figure 3b, and a similar tendency was observed in OD500 analysis (Figure 2). Particularly, in Region (ii), a self-assembly with a much smaller size (less than 10 nm) was observed at a high DHPC fraction (XDHPC: ~0.95).
Although the OD500 values cannot provide precise information about self-assembly size, an increase (or decrease) in the OD500 value is suitable evidence to confirm the transformation of one state to another, especially in a continuous measurement (heating/cooling and dilution). Hence, the self-assembly that appeared in Region (i) was considered a vesicle, and that in Region (ii) as a micelle or micelle-like small assembly (i.e., bicelle). In the case of the DMPC/DHPC bicelle, a jump in the OD500 value was observed upon heating [7], and can be applied to judge the existence of the bicelle. Among the self-assemblies categorized in Region (ii), two samples were picked to investigate dynamic changes in the OD500 values upon heating (Figure S1 in the Supporting Information). At a total lipid concentration of 20 mM, the DMPC/DHPC assembly with XDHPC = 0.4 showed a significant increase in the OD500 value at 30 °C. At XDHPC = 0.95, the OD500 value did not significantly vary upon heating and cooling, showing that the assembly state of the DMPC/DHPC assembly at XDHPC = 0.95 was stable, as a micelle. It has been reported that a bicelle in an aqueous solution is not very stable; it transforms into a vesicle-like structure upon heating, and reversibly transforms into a bicelle upon cooling [36].
In summary, it was estimated that a vesicle could form at Region (i), whereas a micelle or bicelle could form at Region (ii). Although it is difficult to distinguish a bicelle and micelle based on their sizes, a variation in the OD500 can be a clue to identify bicelle formation. Considering these findings, the self-assemblies in Region (ii) were further categorized into Region (ii-1) (i.e., bicellar assembly) and Region (ii-2) (i.e., micellar assembly). To obtain more appropriate evidence, the interfacial properties can be helpful.

3.3. Interfacial Membrane Properties of DMPC/DHPC Assemblies

DPH and Laurdan are widely used as membrane-bound fluorescent probes, and indicate membrane fluidity and membrane polarity, respectively. The combined use of DPH and Laurdan has been successful in investigating the membrane properties of various kinds of self-assemblies, except those of bicelles [24,35,37]. It is hence worthwhile to investigate the membrane fluidity and polarity of DMPC/DHPC assemblies of various compositions and concentrations.

3.3.1. Membrane Fluidity (1/PDPH)

DPH is a non-polar molecule, which could be inserted into both the DHPC micelle and the DMPC vesicle. By monitoring the fluorescence polarization of DPH as a parameter (1/PDPH), the disordered state (liquid-crystalline phase, 1/PDPH > 6) and gel phase (1/PDPH < 6) can be distinguished [24]. The membrane fluidities (1/PDPH) of DMPC/DHPC assemblies were investigated as shown in Figure 4. At a total lipid concentration of 20 mM, an increase in 1/PDPH values (>6) was observed at high DHPC fractions (XDHPC > 0.77). At a total lipid concentration less than 15 mM, an increase in the values was observed at DHPC fractions higher than 0.91. Region (ii) could be further divided into two regions: Region (ii-1) with 1/PDPH < 6 and Region (ii-2) with 1/PDPH > 6. The pure micelle of DHPC was categorized as Region (ii-2), revealing the disordered state of the micelle membrane. In Region (ii-1), the self-assemblies are small, and their membranes are in ordered states. Such ordered states could be due to the enrichment of DMPC because only DMPC molecules can possibly form a gel-phase bilayer at this composition. Thus, in Region (ii-1), the DMPC/DHPC assemblies were shown to form ordered phases such as a gel phase, showing that the DMPC/DHPC bicelle was consistent with the ordered bilayer. The critical value of DHPC fraction to distinguish the two regions gradually shifted from XDHPC = 0.7 (15–20 mM in total lipid concentration) to 0.9 (1 mM). DPH prefers to bind to the ordered phase [24]; therefore, the DMPC/DHPC assemblies with 1/PDPH value higher than 6 were completely in a disordered state, similar to the liquid-crystalline phase.

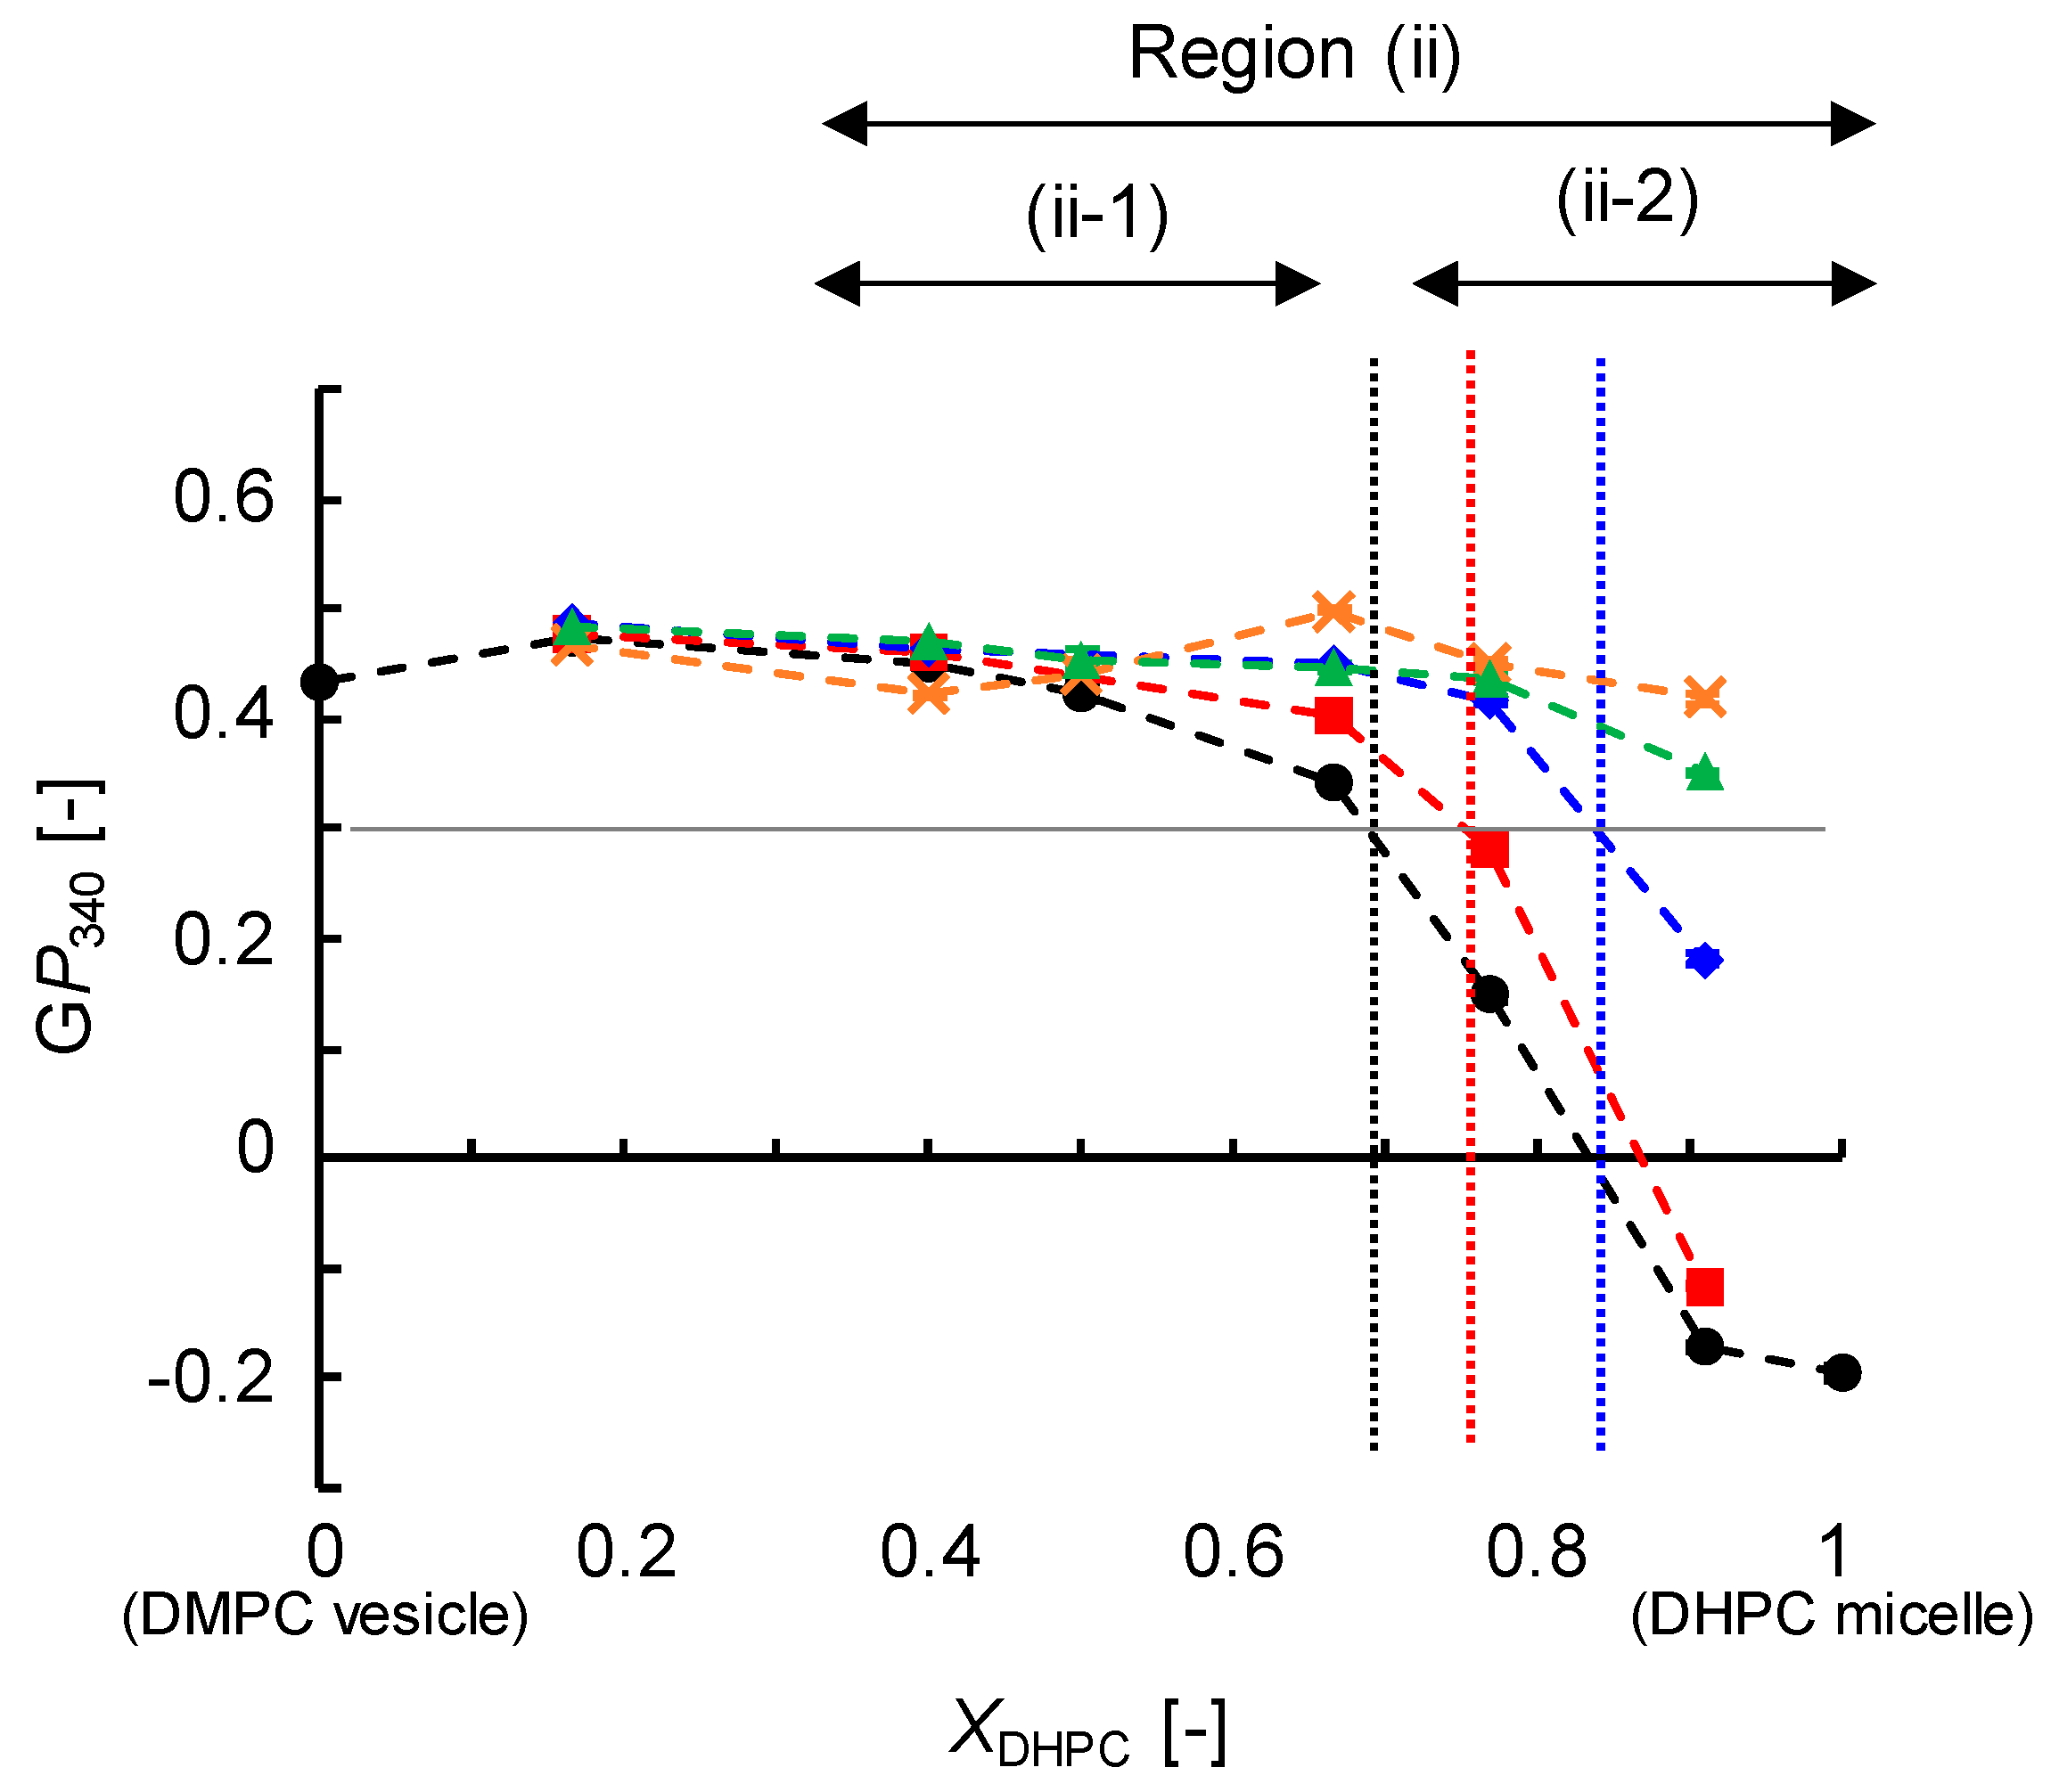
3.3.2. Membrane Polarity (GP340)

In DMPC/DHPC assemblies with XDHPC > 0.77 (at 20 mM), the DMPC molecules did not form a gel phase (Figure 1b). In other words, the micellar structures were not perturbed by the presence of relatively longer acyl chain molecules (DMPC) at XDHPC values > 0.77, suggesting that DMPC molecules, having longer acyl chains as compared to DHPC, are able to diffuse in micelle membranes freely. Laurdan, having a C12 hydrocarbon chain, can also diffuse in the self-assembly membrane freely, and its emission spectrum can be used to monitor the polar environment of each DMPC/DHPC assembly.
According to the packing of the lipid membrane, the emission properties of Laurdan can vary; thus, Laurdan is widely used to investigate the microscopic polarity at the lipid membrane interface [35]. At any concentration of total lipids, the GP340 values did not change at low DHPC fractions (XDHPC < 0.4) (Figure 5). However, the GP340 values varied depending on the total lipid concentration. In this study, the GP340 values of DMPC vesicle and DHPC micelle were used as the standard: DMPC vesicle, GP340 = 0.40 (gel phase); DHPC, GP340 = −0.20 (disordered phase). With high total lipid concentrations (15 and 20 mM), the GP340 values slightly increased at the range of 0 < XDHPC < 0.5, suggesting a more ordered state (Region (ii-1), bicelle). The GP340 values gradually decreased in proportion to the DHPC fraction at XDHPC > 0.6. At the middle concentration levels (8–10 mM), the GP340 values were constant at 0 < XDHPC < 0.8, and varied at XDHPC > 0.8. The results of the GP340 analysis were also helpful to identify the bicelle and micelle of DMPC/DHPC assemblies at total lipid concentrations less than 20 mM. The coexistence of DHPC could disturb the ordered properties of the DMPC vesicle [38]. As compared to the pure DMPC vesicle, a slight increase in GP340 values was observed for DMPC/DHPC assemblies at XDHPC of 0.33 or 0.4, suggesting more ordered (tightly packed) states of these membranes. The Laurdan emission spectrum was further analyzed by deconvolution (Figure S2 in the Supporting Information). At XDHPC values of 0.33 and 0.4, the area fraction of λ2 (440 nm) was slightly higher than that of pure DMPC, revealing a more stable gel phase in the bilayer region of the DMPC/DHPC assembly.

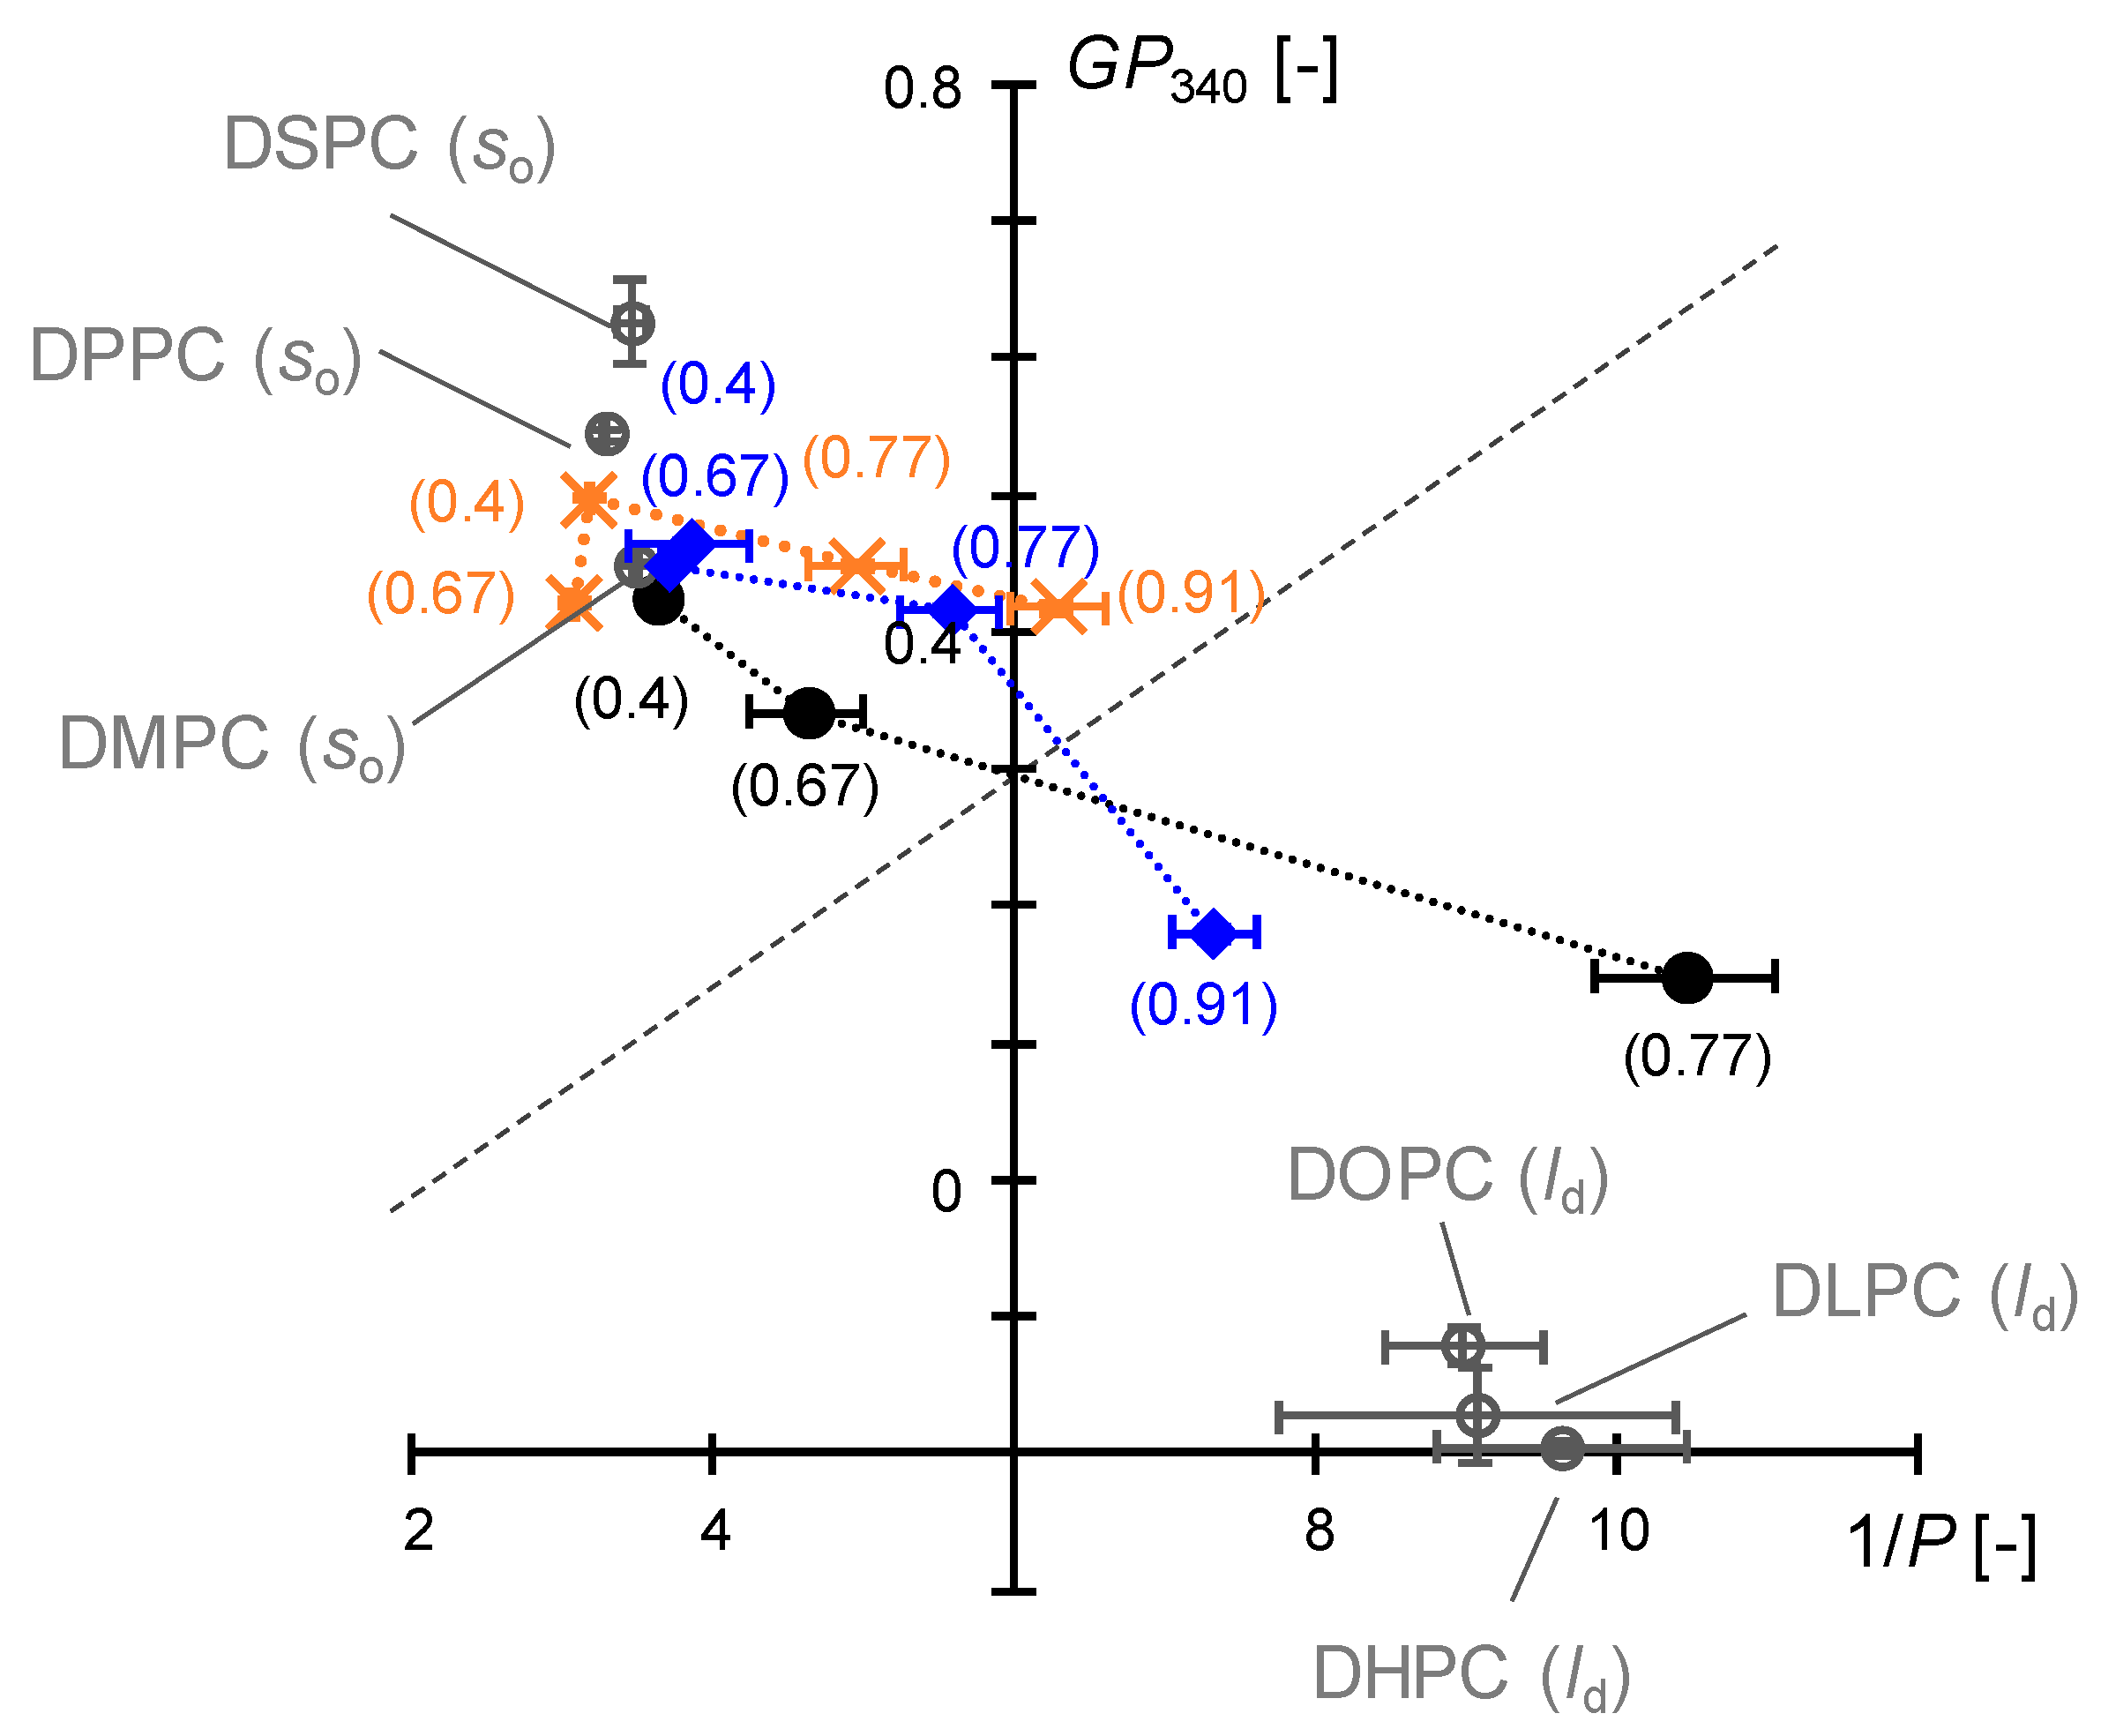
3.3.3. Comparison of Interfacial Membrane Properties in the Cartesian Diagram

By combining the information obtained from each fluorescent probe (DPH and Laurdan), the phase state and phase separation behavior of the membrane can be systematically discussed [22,23,24,28]. The phase state (ordered phase or disordered phase) of the membrane can be investigated based on the positioning of the obtained data in the Cartesian diagram, where the quadrants are set using the transition of the membrane properties (polarity (y-axis) and membrane fluidity (x-axis)) [24]. By plotting the data obtained from each self-assembly system, the interfacial membrane properties of various kinds of self-assemblies can be directly compared [23,28]. The details are summarized in our previous work (see the supporting materials of Bui et al. [22]). In Figure 6, the DHPC membranes show a significantly higher membrane fluidity and a low GP340 value, which appeared in the boundary region of the first (partially disordered state) and fourth quadrants (fully disordered state). This clearly reveals that the DHPC micelle membrane is in a disordered state, showing higher fluidity.
For DMPC/DHPC assemblies with various XDHPC and total lipid concentrations, the obtained GP340 and 1/PDPH values were plotted in the Cartesian diagram, together with some standard data (obtained from liposomes, in our previous work). The data for the DMPC/DHPC mixtures (20 mM) at rather low DHPC fractions (XDHPC = 0.4 and 0.67) were plotted in the second quadrant, suggesting that these self-assemblies had an ordered bilayer as well as DMPC vesicles in the gel phase. In contrast, at XDHPC = 0.77, the data position was in the first quadrant. This indicates that the membrane fluidity was higher than that of the DHPC micelle, whereas the membrane was less hydrated as compared to the micelle. Since DHPC can behave as a detergent (surfactant), a mixed micelle [39,40] might be formed in DMPC/DHPC mixture systems, but it is still difficult to compare the difference between a bicelle and mixed micelle. The variation in the membrane properties at XDHPC = 0.7 suggests that the assemblies were in disordered phases. It was difficult to distinguish the bicelle and micelle based on their sizes; in contrast, their interfacial membrane properties were clearly different. Hence, the DMPC/DHPC assemblies with XDHPC ≥ 0.77 were in a disordered phase, wherein DMPC molecules did not form (ordered) a bilayer. In addition to the unique structural characteristics of the bicelle, the interfacial properties also contribute to the investigation of the “ordered state” of the bicelle composed of DMPC/DHPC mixtures.
Limited to DMPC/DHPC systems, the bicelle assemblies required the interfacial membrane properties of the gel phase. By defining these assemblies as “gel-bicelles,” a micelle (Region (ii-2)) and gel-bicelle (Region (ii-1)) can be clearly distinguished based on their interfacial properties. Similarly, a systematic characterization was carried out for the DMPC/DHPC assemblies at total lipid concentrations of 1-10 mM. While the 1/PDPH and GP340 values at XDHPC = 0.77 slightly changed, the interfacial membrane properties of the assemblies with XDHPC of 0.4 and 0.67 remained constant. In vesicle systems, the GP340 values varied depending on the temperature: GP340 > 0.3 in gel phase (T < Tm), and GP340 > −0.2 in fluid phase (T > Tm) [4]. The GP340 value gradually decreases at temperatures slightly higher than the Tm. When the GP340 value is lower than 0.3, the membrane is heterogeneous (under phase transition, coexistence of two phases). These results imply that ordered membranes (1/PDPH < 6, GP340 > 0.3) were maintained at XDHPC of both 0.4 and 0.67, at low total lipid concentrations. This is the first investigation of the interfacial membrane properties of DMPC/DHPC assemblies. We found that the bicelle membranes (Region (ii-1)) are in ordered states; the bilayer membranes are tightly packed as well as or better than the pure gel phase of DMPC vesicles.

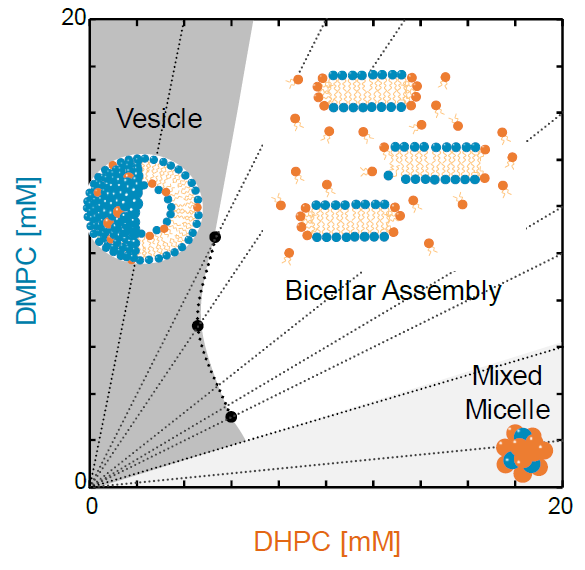
3.4. Discussion on Phase Behavior of DMPC/DHPC Assemblies

DMPC/DHPC self-assemblies were classified into three categories: Region (i), Region (ii-1), and (ii-2). The assemblies of Region (ii-1) were small micelles, which exhibited an ordered phase similar to that of the gel-phase vesicles. Hence, they can be considered as gel-phase bicelles. The phase behavior of the DMPC/DHPC assemblies at 20 °C is shown as a diagram (Figure 7). The self-assemblies at Region (i) were observed, typically, with excess DMPC and less DHPC, due to which the DMPC/DHPC mixtures could form vesicles independent of the total lipid concentration. On the contrary, the transparent solutions including the self-assemblies of small size (less than 10 nm) were observed in the condition with excess DHPC and less DMPC (Region (ii-2)). These concentration levels correspond well with the well-known and usual conditions to prepare the DMPC liposome and DHPC micelle.
There is an extra region to obtain self-assembly with certain characteristics such as transparent solution, small size (10–20 nm), dependence of size on the DHPC fraction, rather ordered properties of surface (plotted at the second quadrant in the Cartesian diagram), and temperature-sensitive behavior of optical density. The gel phase is beneficial to form a planar bilayer; however, it is notable that the essential property of a bicelle should be magnetic orientation originating from its discoidal structure [5]. In the case of the bicelle or discoidal assembly in the TEM image [10], the self-assembly has two different patterns of shapes, such as face-on (sticky image) and edge-on (discoidal image). Together with the findings obtained in this study, a geometric consideration of the self-assembly, focusing on the molar ratio of DHPC and DMPC at Region (ii-1) (DMPC/DMPC = ~1:2–2:1), suggests that a bicelle-like structure could form. Figure 8a shows the TEM image of the DMPC/DHPC assembly with XDHPC = 0.5 (total lipid concentration of 20 mM), revealing a non-spherical shape and rather a discoidal shape. As schematically shown in Figure 8b, since both shapes (face-on and edge-on) could be revealed, the DMPC/DHPC assembly that satisfies a small size (<30 nm) and “ordered” interfacial properties could be considered as a bicelle.

4. Conclusions

We systematically characterized self-assemblies composed of DMPC/DHPC at total lipid concentrations less than 20 mM (<1 wt% lipid). The assemblies were categorized as Region (i), Region (ii-1), and Region (ii-2), in which the dominant state was large vesicle (>30 nm), gel-bicelle (<30 nm, “ordered” interfacial membrane properties), and micelle (<30 nm, “disordered” interfacial membrane properties), respectively. In particular, the bicelles observed in the DMPC/DHPC mixture systems exhibited both low membrane fluidity (1/PDPH < 6) and high membrane polarity (GP340 > 0.3). This reveals that the DMPC/DHPC bicelle structure could be observed only below 23 °C (T < Tm of DMPC) because the mean head group area of DMPC increases and the bilayer packing decreases in the disordered phase. The transparency of the suspension is a good indicator to roughly judge the size of the self-assembly [41]. In the conditions of fixed total lipid concentration, the self-assembly structure could be controlled using the DHPC fraction ratio: bicelle for 0.33 ≤ XDHPC ≤ 0.67 and micelle for XDHPC ≤ 0.77. In the conditions of fixed XDHPC (especially at 0.33 < XDHPC < 0.4), dilution leads to transformation from bicelle to vesicle, with significant increase in turbidity. The findings of this study are summarized in a diagram, which reveals the phase behavior of DMPC/DHPC assemblies at 20 °C. Bicelle assemblies can be used as lipid sources in supported lipid bilayer preparation [20]. Based on the phase equilibrium, DHPC molecules can be excluded from bicelle membranes by dilution. Utilizing this, bicelle assemblies can be applied for a continuous vesicle preparation process flow system.

Supplementary Materials

The following are available online at https://www.mdpi.com/2504-5377/2/4/73/s1, Figure S1: Temperature dependence on turbidity (OD500) of 20 mM DMPC/DHPC self-assembly; XDHPC = 0.17 (Region (i)), 0.4 (Region (ii-1)), and 0.95 (Region (ii-2)). This experiment was conducted in turn heating (20 ºC (black) → 30 ºC (red)) to cooling (30 ºC (red) → 20 ºC (blue)). Figure S2: Spectra of Laurdan in each 20 mM DMPC/DHPC membrane at 20 ºC. (a) XDHPC = 0.17 (Region (i)). (b) XDHPC = 0.4 (Region (ii-1)). (c) XDHPC = 0.95 (Region (ii-2)). The spectra were as follows: (d) XDHPC = 0.17, (e) XDHPC = 0.4 and (f) XDHPC = 0.95 at 8 mM total lipid concentration.

Author Contributions

S.T. and K.S. performed experiments. S.T., K.S., K.H., Y.O., H.-S.J., H.N., and H.U. wrote paper. S.T. and H.U. directed the research.

Funding

This work was supported by the Japan Society for the Promotion of Science (JSPS) KAKENHI Grant-in-Aids for Scientific Research (A) (26249116), for Scientific Research (B) (18H02005), for Scientific Research (C) (26420771), for Young Scientists (B) (16K18279, 15K18279), and for Challenging Exploratory Research (T15K142040). And supported by the Grant-in-Aid for the Sasakawa Scientific Research Grant from the Japan Science Society, JSS (29-218).

Acknowledgments

We thank Takayuki Hirai and Yasuhiro Shiraishi (Graduate School of Engineering Science, Osaka University) for DLS measurement and to Kaoru Mitsuoka (Research Center for Ultra-High Voltage Electron Microscopy, Osaka University) for TEM observation. One of the authors (K.S.) expresses his gratitude for the Multidisciplinary Research Laboratory System of Osaka University.

Conflicts of Interest

There are no conflict of interest to declare.

Abbreviations

DMPC1,2-dimyristoyl-sn-glycero-3-phosphocholine
DHPC1,2-dihexanoyl-sn-glycero-3-phosphocholine
Tmphase transition temperature
CMCcritical micelle concentration
DLSdynamic light scattering
DPH1,6-diphenyl-1,3,5-hexatriene
Laurdan6-dodecanoyl-N,N-dimethyl-2-naphthylamine
GPgeneral polarization
ODoptical density

References

  1. Burns, R.A., Jr.; Roberts, M.F.; Dluhy, R.; Mendelsohn, R. Monomer-to-micelle transition of dihexanoylphosphatidylcholine: 13C and Raman studies. J. Am. Chem. Soc. 1982, 104, 430–438. [Google Scholar] [CrossRef]
  2. Eytan, G.D. Use of liposome for reconstitution of biological functions. Biochim. Biophys. Acta Rev. Biomembr. 1982, 692, 185–202. [Google Scholar] [CrossRef]
  3. Ringsdorf, H.; Schlarb, B.; Venzmer, J. Molecular Architecture and Function of Polymeric Oriented Systems: Models for the Study of Organization, Surface Recognition, and Dynamics of Biomembranes. Angew. Chem. Int. Ed. 1988, 27, 113–158. [Google Scholar] [CrossRef]
  4. Cyrus, S.R.; Kai, E.L. Materials chemistry: Liposomes derived from molecular vases. Nature 2012, 489, 372–374. [Google Scholar]
  5. Sanders, C.R.; Schwonek, J.P. Characterization of Magnetically Orientable Bilayers in Mixtures of Dihexanoylphosphatidylcholine and Dimyristoylphosphatidylcholine by Solid-State NMR. Biochemistry 1992, 31, 8898–8905. [Google Scholar] [CrossRef] [PubMed]
  6. Ottiger, M.; Bax, A. Characterization of magnetically oriented phospholipid micelles for measurement of dipolar couplings in macromolecules. J. Biomol. NMR 1998, 12, 361–372. [Google Scholar] [CrossRef]
  7. McKibbin, C.; Farmer, N.A.; Jeans, C.; Reeves, P.J.; Khorana, H.G.; Wallace, B.A.; Edwards, P.C.; Villa, C.; Booth, P.J. Opsin Stability and Folding: Modulation by Phospholipid Bicelles. J. Mol. Biol. 2007, 374, 1319–1332. [Google Scholar] [CrossRef]
  8. Li, Y.; To, J.; Verdià-Baguena, C.; Surya, S.; Huang, M.; Paulmichl, M.; Liu, D.X.; Aguilella, V.M.; Torres, J. Inhibition of the Human Respiratory Syncytial Virus Small Hydrophobic Protein and Structural Variations in a Bicelle Environment. J. Virology 2014, 88, 11899–11914. [Google Scholar] [CrossRef] [Green Version]
  9. Sanders, C.R.; Landis, G.C. Reconstitution of Membrane Proteins into Lipid-Rich Bilayered Mixed Micelles for NMR Studies. Biochemistry 1995, 34, 4030–4040. [Google Scholar] [CrossRef]
  10. van Dam, L.; Karlsson, G.; Edwards, K. Direct observation and characterization of DMPC/DHPC aggregates under conditions relevant for biological solution NMR. Biochim. Biophys. Acta Biomembr. 2004, 1664, 241–256. [Google Scholar] [CrossRef]
  11. Wu, H.; Su, K.; Guan, X.; Sublette, M.E.; Stark, R.E. Assessing the Size, Stability, and Utility of Isotropically Tumbling Bicelle Systems for Structural Biology. Biochim. Biophys. Acta Biomembr. 2010, 1798, 482–488. [Google Scholar] [CrossRef] [PubMed]
  12. Beaugrand, M.; Arnold, A.A.; Hénin, J.; Warshawski, D.E.; Williamson, P.T.F.; Marcotte, I. Lipid Concentration and Molar Ratio Boundaries for the Use of Isotropic Bicelles. Langmuir 2014, 30, 6162–6170. [Google Scholar] [CrossRef] [PubMed]
  13. Mineev, K.S.; Nadezhdin, K.D.; Goncharuk, S.A.; Areseniev, A.S. Characterization of Small Isotropic Bicelles with Various Compositions. Langmuir 2016, 32, 6624–6637. [Google Scholar] [CrossRef] [PubMed]
  14. Triba, M.N.; Warschawski, D.E.; Devaux, P.F. Reinvestigation by phosphorus NMR of lipid distribution in bicelles. Biophys. J. 2005, 88, 1887–1901. [Google Scholar] [CrossRef] [PubMed]
  15. Ye, W.; Lind, J.; Eriksson, J.; Mäler, L. Characterization of the Morphology of Fast-Tumbling Bicelles with Varying Composition. Langmuir 2014, 30, 5488–5496. [Google Scholar] [CrossRef] [PubMed]
  16. Struppe, J.; Vold, R.R. Dilute Bicellar Solutions for Structural NMR Work. J. Magn. Reson. 1998, 135, 541–546. [Google Scholar] [CrossRef] [PubMed]
  17. Ramos, J.; Imaz, A.; Callejas-Fernández, J.; Barbosa-Barros, L.; Estelrich, J.; Quesada-Pérez, M.; Forcada, J. Soft Nanoparticles (Thermos-responsive Nanogels and Bicelles) with Biotechnological Applications: From Synthesis to Simulation Through Colloidal Characterization. Soft Matter 2010, 7, 5067–5082. [Google Scholar] [CrossRef]
  18. Matsui, R.; Ohtani, M.; Yamada, K.; Hikima, T.; Takata, M.; Nakamura, T.; Koshino, H.; Ishida, Y.; Aida, T. Chemically Locked Bicelles with High Thermal and Kinetic Stability. Angew. Chem. Int. Ed. 2015, 54, 13284–13288. [Google Scholar] [CrossRef]
  19. Saleem, Q.; Zhang, Z.; Petretic, A.; Gradinaru, C.C.; Macdonald P., M. Single Lipid Bilayer Deposition on Polymer Surfaces Using Bicelles. Biomacromol. 2015, 16, 1032–1039. [Google Scholar] [CrossRef] [PubMed]
  20. Kolahdouzan, K.; Jackman, J.A.; Yoon, B.K.; Kim, M.C.; Johal, M.S.; Cho, N.-J. Optimizing the Formation of Supported Lipid Bilayers from Bicellar Mixtures. Langmuir 2017, 33, 5052–5064. [Google Scholar] [CrossRef]
  21. Hayashi, K.; Shimanouchi, T.; Kato, K.; Miyazaki, T.; Nakamura, A.; Umakoshi, H. Span80 Vesicles have a More Fluid, Flexible and “Wet” Surface Than Phospholipid Liposomes. Colloid Surf. B 2011, 87, 28–35. [Google Scholar] [CrossRef] [PubMed]
  22. Bui, T.T.; Suga, K.; Umakoshi, H. Roles of Sterol Derivatives in Regulating the Properties of Phospholipid Bilayer Systems. Langmuir 2016, 32, 6176–6184. [Google Scholar] [CrossRef] [PubMed]
  23. Nakamura, H.; Taguchi, S.; Suga, K.; Hayashi, K.; Jung, H.-S.; Umakoshi, H. Characterization of the physicochemical properties of phospholipid vesicles prepared in CO2/water systems at high pressure. Biointerphases 2015, 10, 031005. [Google Scholar] [CrossRef]
  24. Suga, K.; Umakoshi, H. Detection of Nanosized Ordered Domains in DOPC/DPPC and DOPC/Ch Binary Lipid Mixture Systems of Large Unilamellar Vesicles Using a TEMPO Quenching Method. Langmuir 2013, 29, 4830–4838. [Google Scholar] [CrossRef] [PubMed]
  25. Lee, A.G. Lipid-protein interactions in biological membranes: A structural perspective. Biochim. Biophys. Acta Biomembr. 2003, 1612, 1–40. [Google Scholar] [CrossRef]
  26. Gerebtzoff, G.; Li-Blatter, X.; Fischer, H.; Frentzel, A.; Seelig, A. Halogenation of drugs enhances membrane binding and permeation. ChemBioChem. 2004, 5, 676–684. [Google Scholar] [CrossRef] [PubMed]
  27. Ishigami, T.; Suga, K.; Umakoshi, H. Chiral Recognition of L-Amino Acids on Liposomes Prepared with L-Phospholipid. ACS Appl. Mater. Interfaces 2015, 7, 21065–21072. [Google Scholar] [CrossRef] [PubMed]
  28. Iwasaki, F.; Luginbühl, S.; Suga, K.; Walde, P.; Umakoshi, H. Fluorescent Probe Study of AOT Vesicle Membranes and Their Alteration upon Addition of Aniline or the Aniline Dimer p-Aminodiphenylamine (PADPA). Langmuir 2017, 33, 1984–1994. [Google Scholar] [CrossRef] [PubMed]
  29. Sabatini, K.; Mattila, J.-P.; Kinnunen, P.K.J. Interfacial behavior of cholesterol, ergosterol, and lanosterol in mixtures with DPPC and DMPC. Biophys. J. 2008, 95, 2340–2355. [Google Scholar] [CrossRef] [PubMed]
  30. Walter, A.; Vinson, P.K.; Kaplun, A.; Talmon, Y. Intermediate Structures in the Cholate-Phosphatidylcholine Vesicle-micelle Transition. Biophys. J. 1991, 60, 1315–1325. [Google Scholar] [CrossRef]
  31. Guo, Z.; Hauser, N.; Moreno, A.; Ishikawa, T.; Walde, P. AOT Vesicles as Templates for the Horseradish Peroxidase-triggered Polymerization of Aniline. Soft Matter 2011, 7, 180–193. [Google Scholar] [CrossRef]
  32. Craig, A.F.; Clark, E.E.; Sahu, I.D.; Zhang, R.; Frantz, N.D.; Al-Abdul-Wahid, M.S.; Dabney-Smith, C.; Konkolewicz, D.; Lorigan, G.A. Tuning the Size of Styrene-maleic Acid Copolymer-lipid Nanoparticles (SMALPs) using RAFT Polymerization for Biophysical Studies. Biochim. Biophys. Acta Biomembr. 2016, 1858, 2931–2939. [Google Scholar] [CrossRef] [PubMed]
  33. Shintzky, M.; Barenholz, Y. Fluidity parameters of lipid regions determined by flurescence polarization. Biochim. Biophys. Acta Rev. Biomembr. 1978, 515, 367–394. [Google Scholar] [CrossRef]
  34. Vincent, M.; de Foresta, B.; Gallay, J. Nanosecond Dynamics of a Mimicked Membrane-Water Interface Observed by Time Resolved Stokes Shift of LAURDAN. Biophys. J. 2005, 88, 4337–4350. [Google Scholar] [CrossRef] [PubMed]
  35. Parasassi, T.; De Stasio, G.; d’Ubaldo, A.; Gratton, E. Phase fluctuation in phospholipid membranes revealed by Laurdan fluorescence. Biophys. J. 1990, 57, 1179–1186. [Google Scholar] [CrossRef] [Green Version]
  36. Knight, C.; Rahmani, A.; Morrow, M.R. Effect of an Anionic Lipid on the Barotropic Behavior of a Ternary Bicellar Mixture. Langmuir 2016, 32, 10259–10267. [Google Scholar] [CrossRef] [PubMed]
  37. Mély-Goubert, B.; Freedman, M.H. Lipid fluidity and membrane protein monitoring using 1,6-diphenyl-1,3,5-hexatriene. Biochim. Biophys. Acta Biomembr. 1980, 601, 315–327. [Google Scholar]
  38. Takajo, Y.; Matsuki, H.; Matsubara, H.; Tsuchiya, K.; Aratono, M.; Yamanaka, M. Structural and morphological transition of long-chain phospholipid vesicles induced by mixing with short-chain phospholipid. Colloid Surf. B 2010, 76, 571–576. [Google Scholar] [CrossRef] [PubMed]
  39. Kučerka, N.; Nieh, M.-P.; Katsaras, J. Fluid phase lipid areas and bilayer thicknesses of commonly used phosphatidylcholines as a function of temperature. Biochim. Biophys. Acta Biomembr. 2011, 1808, 2761–2771. [Google Scholar] [CrossRef] [PubMed]
  40. Fernández, C.; Hilty, C.; Wider, G.; Wüthrich, K. Lipid-protein Interactions in DHPC Micelles Containing the Integral Membrane Protein OmpX Investigated by NMR Spectroscopy. Proc. Natl. Acad. Sci. USA 2002, 99, 13533–13537. [Google Scholar] [CrossRef] [PubMed]
  41. Matsuzaki, K.; Murase, O.; Sugishita, K.; Yoneyama, S.; Akada, K.; Ueha, M.; Nakamura, A.; Kobayashi, K. Optical characterization of liposomes by right angle light scattering and turbidity measurement. Biochim. Biophys. Acta Biomembr. 2000, 1467, 219–226. [Google Scholar] [CrossRef]
Figure 1. Systematic characterization of DMPC/DHPC assemblies at 20 °C, total lipid concentration of 20 mM. As a function of DHPC fraction (XDHPC), (a) turbidity (OD500) and size distribution. Region (i), relatively large assemblies (OD500 > 1.0, size > 30 nm); Region (ii), relatively small assemblies (OD500 < 0.1, size < 30 nm); (b) membrane fluidity (1/PDPH) and membrane polarity (GP340). Region (ii-1), ordered assemblies (1/PDPH < 6, GP340 > 0.3); Region (ii-2), disordered assemblies (1/PDPH > 6, GP340 < 0.3). (c) Phase diagram of DMPC/DHPC at total lipid concentration of 20 mM. Region (i), closed circle; Region (ii-1), open circle; Region (ii-2), half-tone circle.
Colloids 02 00073 g001
Figure 2. Turbidities (OD500) of DHPC/DMPC solution at different DHPC fraction (XDHPC) in various concentrations of total lipid concentration at 20 mM (circle), 15 mM (square), 10 mM (diamond), 8 mM (triangle), and 1 mM (cross) at 20 °C.
Colloids 02 00073 g002
Figure 3. (a) size distributions of DMPC/DHPC self-assemblies (8mM); 8 mM XDHPC = 0.17 (a-1), 0.4 (a-2), 0.67 (a-3), and 0.95 (a-4); (b) average size of the self-assembly in the solution at different DHPC fractions; total lipid concentration 20 mM (circle), 15 mM (square), 10 mM (diamond), and 8 mM (triangle). A line between the arrows to show the region (i) and (ii), described in the top of figure, indicate the critical DHPC fraction that give a change in the turbidity of the solution, where the turbid solution was changed to the transparent one with increasing DHPC ratio, and region (i) shifts rightward with the dilution.
Colloids 02 00073 g003
Figure 4. Membrane fluidities of DMPC/DHPC assemblies. Total lipid concentration 20 mM (circle), 15 mM (square), 10 mM (diamond), 8 mM (triangle), and 1 mM (cross). The drastic change of each value shows transition of lipid assembling state at 1/PDPH = 6. The vertical dotted line in the figures displays the phase transition region (ii-1)/(ii-2) at each concentration: (ii-1) ordered phase, (ii-2) disordered phase.
Colloids 02 00073 g004
Figure 5. Membrane polarities of DMPC/DHPCassemblies; total lipid concentration 20 mM (circle), 15 mM (square), 10 mM (diamond), 8 mM (triangle), and 1 mM (cross). The drastic change of each value shows transition of lipid assembling state at GP340 = 0.3. The vertical dotted line in the figures displays the phase transition region (ii-1)/(ii-2) at each concentration: (ii-1) ordered phase, (ii-2) disordered phase.
Colloids 02 00073 g005
Figure 6. Comparison of interfacial membrane properties in the Cartesian diagram. T = 20 °C, DMPC/DHPC at 20 mM (filled circle), 10 mM (diamond), and 1 mM (cross). The value in the bracket neighboring to the data point show the DHPC fractions XDHPC. The position plotted in the Cartesian diagram indicates the phase state of each membrane: the first and fourth quadrants for disordered phase, and the second quadrant for ordered (gel) phase. The reference values of various liposomes were plotted on the diagram (empty circle); so: solid ordered phase, lo: liquid ordered phase, ld: liquid disordered phase. The broken line crossing at 1/PDPH = 6 and GP340 = 0.3 is a boundary of ordered phase and partially-disordered phase.
Colloids 02 00073 g006
Figure 7. Phase diagram for DMPC/DHPC assemblies at 20 °C, investigated by systematic characterization. The bold filled squares showed the increasing turbidities each DHPC fractions as the morphological change. The phase boundary concentrations of XDHPC = 0.77, 0.4, and 0.33, are 9 mM, 12 mM, and 16 mM, respectively (described in total lipid concentration). Blue and Orange circles are transparent assemblies due to forming small assemblies. These each had membrane properties; (blue) ordered phase, (orange) disordered phase.
Colloids 02 00073 g007
Figure 8. TEM images of DMPC/DHPC mixture; (a) XDHPC = 0.4, 20 mM, and (b) the image of the bicelle-like structure.
Colloids 02 00073 g008
Table 1. Summary of the results for self-assemblies prepared at different regions.
Size (DLS)Turbidity, OD500Membrane Fluidity, 1/PDPHMembrane Polarity, GP340
Region (i)>30 nm≥0.1<6>0.3
Region (ii-1)≤30 nm<0.1<6>0.3
Region (ii-2)≤9 nm<0.1>6<0.3

