Communication

Self-Alignment Sequence of Colloidal Cellulose Nanofibers Induced by Evaporation from Aqueous Suspensions

1
Institute of Scientific and Industrial Research (ISIR), Osaka University, Mihogaoka 8-1, Ibaraki-shi, Osaka 567-0047, Japan
2
Graduate School of Engineering, Osaka University, Mihogaoka 8-1, Ibaraki-shi, Osaka 567-0047, Japan
*
Author to whom correspondence should be addressed.
Colloids Interfaces 2018, 2(4), 71; https://doi.org/10.3390/colloids2040071
Submission received: 29 November 2018 / Revised: 10 December 2018 / Accepted: 11 December 2018 / Published: 12 December 2018

Abstract

:
Cellulose nanopapers fabricated by drying aqueous colloidal suspensions of cellulose nanofibers (CNFs) have characteristic hierarchic structures, which cause the problem that their optical properties, including their transparency or haze, vary due to the drying processes affecting CNF alignment. It is unclear when and how the colloidal CNFs align in the evaporation–condensation process from the randomly dispersed suspension to form the nanopaper. In this study, we found that the CNFs undergo a self-alignment sequence during the evaporation–condensation process to form chiral nematic nanopaper by observing the birefringence of the drying suspensions from both the top and side for two suspensions with different initial CNF concentrations. The layer structures of the CNFs first form on the surface by condensation of the suspension, owing to water evaporation from the surface. The thickness of the layered structure then increases and the CNFs begin to align within each layer plane, finally forming chiral nematic structures. A birefringence difference also occurs for dried nanopapers with similar transparency or haze because of the initial CNF concentration.

Graphical Abstract

1. Introduction

Cellulose nanofibers (CNFs) with thicknesses of 3–15 nm are extracted from plant cell walls as dilute aqueous colloidal suspensions. After drying treatment, these suspensions create flexible “nanopapers” consisting of 100% CNFs with high transparency and low haze of ~10% [1]. These nanopapers also exhibit lower thermal expansion coefficients [1,2], higher dielectric constants, higher thermal conductivity [2,3], and greater strength [4,5] than glass and other plastic films due to the highly crystalline, rigid CNFs [6,7]. These features allow the construction of flexible printed electronics [8], such as transparent conductive films [9], low-haze electrodes [10], and transistors [11,12]. The highly transparent nanopaper is therefore considered to be the most promising base material for next-generation “paper electronics” [13].
Compared with traditional transparent substances, such as glass and plastic films, nanopaper is a unique transparent material because it has hierarchical structures in which cellulose molecule chains form crystalline CNFs, which aggregate or align to form macroscopic nanopaper. This hierarchy, however, causes a problem—the optical properties of the nanopaper, including the transparency or haze, vary due to the various drying processes affecting CNF alignment [14,15,16]. For example, the transparency of nanopapers prepared by the evaporation–condensation method and vacuum filtration, followed by hot pressing, are substantially different [14]. The drying process is therefore important for determining the assembled structures of CNFs, as well as the optical properties of nanopapers, although the manner in which the CNFs assemble is still unclear. CNF alignment during the evaporation of a uniform suspension still needs to be clarified to determine their assembling sequence.
The aim of this study is to reveal when and how colloidal CNFs three-dimensionally assemble from randomly dispersed CNF suspensions in the evaporation–condensation process to form nanopapers. We chose 2,2,6,6,-tetramethylpiperidine-1-oxyl (TEMPO)-mediated oxidized CNFs, which are the finest nanofibers that give transparent aqueous suspensions. Then, we observed the birefringence change of the drying CNF suspensions to quantify the degree of CNF alignment. The CNF suspensions sometimes show strong birefringence due to the polarizability anisotropy of cellulose molecules [17,18], as well as the self-alignment [19,20]. Through red–green–blue (RGB) whiteness analysis, we determined the step-by-step sequence of CNF alignment by evaporation.

2. Materials and Methods

As the TEMPO-mediated oxidized CNFs, Rheocrysta I-2SX—which was kindly supplied by DKS Co., Ltd. (Kyoto, Japan)—was used as the starting material to produce the CNF suspension. Diluted Rheocrysta with a concentration of ~0.1 wt% was passed through a Star Burst 10 high-pressure water jet system (HJP-25008, Sugino Machine Ltd., Toyama, Japan) 50 times to reduce unfibrillated pulp particles and to prepare a suspension with fully dispersed CNFs (Figure S1). The ~0.087 wt% product was then evaporated to prepare the 0.52 wt% CNF suspension.
Glass cells with dimensions of 3 cm × 3 cm × 7.6 cm were manually prepared with glass slides (S9213, Matsunami Glass Ind., Ltd., Osaka, Japan) for the observation of the evaporation process. The cell surface was hydrophobized by decyltrimethoxysilane (KBM-3103, Shin-Etsu Chemical Co., Ltd., Tokyo, Japan) to prevent the CNFs from adhering to wall surfaces (Figure S2). In brief, decyltrimethoxysilane was dissolved in a mixed solution of ethanol and water (95:5 w/w) to prepare a 2.01 wt% solution. After adding acetic acid to reach a pH of 4~5, the solution was stirred for 3.5 h. The glass cell was then immersed in the solution for 2 h, gently pulled out of the solution, and dried at 105 °C in an oven.
CNF suspensions with initial concentrations of 0.087 and 0.52 wt% were poured into the treated glass cells to give a constant CNF amount of 47 mg. The samples were then placed in an oven at 55 °C and ~10% relative humidity to dry the suspensions, and were observed from above (z direction) and from the side (y direction) through crossed polarizers using a digital microscope (nano.capture, Sightron Japan Inc., Tokyo, Japan). A photo and schematic diagram of the experimental setup are shown in Figure 1.
Successive image capture was programmed with an interval of 5 min. The birefringence images were analyzed by ImageJ software (Version 1.52a, National Institute of Health (NIH), Bethesda, MD, USA) to quantify the frame mean RGB whiteness (values from 0 to 255) of the angle of view for the drying suspensions. The retardation images of the dried nanopapers were taken with an optical microscope (Olympus, Tokyo, Japan) equipped with a birefringence measurement system (WPA-micro, Photonic Lattice, Miyagi, Japan) using a 5× objective lens and WPA-View software (version 2.4.7.0, Photonic Lattice). The mean retardation Γ (nm) was then calculated by averaging the 383 × 287 retardation data for each single retardation image. The average birefringence (n) values of the dried nanopapers were calculated by Γ/d, where d is the nanopaper thickness.
The zeta potential measurement for CNF suspensions were carried out by using a zeta potential analyzer (ELSZ-2000, Otsuka Electronics Co., Ltd, Osaka, Japan). The haze of the dried nanopapers was evaluated using a haze meter (HZ-V3, Suga Test Instruments Co., Ltd., Tokyo, Japan). Thermogravimetric analysis was performed with a Q50N2 thermogravimetric analyzer (TA Instruments Japan Inc., Tokyo, Japan) under a nitrogen atmosphere (60 mL/min) at a heating rate of 5 °C/min. The surface roughness of the nanopapers was determined by atomic force microscopy (AFM, Nanocute, SII Nano Technology Inc., Chiba, Japan) in dynamic force mode.

3. Results and Discussion

The CNFs prepared in this study had a relatively short and rod-like morphology with an averaged thickness of 4.7 ± 1.1 nm, measured through AFM observation (Figure S1). The unfibrillated pulp particles had almost disappeared after passing through a Star Burst. Both the dispersions with the concentrations of 0.087 and 0.52 wt% showed high stability derived from the surface charges with the averaged zeta potentials of −54.9 and −45.6 mV, respectively. These charges are thought to be derived from the TEMPO oxidization treatment introducing carboxyl groups on the CNF surfaces [21,22].
The cellulose molecule shows large intrinsic birefringence owing to polarizability anisotropy [17,18]. Cellulose nanocrystals (CNCs, i.e., acid-hydrolyzed rod-like CNFs) also show strong birefringence by aligning as chiral-nematic liquid crystals [23,24,25]. Therefore, birefringence observation is considered to be the most suitable way of analyzing the assembling mechanism of CNFs during the evaporation–condensation process of CNF suspensions. The dried nanopapers are already known to contain multilayered CNF structures in the through-plane direction [20], as well as being known to have nematic structures [14]. However, the self-assembling processes during drying for fibrous colloids have rarely been analyzed, and a few of these previous studies analyzed the drying process for DNAs or liquid crystalline solutions only from the side view to the evaporation direction [26], and for CNCs in the nanoscale [27]. In this study, to analyze the three-dimensional assembling processes of CNFs to form such macroscopic nanopapers, birefringence images of the top (z direction defined in Figure 1b) and side (y direction) were simultaneously and successively taken by digital microscopes.
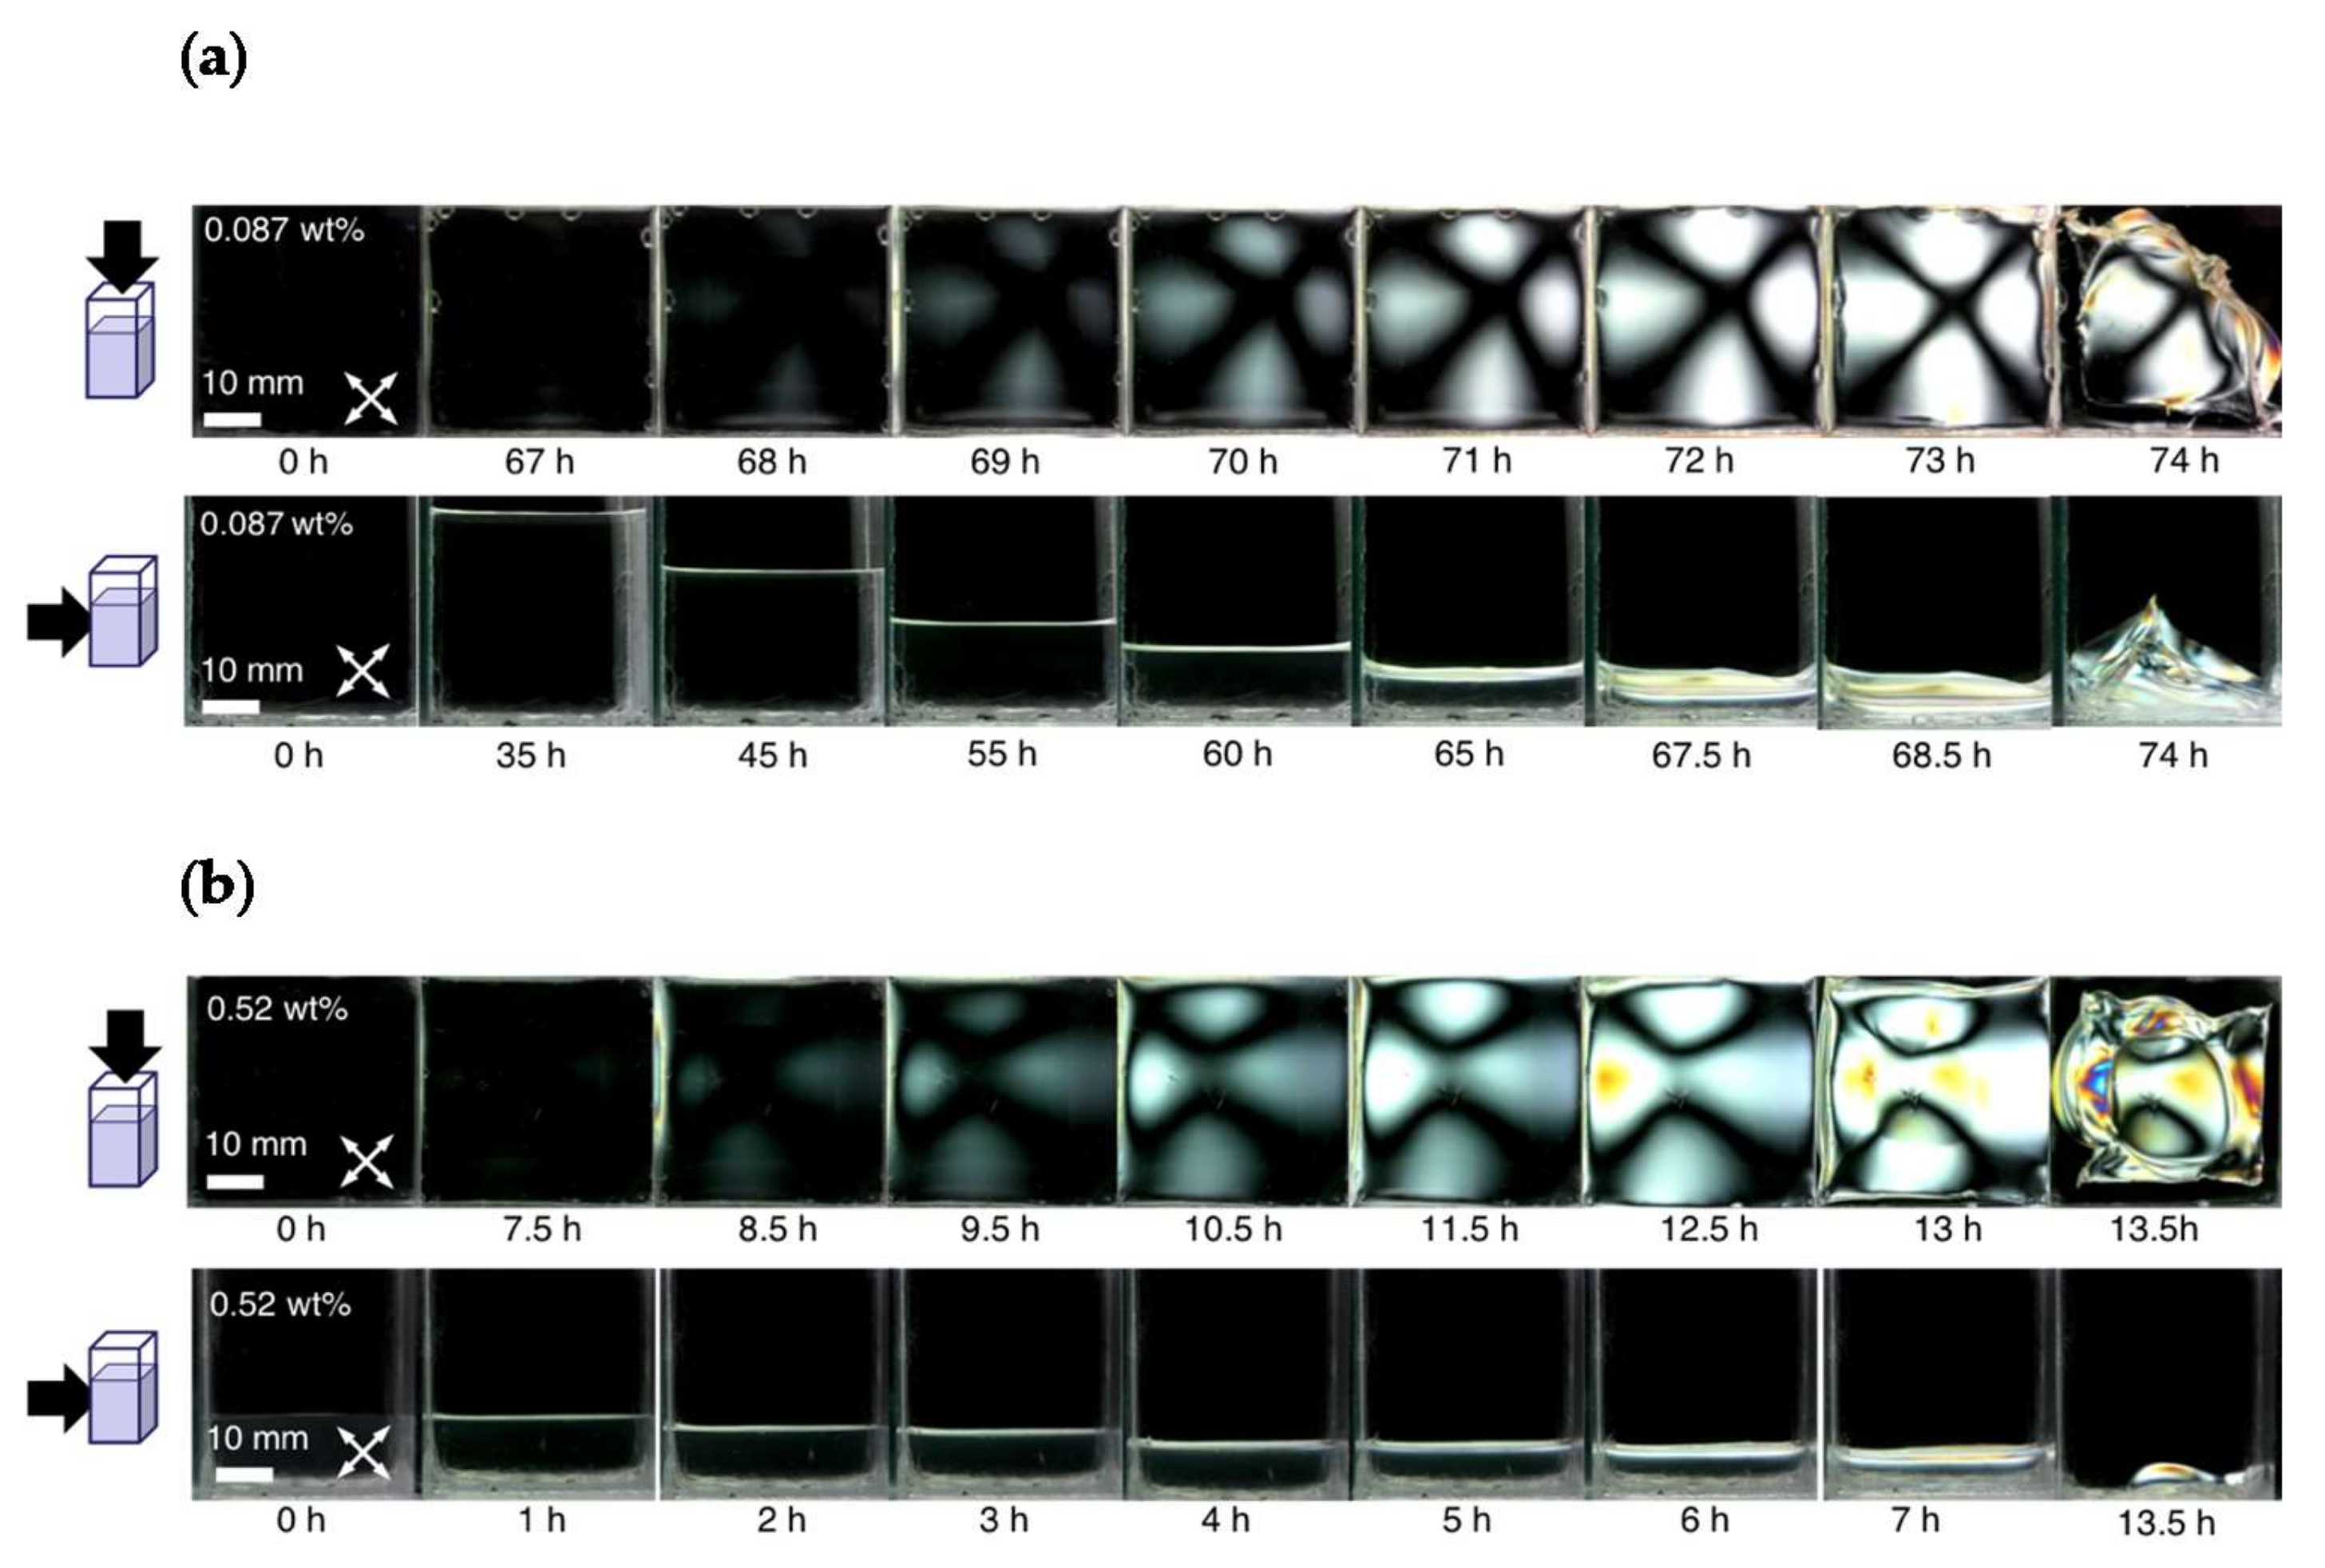
The temporal transitions of the birefringence for the evaporation–condensation of CNF suspensions with initial CNF concentrations (φi) of 0.087 and 0.52 wt%, which contain 47 mg CNFs, are shown in Figure 2. The birefringence intensity expressed as the whiteness and the area expanded with increasing evaporation time for both suspensions. In the top-view images, birefringence occurred in almost the complete area of the glass cells and showed Maltese cross-like shadows, which correspond to the two polarizing axes. In contrast, birefringence only occurred in a thin layer near the surface of the suspensions in the side-view images.
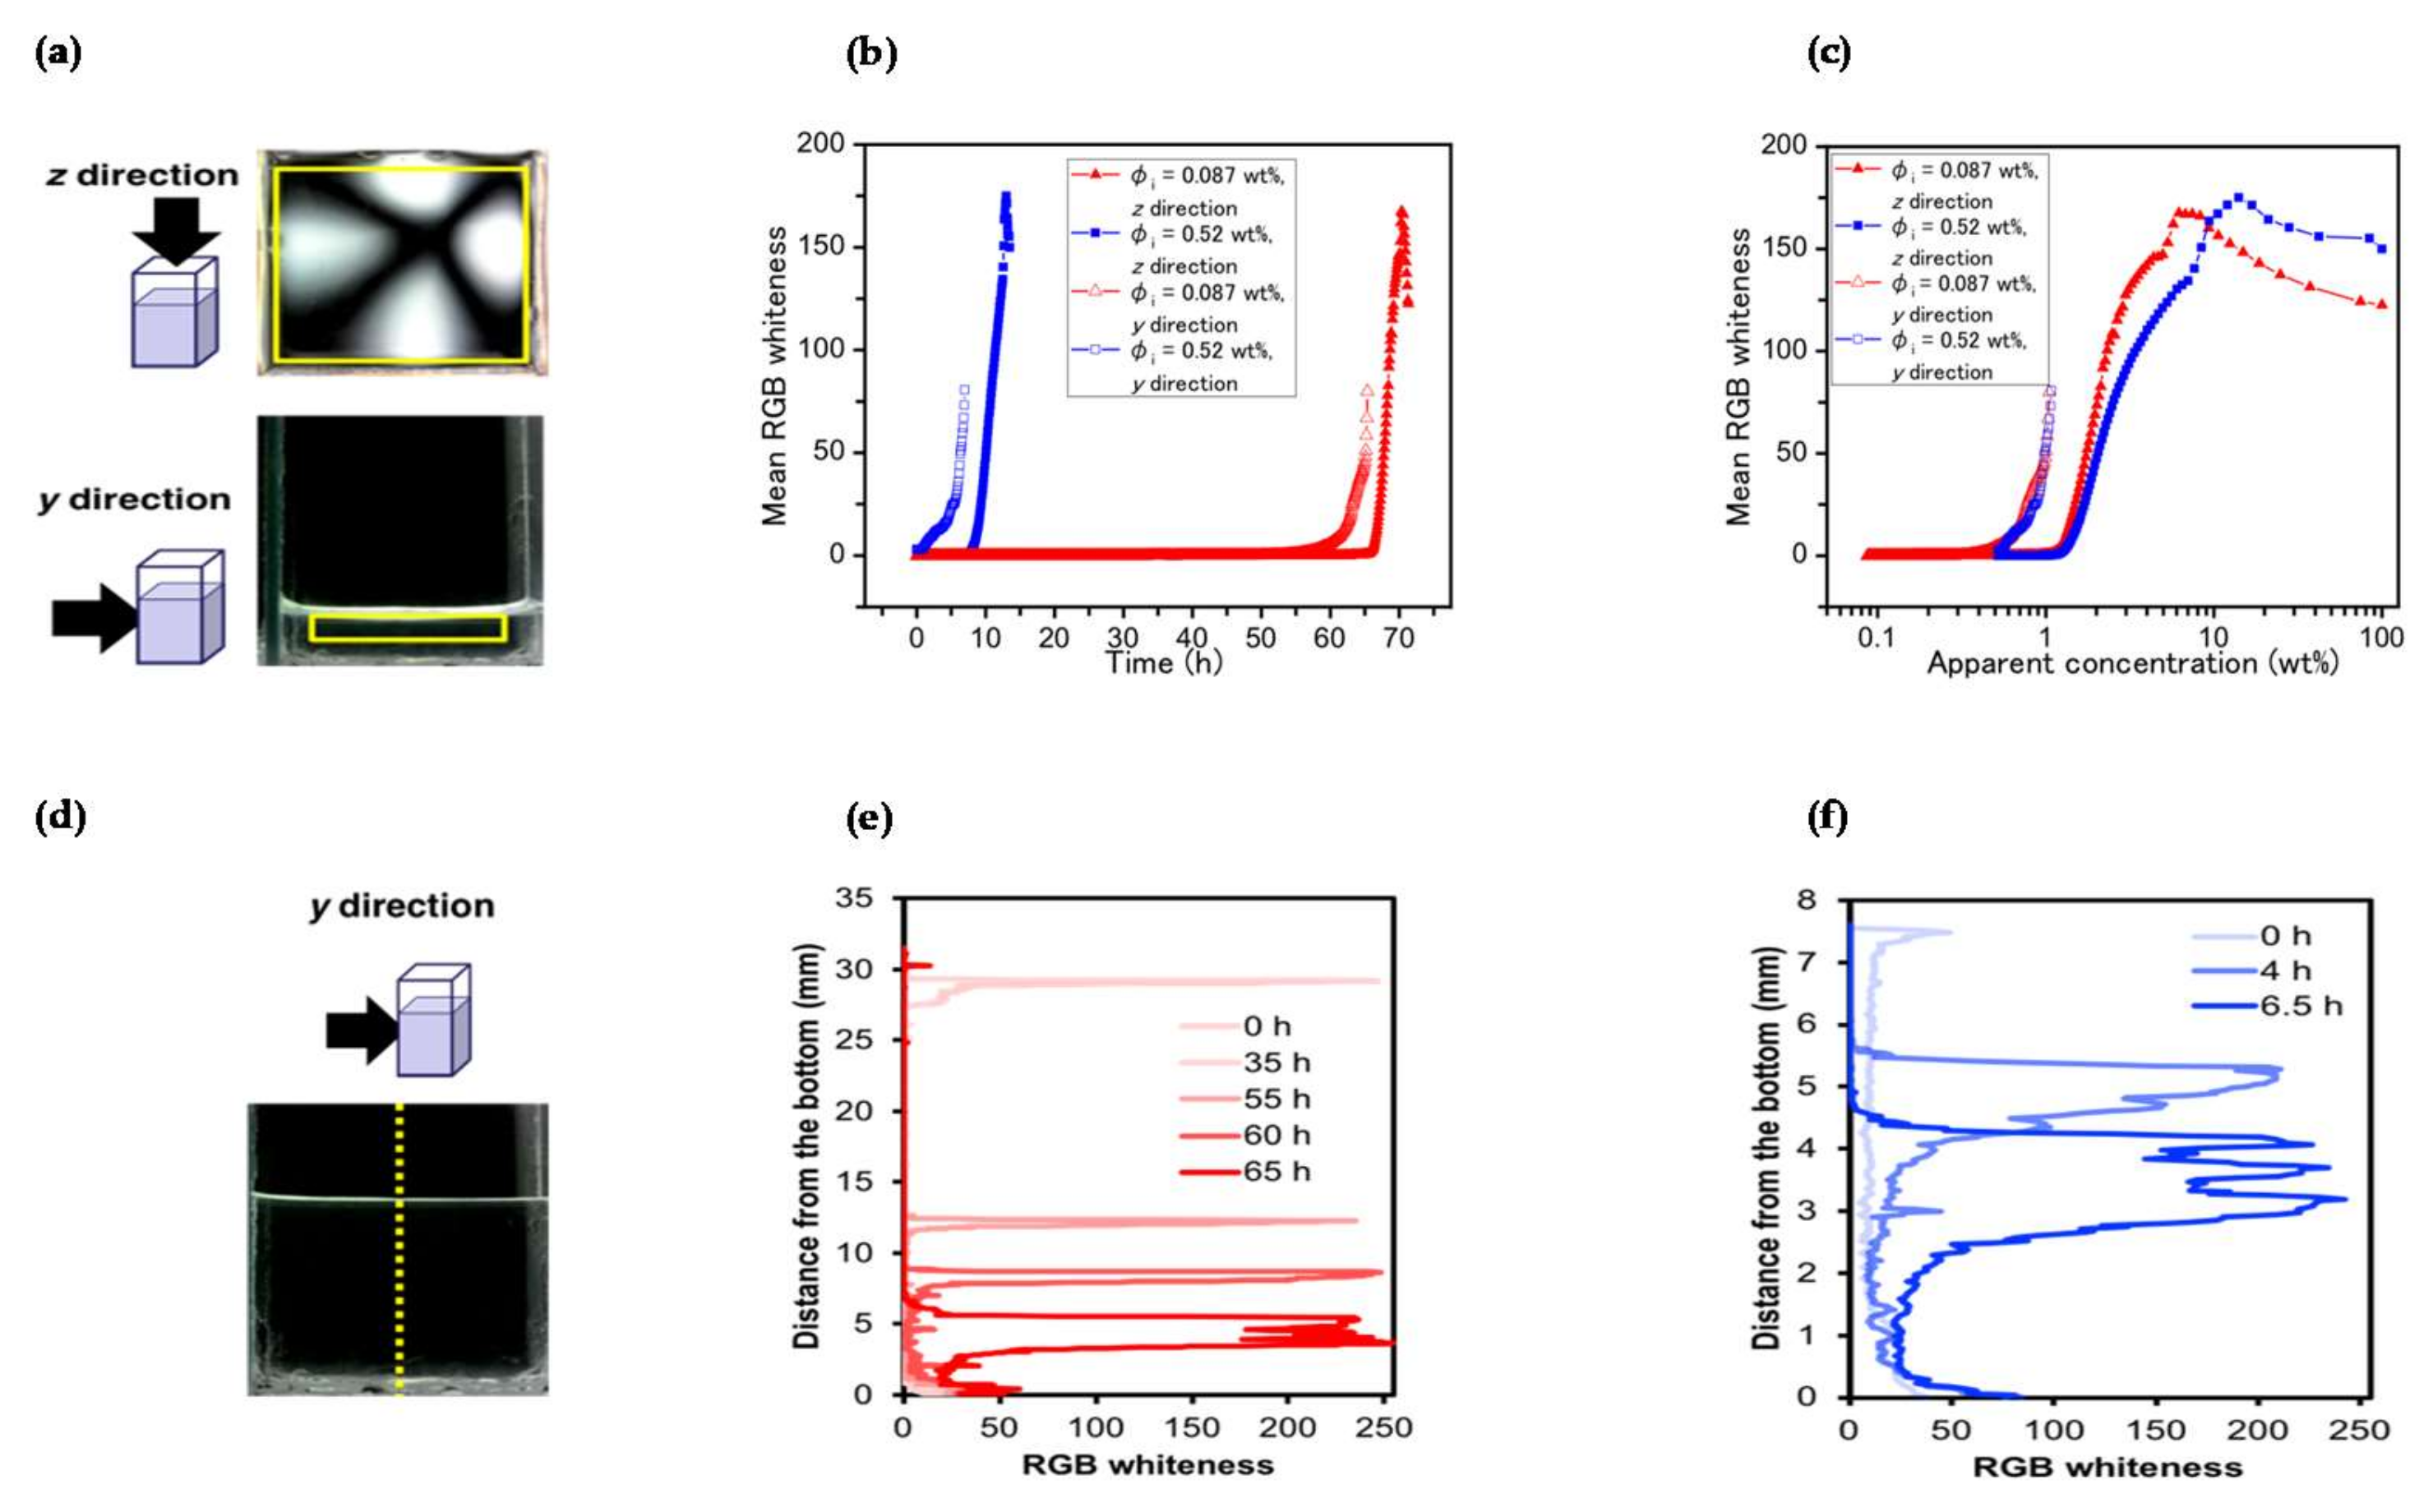
To quantify the degree of birefringence, we analyzed the mean RGB whiteness of the birefringence images during evaporation (Figure 3a). For both of the suspensions (φi = 0.087 and 0.52 wt%), the RGB whiteness exponentially increased just before the completion of the drying process (Figure 3b). This indicates that the birefringence occurred in the final part of the evaporation–condensation process for the CNF suspensions. For both of the suspensions, birefringence occurred in the y direction at a lower apparent concentration than that in the z direction (Figure 3c). The timings of CNF assembly were different in the y and z directions. Interestingly, despite the different φi values, birefringence occurred at similar apparent concentrations. For the suspensions with φi = 0.087 and 0.52 wt%, birefringence occurred in the y direction at apparent concentrations of 0.57 and 0.55 wt%, and in the z direction at apparent concentrations of 1.26 and 1.33 wt%, respectively, which were estimated using the linear fitting method (Figure S3).
To investigate the height distribution of birefringence along the glass cell walls, the linear intensity of the RGB whiteness was analyzed (Figure 3d). Local high-intensity birefringence was observed just below the liquid levels for both suspensions (Figure 3e,f). Birefringence started to occur in the y direction at the liquid surfaces, which indicates that the layered structure of CNFs forms by their condensation at the liquid levels by evaporation. In addition, these bright layers become thicker as evaporation progresses. The local brightness is mainly due to the birefringence of the structured CNFs.
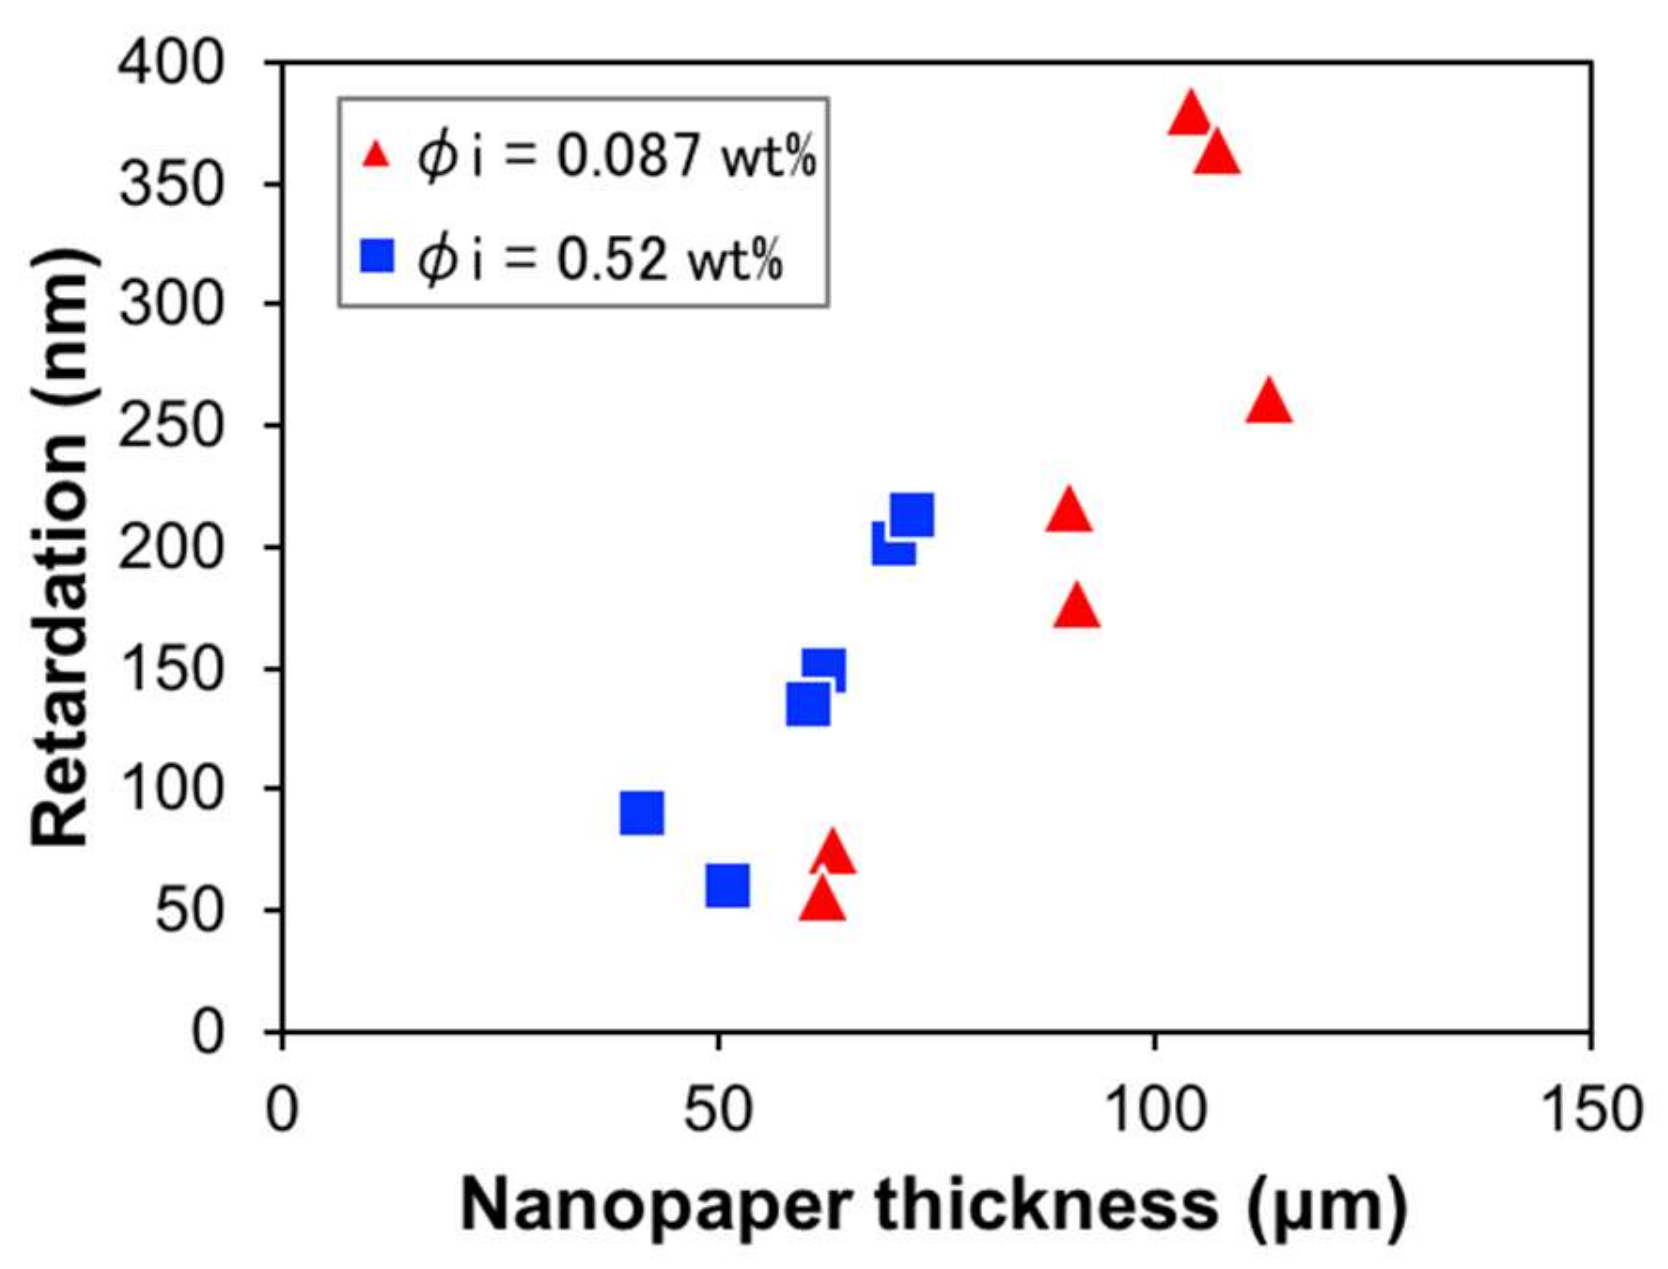
Based on the birefringence behaviors in the y and z directions described above, we wanted to reveal when and how the colloidal CNFs three-dimensionally assemble in the evaporation–condensation process. The self-alignment process of the CNFs is shown in Figure 4. According to the results shown in Figure 3e,f, as the initial suspension with uniformly dispersed CNFs (Figure 4a) evaporated, a layered structure of condensed CNFs started to form (Figure 4b). At this time, the CNFs did not align within the layer planes because birefringence in the z direction was not observed (Figure 3c). As evaporation progressed, the thickness of the condensed layer increased and the CNFs started to align within the layer planes at an apparent CNF concentration above ~1.3 wt% (Figure 4c). Birefringence was observed in the complete area in the z direction (Figure 2), which indicates that the CNF alignment axes distribute to 360° along the plane. Namely, by taking into account the results that our CNFs had a relatively short and rod-like morphology (Figure S1) in addition to the results of previous studies reporting that the dried nanopapers consisted of layered structures with the chiral nematic phase of CNFs [14,23,24,25], it can be established that the chiral nematic phase forms in the suspension at this time, and the suspension dries into chiral nematic nanopaper (Figure 4d). The dried nanopapers in this study were found to exhibit retardation in proportion to the thickness (Figure 5). The thicker parts of the nanopapers have greater retardation values. This fact also supports the structure of these nanopapers consisting of unidirectional CNF layers having their own birefringence.
The dried nanopapers obtained in this study showed similar optical and thermal properties. The average birefringences calculated by the retardation divided by the thickness were 2.26 ± 0.95 and 2.32 ± 0.58 for the nanopapers obtained from φi = 0.087 and 0.52 wt% suspensions, respectively. The birefringence also depends on the thickness. Similar to the retardation, thicker nanopaper showed larger birefringence, but the birefringence of the nanopaper obtained from the φi = 0.52 wt% suspension was slightly larger than that of the nanopaper obtained from the φi = 0.087 wt% suspension (Figure 5). Regardless of the initial CNF concentration, the nanopapers obtained from the φi = 0.087 and 0.52 wt% suspensions had similar properties, including haze values of 5.92% and 6.08%, 5% weight reduction temperatures of 203.3 and 203.8 °C, and surface roughness values determined by the maximum difference in the height of 23.2 and 37.7 nm, respectively (see Figure S4). These values were found to be comparable to the previous reports on thermal degradation temperature [28], and surface roughness [29], although the haze values depended on the nanopaper thickness. The φi value was found to cause the retardation difference of the dried nanopapers even though they showed similar transparency or haze.

4. Conclusions

Birefringence observation of the top and side of CNF suspensions reveals that the CNFs in the suspensions undergo a self-alignment sequence to form the chiral nematic phase during the evaporation–condensation process. When the uniform aqueous suspension of CNFs begins to statically evaporate, layer structures of CNFs first form on the surface of the suspension at an apparent concentration of 0.5–0.6 wt%. As drying progresses to an apparent CNF concentration of ~1.3 wt%, the CNFs within the surface layers begin to align, forming nematic structures with chirality, where the aligning axes are different between the layers. The dried CNFs form nanopaper with chiral nematic layers, where the birefringence depends on the thickness. The initial CNF concentration causes a birefringence difference for the dried nanopapers. These fundamental findings will aid in the preparation of optimal nanopapers and the control of their optical properties for future electronic devices requiring transparent films.

Supplementary Materials

The following are available online at https://www.mdpi.com/2504-5377/2/4/71/s1, Figure S1: AFM image of the CNFs used in this study, Figure S2: Birefringence images of the dried nanopapers in the y direction, Figure S3: Estimation of the apparent concentration at which the birefringence starts to occur by linear fitting, Figure S4: Appearance, thermogravimetric profiles, and AFM images of the dried nanopapers.

Author Contributions

Conceptualization, K.U., T.K., and M.N.; methodology, K.U.; formal analysis, S.I. and K.U.; investigation, S.I. and T.K.; data curation, S.I.; writing—original draft preparation, K.U., H.K., and M.N.; visualization, K.U. and S.I.; supervision, H.K. and M.N.; funding acquisition, K.U., H.K., and M.N.

Funding

This research was partly supported by the JST-Mirai R&D Program (grant number JPMJMI17ED to M.N.) of the Japan Science and Technology Agency (JST), JSPS KAKENHI (grant numbers 17K18169 to K.U. and JP26220908 to M.N.) of the Japan Society for the Promotion of Science (JSPS), and the Cooperative Research Program “CORE Lab.” (grant number 20186002 to H.K.) of the Network Joint Research Center for Materials and Devices: Dynamic Alliance for Open Innovation Bridging Human, Environment, and Materials.

Acknowledgments

The authors thank DKS Co. Ltd. for kindly supplying the Rheocrysta suspensions. We thank Edanz Group (www.edanzediting.com/ac) for editing a draft of this manuscript.

Conflicts of Interest

The authors declare no conflict of interest.

References

  1. Hsieh, M.C.; Koga, H.; Suganuma, K.; Nogi, M. Hazy Transparent Cellulose Nanopaper. Sci. Rep. 2017, 7, 41590. [Google Scholar] [CrossRef] [PubMed] [Green Version]
  2. Uetani, K.; Okada, T.; Oyama, H.T. In-Plane Anisotropic Thermally Conductive Nanopapers by Drawing Bacterial Cellulose Hydrogels. ACS Macro Lett. 2017, 6, 345–349. [Google Scholar] [CrossRef]
  3. Uetani, K.; Okada, T.; Oyama, H.T. Crystallite Size Effect on Thermal Conductive Properties of Nonwoven Nanocellulose Sheets. Biomacromolecules 2015, 16, 2220–2227. [Google Scholar] [CrossRef] [PubMed]
  4. Henriksson, M.; Berglund, L.A.; Isaksson, P.; Lindstrom, T.; Nishino, T. Cellulose Nanopaper Structures of High Toughness. Biomacromolecules 2008, 9, 1579–1585. [Google Scholar] [CrossRef] [PubMed] [Green Version]
  5. Zhu, H.; Zhu, S.; Jia, Z.; Parvinian, S.; Li, Y.; Vaaland, O.; Hu, L.; Li, T. Anomalous scaling law of strength and toughness of cellulose nanopaper. Proc. Natl. Acad. Sci. USA 2015, 112, 8971–8976. [Google Scholar] [CrossRef] [PubMed] [Green Version]
  6. Saito, T.; Kuramae, R.; Wohlert, J.; Berglund, L.A.; Isogai, A. An ultrastrong nanofibrillar biomaterial: The strength of single cellulose nanofibrils revealed via sonication-induced fragmentation. Biomacromolecules 2013, 14, 248–253. [Google Scholar] [CrossRef] [PubMed]
  7. Iwamoto, S.; Kai, W.; Isogai, A.; Iwata, T. Elastic Modulus of Single Cellulose Microfibrils from Tunicate Measured by Atomic Force Microscopy. Biomacromolecules 2009, 10, 2571–2576. [Google Scholar] [CrossRef]
  8. Hoeng, F.; Denneulina, A.; Bras, J. Use of nanocellulose in printed electronics: A review. Nanoscale 2016, 8, 13131–13154. [Google Scholar] [CrossRef] [PubMed]
  9. Song, Y.; Jiang, Y.; Shi, L.; Cao, S.; Feng, X.; Miao, M.; Fang, J. Solution-processed assembly of ultrathin transparent conductive cellulose nanopaper embedding AgNWs. Nanoscale 2015, 7, 13694–13701. [Google Scholar] [CrossRef]
  10. Xu, X.; Zhou, J.; Jiang, L.; Lubineau, G.; Ng, T.; Ooi, B.S.; Liao, H.-Y.; Shen, C.; Chene, L.; Zhu, J.Y. Highly transparent, low-haze, hybrid cellulose nanopaper as electrodes for flexible electronics. Nanoscale 2016, 8, 12294–12306. [Google Scholar] [CrossRef]
  11. Huang, J.; Zhu, H.; Chen, Y.; Preston, C.; Rohrbach, K.; Cumings, J.; Hu, L. Highly Transparent and Flexible Nanopaper Transistors. ACS Nano 2013, 7, 2106–2113. [Google Scholar] [CrossRef] [PubMed]
  12. Gaspar, D.; Fernandes, S.N.; de Oliveira, A.G.; Fernandes, J.G.; Grey, P.; Pontes, R.V.; Pereira, L.; Martins, R.; Godinho, M.H.; Fortunato, E. Nanocrystalline cellulose applied simultaneously as the gate dielectric and the substrate in flexible field effect transistors. Nanotechnology 2014, 25. [Google Scholar] [CrossRef] [PubMed]
  13. Kang, W.; Yan, C.; Foo, C.Y.; Lee, P.S. Foldable Electrochromics Enabled by Nanopaper Transfer Method. Adv. Funct. Mater. 2015, 25, 4203–4210. [Google Scholar] [CrossRef]
  14. Zhao, M.; Ansari, F.; Takeuchi, M.; Shimizu, M.; Saito, T.; Berglund, L.A.; Isogai, A. Nematic structuring of transparent and multifunctional nanocellulose papers. Nanoscale Horizons 2018, 3, 28–34. [Google Scholar] [CrossRef]
  15. Isobe, N.; Kasuga, T.; Nogi, M. Clear transparent cellulose nanopaper prepared from a concentrated dispersion by high-humidity drying. RSC Adv. 2018, 8, 1833–1837. [Google Scholar] [CrossRef] [Green Version]
  16. Kasuga, T.; Isobe, N.; Yagyu, H.; Koga, H.; Nogi, M. Clearly Transparent Nanopaper from Highly Concentrated Cellulose Nanofiber Dispersion Using Dilution and Sonication. Nanomaterials 2018, 8, 104. [Google Scholar] [CrossRef] [PubMed]
  17. Krishna Iyer, K.R.; Neelakantan, P.; Radhakrishnan, T. Birefringence of Native Cellulosic Fibers. I. Untreated Cotton and Ramie. J. Polym. Sci. A 1968, 6, 1747–1758. [Google Scholar] [CrossRef]
  18. Takahara, H.; Nomura, S.; Kawai, H. Dimensional Stability of Regenerated Cellulose Film in Relation to Orientations of Crystalline and Noncrystalline Phases. J. Polym. Sci. A 1968, 6, 197–221. [Google Scholar] [CrossRef]
  19. Lagerwall, J.P.F.; Schütz, C.; Salajkova, M.; Noh, J.; Hyun Park, J.; Scalia, G.; Bergström, L. Cellulose nanocrystal-based materials: From liquid crystal self-assembly and glass formation to multifunctional thin films. NPG Asia Mater. 2014, 6. [Google Scholar] [CrossRef]
  20. Saito, T.; Uematsu, T.; Kimura, S.; Enomae, T.; Isogai, A. Self-aligned integration of native cellulose nanofibrils towards producing diverse bulk materials. Soft Matter 2011, 7, 8804–8809. [Google Scholar] [CrossRef]
  21. Okita, Y.; Saito, T.; Isogai, A. Entire Surface Oxidation of Various Cellulose Microfibrils by TEMPO-Mediated Oxidation. Biomacromolecules 2010, 11, 1696–1700. [Google Scholar] [CrossRef] [PubMed]
  22. Fall, A.B.; Lindstrom, S.B.; Sundman, O.; Odberg, L.; Wagberg, L. Colloidal Stability of Aqueous Nanofibrillated Cellulose Dispersions. Langmuir 2011, 27, 11332–11338. [Google Scholar] [CrossRef] [PubMed]
  23. Araki, J.; Kuga, S. Effect of Trace Electrolyte on Liquid Crystal Type of Cellulose Microcrystals. langmuir 2001, 17, 4493–4496. [Google Scholar] [CrossRef]
  24. Van den Berg, O.; Capadona, J.R.; Weder, C. Preparation of Homogeneous Dispersions of Tunicate Cellulose Whiskers in Organic Solvents. Biomacromolecules 2007, 8, 1353–1357. [Google Scholar] [CrossRef] [PubMed]
  25. Schutz, C.; Agthe, M.; Fall, A.B.; Gordeyeva, K.; Guccini, V.; Salajkova, M.; Plivelic, T.S.; Lagerwall, J.P.F.; Salazar-Alvarez, G.; Bergstrom, L. Rod Packing in Chiral Nematic Cellulose Nanocrystal Dispersions Studied by Small-Angle X-ray Scattering and Laser Diffraction. Langmuir 2015, 31, 6507–6513. [Google Scholar] [CrossRef] [PubMed]
  26. Okeyoshi, K.; Okajima, M.K.; Kaneko, T. Milliscale Self-Integration of Megamolecule Biopolymers on a Drying Gas-Aqueous Liquid Crystalline Interface. Biomacromolecules 2016, 17, 2096–2103. [Google Scholar] [CrossRef] [PubMed]
  27. Liu, Y.; Stoeckel, D.; Gordeyeva, K.; Agthe, M.; Schutz, C.; Fall, A.B.; Bergstrom, L. Nanoscale Assembly of Cellulose Nanocrystals during Drying and Redispersion. ACS Macro Lett. 2018, 7, 172–177. [Google Scholar] [CrossRef]
  28. Fukuzumi, H.; Saito, T.; Iwata, T.; Kumamoto, Y.; Isogai, A. Transparent and High Gas Barrier Films of Cellulose Nanofibers Prepared by TEMPO-Mediated Oxidation. Biomacromolecules 2009, 10, 162–165. [Google Scholar] [CrossRef]
  29. Skogberg, A.; Maki, A.J.; Mettanen, M.; Lahtinen, P.; Kallio, P. Cellulose Nanofiber Alignment Using Evaporation-Induced Droplet-Casting, and Cell Alignment on Aligned Nanocellulose Surfaces. Biomacromolecules 2017, 18, 3936–3953. [Google Scholar] [CrossRef]
Figure 1. Experimental setup for observing the drying process of the cellulose nanofiber (CNF) suspensions. (a) Photo and (b) schematic diagram of the setup.
Colloids 02 00071 g001
Figure 2. Temporal birefringence change in evaporation–condensation CNF suspensions: top (z direction) and side (y direction) views for φi of (a) 0.087 and (b) 0.52 wt%.
Colloids 02 00071 g002
Figure 3. Birefringence changes quantified by the RGB whiteness during evaporation. (a) Regions (yellow rectangles) used to construct the RGB histograms by ImageJ software to calculate the mean RGB whiteness of each image for both the z and y directions. (b) Temporal change in the mean RGB whiteness. (c) RGB whiteness transitions with the apparent concentration calculated from the initial suspension volume and complete drying time by assuming constant drying speeds. The perpendicular distributions of the RGB whiteness were analyzed along the dotted vertical center line in (d) for the suspensions with φi of (e) 0.087 and (f) 0.52 wt%.
Colloids 02 00071 g003
Figure 4. Schematic diagram of the self-alignment sequence of CNFs during the evaporation–condensation process by birefringence analysis. (a) The randomly dispersed CNF aqueous suspension; The drying suspensions with the apparent concentration of (b) ~0.55 and (c) ~1.3 wt%, respectively; (d) the dried nanopaper with the chiral nematic structure.
Colloids 02 00071 g004
Figure 5. Relation between the mean optical retardation and the dried nanopaper thickness.
Colloids 02 00071 g005