1. Introduction
Manganese oxide materials have attracted the researchers’ interest for a long time due to their exceptional functional properties. The most common fields, in which manganese oxides are considered outstanding and promising include heterogeneous catalysis [
1,
2,
3,
4], lithium-ion batteries [
5,
6,
7], and adsorption [
8,
9,
10]. The wide spectrum of functional properties the materials are characterized with arises from a number of oxidation states manganese can exist in. Additionally, manganese can be easily involved in redox interactions, in particular, it can reversibly change the oxidation state.
In addition to versatile chemical properties, manganese oxides form plenty of structural variations [
11,
12,
13]. Special attention among them is given to birnessite having a layered structure composed of edge-shared MnO
6 octahedra and interlayer distance of 7 Å [
14]. A specific feature of birnessite-based systems consists of the reversible sorption of alkali and alkali-earth metals proceeding in the interlayer region [
15,
16,
17]. However, cation exchange depends greatly on the Mn
+3/Mn
+4 ratio and the accessibility of active cites, thus determining the overall charge of the interlayer region and the readiness of redox interactions [
14]. To summarize, the sorption properties of birnessite are mainly governed by its redox characteristics as well as structure and morphology.
To evaluate these structural features requires implementing a complex approach, especially using a number of physico-chemical methods each elucidating a particular structural feature. To study the redox properties and structure of the oxide materials, researchers have adopted the method of temperature-programmed reduction (TPR). Its experimental principle is simple: The sample is purged with gas mixture containing inert (He, N
2 of Ar) and reducing gases (H
2 and CO), while heated at a constant rate; the concentration of the reducing gas is monitored in the reactor outlet. As the shape and peak maxima positions of TPR curve are unambiguously governed by chemical composition, surface morphology, and active site distribution, the method allows revealing rather fine differences in the structure of chemically similar materials, which is extensively used for characterization of catalysts and sorbents [
18,
19,
20,
21]. Complementing TPR results with SEM and low temperature nitrogen physical adsorption provides full structural description of the material.
Despite the fact that functional and physico-chemical properties of birnessite are widely covered in the literature, the number of works simultaneously devoted to these aspects of the manganese oxide characterization is insignificant. In addition, it is not clear how the properties of manganese oxides change under operating conditions. A very important issue consists of studying the ways of birnessite modification through various reduction routes, e.g., by hydrazine (in solution). Under such conditions, birnessite can undergo rearrangement of active sorption sites and changes of structure and surface morphology that will affect sorption characteristics of the material. The above and related issues can be addressed by using a complex of physico-chemical methods: SEM, low temperature nitrogen sorption, and TPR in combination with sorption experiments.
The present work aims to study how operating conditions and reductive treatment affect the morphology, structure, and sorption of birnessite. In order to study all these aspects in detail, we performed the kinetic analysis of TPR. The ain emphasis was made on elucidation of the structural and morphological changes depending on certain treatment type. Sorption studies helped to find the ways structure is related to the sorption characteristics of birnessite sorbents.
2. Materials and Methods
Sorbent was obtained according to the method described in [
22] by interaction between 10 g of KMnO
4 and 250 mL of concentrated H
2O
2. Brown precipitate was filtered under vacuum and washed with 250–500 mL of deionized H
2O and then dried at 75 °C for 6 h. The obtained product was ground and held in 3 M solution of NaOH (m/V ratio 0.1–0.15 g mL
−1) for 24 h. Thereafter, the material was annealed at 500 °C in air for 6 h, the heating rate 8.3 °C min
−1. Finally, the sorbent formed granules of an irregular shape and black color with characteristic metal luster and bulk weight of 1.56 g mL
−1. Further, the sorbent’s sample was put into a column of 5 mm in diameter and, then, it was consequently fed up with 0.5 M solution of HCl and 1 M solution of NaOH at a rate of 10 bed volumes per hour (BV h
−1). Thereafter, the final product was washed with 50 mL of water and dried. The material is denoted as δ-MnO
2.
The obtained birnessite was put into a glass column and purged with Sr solution till breakthrough, then it was washed with HCl solution to remove Sr and by NaOH solution to regenerate the sorbent. The above operations were repeated three times, the obtained material is denoted as δ-MnO2-3cycle.
To modify the surface and to increase the sorption activity, the original birnessite was put into the column and purged with simulated seawater containing 0.1 g L−1 of N2H4. The obtained material denoted as δ-MnO2-N2H4 was dried and washed with distilled water.
TPR experiments were carried out using a ChemBET Pulsar TPR/TPD automated chemisorption analyzer (Quantachrome Instr., Boynton Beach, FL, USA). Sample powders (30–35 mg) were loaded into the quartz sample cell. To separate water forming during oxide reduction, the liquid nitrogen cold trap was used. Prior to the experiment, samples were annealed at 350 °C in a nitrogen flow for 30 min to degas and to remove moisture. TPR curves were recorded at four heating rates for each of the materials (3, 6, 9, and 12 °C min−1). Different heating rates were needed for performing the kinetic analysis. Temperature during the experiment was in the range 25–650 °C. Gaseous mixture of 6% H2/N2 was fed through the sample at 50 mL min−1 flow rate and ambient pressure.
Low-temperature N
2-adsorption at 77 K was carried out using an Autosorb IQ automated sorption analyzer (Quantachrome Instr., Boynton Beach, FL, USA). Prior to the experiment, samples were degassed at 100 °C in vacuum for 3 h. The specific surface area of the birnessite samples was calculated via the BET method. Pore size distributions were evaluated using the density functional theory model [
23].
Thermal gravimetric analysis (TGA) was performed using a DTG differential thermal analyzer 60H (Shimadzu, Kyoto, Japan). TGA curves were recorded at 5 °C min−1 heating rate in air, the sample weight was 20–30 mg.
SEM images of the birnessite surface were obtained using a Carl Zeiss Crossbeam 1540xb electron microscope (Carl Zeiss, Oberhoffen, Gottingen, Germany) at an accelerating voltage of 2 kV. Crystalline phases were identified using the XRD method using a Dron-3 multi-purpose X-ray diffractometer (AO Burevestnik, St. Petersburg, Russia). Particle size distributions of the samples were measured using a Morphologi-G3-ID device (Malvern Panalytical Ltd., Malvern, UK).
To carry out the kinetic analysis, we performed TPR modelling based on three-stage reduction of manganese oxide (1). Thus, we obtained a system of differential Equation (2):
where
ki—the rate of the
ith stage of reduction;
—the apparent preexponential factor (preexponential factor multiplied by the specific surface area (
So,i) of the oxide at zero conversion);
Ei—the activation energy of the
ith stage;
τ—time;
n—the molar quantity of the corresponding oxide;
αi—the degree of the
ith oxide conversion;
si(
αi)—the relative specific surface area of the
ith oxide corresponding to the ratio of specific surface
Si(
α) at α
i to
S0,i;
—the hydrogen partial pressure in the system. To solve the system of equations within the specified time interval, it is necessary to know n values of
and n functions of
si(
αi). There is no sound theory that enable us to introduce a mathematical expression for the surface area functions
a priori, so they are found in the class of cubic splines
[
24,
25], which provide the controlled precision based on a variable amount of spline knots. Additionally, the absence of theoretical assumptions on the mathematical form of surface area functions enabled us to take into account all the occurring processes throughout the reduction, thus making the approach versatile [
26]. Optimized parameters in this case are a vector of values
in the
m spline knots. Thus, if we know
n values of
and
n*m values of
yi,j, reduction curve of an oxide Ox
0 can be done in the following way.
The experimental TPR curve was split into time intervals Δτ corresponding to the time of filling the sample tube with the gas and being exerted of (4):
where
—the gas glow rate;
LMeO—the length of the tube with a sample;
Rp—the tube’s radius;
and
—the oxide’s mass and density, respectively.
The system of differential Equation (2) is numerically solved on each time interval Δ
τ, thus providing changes of partial pressure and the composition of the reaction mixture. For the next step, the reaction zone is filled with new portion of gas and the modelling process is repeated. Since Δ
τ is small enough, such a scheme allows avoiding numerical solution of convective transfer equations and, at the same time, provides rather fair modelling precision (proved by preliminary numerical experiments). Finally, the model TPR curve is built:
To obtain the parameters
, which provide model curves coinciding the most adequately with experimental ones (recorded at several heating rates), the following function is minimized with the methods CMA-ES [
27] and Subplex [
28]:
where
—the hydrogen partial pressure in the
jth point of the experimental curve recorded with the
ith heating rate.
To avoid biased results of the modelling and to decrease their dependence on initial parameter values, we used a regularization method [
29]. As a regularizer, the sum of the two norms was used: (1) norm of spline values in the spline knots of specific surface area functions (
); (2) norm of the first derivatives in spline knots (
). Regularization parameters (ε
1, ε
2) are computed using a self-coupling procedure.
Finally, the target Function (6) is transformed into the following one:
Full mathematical description of the method is given in [
26].
Sorption under static conditions was performed as follows. Dry samples of the sorbents fraction 0.1–0.2 mm were placed into plastic cylinders and poured by simulated seawater (S-SW) without Sr
2+ ions and left for a day. The S-SW composition was prepared as in [
22] with the following ion concentrations: Mg
2+—1200 mg L
−1, Ca
2+—400 mg L
−1, Cl
−—19,000 mg L
−1, Na
+—10,700 mg L
−1, SO
42−—2700 mg L
−1, K
+—400 mg L
−1, HCO
3−—140 mg L
−1, Br
−—60 mg L
−1. Then, the sorbent was removed from the solution and was poured by another portion of S-SW containing Sr
2+ and radiolabel Sr-90 (500–1000 Bq mL
−1). Sorbent was stirred with S-SW for 70 days, after which solutions were separated from the sorbents through filtering, and the residual activity was measured with respect to Sr-90. The content of Sr-90 in solutions was determined using a Tri-Carb 2910 TR liquid scintillation alpha-beta spectrometric radiometer (Perkin Elmer, Waltham, MA, USA).
The distribution coefficient of
90Sr was evaluated by the Formula (8):
where
A0 and
A1—the initial activity and residual activity after sorption, respectively;
V—the volume of the liquid phase after sorption (mL);
m—the sorbent’s mass (g).
Sorbents characteristics were studied under dynamic conditions using repeated sorption-elution-regeneration cycles. Prior to the experiment, 1 mL of the sample was held for one day in the liquid medium of SW or S-SW. Then, the sorbent was transferred to a glass column with an inner diameter of 0.5 cm, through which seawater containing the 90Sr (1000 Bq mL−1) radiolabel was passed at a rate of 10 bed volumes per hour (BV h−1). To determine the sorbent dynamic exchange capacity, we used the S-SW solution containing stable Sr of a concentration 50 mg L−1 to reduce the time of the experiment. The retained Sr was eluted by 0.5 M HCl solution fed at 10 BV h−1 speed. Thereafter, the sorbent was regenerated with 100 mL of 1.0 M solution of NaOH, washed with 30 mL of distilled water, and used in the next sorption cycle.
The decontamination factor (DF) was calculated as follows:
4. Discussion
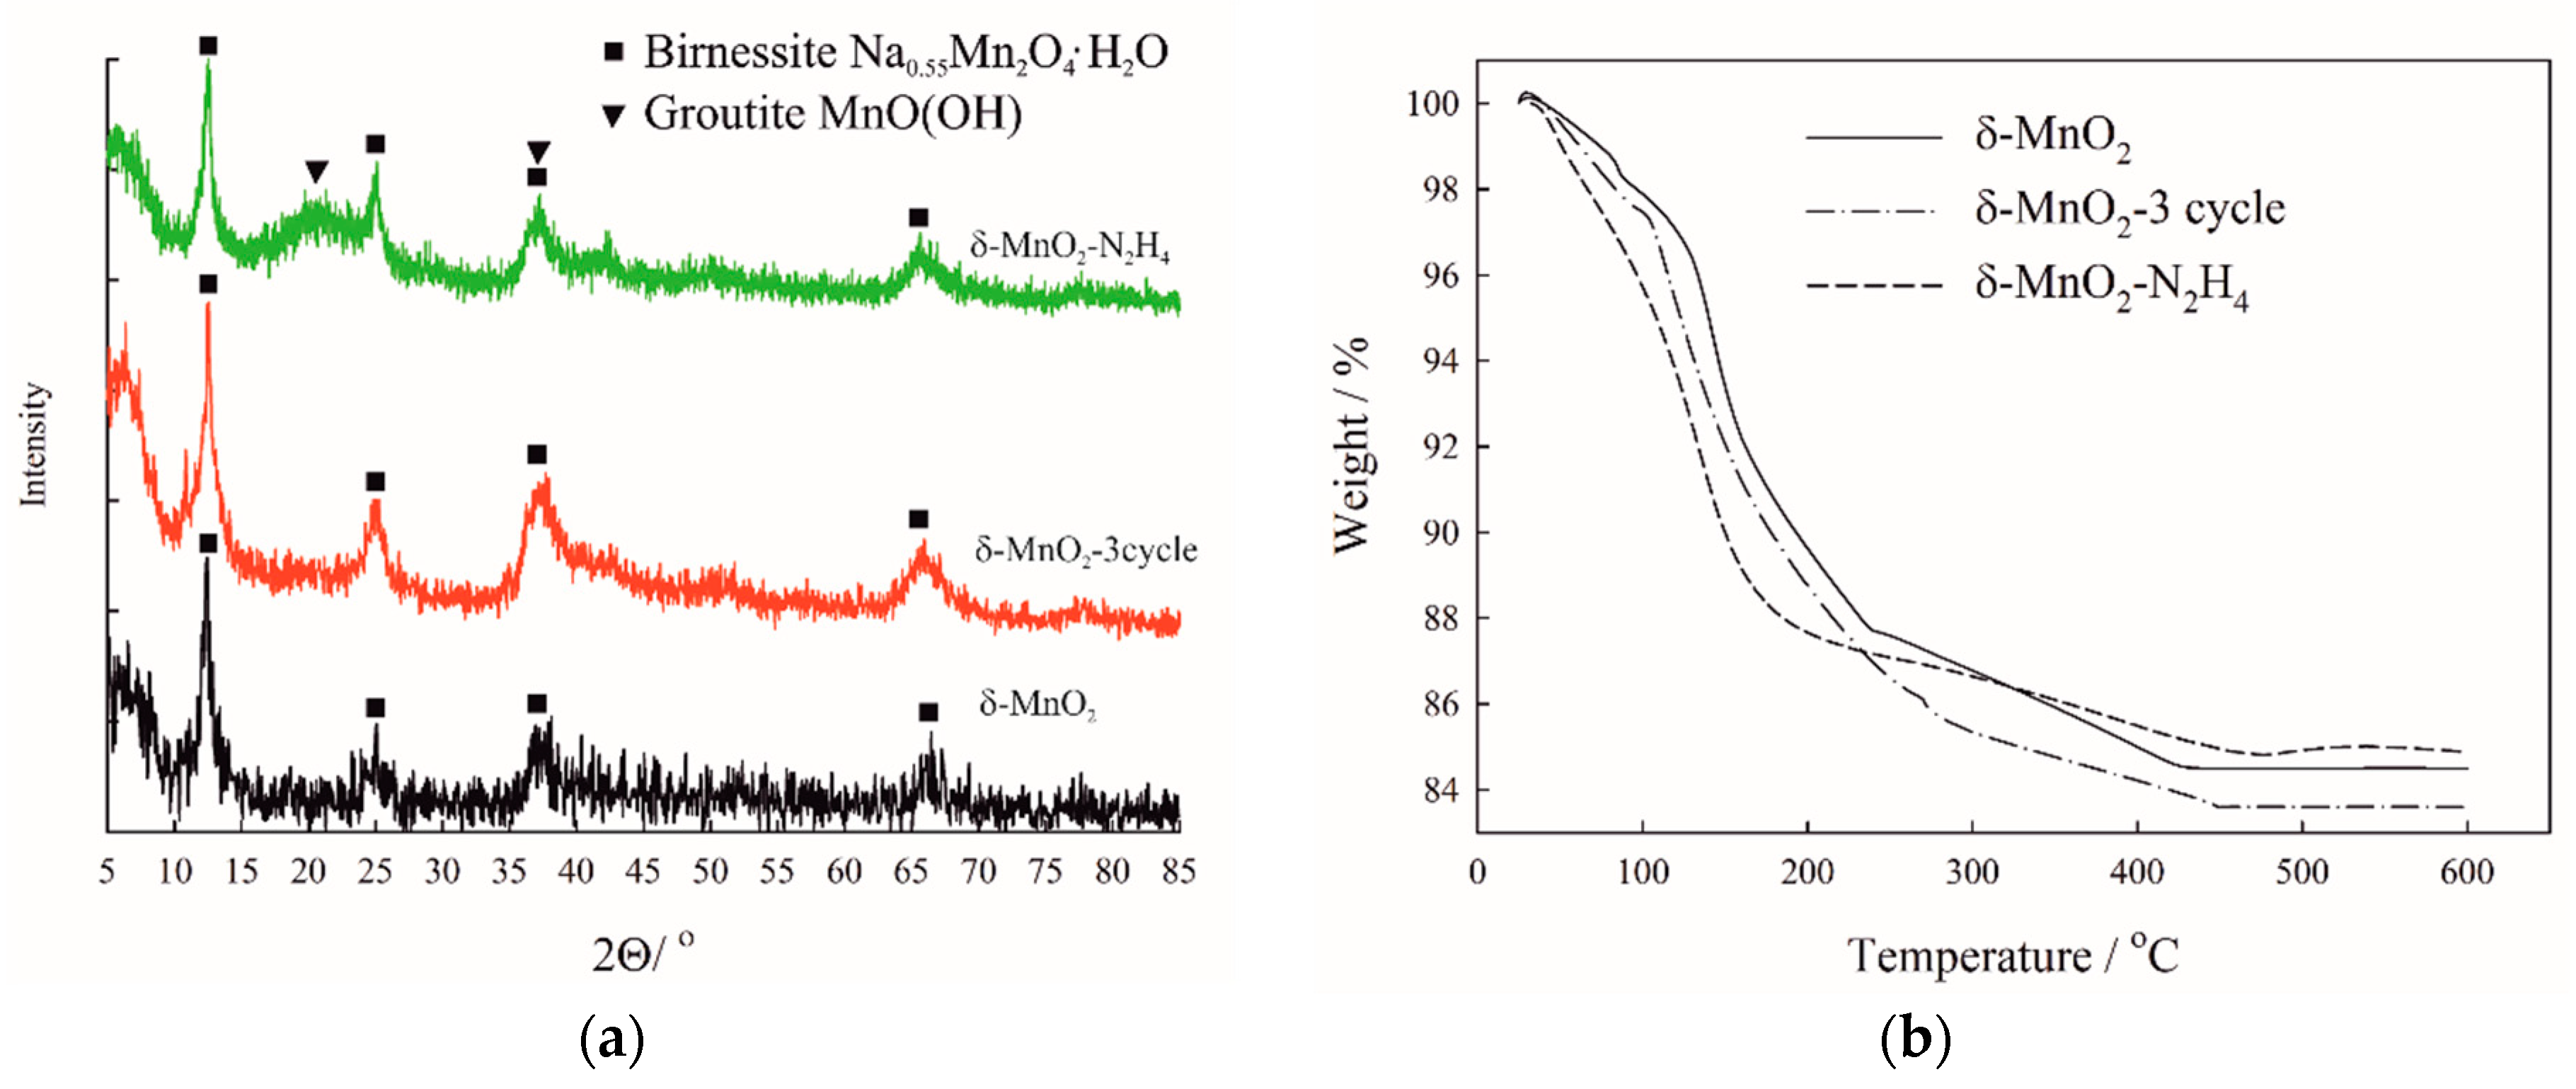
Various kinds of treatment, such as washing with HCl and reduction with hydrazine, could lead to changes in the phase composition. In order to track possible phase transformations as a result of reduction or thermal treatment, we conducted the XRD analysis (
Figure 1). However, due to rather mild treatment conditions, birnessite remains preserved among all the studied materials, which is proved by peculiar peak at 7.06 Å indicating the birnessite phase. Note that MnO
2-N
2H
4 has the reduced phase MnO(OH) in its composition indicating to partial reduction of birnessite. There is also a large amount of water released from the interlayer region during TGA (
Figure 1b). Water removal from birnessite as a result of thermal treatment is a continuous process followed by removal of the residual moisture, interlayer, and structural water [
30]. As was shown by combination with chemical analysis, the main traces in birnessite samples were water, potassium, and sodium (
Table 2). The presence of alkali cations arises from the used reagents for the synthesis of birnessite: In particular, KMnO
4 was used on the stage of gel formation, while consequent annealing was conducted with NaOH.
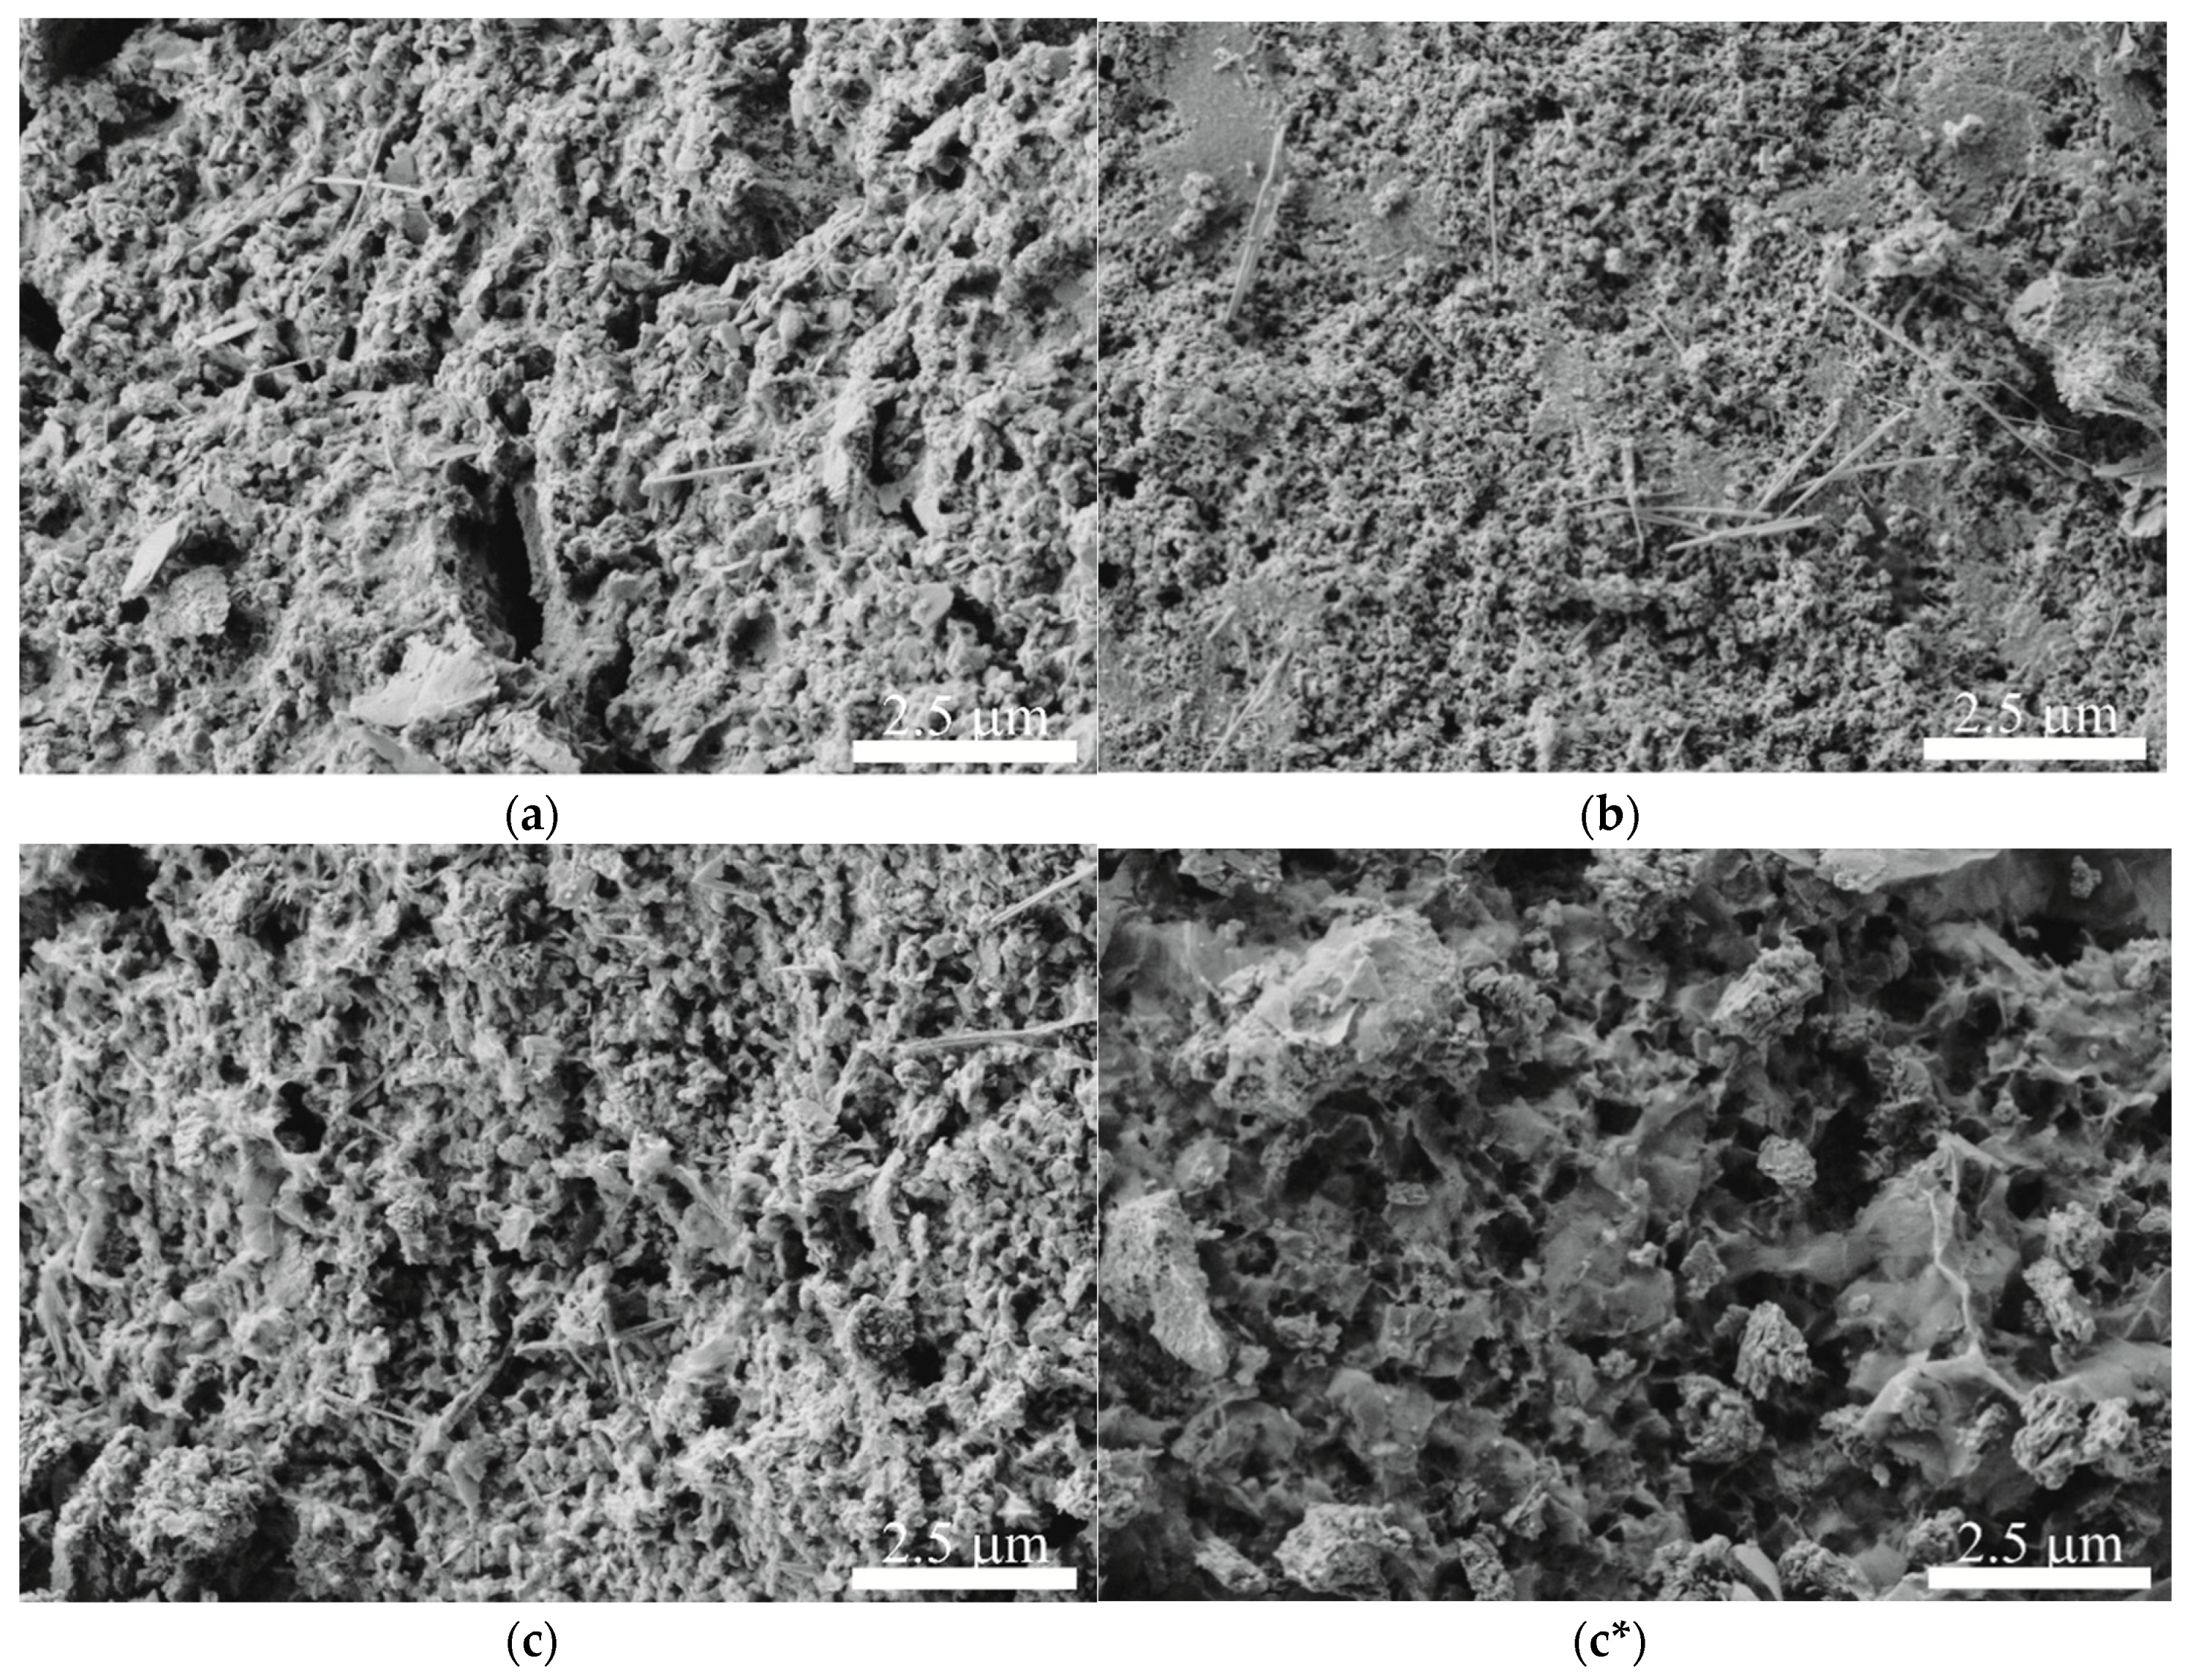
The surface of the particles constituting the original birnessite δ-MnO
2 contains various defects and pores (
Figure 2a). Amorphous structure provides low mechanical strength, thus producing high concentration of the surface defects. The morphology of the reused sorbent δ-MnO
2-3cycle is rather similar to the initial sorbent, according to SEM (
Figure 2b). Surface pores and defects increase the interphase contact of the material with the medium providing desirable kinetic and capacity sorption characteristics. The morphology of δ-MnO
2-N
2H
4 is completely different compared to the original sample (
Figure 2c,c*). The surface of the sample treated with hydrazine is increased due to some part of manganese was reduced and released, leading to larger pores (
Figure 2a). As treatment conditions are rather mild, there are untouched regions on the surface that are inherited from the original sample.
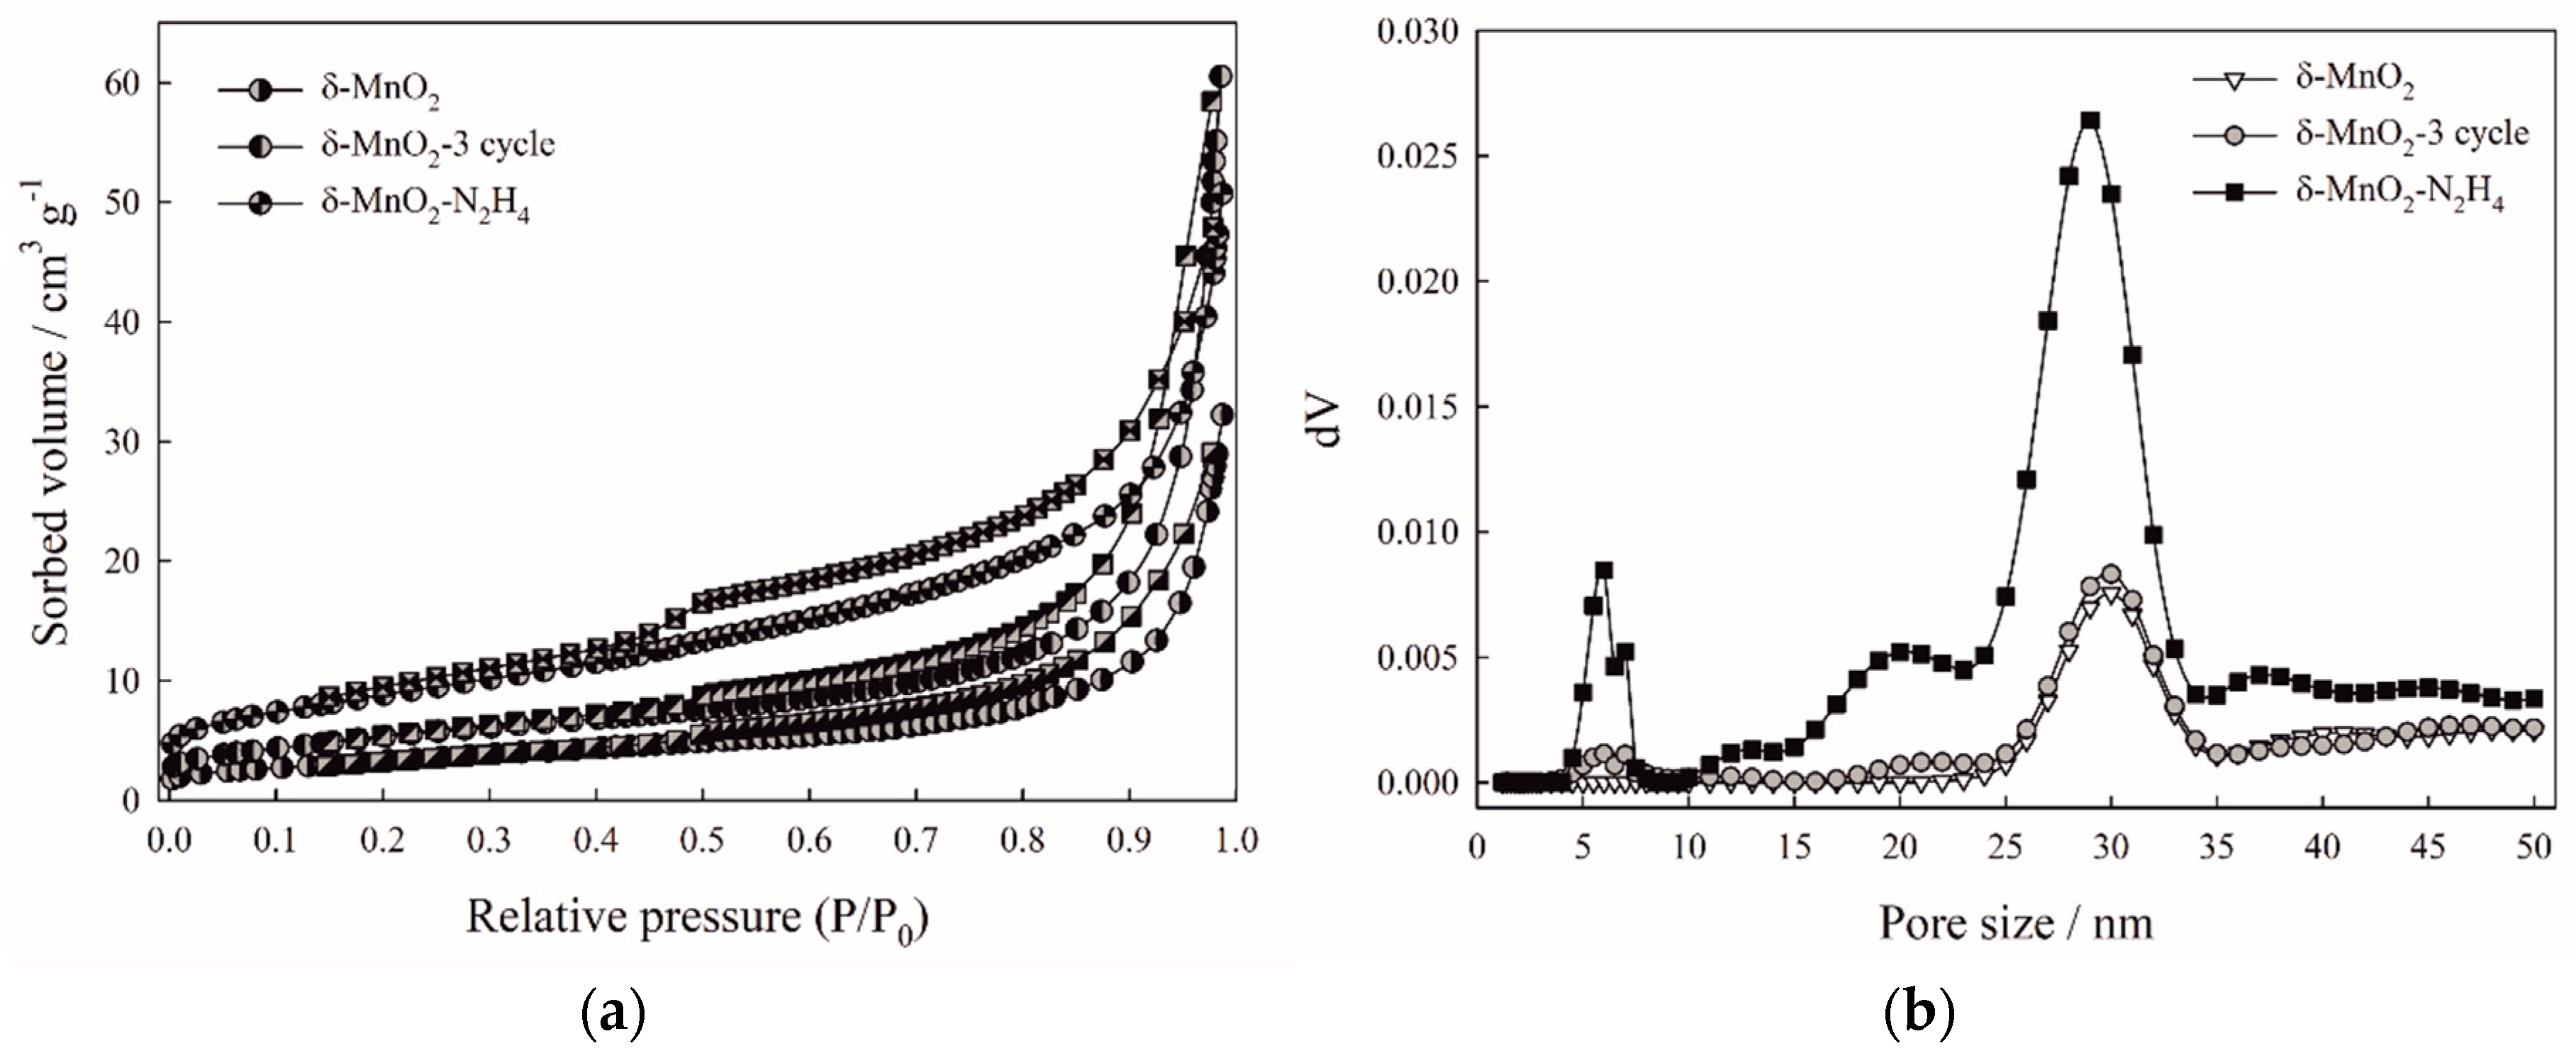
Important characteristics of birnessite as a sorbent include the specific surface area and pore size distribution in the material. To quantify them, we used the low-temperature nitrogen adsorption method, results of which are given on
Figure 3. Hysteresis loops above 0.5 of relative pressure are peculiar for sorption isotherms of the studied samples indicating the presence of mesopores in the birnessite (
Figure 3a). δ-MnO
2-N
2H
4 is characterized by the highest BET surface area (32.0 m
2 g
−1) among the studied materials proving the SEM results on pore formation after treatment with hydrazine. The specific surface area increase is also observed for birnessite after sorption-regeneration cycles δ-MnO2-3cycle (19.8 m
2 g
−1) as compared to the original sample (12.0 m
2 g
−1). Pore size distributions evaluated by the DFT model of slit/cylinder pores demonstrate mesopores of 25–35 nm in diameter to be the most abundant in the birnessite samples (
Figure 3b). The porous structure remains preserved after three cycles of sorption regeneration. Treatment with hydrazine provides a developed porous structure, i.e., leads to the mesopore formation.
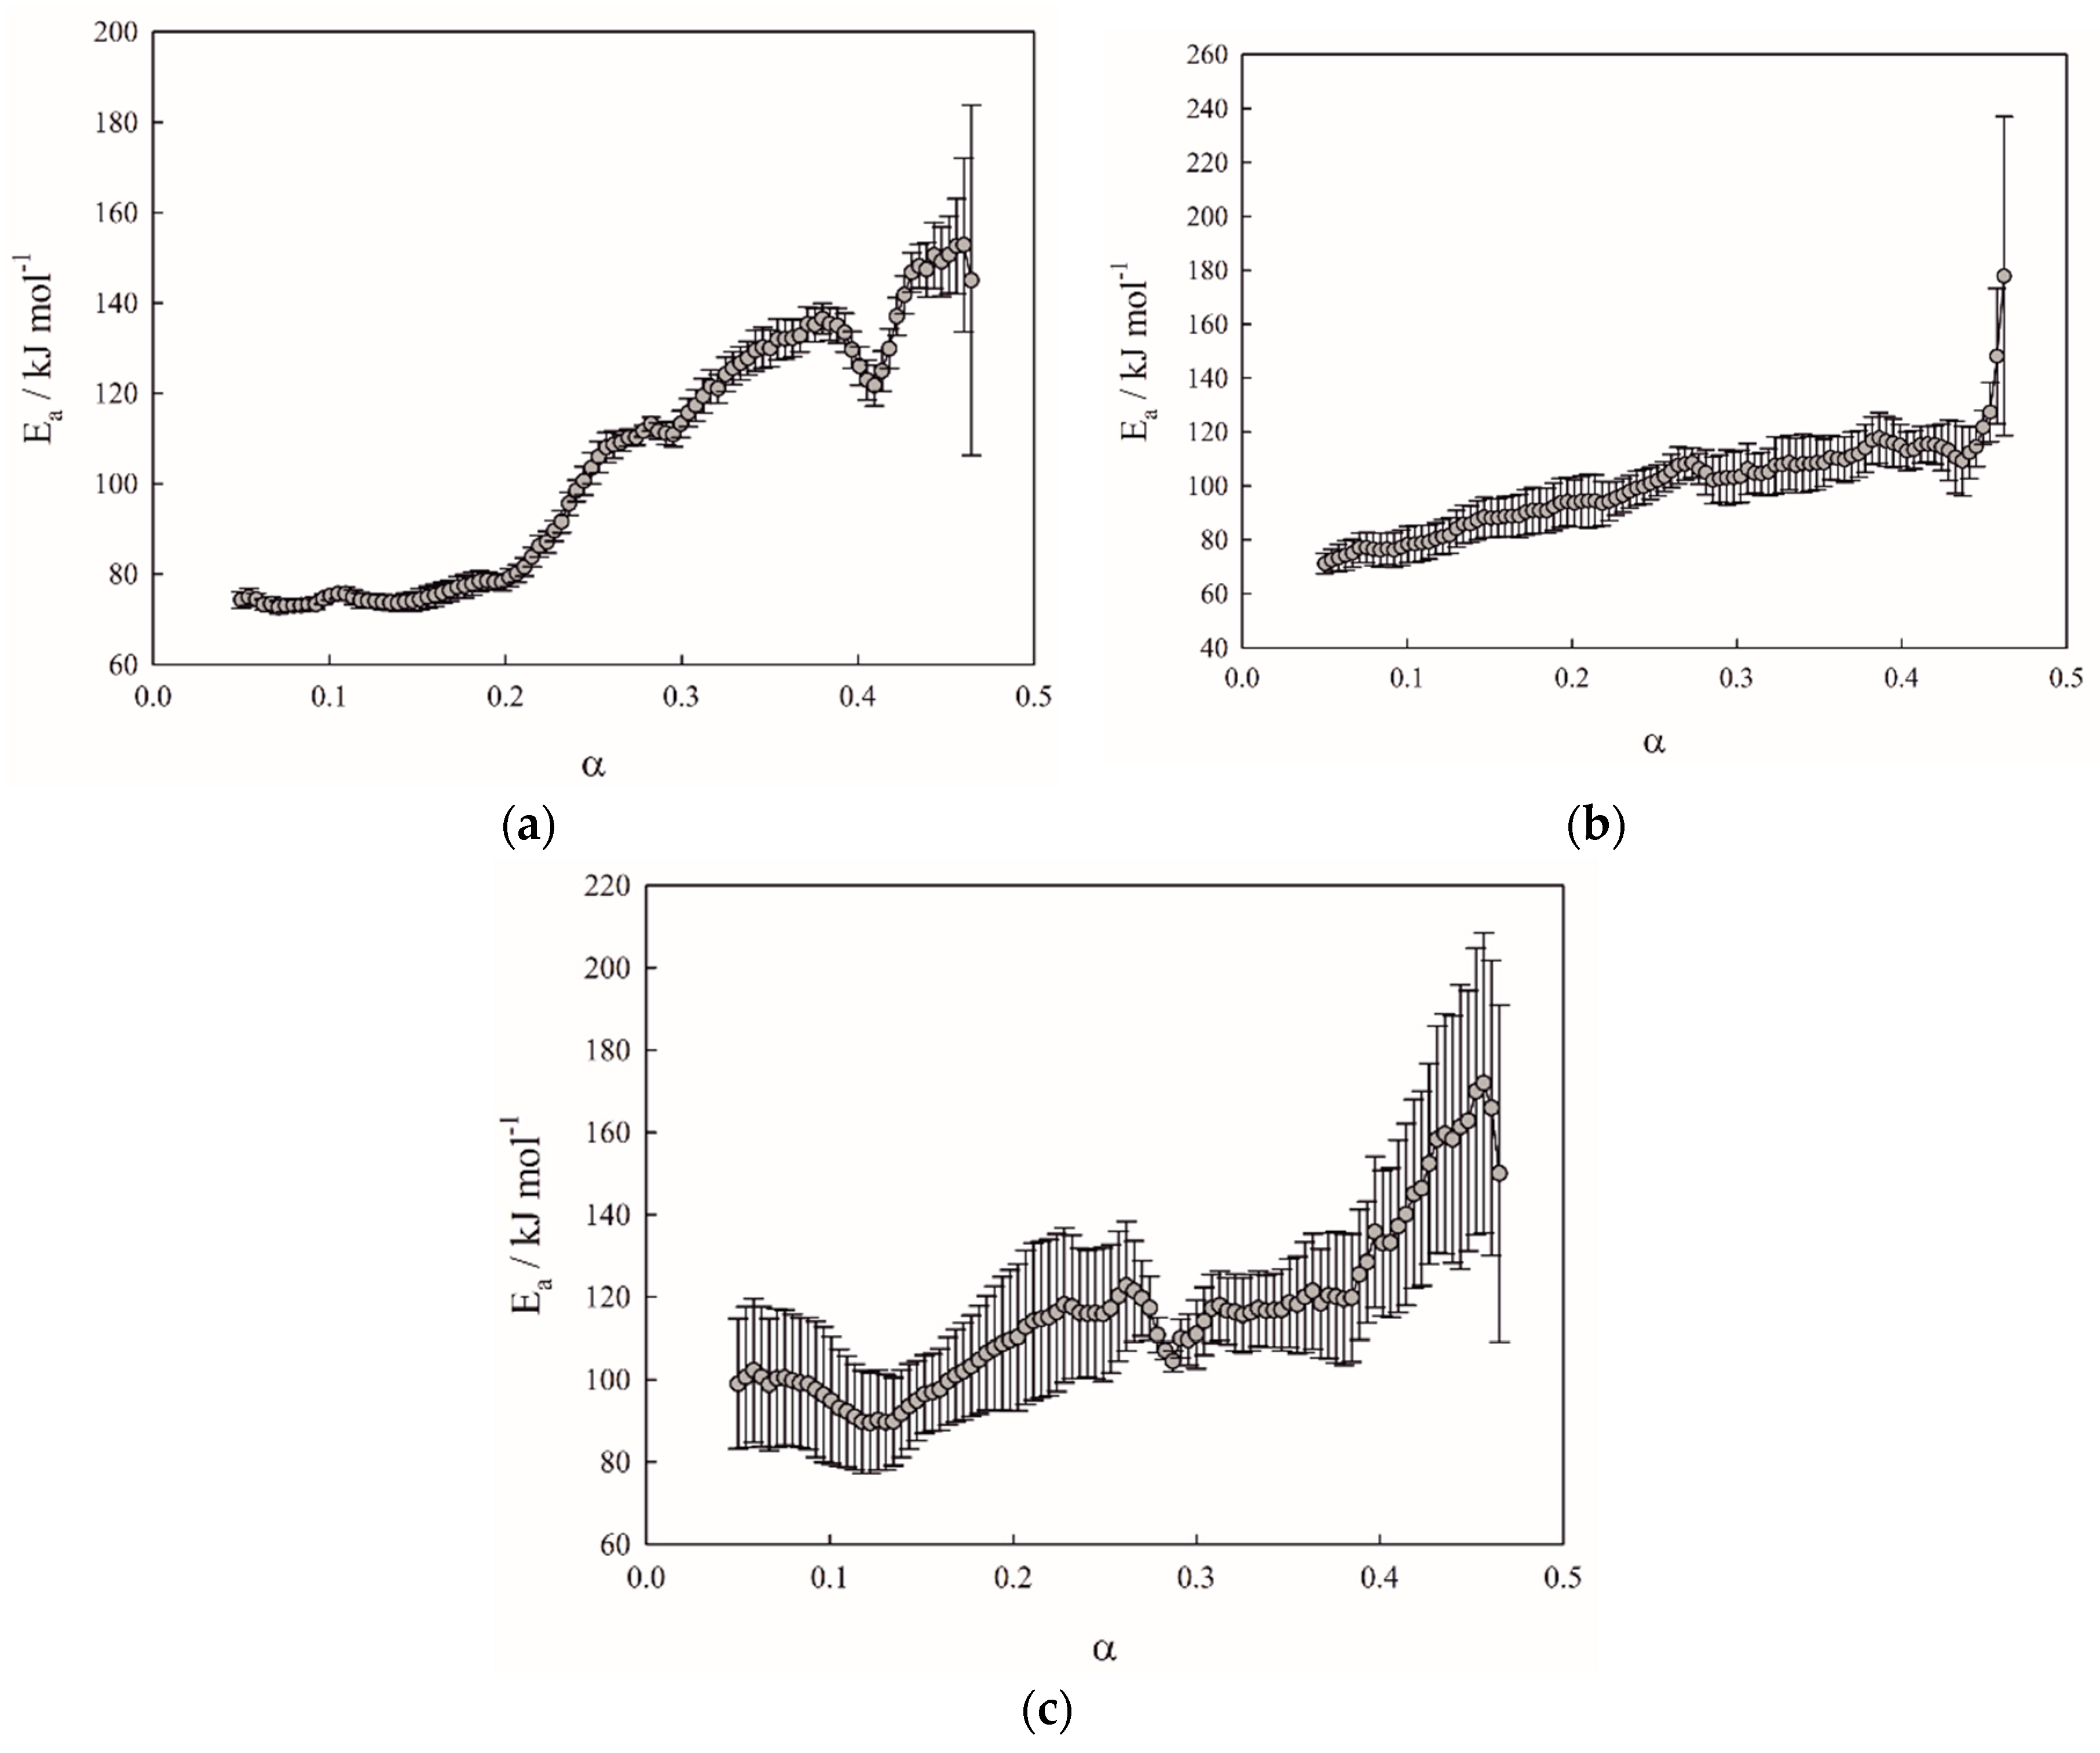
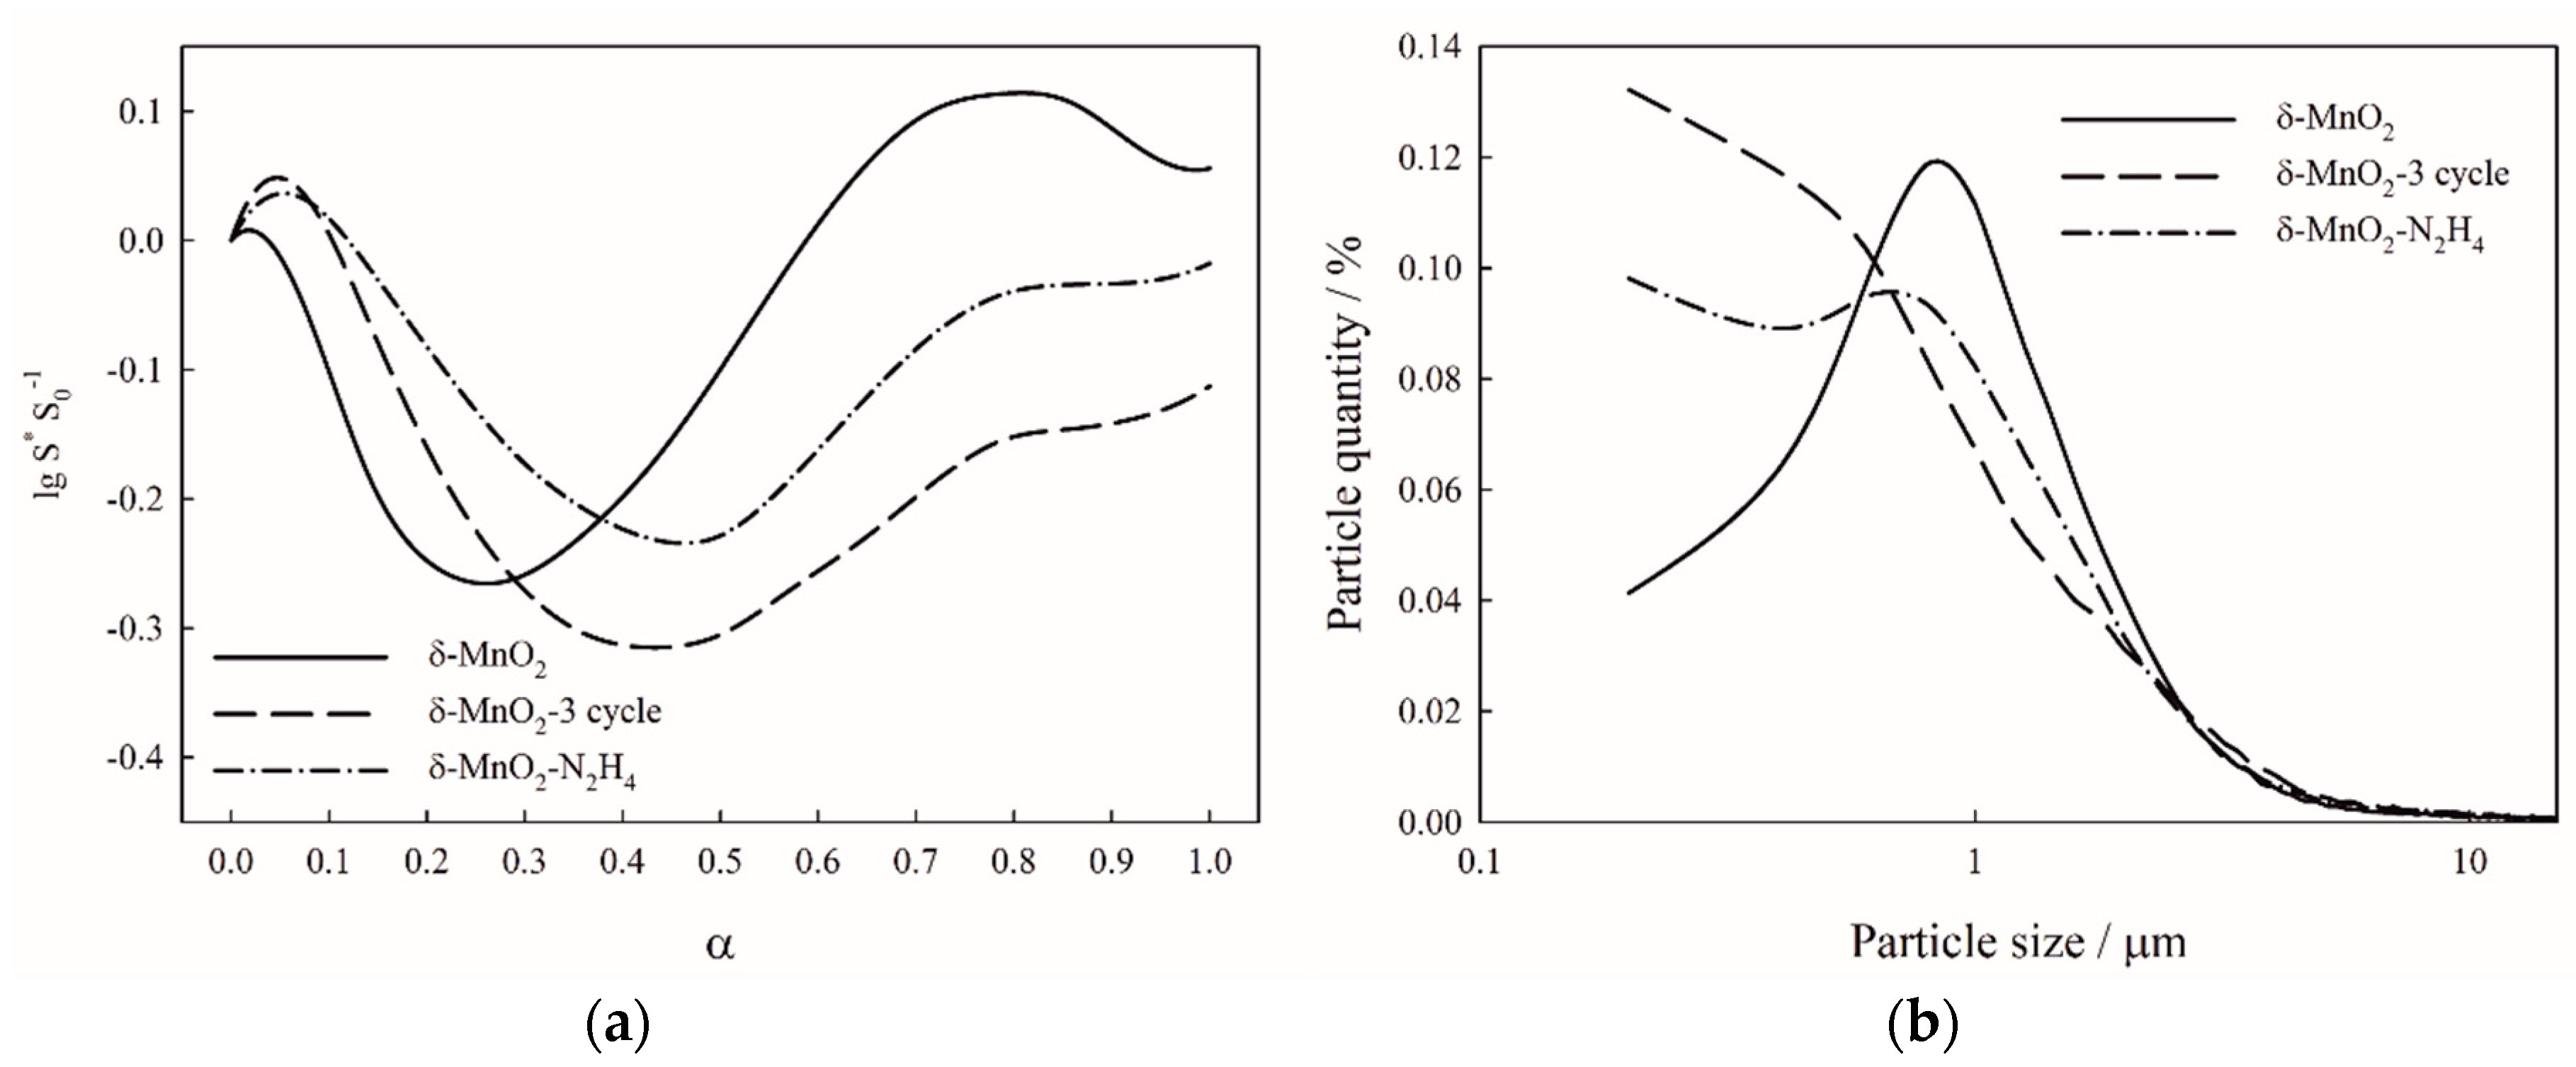
The obtained samples of different morphology and composition were investigated using the TPR method complemented with kinetic analysis to reveal kinetic characteristics and oxide composition. The Friedman method [
31] was applied to study the activation energy dependence on the conversion degree (
Figure 4). The activation energies are given only until a 0.5 value of the conversion degree, because further energy values are negative and have no physical meaning. Such an effect can be explained, as mentioned above, by several limiting stages involved in kinetics of birnessite reduction, whereas the kinetic equation of the Friedman method assumes only one. Due to fact that the majority manganese reduction occurs in the range 250–500 °C, all three stages of reduction are “compressed,” and this compression on a time and temperature scale leads to uncertainty of contribution from each reduction stage to the dα/dt term of the Friedman equation, thus yielding activation energies without physical meaning. However, Friedman curves indicate that the activation energy increases along with the reaction progress and falls into the range of 60–180 kJ mol
−1.
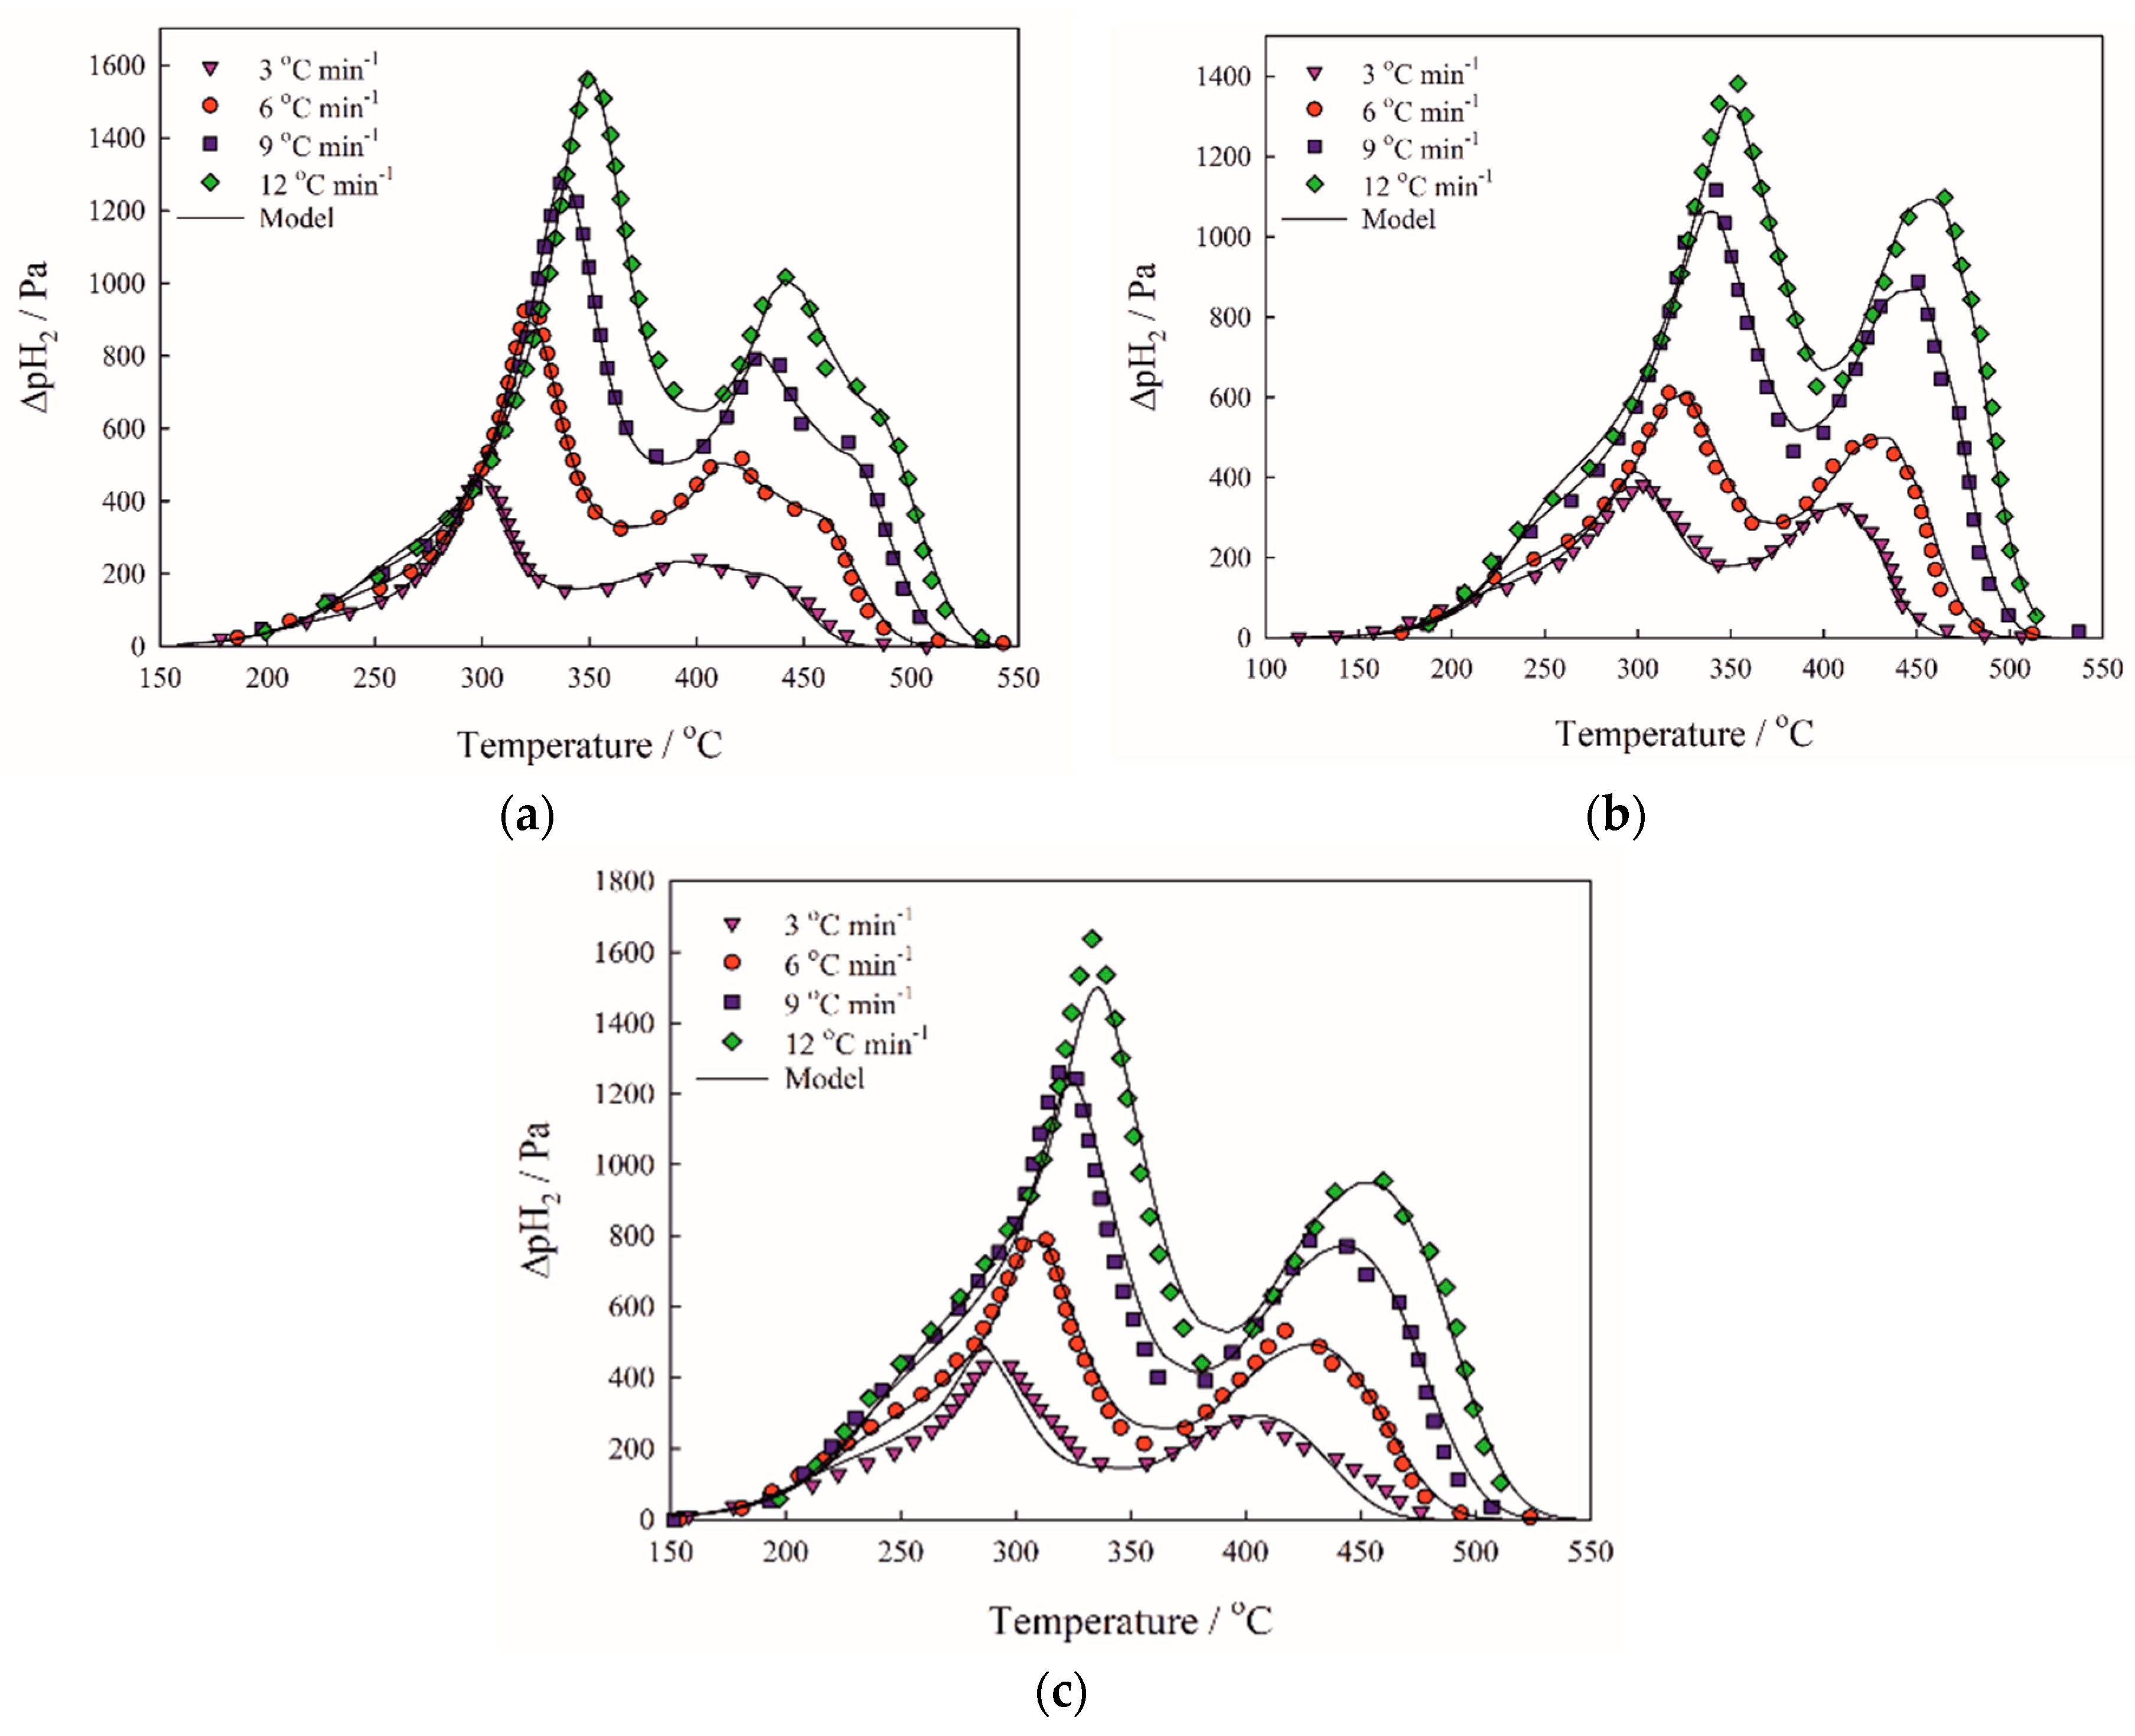
Birnessite TPR curves reveal changes introduced by operating under sorption conditions or by modification (
Figure 5a–c). The samples δ-MnO
2, δ-MnO
2-3cycle, and δ-MnO
2-N
2H
4 exhibit the same number of peaks in the spectrum, whereas the reduction is supposed to follow a three-stage mechanism, in which first and third stages are clearly distinguished [
32]. It is important to note that using results of kinetic analysis, particularly preexponential factors, one can track even small differences in morphology among birnessite samples since Equation (3) points out the connection between specific surface area at zero conversion and preexponential factor. Ratio of preexponential factors for the first reduction stage of the samples δ-MnO
2 and δ-MnO
2-3cycle precisely fits the ratio of their specific surface areas (A
regenerated/A
original = 3.2/2.0 = 1.6; S
regenerated/S
original = 19.8/12.4 = 1.6). At the same time, the difference between surface area of hydrazine-treated sample and the original one is reflected less accurately (A
hydrazine/A
original = 3.8/2.0 = 1.9; S
hydrazine/S
original = 32.0/12.4 = 2.6). This fact can be attributed to the higher accessibility of Mn
+3 sites that are also present in the birnessite samples and preexponential factors of the second stage of reduction clearly prove hydrazine treatment increases Mn
+3 sites activity (A
original,2 and A
regenerated,2—2.3; A
hydrazine,2—4.5). Reduction of birnessite stops at MnO formation, because this oxide is reduced at 1000 °C [
33], which is out of the studied temperature range. The samples A–C start to reduce at 150 °C, and the first peak maximum occurs at 300 °C. The long shoulder at the beginning of the reduction curve is caused by reduction of small particles of manganese oxides [
33] proved by relative surface area curves (
Figure 6a,b).
Sorption experiments were conducted to correlate the findings of structural character with functional performance of birnessite materials. Prepared sorbents were assessed with respect to the ability to retain Sr
2+ from simulated seawater (S-SW). The problem of radioactive strontium extraction from high salinity solutions formed during operation of nuclear power plants in the coastal area and at the maintenance of nuclear submarines. Birnessites are prospective sorbents to Sr, since the interlayer distance in its structure perfectly fits the Sr
2+ cation radius, thus providing a sufficient selectivity in the presence of other alkali-earth cations (Mg
2+ and Ca
2+) in the seawater. Additionally, the layered structure of birnessite allows using them repeatedly in the sorption-regeneration cycle. The distribution coefficients of Sr
2+ in S-SW in the presence of studied sorbents are given in
Table 3. It can be seen from the
Table 3 that δ-MnO
2-3cycle and δ-MnO
2-N
2H
4 are better in terms of sorption activity with respect to Sr
2+ as compared to the original δ-MnO
2 sample. This can be attributed to higher specific surface area and higher availability of sorbent’s active sites. Note high distribution coefficients the studied sorbents demonstrate, if we compare them to the systems obtained using similar synthesis procedure (by interaction of KMnO
4 and H
2O
2) [
34,
35,
36]. Layered manganese oxides exhibit an inferior performance in the presence of 0.05 M CaCl
2 as compared to the δ-MnO
2 and its derivatives (0.87 × 10
3 vs. 1.9 × 10
3, 2.5 × 10
3 and 3.0 × 10
3 mL g
−1, respectively). Such a difference in sorption characteristics are even more surprising taking into account an exceptional surface area of the reference manganese oxide with BET specific surface area reaching 212 m
2 g
−1 [
36]. Lower distribution coefficients are caused by mixed phase composition of the compared oxides, while in this work the obtained birnessites exhibit single-phase composition in case of non-reduced samples as well as the appearance of MnO(OH) after N
2H
4-treatment. Such phase compositions facilitate the sorption of Sr
2+, while the content of actually sorption active phase (K
2Mn
4O
8) is not so high in the mentioned works according to XRD patterns [
34,
35,
36].
Sorption under dynamic conditions provided the information on the sorbents’ performance under conditions close to the real technological operation. Reduction with hydrazine leads to high sorption efficiency (DF > 10
3 ≈ 99.9%) resulting in purification of 300 bed volumes of S-SW (
Table 3). At the same time, δ-MnO
2 and δ-MnO
2-3cycle allow to decontaminate with high DF only 130 bed volumes of S-SW from Sr-90. However, these sorbents remain efficient for three cycles of sorption-regeneration, while δ-MnO
2-N
2H
4 loses its sorption properties after two cycles due to poor mechanical stability (arising from high porosity).

 ,
, 


