Article

Culture Medium Optimization for Production of Rhamnolipids by Burkholderia glumae

INRS-Institut Armand-Frappier, Laval, QC H7V 1B7, Canada
*
Author to whom correspondence should be addressed.
Colloids Interfaces 2018, 2(4), 49; https://doi.org/10.3390/colloids2040049
Submission received: 6 September 2018 / Revised: 10 October 2018 / Accepted: 15 October 2018 / Published: 18 October 2018
(This article belongs to the Special Issue Biosurfactants: Trends and Applications)

Abstract

:
Burkholderia glumae is a biosafety level 1 bacterium capable of producing rhamnolipid biosurfactant with longer 3-hydroxy fatty acid chains moieties than those produced by the prototypal producer, the opportunistic pathogen Pseudomonas aeruginosa. Although the capacity of production of rhamnolipid, and the parameters affecting this production, are well established for P. aeruginosa, little is known about the factors that may affect their production in B. glumae. Hence, to evaluate and enhance the production of rhamnolipids in B. glumae, following the selection of best carbon and nitrogen sources, a two-level fractional factorial design experiment was performed to identify the limiting factors significantly affecting the production of rhamnolipids in this bacterial species. Effects of six inorganic nutrients and two physical parameters were studied, and mannitol, urea, CaCl2, and potassium phosphate buffer were selected for further optimization by applying a response surface methodology (RSM). Under the identified optimized conditions, a rhamnolipid production of 1.66 g/L was obtained, about five times higher than that of the initial non-optimized conditions. This represents a key step in the development of large-scale production processes.

1. Introduction

Biosurfactants are amphiphilic, surface-active molecules of biological origin capable of reducing surface and interfacial tensions [1]. They are increasingly relevant biotechnological products with characteristics such as low toxicity, high biodegradability and stable activity at extreme pH, salinity, and temperature, making them advantageous over their synthetic counterparts in a wide range of applications in various industries [2,3]. Among all classes of biosurfactants, glycolipids such as rhamnolipids are the most promising and investigated [4]. The structural diversity and environmental compatibility of rhamnolipids make them suitable for a variety of industrial, environmental and agricultural applications, such as emulsion polymerization, wetting, foaming, phase dispersion, emulsification and de-emulsification [3], or as antimicrobial, antifungal and antiviral agents [2].
Pseudomonas aeruginosa is by far the most investigated rhamnolipid-producing bacterial species, and essentially the only native producer used at the commercial scale [5,6]. However, the use of this bacterium in industrial rhamnolipid production is not ideal, as it is a well-known human opportunistic pathogen responsible for an array of infections [7] and the required biosafety measures can impose high costs to the production, and decrease the value of the end-product. Hence, heterologous production of rhamnolipids in non-pathogenic hosts or utilization of native non-pathogenic rhamnolipids producing bacteria to replace P. aeruginosa in production processes are promising strategies for reducing the production costs of these biosurfactants. In recent years, a few non-pathogenic rhamnolipid producers belonging to Pseudomonas species such as P. chlororaphis and P. putida [8,9] and a few species belonging to the Burkholderia genus such as B. thailandensis, B. plantarii and B. glumae have been reported [10,11,12]. Furthermore, a few microorganisms such as P. putida and Saccharomyces cerevisiae have been successfully engineered for heterologous production of rhamnolipids [13,14,15]
The rhamnolipids produced by Burkholderia are typically composed of a dimer of β-hydroxy fatty acid, coupled to two (di-rhamnolipids) or, in a smaller proportion, to one (mono-rhamnolipids) molecules of rhamnose. The main difference between the rhamnolipids produced by Burkholderia spp. and P. aeruginosa is the length of the β-hydroxy fatty acid chains [10]. For example, B. glumae AU6208 produces a mixture of mono- and di-rhamnolipid congeners with side chain lengths varying from C10-C12 to C16-C16 with C14-C14 being predominant [12]. Such long chain lengths have not been reported for P. aeruginosa [6].
While there is ample literature on the nutritional and environmental factors promoting rhamnolipid production by P. aeruginosa [16], there is very little information available on growth factors affecting the production of rhamnolipids by Burkholderia species. In this regard, optimization of nutritional and environmental factors affecting the production of rhamnolipids in non-pathogenic Burkholderia strains is an important step in the development of a cost-effective process. In the present study, the reference B. glumae strain BGR1, which is not a human pathogen, was chosen to enhance the production of rhamnolipids through culture medium optimization. Importantly, as the B. glumae BGR1 genome has been sequenced [17], we know that, in contrast with B. thailandensis, it carries only one copy of the rhl gene cluster in which the rhlA, rhlB and rhlC genes responsible for the biosynthesis of rhamnolipids are located [10,12]. This and the advantage that in B. glumae production of rhamnolipids is under control of only one quorum sensing system [18] make B. glumae an ideal candidate for rhamnolipid production to optimization through genetic engineering. Besides, the fact that B. glumae has already been utilized for industrial-scale production of a lipase [19] suggests that it is an interesting candidate for cost-effective industrial production of rhamnolipids. Therefore, we hypothesize that capacity of production of rhamnolipids in B. glumae BGR1 can be enhanced by optimization of nutritional and process variables.
Mukherjee et al. [20] identified the optimization of the cultivation conditions as a crucial issue in the development of cost-competitive processes. The classical method of media optimization involves changing one-factor-at-a-time (OFAT) while holding the remaining factors at fixed levels. This laborious and time-consuming one-dimensional method typically does not guarantee determination of optimal conditions, as it does not consider interaction between variables. To overcome time and resource constraints, the optimization process through statistical experimental techniques has been demonstrated to be useful in decreasing the number of required experiments and, as a consequence, optimize time and resource consumption. In fact, in biological processes where understanding and knowledge of associated phenomenological models are limited, response surface methodology (RSM) which integrates statistical experimental design fundamentals, regression modeling techniques, and elementary optimization methods can be used to obtain a mathematical function which connects independent factors under study and their interactions with response of the system [21]. Such an empirical model can then be used to either rapidly screen independent variables or optimize the response of the process.
Indeed, statistical experimental design techniques, such as factorial designs and RSM, have been successfully applied to screen and optimize critical media components and culture conditions for enhanced production of rhamnolipids [22,23,24,25]. For instance, the nature of carbon and nitrogen sources and the concentration of phosphate [24], iron and calcium, magnesium, potassium in the medium [26,27], the operational conditions such as pH [28] and temperature [12,29] influence the production and yield of rhamnolipids in P. aeruginosa.
Here, in the preliminary step of optimization of a culture medium for B. glumae, seven carbon sources and six nitrogen sources were evaluated to choose the optimal sources for rhamnolipid production. Moreover, a fractional factorial design (FFD) was used to identify factors with a significant impact on the production of rhamnolipids. Subsequently, an RSM [21] including a central composite design (CCD) experiment was applied to determine the optimum values of the significant variables for enhanced production of rhamnolipids by B. glumae BGR1.

2. Materials and Methods

2.1. Microorganism and Inoculum Preparation

B. glumae wild-type, reference strain BGR1 was used in this study [17,30]. The bacteria were routinely grown from frozen glycerol stock by culturing in 3 mL tryptic soy broth (TSB) (BD) overnight in test tubes incubated at 37 °C and shaking in a TC-7 roller drum (New Brunswick Scientific Co., New Brunswick, NJ, USA) at 240 rpm. For inoculation, an overnight culture was centrifuged and washed twice with phosphate-buffered saline (PBS) and resuspended in PBS which was then used to inoculate cultures by adjusting the optical density at 600 nm (OD600) to 0.05. Unless otherwise specified, all experimental design cultures were carried out in 250 mL Erlenmeyer flasks containing 25 mL of the appropriate medium for 6 days in incubator shakers (New Brunswick Scientific Co., New Brunswick, NJ, USA). Initially, mineral salt medium (MSM) used for the production of rhamnolipid by B. glumae contained the following ingredients (g/L): KH2PO4, 2.57; K2HPO4, 5.42; urea, 6; glycerol, 20; MgSO4·7H2O, 0.4; and CaCl2·2H2O, 0.1. Trace elements were added where noted (2 mL/L of a stock solution composed of (g/L): FeSO4·7H2O, 2; MnSO4·H2O, 1.5; (NH4)6Mo7O24·4H2O, 0.6; ZnSO4·7H20, 1.4; CoCl2·6H2O, 1.2; CuSO4·5H2O, 1.2; and sodium citrate·2H2O, 2). The pH of the medium was adjusted to 7 using 2N HCl and 2N NaOH.

2.2. Quantification of Rhamnolipids and Mannitol

The concentrations of rhamnolipids and mannitol in the various bacterial cultures were determined by Liquid chromatography/Mass spectrometry [31]. Briefly, 1 mL culture supernatant was retrieved and the biomass removed by centrifugation at 16,000× g for 10 min. For each sample, 5,6,7,8-tetradeutero-4-hydroxy-2-heptylquinoline (HHQ-d4) at the final concentration of 10 mg/L was added to 500 μL of the supernatant as an internal standard [10]. Samples were analyzed by high-performance liquid chromatography (HPLC; Waters 2795, Mississauga, ON, Canada) equipped with a Phenomenex Synergi Hydro-RP column (50 × 2.00 mm id, 2.5 μm) using a water/acetonitrile gradient with a constant 2 mM ammonium acetate [10]. The detector was a quadrupole mass spectrometer (Quattro Premier XE, Waters). Analyses were carried out in the negative electrospray ionization (ESI) mode. The concentrations of rhamnolipids were calculated by comparing the data of a standard curve prepared with a known concentration of pure B. glumae rhamnolipids. Similarly, the concentrations of mannitol were calculated by comparing the data of a calibration curve prepared with known concentrations of mannitol and HHQ-d4 as internal standards.

2.3. Biomass Measurement

The dry cell weight was measured by centrifuging the whole culture medium, resuspending the pellet in 5 mL of distilled water and drying the suspension in a pre-weighed aluminum dish for 72 h at 60 °C.

2.4. Selection of Optimal Carbon and Nitrogen Sources

The OFAT strategy was used to identify the optimal carbon and nitrogen sources for the first step of optimization. Rhamnolipid production of BGR1 in MSM with seven carbon sources (glycerol, dextrose, fructose, sorbitol, maltose, mannitol and galactose) and six nitrogen sources (urea, ammonium nitrate, sodium nitrate, potassium nitrate, ammonium sulfate, and ammonium chloride) were evaluated. The effects of various carbon sources were tested by using urea as the nitrogen source [12]. For the effect of nitrogen sources, glycerol was used as the carbon source [12]. Cultivation was performed for 6 days in 5 mL of the culture medium in test tubes incubated at 34 °C and shaking in TC-7 roller drum at 240 rpm. The experiment was repeated two times, and one-way analysis of variance (ANOVA) was performed to evaluate the significance of each carbon or nitrogen source on the rhamnolipid production for the statistical confidence of 95%.

2.5. Fractional Factorial Design (FFD)

For the identification of factors having a statistically significant influence on rhamnolipid production by B. glumae, a resolution IV FFD which resolves aliases between main effects and two-factor interactions was employed. Eight factors at two levels were tested for their effect on rhamnolipid production: medium components, namely carbon (mannitol), nitrogen (urea), potassium phosphate (concentration of potassium phosphate buffer), calcium chloride, magnesium sulfate and trace elements, and culture conditions, namely agitation rate (rpm) and incubation temperature. The values of each component were set up based on previous studies and the low and high levels of each component were set far enough from each other to identify those having a significant influence on the production of rhamnolipids. Table 1 shows the values of low and high levels of factors used in the FFD. The factors were screened with a 16-run experimental design. For each assembly, the production of rhamnolipids (g/L) and biomass dry weight (g/L) were measured on the sixth day of culture.

2.6. Response Surface Methodology (RSM)

Based on the FFD results, an RSM was used to develop an empirical model: (1) to predict the production of rhamnolipids by B. glumae BGR1; and (2) to determine the optimum level of the key significant variables to maximize the production of rhamnolipids. A 24 full factorial CCD with a total of 30 experiments was performed, in which levels of four significant independent variables, namely mannitol ( X 1 ), urea ( X 2 ), potassium phosphate buffer ( X 3 ) and CaCl2 ( X 4 ), were further investigated at five levels (Table 2), including eight star points and six replicates at the center points to fit a second-order polynomial equation. The maximum and minimum values of each component were set up based on preliminary studies (unpublished).
The relationship between variables and their interaction on the response ( y ) were calculated using the following second-order polynomial equation:
  y = β 0 + i = 1 4 β i X i + i = 1 4 β i i X i 2 + i = 1 3 i = j + 1 4 β i j X i X j  
where y refers to the predicted response; X i and X j are the coded levels of the independent variables; and β 0 , β i , β i i and β i j are regression coefficients for the intercept, linear, quadratic and interaction terms, respectively.
In this RSM, except for the selected variables, all other conditions used in this experiment were fixed. MgSO4·7H2O at a concentration of 0.1 g/L was used in all experimental runs. The cultures were conducted for six days at 30 °C and with an agitation of 100 rpm. The experiments were performed three times.

2.7. Design Matrix and Data Analysis

Design of matrix for FFD and CCD and data analysis were performed using Design-Expert 11.0.5.0.

2.8. Optimization and Model Verification

To find optimum values of factors which result in an enhanced production of rhamnolipids, a numerical optimization was carried out to simultaneously maximize production and substrate-to-product conversion yield within the range of experimentation investigated. Design-Expert 11.0.5.0 was used for simultaneous optimization of the multiple responses. Thereafter, cultures were conducted to validate the predicted responses for the optimum levels of factors by the numerical optimization.

3. Results and Discussion

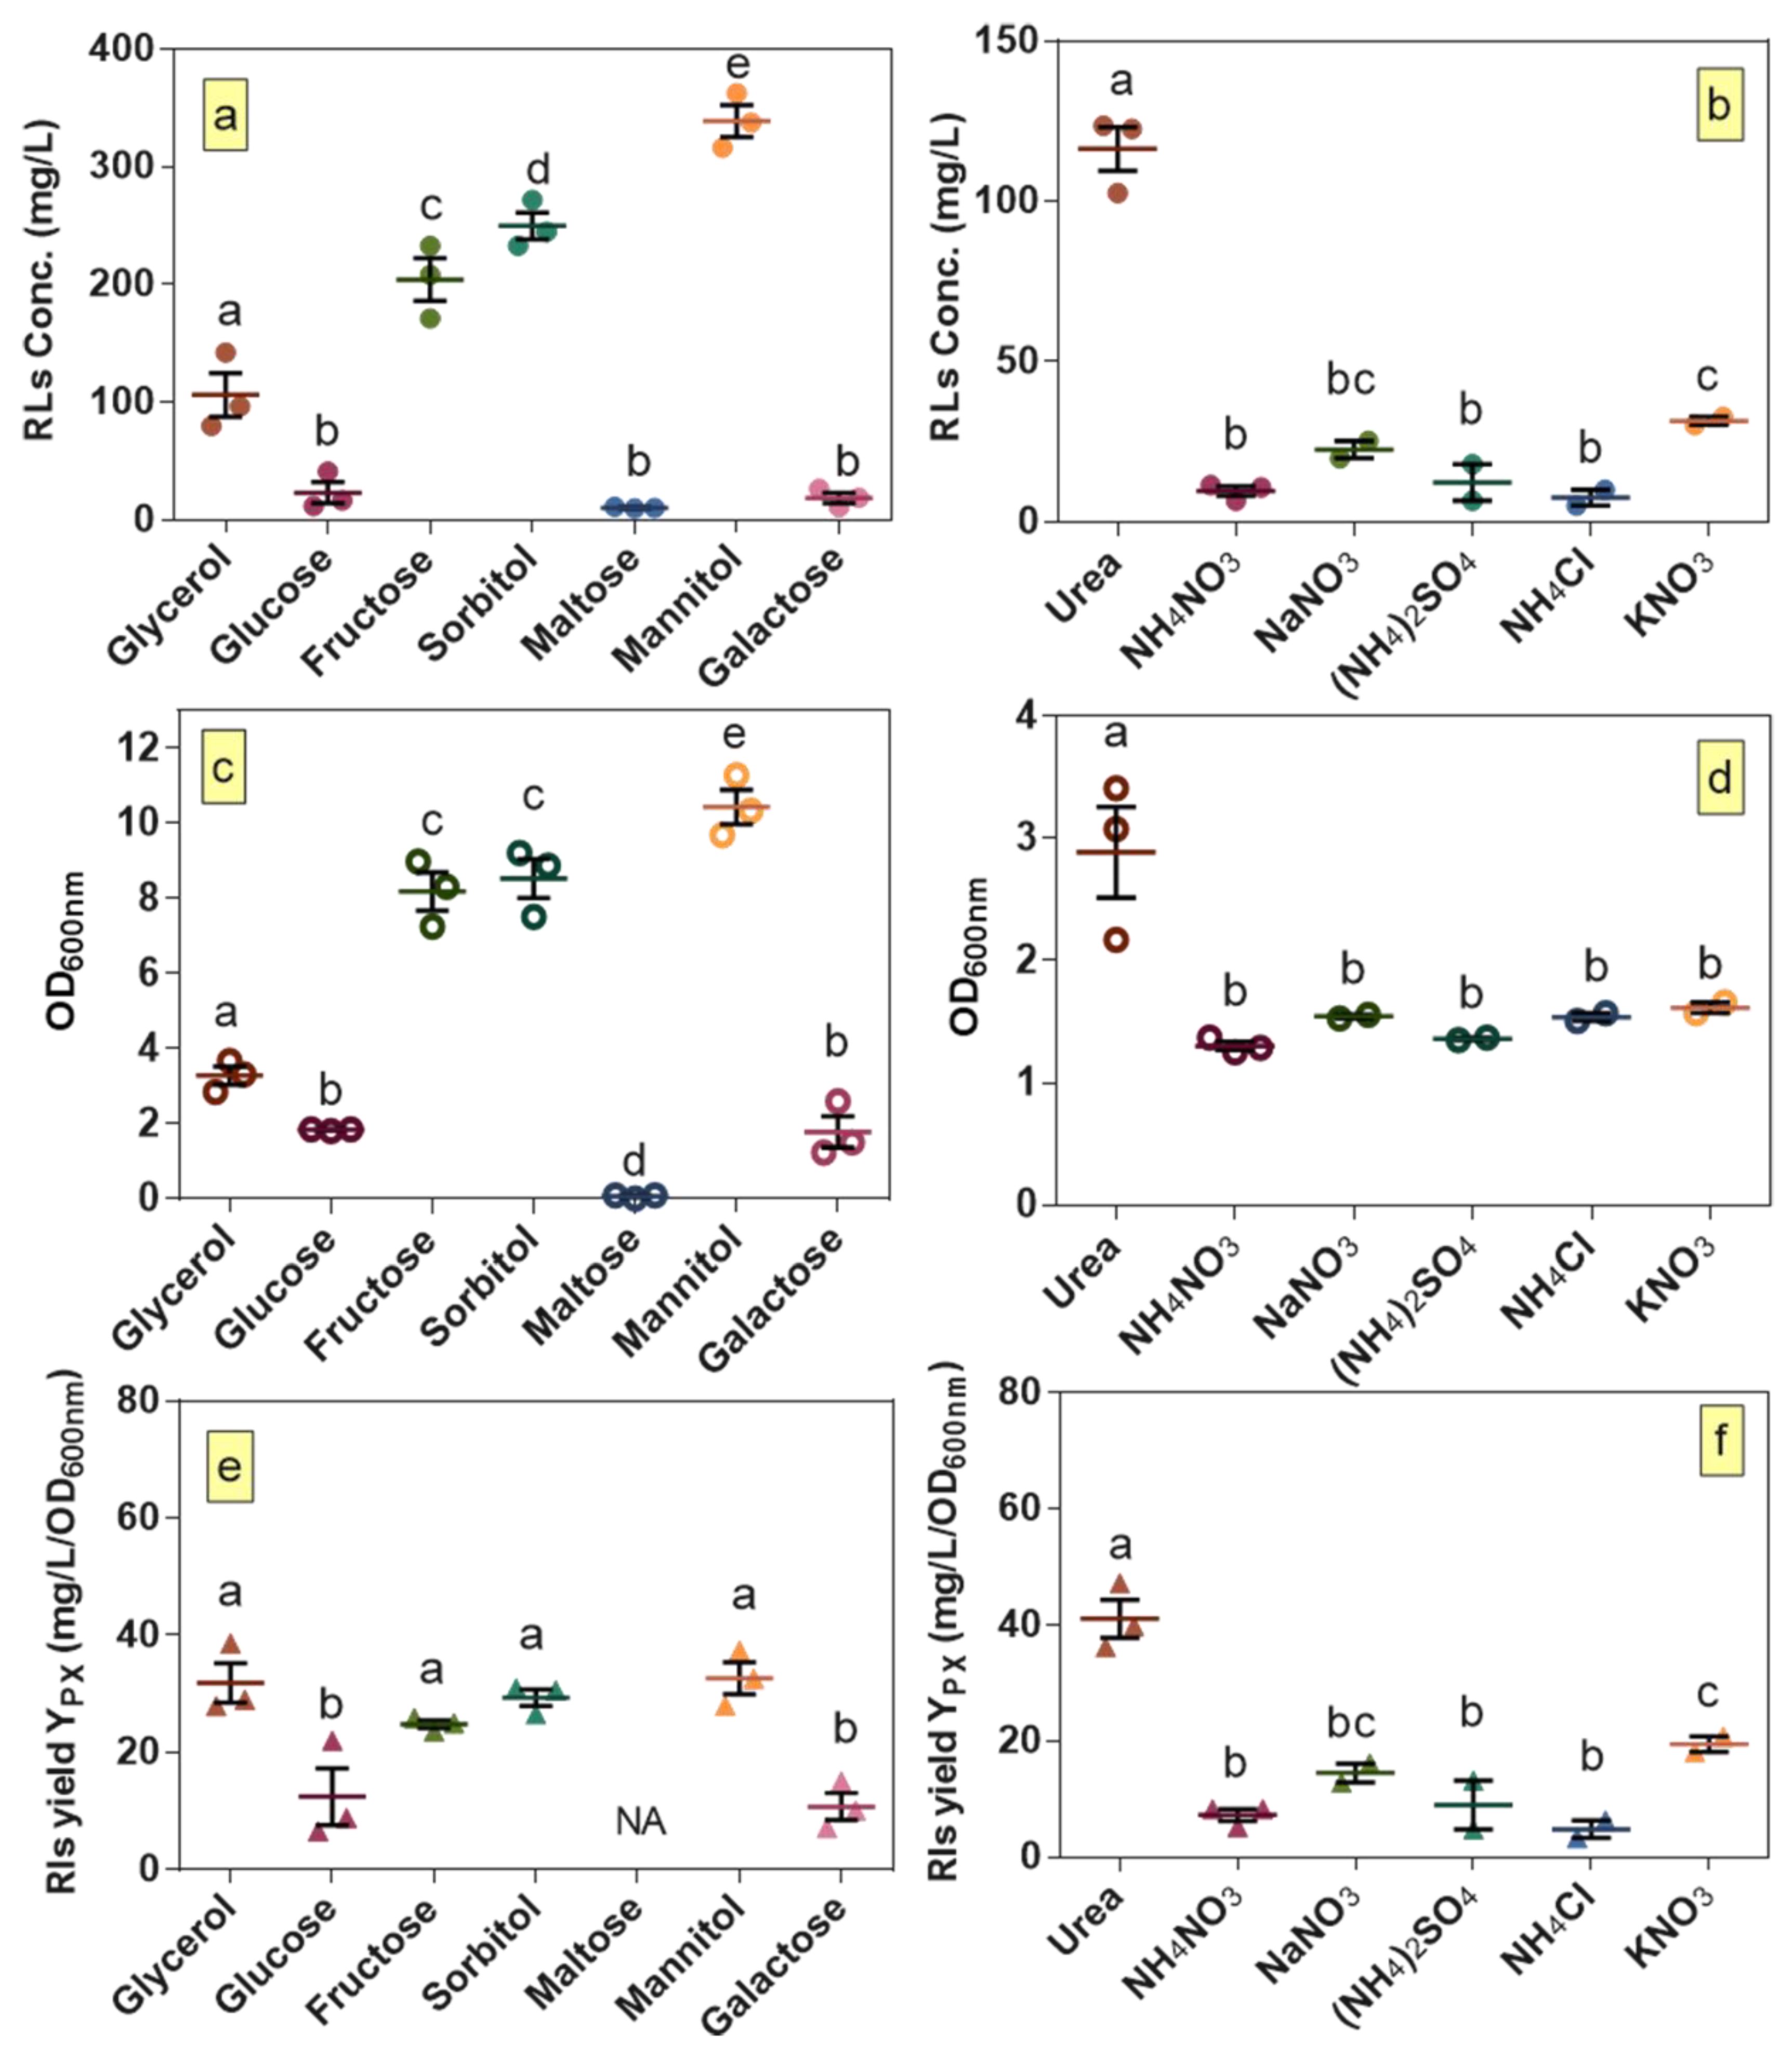
3.1. Selection of Optimal Carbon and Nitrogen Sources

The results of the preliminary screening for various carbon and nitrogen sources are shown in Figure 1. Among the seven carbon sources tested, rhamnolipid production was highest when mannitol was used (Figure 1a). Similarly, among all of the screened nitrogen sources such as inorganic and ammonium salts, urea was clearly the preferred source for rhamnolipid production by B. glumae BGR1 (Figure 1b).
Our previous study with B. glumae strain AU6208 demonstrated that production of 555.9 mg/L could be achieved using urea and glycerol as nitrogen and carbon sources, respectively [12]. However, strain BGR1, used in the present study, produced lower concentrations of rhamnolipids while reaching a higher OD600 when cultured under the same conditions. The growth results demonstrate that the main difference in production of rhamnolipids observed when testing different carbon and nitrogen sources is correlated with differences in growth (Figure 1c,d) as confirmed from calculated yields of rhamnolipids per biomass (Figure 1e,f). Regarding carbon sources, fructose, sorbitol and mannitol led to higher growth than glycerol while no growth was obtained when maltose was used as the carbon source. Similarly, rhamnolipid titers in cultures with fructose, sorbitol and mannitol were higher than culture with glycerol. Regarding nitrogen sources, except for urea which clearly supports the highest growth and production of rhamnolipids compared to the other nitrogen sources, no significantly different effect was observed for other nitrogen sources. Interestingly, while no significant difference in rhamnolipids yield per biomass was observed using tested different carbon sources that had the highest rhamnolipids titers, among tested nitrogen sources, yield of rhamnolipids per biomass was significantly higher using urea. This suggests that urea as a nitrogen source might play a key role in directing resources towards rhamnolipid biosynthesis instead of cell growth. Overall, since our objective in this step of optimization was to select carbon and nitrogen sources that give the highest rhamnolipid titers and not necessarily the highest yields per biomass, mannitol and urea were selected for the next steps of optimization.

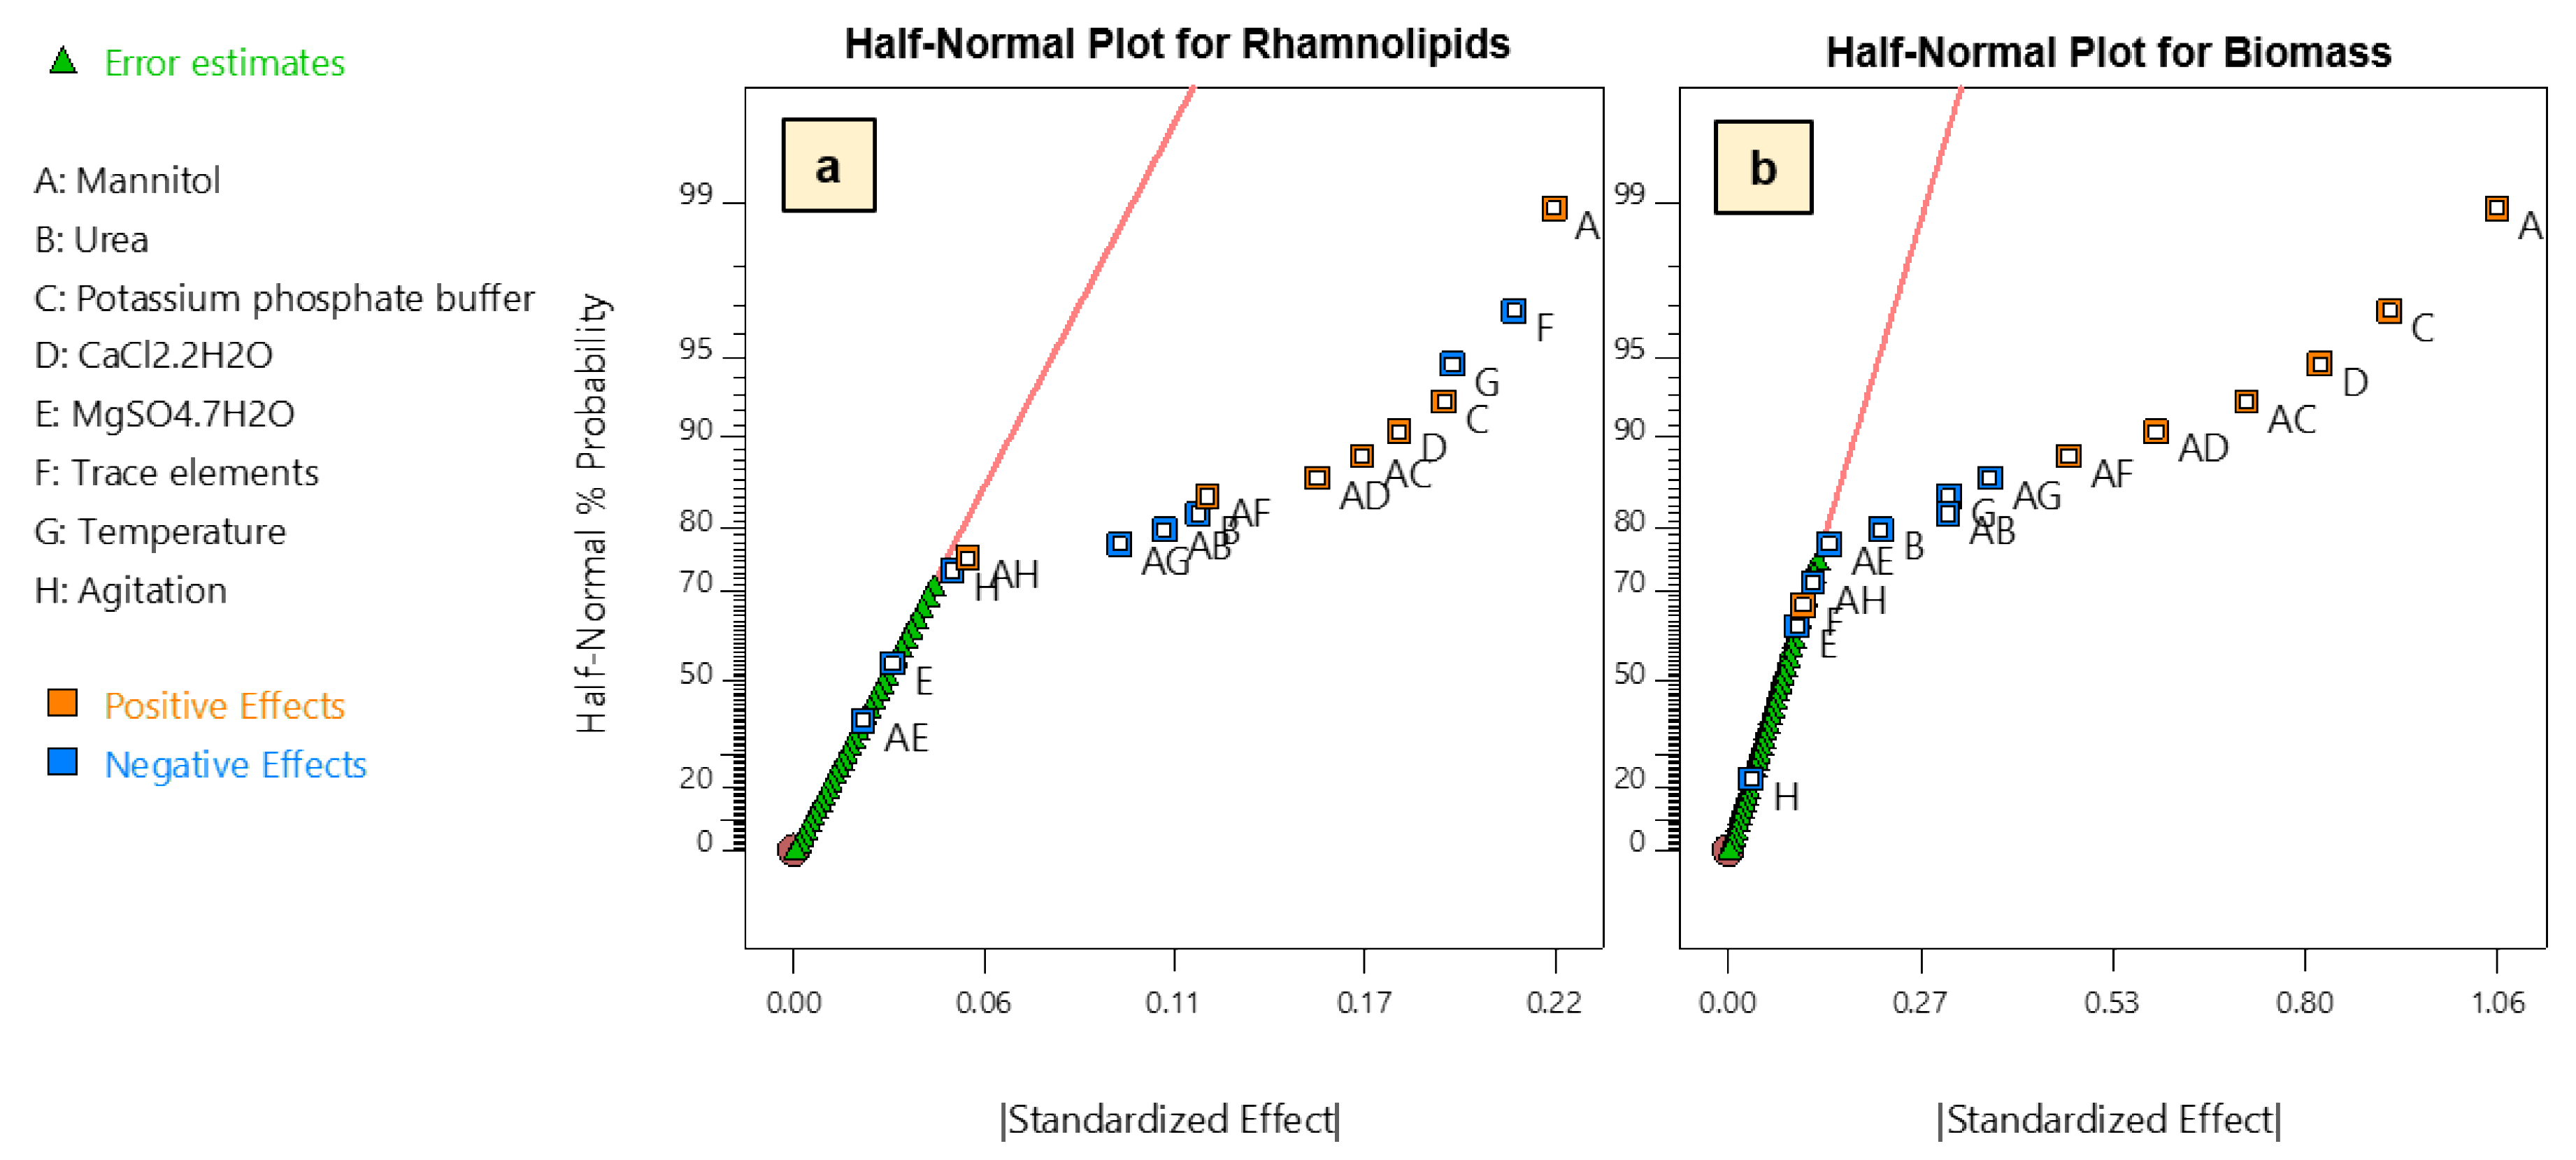
3.2. Selection of Significant Parameters by Fractional Factorial Design

To determine the significant culture parameters affecting rhamnolipid production by B. glumae, a 2(8-4) FFD was performed. The experimental design for 16 runs at two levels for each factor along with mean values of responses for three replicates (±standard deviation) is presented in Table 3.
Based on the obtained responses, preliminary regression model analysis and analysis of variance (ANOVA) were performed. To select the main effects having a significant contribution to both production of rhamnolipids and biomass, a half-normal probability plot was used to select factors whose confidence levels were higher than 95% (Figure 2). Thus, regarding production of rhamnolipids, we found that, while mannitol concentration, potassium phosphate buffer and calcium chloride have the most positive significant effect on production, trace elements, temperature, and urea have significant negative effects. On the other hand, magnesium sulfate and agitation rate were found to be non-significant (Figure 2a). Similarly, the same main factors except trace elements were also found to have a significant influence on biomass production (Figure 2b).
Accordingly, by retaining the significant factors and excluding the insignificant terms from the first-order regression models, the reduced models of responses in Equations (2) and (3) were obtained:
Y R h a m n o l i p i d s = 0.28 + 0.12   A 0.063   B + 0.099   C + 0.085   D 0.11   F 0.10   G 0.058   A B + 0.087   A C + 0.073   A D + 0.057   A F 0.051   A G
Y B i o m a s s = 0.97 + 0.55   A 0.12   B + 0.47   C + 0.039   D 0.17   G 0.17   A B + 0.37   A C + 0.28   A D + 0.22   A F 0.20   A G
Results of the ANOVA for the reduced regression models for both responses (rhamnolipids and biomass production) are presented in Table 4 and Table 5.
As shown from the coefficients of the first-order regression model for rhamnolipid production, the addition of trace elements had a significant negative effect on the production [27]. Similar results have been observed in P. aeruginosa where iron-limited conditions have led to an increase in rhamnolipids biosynthesis gene expression, and repletion of iron, as well as has caused down-regulation of those genes, which correlated with production [26,32,33]. Overall, since trace elements had a significant negative effect on rhamnolipids production and non-significant effect on biomass production, they were not included in further cultures. Moreover, a higher temperature which had a significant negative effect on both rhamnolipids and biomass production was excluded from further analysis and the lower level of temperature was selected for the further optimization steps.

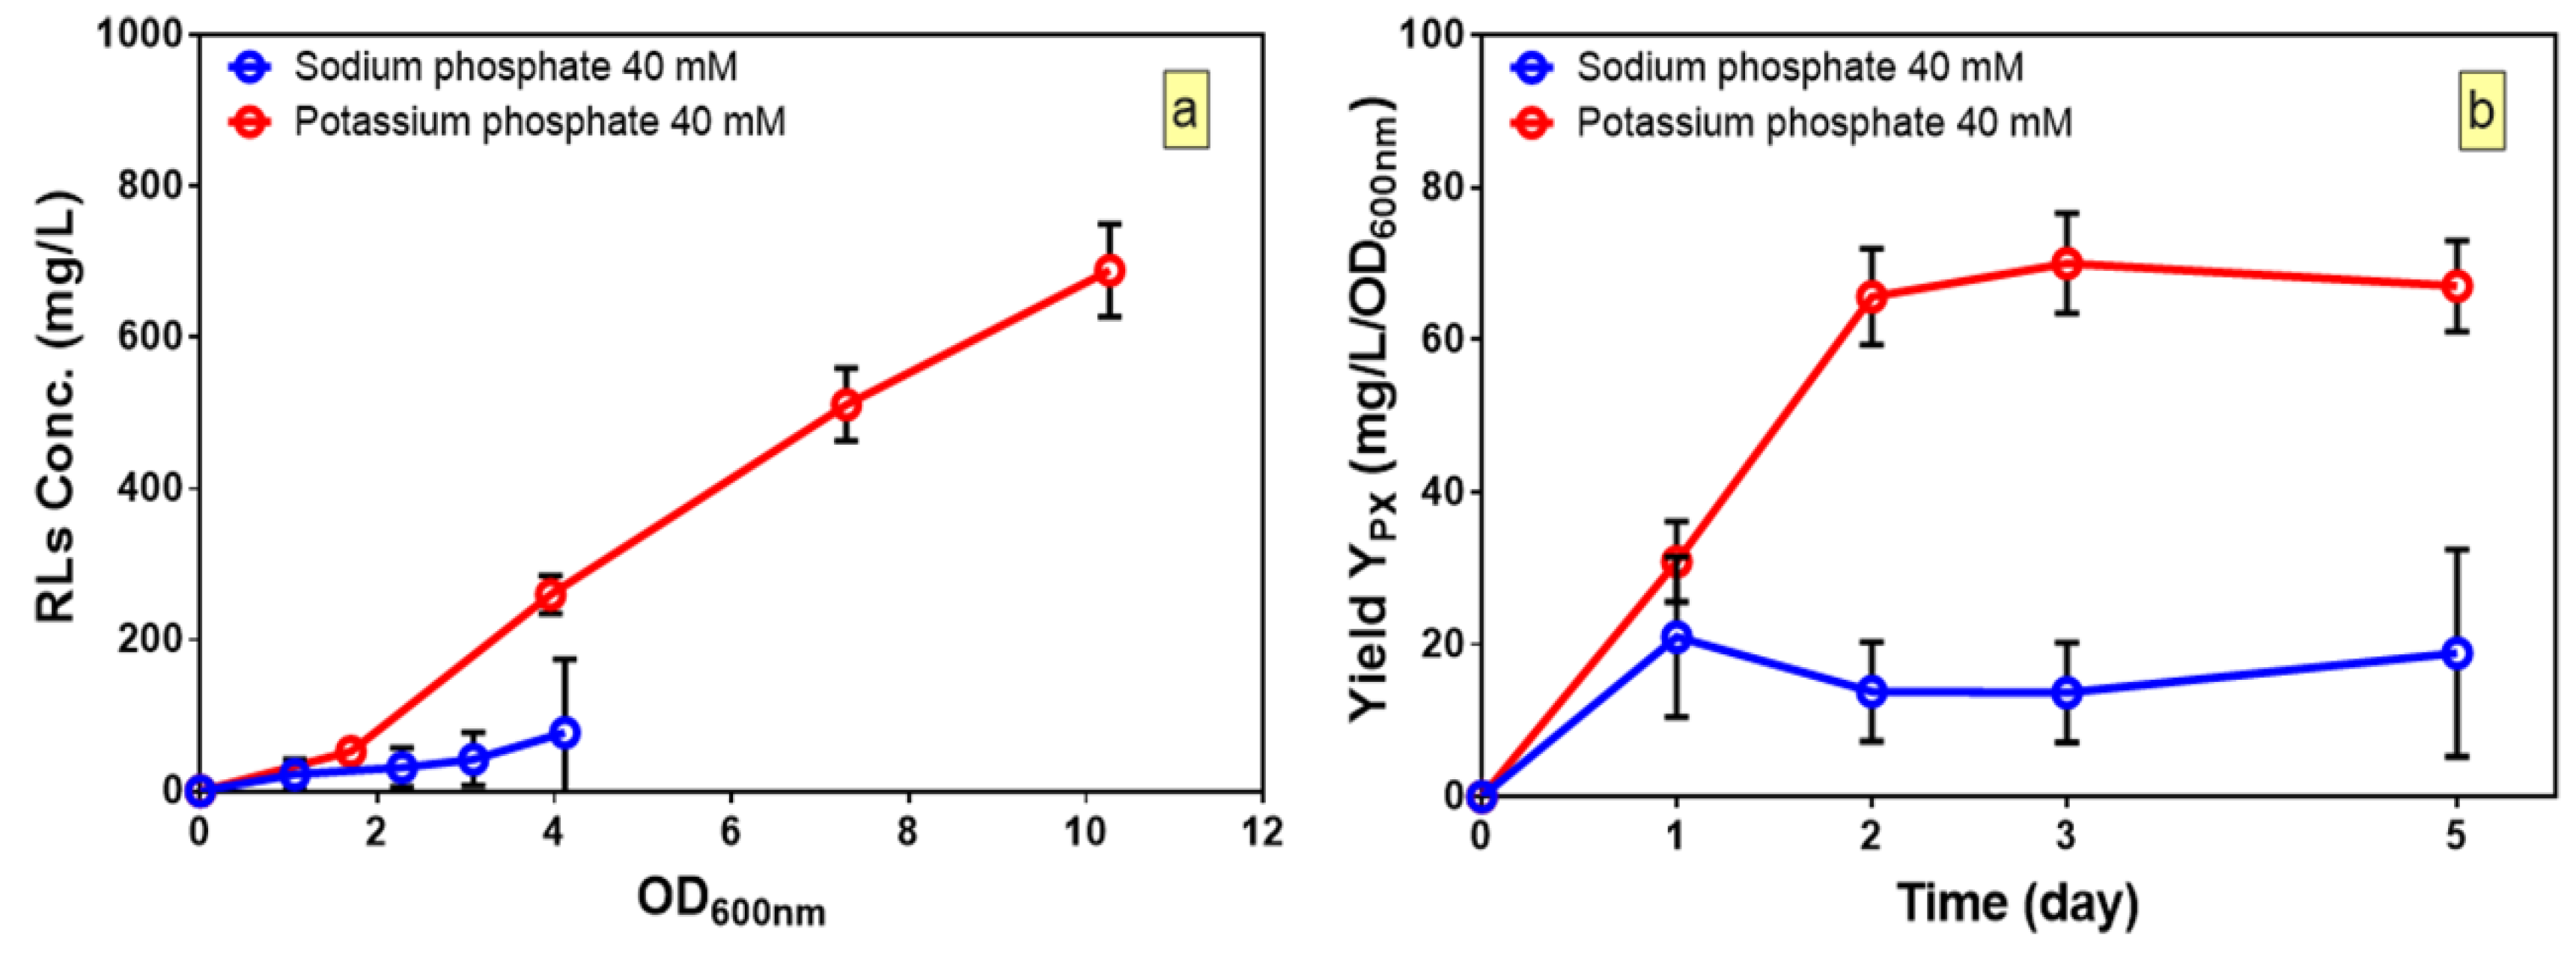
3.3. CCD and Fitted Regression Models for Production of Rhamnolipids by B. glumae BGR1

Once the factors with a significant effect on production of rhamnolipids were determined using FFD, a CCD experiment was performed to optimize these factors with regard to rhamnolipids production, biomass and substrate-to-product conversion yield (YP/S) as response variables. The experimental data obtained from the CCD allowed the development of second-order polynomial equations where each response variable was estimated as a function of mannitol (A), urea (B), potassium phosphate (C) and CaCl2 (D) along with their interaction and second-order effects according to Equation (1). The results obtained were then analyzed by ANOVA to assess the adequacy of fit and statistical significance of model coefficients. Probability values less than 0.05 for the model meant that selected variables and their interaction are significant and can be used to explain the variability observed in the response. Accordingly, statistically significant terms were retained, non-significant terms were dropped from the models, and then a new ANOVA was performed to obtain the reduced models. The following fitted regression reduced models (equations in terms of coded values for factors) were used to quantitatively investigate the effects of mannitol, urea, potassium phosphate buffer and CaCl2 on production of rhamnolipids by B. glumae with regard to their effect on biomass production and YP/S.
Rhamnolipids production:
Y R h a m n o l i p i d s = 0.6 + 0.068   A 0.044   B + 0.28   C 0.083   D + 0.061   A B 0.051   B C 0.061   C D 0.044   C 2 + 0.059   D 2
Biomass production:
Y B i o m a s s = 2.11 + 0.56   A + 1.32   C + 0.28   D + 0.19   A C + 0.12   A 2
Substrate-to-rhamnolipids conversion yield:
Y Y P / S = 0.051 0.011 A 4.221 × 10 3   B + 7.630 × 10 3   C 7.892 × 10 3   D + 2.937 × 10 3   A C + 4.043 × 10 3   A D 3.307 × 10 3   B C + 3.731 × 10 3   A 2 2.016 × 10 3   B 2 3.443 × 10 3 C 2
The result of the variance analysis for fitting of the quadratic polynomial equation (Equation (1)) to obtained data for each response are presented in Table 6, Table 7 and Table 8.
The results of the ANOVA on the quadratic regression models show that they are significant (Fisher F-test; Pmodel > F = 0.0001). Besides, the test for lack-of-fit which compares the variation around the model with “pure” variation within replicated observations gave non-significant lack of fit for all three models, which is desirable. The goodness-of-fit of the models were evaluated by the determination coefficient (R2) and adjusted coefficient of determination (R2adjusted). While the R2 coefficient is a measure of the amount of variation around the mean explained by the model, the adjusted R2 gives the proportion of the total variation in the response variable explained by the independent variables included in the model. In the present study, the adjusted R2 coefficient for rhamnolipid production, substrate-to-product conversion yield, and biomass production were 0.8236, 0.8307 and 0.9286, respectively. This would imply that the experimental data show a good fit with the quadratic models and the models are significant representation of the actual relationships between the responses and regressors. For all three models, the predicted coefficient of determination (R2predicted) coefficient is also in reasonable agreement with adjusted R2 coefficient since the difference between them is less than 0.2. Moreover, the coefficient of variance (CV) for production of rhamnolipids, YP/S and biomass production were found to be 17.60%, 13.54% and 14.74%, respectively. Adequate precision value, which is measure of the signal-to-noise ratio, were higher than the required value (4.00) for all models. Furthermore, the predicted residual sum of squares (PRESS), which is a measure of how a particular model fits each point in the design were found to be 1.03, 7.20 and 3.399 × 10⁻³ for rhamnolipid production, biomass and YP/S, respectively. Overall, the ANOVA suggests that the models are adequate for prediction and optimization of responses.
Once fitted models are found to be adequate to predict the responses, the relative contribution of each factor to dependent variable can be measured by the respective coefficient in the fitted models. The concentration of potassium phosphate buffer was found to have a significant impact in all three models, and indicates the importance of the role of potassium phosphate buffer in production of rhamnolipids as well as growth. Besides, the positive sign of coefficient for potassium phosphate in the fitted model for YP/S shows that the substrate-to-product conversion yield increases by increasing levels of potassium phosphate buffer. To understand whether it is the potassium or the phosphate that affects rhamnolipid production, the kinetic of production of rhamnolipids was compared in media (Run 14, Table 3) with either potassium phosphate or sodium phosphate buffer (pH 6) at 40 mM concentration (Figure 3a). We found that growth and production of rhamnolipids in cultures with potassium phosphate was significantly higher compared to cultures when sodium phosphate was used as the buffer (Figure 3a). Besides, the final pH of the cultures was also measured and compared to the initial pH to ensure that both buffers kept the pH constant. The fact that no change in final and initial pH in both cultures was observed (data not shown) suggests that it is the potassium and not the phosphate which plays an essential role in growth and production of rhamnolipids in B. glumae. Furthermore, by calculating the yields of rhamnolipids per biomass, we found that in culture with potassium phosphate, after two days of culture, while growth continued, the yields of rhamnolipids per biomass reached a plateau and improved the yield by three-fold as compared to cultures with sodium phosphate buffer (Figure 3b). This suggests that production of rhamnolipids is not solely dependent on growth and can be improved by enhancing YP/S by achieving optimal values of potassium phosphate buffer concentration.
The positive sign of coefficients for mannitol in fitted models of rhamnolipid production and biomass shows that they increase upon increasing mannitol. However, the negative sign of this regressor’s coefficient for YP/S shows an inverse correlation between concentration of mannitol and its conversion to rhamnolipids. It shows that an increased concentration of mannitol favors more growth rather than production of rhamnolipids. Regarding urea, counterintuitively, we found that, while it has a negative effect on rhamnolipid production and substrate-to-product conversion yield, it does not have any significant effect on biomass production. Our results agree with previous findings on rhamnolipid production by P. aeruginosa that higher C:N ratios and nitrogen-limited conditions favor higher rhamnolipid productions and productivity [34,35]. Moreover, a positive sign of calcium chloride coefficient in the fitted model of biomass production shows that it has a positive influence on growth while it has a negative effect on rhamnolipid production and YP/S.
To illustrate the relative contribution of each factor to every dependent variables and help interpret the interactions between factors, three-dimensional response surface plots for three responses are presented in Figure 4, Figure 5 and Figure 6. Variables with the largest absolute coefficients for quadratic and interaction terms were selected for the axes of response surface plots to represent the curvature and factors interactions. Potassium phosphate buffer and calcium chloride were chosen for RSM plots of rhamnolipid production, while mannitol and urea concentration were kept at their central levels (Figure 4). Accordingly, potassium phosphate buffer and mannitol were selected for RSM plots of biomass production and YP/S (Figure 5 and Figure 6).
Figure 4 shows that the effects of potassium phosphate buffer and calcium chloride on rhamnolipid production are not strictly linear. While calcium chloride has a negative coefficient (first-order term) which translates to an increased production of rhamnolipids upon reduction of calcium chloride to its low level, its negative coefficient for interactive term with potassium phosphate suggest that it interacts negatively with potassium phosphate buffer. Hence, this interaction implies that a stronger influence of potassium phosphate buffer occurs when the calcium chloride is at its lower level.
Figure 5 shows the dependency of biomass growth on potassium phosphate buffer and mannitol while the concentration of calcium chloride and urea were set at their intermediate levels.
As can be seen, the positive interactive coefficient of mannitol with potassium phosphate buffer in the fitted model of biomass indicates that the effect of mannitol on biomass is more pronounced when potassium phosphate buffer is set at its higher levels. Accordingly, the maximum biomass production (5.4 g/L) takes place at higher levels of potassium phosphate buffer (77.5 mM) and mannitol (4%) (Figure 5).
Figure 6 represents the three-dimensional response surface plot for the effects of mannitol and potassium phosphate buffer on YP/S.
As can be seen, low levels of mannitol favor higher substrate-to-product conversion yields and, in fact, this leads to better substrate utilization efficiency as higher levels of mannitol only increase contribution to biomass production. Similarly, a reduction in urea levels leads to an increase in rhamnolipid production as well as substrate-to-product conversion yield. These results suggest that low carbon levels in combination with low nitrogen levels which lead to slow growth rate are key factors to increase the productivity of rhamnolipids. Indeed, considering the role of quorum sensing in regulation of production of rhamnolipids in B. glumae [18], these results are in agreement with our previous findings where decreasing nutrient concentrations amplifies rhamnolipid biosynthesis gene expression, revealing a system where quorum sensing-dependent regulation is specifically triggered by growth rate and increase specific rhamnolipids yield [36]. Regarding the effect of CaCl2 on YP/S, while decreasing the CaCl2 levels from 0.26 g/L to 0.13 g/L has a negative effect on biomass formation, it leads to an increase in substrate-to-product conversion yield (from 0.088 to 0.1 g/g) and overall rhamnolipid production (Figure 4).

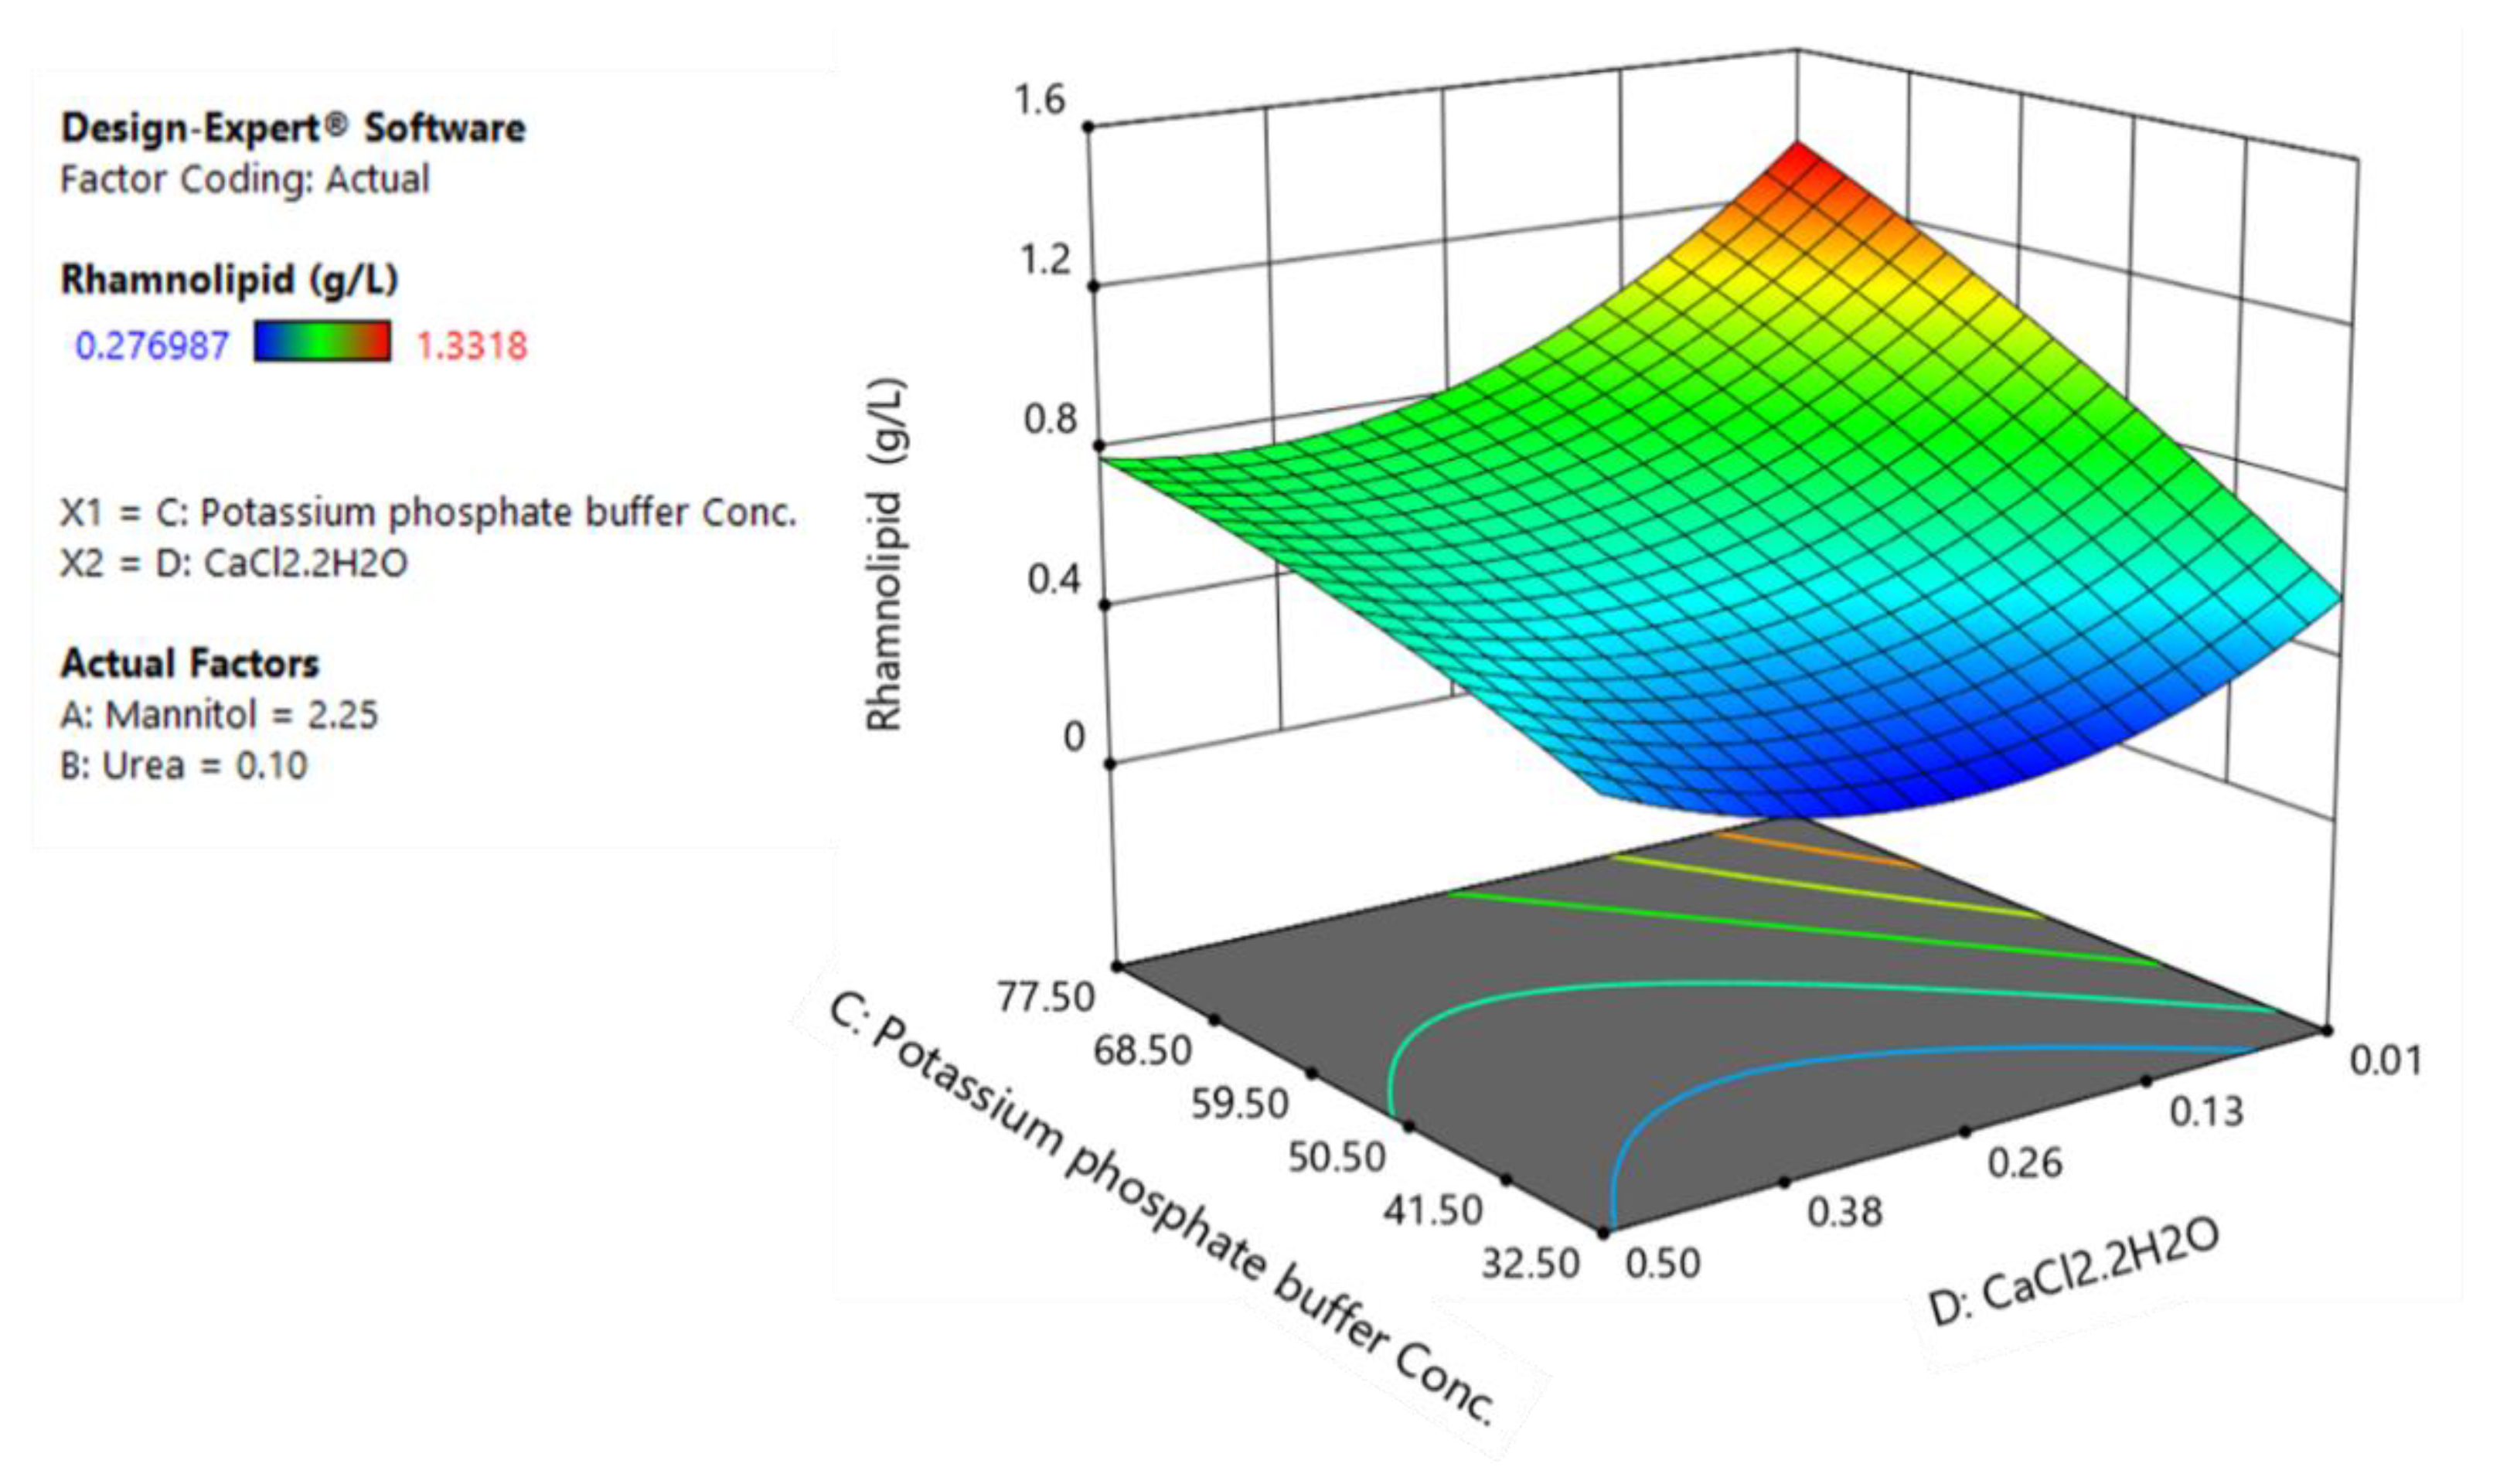
3.4. Optimization and Model Verification

Once the appropriate empirical response surface models were obtained by fitting second-order polynomial equations to the experimental data, the response surfaces could be explored to identify optimum operating conditions. Since both high rhamnolipids titers and yields are desired, the desirability-function approach was selected as the multi-objective optimization technique and the optimum conditions were obtained by simultaneous maximization of rhamnolipid production and substrate-to-product conversion yield. Hence, the solution having the maximum desirability value was selected as the optimum culture medium composition for an enhanced production of rhamnolipids by B. glumae. Table 9 shows software generated optimum conditions of independent variables with the predicted values of responses.
To validate the optimization results predicted by the models, a shake flask experiment was carried out under predicted optimum culture conditions (Table 9) and the production of rhamnolipids and biomass as well as YP/S were determined. The observed experimental values (mean of triplicates) and values predicted by the equations of the models are presented in Table 10.
Despite obtaining higher rhamnolipid production than before, the experimental findings are significantly different than the model predictions. Interestingly, while rhamnolipid production is close to the lower limit of prediction interval with 95% confidence, growth was only 30% of expected value, together resulting in a better substrate-to-product conversion yield than predicted. While simultaneous maximization of rhamnolipids and YP/S is predicted to occur at the minimum concentration of mannitol and highest concentration of potassium phosphate buffer, and hence at the star point levels of tested experimental region, the significant discrepancy between model prediction and experimental value of biomass implies that models demonstrate low reliability at star points. Thus, although ANOVA statistics of models suggested that the models are adequate for prediction and optimization of responses, it would be prudent to repeat the RSM procedure for an experimental region where mannitol at concentration of 0.5% and potassium phosphate buffer at 100 mM designate the center points of the CCD design to achieve better prediction precision and accuracy. Furthermore, measurement of the mannitol concentration at the end of culture showed that the medium was depleted of the mannitol (data not shown). This higher substrate-to-product conversion yield suggests that keeping mannitol at low concentrations (0.5% w/v) and its addition to the medium by a fed-batch strategy could lead to higher substrate-to-product conversion yields.
One of the advantages of using substrate-to-product conversion yields as a response of the system is that the optimization potential of the producer strain can be estimated by comparing it to the theoretical maximum yields estimation.

4. Conclusions

Considering the potential of B. glumae as a native non-pathogenic producer of long-chain rhamnolipids, this study aimed to characterize the cultivation factors affecting the production of rhamnolipids in batch cultures of B. glumae. It demonstrates the application of design of experiments methods combined with RSM to develop and optimize an improved culture medium composition enhancing production of rhamnolipids. The results show that the production of rhamnolipids by B. glumae was significantly enhanced by applying the RSM. A maximum rhamnolipids production of 1.66 g/L was achieved with the optimized medium which was about five times higher than that of the initial non-optimized conditions. However, to increase the reliability of model prediction, some repetition of the RSM procedure with modified CCD design space should be performed. Besides, we showed that, by reducing the concentration of carbon source, it is possible to improve the substrate-to-product conversion yield. This suggest that, by applying a fed-batch strategy and keeping carbon source at low levels, the yield could be further be increased. Overall, to develop a cost-competitive process for rhamnolipids production by B. glumae, our results provide a basis for further scaling-up studies for production of rhamnolipids by B. glumae. Regarding the implication of quorum sensing in regulation of rhamnolipids in B. glumae, further integration of data from kinetics of rhamnolipid biosynthesis gene expression with growth at the process level will certainly help to overcome the challenges driven by complex regulation to achieve a higher productivity and choosing a better strategy of fermentation.

Author Contributions

Conceptualization, A.N., E.D. and C.G.; Resources, F.L. and E.D.; Writing—Original Draft Preparation, A.N.; Writing—Review and Editing, A.N., E.D. and C.G.; Funding Acquisition, E.D.

Funding

Investigations on rhamnolipids in the ED laboratory were funded by the Natural Sciences and Engineering Research Council of Canada (NSERC) Discovery grant No. RGPIN-2015-03931 and by Team grant 174316 from the Fonds de recherche du Québec-Nature et Technologie (FRQ-NT). A.N. was recipient of a Ph.D. scholarship awarded by the Fondation Universitaire Armand-Frappier de l’INRS. E.D. holds the Canada Research Chair in sociomicrobiology.

Acknowledgments

Special thanks to Marie-Christine Groleau for insightful comments and to Sylvain Milot for technical advice.

Conflicts of Interest

The authors declare no conflict of interest.

References

  1. Neu, T.R. Significance of bacterial surface-active compounds in interaction of bacteria with interfaces. Microbiol. Rev. 1996, 60, 151–166. [Google Scholar] [PubMed]
  2. Banat, I.M.; Franzetti, A.; Gandolfi, I.; Bestetti, G.; Martinotti, M.G.; Fracchia, L.; Smyth, T.J.; Marchant, R. Microbial biosurfactants production, applications and future potential. Appl. Microbiol. Biotechnol. 2010, 87, 427–444. [Google Scholar] [CrossRef] [PubMed]
  3. Desai, J.D.; Banat, I.M. Microbial production of surfactants and their commercial potential. Microbiol. Mol. Biol. Rev. 1997, 61, 47–64. [Google Scholar] [PubMed]
  4. Muller, M.M.; Kugler, J.H.; Henkel, M.; Gerlitzki, M.; Hormann, B.; Pohnlein, M.; Syldatk, C.; Hausmann, R. Rhamnolipids—Next generation surfactants? J. Biotechnol. 2012, 162, 366–380. [Google Scholar] [CrossRef] [PubMed]
  5. Maier, R.M.; Soberon-Chavez, G. Pseudomonas aeruginosa rhamnolipids: Biosynthesis and potential applications. Appl. Microbiol. Biotechnol. 2000, 54, 625–633. [Google Scholar] [CrossRef] [PubMed]
  6. Abdel-Mawgoud, A.M.; Lépine, F.; Déziel, E. Rhamnolipids: Diversity of structures, microbial origins and roles. Appl. Microbiol. Biotechnol. 2010, 86, 1323–1336. [Google Scholar] [CrossRef] [PubMed]
  7. Lyczak, J.B.; Cannon, C.L.; Pier, G.B. Establishment of Pseudomonas aeruginosa infection: Lessons from a versatile opportunist. Microbes Infect. 2000, 2, 1051–1060. [Google Scholar] [CrossRef]
  8. Gunther, N.W.; Nunez, A.; Fett, W.; Solaiman, D.K.Y. Production of rhamnolipids by Pseudomonas chlororaphis, a nonpathogenic bacterium. Appl. Environ. Microbiol. 2005, 71, 2288–2293. [Google Scholar] [CrossRef] [PubMed]
  9. Tuleva, B.K.; Ivanov, G.R.; Christova, N.E. Biosurfactant production by a new Pseudomonas putida strain. Zeitschrift für Naturforschung C 2002, 57, 356–360. [Google Scholar] [CrossRef]
  10. Dubeau, D.; Déziel, E.; Woods, D.E.; Lépine, F. Burkholderia thailandensis harbors two identical rhl gene clusters responsible for the biosynthesis of rhamnolipids. BMC Microbiol. 2009, 9, 263. [Google Scholar] [CrossRef] [PubMed]
  11. Hörmann, B.; Müller, M.M.; Syldatk, C.; Hausmann, R. Rhamnolipid production by Burkholderia plantarii DSM 9509T. Eur. J. Lipid Sci. Technol. 2010, 112, 674–680. [Google Scholar] [CrossRef]
  12. Costa, S.G.V.A.O.; Déziel, E.; Lépine, F. Characterization of rhamnolipid production by Burkholderia glumae. Lett. Appl. Microbiol. 2011, 53, 620–627. [Google Scholar] [CrossRef] [PubMed]
  13. Bahia, F.M.; de Almeida, G.C.; de Andrade, L.P.; Campos, C.G.; Queiroz, L.R.; da Silva, R.L.V.; Abdelnur, P.V.; Correa, J.R.; Bettiga, M.; Parachin, N.S. Rhamnolipids production from sucrose by engineered Saccharomyces cerevisiae. Sci. Rep. 2018, 8, 2905. [Google Scholar] [CrossRef] [PubMed]
  14. Wittgens, A.; Tiso, T.; Arndt, T.T.; Wenk, P.; Hemmerich, J.; Muller, C.; Wichmann, R.; Kupper, B.; Zwick, M.; Wilhelm, S.; et al. Growth independent rhamnolipid production from glucose using the non-pathogenic Pseudomonas putida KT2440. Microb. Cell Fact. 2011, 10, 80. [Google Scholar] [CrossRef] [PubMed] [Green Version]
  15. Wittgens, A.; Santiago-Schuebel, B.; Henkel, M.; Tiso, T.; Blank, L.M.; Hausmann, R.; Hofmann, D.; Wilhelm, S.; Jaeger, K.E.; Rosenau, F. Heterologous production of long-chain rhamnolipids from Burkholderia glumae in Pseudomonas putida-a step forward to tailor-made rhamnolipids. Appl. Microbiol. Biotechnol. 2018, 102, 1229–1239. [Google Scholar] [CrossRef] [PubMed]
  16. Müller, M.M.; Hausmann, R. Regulatory and metabolic network of rhamnolipid biosynthesis: Traditional and advanced engineering towards biotechnological production. Appl. Microbiol. Biotechnol. 2011, 91, 251–264. [Google Scholar] [CrossRef] [PubMed]
  17. Lim, J.; Lee, T.H.; Nahm, B.H.; Choi, Y.D.; Kim, M.; Hwang, I. Complete genome sequence of Burkholderia glumae BGR1. J. Bacteriol. 2009, 191, 3758–3759. [Google Scholar] [CrossRef] [PubMed]
  18. Nickzad, A.; Lépine, F.; Déziel, E. Quorum sensing controls swarming motility of Burkholderia glumae through regulation of rhamnolipids. PLoS ONE 2015, 10, e0128509. [Google Scholar] [CrossRef] [PubMed]
  19. Knapp, A.; Voget, S.; Gao, R.; Zaburannyi, N.; Krysciak, D.; Breuer, M.; Hauer, B.; Streit, W.R.; Muller, R.; Daniel, R.; et al. Mutations improving production and secretion of extracellular lipase by Burkholderia glumae PG1. Appl. Microbiol. Biotechnol. 2016, 100, 1265–1273. [Google Scholar] [CrossRef] [PubMed]
  20. Mukherjee, S.; Das, P.; Sen, R. Towards commercial production of microbial surfactants. Trends Biotechnol. 2006, 24, 509–515. [Google Scholar] [CrossRef] [PubMed]
  21. Montgomery, D.C. Design and Analysis of Experiments; John Wiley & Sons: Weinheim, Germany, 2008. [Google Scholar]
  22. Wei, Y.H.; Cheng, C.L.; Chien, C.C.; Wan, H.M. Enhanced di-rhamnolipid production with an indigenous isolate Pseudomonas aeruginosa J16. Process Biochem. 2008, 43, 769–774. [Google Scholar] [CrossRef]
  23. Deepika, K.V.; Kalam, S.; Sridhar, P.R.; Podile, A.R.; Bramhachari, P.V. Optimization of rhamnolipid biosurfactant production by mangrove sediment bacterium Pseudomonas aeruginosa KVD-HR42 using response surface methodology. Biocatal. Agric. Biotechnol. 2016, 5, 38–47. [Google Scholar] [CrossRef]
  24. Abalos, A.; Maximo, F.; Manresa, M.A.; Bastida, J. Utilization of response surface methodology to optimize the culture media for the production of rhamnolipids by Pseudomonas aeruginosa AT10. J. Chem. Technol. Biotechnol. 2002, 77, 777–784. [Google Scholar] [CrossRef]
  25. Zhao, F.; Mandlaa, M.; Hao, J.; Liang, X.; Shi, R.; Han, S.; Zhang, Y. Optimization of culture medium for anaerobic production of rhamnolipid by recombinant Pseudomonas stutzeri Rhl for microbial enhanced oil recovery. Lett. Appl. Microbiol. 2014, 59, 231–237. [Google Scholar] [CrossRef] [PubMed]
  26. Guerra-Santos, L.; Käppeli, O.; Fiechter, A. Dependence of Pseudomonas aeruginosa continous culture biosurfactant production on nutritional and environmental factors. Appl. Microbiol. Biotechnol. 1986, 24, 443–448. [Google Scholar] [CrossRef]
  27. Guerra-Santos, L.; Käppeli, O.; Fiechter, A. Pseudomonas aeruginosa biosurfactant production in continuous culture with glucose as carbon source. Appl. Environ. Microbiol. 1984, 48, 301–305. [Google Scholar] [PubMed]
  28. Soares Dos Santos, A.; Pereira, N., Jr.; Freire, D.M. Strategies for improved rhamnolipid production by Pseudomonas aeruginosa PA1. PeerJ 2016, 4, e2078. [Google Scholar] [CrossRef] [PubMed]
  29. Wei, Y.H.; Chou, C.L.; Chang, J.S. Rhamnolipid production by indigenous Pseudomonas aeruginosa J4 originating from petrochemical wastewater. Biochem. Eng. J. 2005, 27, 146–154. [Google Scholar] [CrossRef]
  30. Jeong, Y.; Kim, J.; Kim, S.; Kang, Y.; Nagamatsu, T.; Hwang, I. Toxoflavin produced by Burkholderia glumae causing rice grain rot is responsible for inducing bacterial wilt in many field crops. Plant Dis. 2003, 87, 890–895. [Google Scholar] [CrossRef]
  31. Abdel-Mawgoud, A.M.; Lépine, F.; Déziel, E. Liquid chromatography/mass spectrometry for the identification and quantification of rhamnolipids. Methods Mol. Biol. 2014, 1149, 359–373. [Google Scholar] [PubMed]
  32. Déziel, E.; Lepine, F.; Milot, S.; Villemur, R. rhlA is required for the production of a novel biosurfactant promoting swarming motility in Pseudomonas aeruginosa: 3-(3-hydroxyalkanoyloxy)alkanoic acids (HAAs), the precursors of rhamnolipids. Microbiology 2003, 149, 2005–2013. [Google Scholar] [CrossRef] [PubMed]
  33. Schmidberger, A.; Henkel, M.; Hausmann, R.; Schwartz, T. Influence of ferric iron on gene expression and rhamnolipid synthesis during batch cultivation of Pseudomonas aeruginosa PAO1. Appl. Microbiol. Biotechnol. 2014, 98, 6725–6737. [Google Scholar] [CrossRef] [PubMed]
  34. Ochsner, U.A.; Hembach, T.; Fiechter, A. Production of rhamnolipid biosurfactants. Adv. Biochem. Eng. Biotechnol. 1996, 53, 89–118. [Google Scholar] [PubMed]
  35. Santos, A.S.; Sampaio, A.P.; Vasquez, G.S.; Santa Anna, L.M.; Pereira, N., Jr.; Freire, D.M. Evaluation of different carbon and nitrogen sources in production of rhamnolipids by a strain of Pseudomonas aeruginosa. Appl. Biochem. Biotechnol. 2002, 98–100, 1025–1035. [Google Scholar] [CrossRef]
  36. Nickzad, A.; Deziel, E. Adaptive Significance of Quorum Sensing-Dependent Regulation of Rhamnolipids by Integration of Growth Rate in Burkholderia glumae: A Trade-Off between Survival and Efficiency. Front. Microbiol. 2016, 7, 1215. [Google Scholar] [CrossRef] [PubMed]
Figure 1. Growth, production and yield per biomass of rhamnolipids for B. glumae BGR1 grown on different carbon and nitrogen sources. Production: (a) carbon; and (b) nitrogen; growth: (c) carbon; and (d) nitrogen; and yield per biomass: (e) carbon; and (f) nitrogen. (a,c,e) For carbon source screening, urea was the nitrogen source; and (b,d,f) for nitrogen source screening, glycerol was used as the carbon source. Statistical difference was determined using an ANOVA followed by Duncan’s multiple range test. Different lower-case letters indicate statistically significant differences (p < 0.05). The error bars indicate the standard error of the mean (n = 2–3). NA stands for not applicable.
Colloids 02 00049 g001
Figure 2. Half-Normal probability plot of main and two-way interaction effects on: (a) rhamnolipid production; and (b) biomass (dry weight) obtained from FFD. Two-way interaction effects between variables are indicated by listing the involved variables. For example, AB indicates a two-way interaction effect between A and B.
Colloids 02 00049 g002
Figure 3. Influence of potassium phosphate and sodium phosphate on kinetic profiles of: (a) rhamnolipid production; and (b) yield per biomass of B. glumae. The error bars indicate the standard error of the mean (n = 3).
Colloids 02 00049 g003
Figure 4. The response surface plot of rhamnolipids production as a function of potassium phosphate buffer and calcium chloride.
Colloids 02 00049 g004
Figure 5. The response surface plot of biomass production as a function of potassium phosphate buffer and mannitol.
Colloids 02 00049 g005
Figure 6. The response surface plot of substrate-to-product conversion yield as a function of mannitol and potassium phosphate buffer.
Colloids 02 00049 g006
Table 1. Maximum and minimum values of the variables used for the production of rhamnolipids by B. glumae BGR1 using FFD.
Experimental Values
VariablesUnitsLowerHigher
Mannitol% w/v0.52
UreaM0.020.2
Potassium phosphate buffer, pH 7mM1040
CaCl2·2H2Og/L0.010.1
MgSO4·7H2Og/L0.10.4
Trace elements solutionmL/L02
Temperature°C3037
Agitationrpm100250
Table 2. Experimental range and levels of the independent variables used in CCD.
Range and Levels
VariablesSymbol Coded−2−10+1+2
Mannitol (% w/v)X10.51.3752.253.1254
Urea (M)X20.010.05750.1050.15250.2
Potassium phosphate buffer, pH 7 (mM)X31032.55577.5100
CaCl2·2H2O (g/L)X40.010.13250.2550.37750.5
Table 3. Experimental design and results of the fractional factorial design.
RunMannitol (%)Urea (M)Potassium Phosphate Buffer (mM)CaCl2·2H2O (g/L)MgSO4·7H2O (g/L)Trace ElementsTemperature (°C)Agitation (rpm)RLs Production (mg/L)
(Mean ± SD)
Biomass (g/L)
(Mean ± SD)
10.50.02100.010.130100415.9 ± 77.00.25 ± 0.01
220.02100.010.1+37250ND 10.24 ± 0.11
30.50.2100.010.437250201.1 ± 79.40.54 ± 0.03
420.2100.010.4+30100ND0.27 ± 0.03
50.50.02400.010.4+37100ND0.19 ± 0.02
620.02400.010.430250736.1 ± 158.41.96 ± 0.12
70.50.2400.010.1+30250ND0.26 ± 0.04
820.2400.010.137100215.4 ± 12.80.93 ± 0.15
90.50.02100.10.4+30250ND0.25 ± 0.02
1020.02100.10.437100359.6 ± 56.60.95 ± 0.13
110.50.2100.10.1+37100ND0.26 ± 0.04
1220.2100.10.130250482.27 ± 93.71.23 ± 0.17
130.50.02400.10.137250268.53 ± 75.40.82 ± 0.10
1420.02400.10.1+30100972.72 ± 271.34.09 ± 0.12
150.50.2400.10.430100444.08 ± 76.80.82 ± 0.06
1620.2400.10.4+37250404.32 ± 212.62.49 ± 1.11
1 ND, not detected; “−”, absence of trace elements; “+”, presence of trace elements.
Table 4. ANOVA analysis for the reduced regression model of rhamnolipid production.
SourceSum of SquaresDegrees of FreedomMean SquareF Valuep-Value
(Prob > F)
Model3.76110.3420.16<0.0001
A-Mannitol0.6410.6437.48<0.0001
B-Urea0.1910.1911.180.0019
C-Potassium phosphate buffer0.4710.4727.69<0.0001
D-CaCl2·2H2O0.3510.3520.55<0.0001
F-Trace elements0.5710.5733.71<0.0001
G-Temperature0.4810.4828.39<0.0001
AB0.1610.169.510.0039
AC0.3610.3621.40<0.0001
AD0.2610.2615.180.0004
AF0.1610.169.220.0044
AG0.1310.137.460.0097
Residual0.61360.017
Lack of Fit0.07140.0181.050.3980
Pure Error0.54320.017
Cor Total4.3747
Two-way interaction effects are indicated by listing the involved variables.
Table 5. ANOVA analysis for the reduced regression model of biomass production.
SourceSum of SquaresDegrees of FreedomMean SquareF Valuep-Value
(Prob > F)
Model50.65105.0741.78<0.0001
A-Mannitol14.41114.41118.82<0.0001
B-Urea0.7210.725.940.0197
C-Potassium phosphate buffer 10.77110.7788.82<0.0001
D-CaCl2·2H2O7.3717.3760.78<0.0001
G-Temperature1.3811.3811.350.0018
AB1.3711.3711.290.0018
AC6.7416.7455.57<0.0001
AD3.7313.7330.78<0.0001
AF2.3012.3018.930.0001
AG1.8811.8815.470.0004
Residual4.49370.12
Lack of Fit0.4050.0810.630.6763
Pure Error4.08320.13
Cor Total55.1447
Two-way interaction effects are indicated by listing the involved variables.
Table 6. ANOVA for the regression model of rhamnolipids production obtained from CCD results.
SourceSum of SquaresDegrees of FreedomMean SquareF Valuep-Value
(Prob > F)
Block0.1210.12
Model4.1290.4635.76<0.0001
A-Mannitol0.2410.2418.56<0.0001
B-Urea0.1110.118.420.0052
C-Potassium phosphate buffer3.0813.08240.57<0.0001
D-CaCl2·2H2O0.3410.3426.47<0.0001
AB0.1410.1410.620.0019
BC0.09810.0987.650.0076
CD0.1410.1410.670.0018
C20.08110.0816.330.0147
D20.1910.1915.010.0003
Residual0.74580.013
Lack of Fit0.22140.0161.320.2320
Pure Error0.52440.012
Cor Total4.9868
CV% = 17.60, R2 = 0.8473, R2adjusted = 0.8236, R2predicted = 0.7881, Adequate precision = 21.00, PRESS = 1.03, Std. Dev. = 0.11. Two-way interaction effects, and quadratic effects are indicated by listing the involved variables and square of variables, respectively.
Table 7. ANOVA for the regression model of biomass production obtained from CCD results.
SourceSum of SquaresDegrees of FreedomMean SquareF Valuep-Value
(Prob > F)
Block0.01010.010
Model79.62515.92130.96<0.0001
A-Mannitol14.23114.23117.02<0.0001
C-Potassium phosphate buffer61.92161.92509.29<0.0001
D-CaCl2·2H2O3.3913.3927.92<0.0001
AC1.0711.078.810.0048
A20.7910.796.530.0141
Residual5.47450.12
Lack of Fit2.57170.151.460.1818
Pure Error2.90280.10
Cor Total85.1051
CV% = 14.74, R2 = 0.9357, R2adjusted = 0.9286, R2predicted = 0.9153; Adequate precision = 33.741, PRESS = 7.20, Std. Dev. = 0.35. Two-way interaction effects, and quadratic effects are indicated by listing the involved variables and square of variables, respectively.
Table 8. ANOVA for the regression model of YP/S obtained from CCD results.
SourceSum of SquaresDegrees of FreedomMean SquareF Valuep-Value
(Prob > F)
Block7.163 × 10−517.163 × 10⁻⁵
Model0.013101.316 × 10−327.01<0.0001
A-Mannitol5.156 × 10−315.156 × 10−3105.78<0.0001
B-Urea8.171 × 10−418.171 × 10−416.760.0002
C-Potassium phosphate buffer1.737 × 10−311.737 × 10−335.64<0.0001
D-CaCl2·2H2O2.535 × 10−312.535 × 10−352.00<0.0001
AC2.523 × 10−412.523 × 10−45.180.0280
AD4.779 × 10−414.779 × 10−49.800.0031
BC3.271 × 10−413.271 × 10−46.710.0130
A27.420 × 10−417.420 × 10−415.220.0003
B22.165 × 10−412.165 × 10−44.440.0409
C23.383 × 10−413.383 × 10−46.940.0117
Residual2.096 × 10−3434.875 × 10−5
Lack of Fit7.169 × 10−4135.515 × 10−51.200.3266
Pure Error1.379 × 10−3304.597 × 10−5
Cor Total0.01554
CV = 13.54%, R2 = 0.8627, R2adjusted = 0.8307, R2predicted = 0.7773, Adequate precision = 18.661, PRESS = 3.399 × 10⁻³, Std. Dev. = 6.982 × 10⁻³. Two-way interaction effects, and quadratic effects are indicated by listing the involved variables and square of variables, respectively.
Table 9. Solution for simultaneous maximization of rhamnolipids production and YP/S.
Mannitol (% w/v)Urea (M)Potassium Phosphate Buffer (mM)CaCl2·2H2O (g/L)Desirability
0.50.011000.010.107
Table 10. Obtained experimental values of responses upon using optimum conditions as predicted by optimization of models.
ResponsePredicted Value95% PI LowMean Experimental Value95% PI High
Rhamnolipid (g/L)2.021.671.662.38
Biomass (g/L)2.781.960.853.61
YP/S (g/g)0.120.090.340.15

