Review

Interfacial and Colloidal Forces Governing Oil Droplet Displacement: Implications for Enhanced Oil Recovery

by
Suparit Tangparitkul
1,2,
Thibaut V. J. Charpentier
1,
Diego Pradilla
3 and
David Harbottle
1,*
1
School of Chemical and Process Engineering, University of Leeds, Leeds LS2 9JT, UK
2
Department of Mining and Petroleum Engineering, Chiang Mai University, Chiang Mai 50200, Thailand
3
Grupo de Diseño de Producto y de Proceso (GDPP), Departamento de Ingeniería Química, Universidad de los Andes, Carrera 1 este No. 18A-12, Edificio Mario Laserna, Piso 7, Bogotá 111711, Colombia
*
Author to whom correspondence should be addressed.
Colloids Interfaces 2018, 2(3), 30; https://doi.org/10.3390/colloids2030030
Submission received: 29 May 2018 / Revised: 14 July 2018 / Accepted: 16 July 2018 / Published: 18 July 2018
(This article belongs to the Special Issue Colloids and Interfaces in Oil Recovery)

Abstract

:
Growing oil demand and the gradual depletion of conventional oil reserves by primary extraction has highlighted the need for enhanced oil recovery techniques to increase the potential of existing reservoirs and facilitate the recovery of more complex unconventional oils. This paper describes the interfacial and colloidal forces governing oil film displacement from solid surfaces. Direct contact of oil with the reservoir rock transforms the solid surface from a water-wet to neutrally-wet and oil-wet as a result of the deposition of polar components of the crude oil, with lower oil recovery from oil-wet reservoirs. To enhance oil recovery, chemicals can be added to the injection water to modify the oil-water interfacial tension and solid-oil-water three-phase contact angle. In the presence of certain surfactants and nanoparticles, a ruptured oil film will dewet to a new equilibrium contact angle, reducing the work of adhesion to detach an oil droplet from the solid surface. Dynamics of contact-line displacement are considered and the effect of surface active agents on enhancing oil displacement discussed. The paper is intended to provide an overview of the interfacial and colloidal forces controlling the process of oil film displacement and droplet detachment for enhanced oil recovery. A comprehensive summary of chemicals tested is provided.

1. Introduction

The global energy landscape is gradually transitioning towards renewables, however, a reliance on non-renewables, particularly petroleum, will remain for several decades due to its importance as a fuel and chemical feedstock, which is a critical component to the steady improvement in the quality of life of developing countries. While developed countries take the lead on demonstrating the application of non-renewables, their remaining reliance on petroleum as part of the energy matrix remains for the foreseeable future (beyond 2050) [1]. With overall petroleum demand expected to increase [2], demand can only be met by increasing global production, which also coincides with the depletion of ‘easy-to-produce’ oil.
With few giant oil fields being discovered and new reserves frequently identified in remote/challenging locations, there is a growing need to increase the potential of existing reserves and improve the worldwide average oil recovery factor from as low as 20% to 40%. Methods of enhanced oil recovery (EOR) have the potential to double the produced lifetime of existing proven reserves; which have a current lifetime without EOR of ~50 years [1]. The growing demand for petroleum is also being met in part by the increased reliance on production from proven unconventional oil reserves, for example, the Canadian oil sands, which has an estimated 300 billion barrels of ultimate potential recoverable reserve (heavy oil), the third largest reserve behind Venezuela and Saudi Arabia [2].
Successful EOR and oil sands operations rely on controlling the process fluid chemistry to favorably affect the mechanisms that govern oil droplet de-wetting and liberation. In this paper, we will provide an overview of the scientific principles influencing oil droplet dynamics on solid surfaces, and extend the discussion to demonstrate how those governing mechanisms can be influenced by the commonly studied surface/interfacially active components namely surfactants and nanoparticles. The step-by-step process by which oil detaches from the solid surface can be summarized in sequence: (i) oil film thinning and rupture; (ii) oil de-wetting (recession) on the solid surface; and (iii) oil-solid surface adhesion and liberation.
Before describing the underlying principles that govern each step, it is worth considering the likely interaction between the oil and solid surface; i.e., the reservoir wettability. The reservoir environment can be characterized as either: (i) water-wet (water droplet contact angle, θ = 0° to ~70°); (ii) oil-wet ( θ = ~110° to ~180°); and (iii) neutrally-wet ( θ = ~70° to ~110°) exhibiting a similar affinity to both water and oil [3,4,5]. While it is understood that most reservoir environments were initially water-wet, the reservoir rock can evolve to become more oil-wet due to the deposition/adsorption of several indigenous organic polar species (asphaltenes, resins and naphthenic acids) present in crude oil [6,7,8,9]. For oil-wet reservoirs, oil recovery is poor due to no capillary imbibition. Hence, one of the criteria for successful EOR is to enhance capillary imbibition and reverse the wettability change by using chemical additives, although complete reversal to strongly water-wet surfaces is not favored for EOR [10]. An oil layer on a hydrophilic or hydrophobic solid surface is the basis for the following discussions.

2. Background Science

Oil recovery from the reservoir rock occurs by either displacement from squeezing or oil film thinning and rupture to form discrete oil droplets (Figure 1) that are removed by shear; the latter is of interest here.
The long-time transformation from water-wet to an oil-wet reservoir occurs following the collapse of a thin aqueous layer separating the solid surface and oil layer. The stability of the thin water layer is attributed to the disjoining pressure that accounts for surface forces between the solid-water and water-oil interfaces. The total disjoining pressure (Π) includes contributions from electrostatic ( Π e l ), van der Waals ( Π v d W ), and structural ( Π s t ) forces [11]
Π =   Π e l + Π v d W + Π s t
with the thin water layer collapsing when Π is negative. The disjoining pressure as a function of aqueous layer thickness has been calculated for a silica/water/oil (bitumen) system of salinity 1 mM KCl and pHs 3, 5, and 9, see Figure 2 (only Π e l and Π v d W have been considered). While Π v d W depends on the interaction Hamaker constant, Π e l is sensitive to pH and salinity, with the magnitude of the electrostatic force dependent on the surface (zeta) potentials of silica and bitumen, and the Debye length. For crude oil, the pH dependent surface potentials result from ionization and surface activity of natural surfactants (naphthenic acids) [12,13,14]. At higher pHs, dissociation of the carboxylic-type surfactant increases the surface potential (negative) of the oil-water interface, with the magnitude increasing as more surfactant partitions at the interface. The high surface potentials at pH 9 form very stable thin-water layers, whereas in more acidic conditions, the disjoining pressure maxima decrease, and the thin-water layer in pH 3 is entirely unstable.
The stability of thick oil films is governed by the balance of gravity and capillary forces, with instability and the formation of discrete oil patches having been described analytically by Sharma [17], with the critical film thickness h c r (Equation (2)) dependent on the oil-water interfacial tension ( γ o / w ), the three-phase contact angle ( θ ), and the minimum radius of the hole (rm)
  h c r = r m ln ( 2 sin ( π θ ) r m [ 1 + cos ( π θ ) ] γ o / w g ρ )  
where g is the acceleration due to gravity and ρ the density of oil. For a typical oil-wetted solid surface of three-phase contact angle of 145° and   γ o / w = 30 mN/m, h c r is 0.05 mm for a stable minimum hole radius of 10 µm. Dependence on the fluid and surface properties is rather weak over the range of general applicability, with h c r strongly influenced by the size of the stable hole in the oil film [16]. For very thick films ( h     h c r ), thinning of the oil film is needed for dewetting, otherwise holes formed in the film will spontaneously collapse. The mechanisms for film thinning have not been extensively considered but are most likely to result from fluid shear in confined environments. Other factors that can influence the onset of film rupture include gas bubbles trapped in the oil film [18], and surface asperities that lead to non-uniform film thickness.
With the oil film ruptured, the circular hole begins to expand at a rate dependent on the fluid and interfacial properties (to be discussed below) [19]. Away from equilibrium, the process of droplet dewetting is driven by a change in energy following the creation of a new solid-water interface and the loss of oil-solid interface, assuming the change in oil-water interface during droplet recession can be considered negligible, that is
  d G d A =   γ S / W γ O / S  
where γ is the interfacial tension and subscripts S, W, and O describe the solid, water and oil phases, respectively. Equation (3) can be simplified by the Young’s equation for an oil droplet on a solid surface given by
  cos θ = γ O / S γ S / W γ O / W  
to express the energy change during oil recession in terms of the equilibrium contact angle and oil-water interfacial tension (two measurable properties)
d G d A = γ O / W cos θ .
With γ O / W   always greater than zero, Equation (5) confirms that oil recession is a spontaneous process when θ < 90°; i.e., the wetted solid surface is more water-wet (hydrophilic). The simple form of Equation (5) provides fundamental insight for effective EOR, highlighting the value of modifying surface wettability and oil-water interfacial tension. The smaller the θ , the more favorable the condition for oil recession. Once the oil droplet has reached equilibrium, the work of adhesion (WA) between oil and solid surface must be exceeded to liberate the oil droplet. By the reduction in area of oil-solid interface and generation of oil-water and solid-water interfaces, WA is given by
  W A =   γ S / W +   γ O / W   γ O / S  
which when combined with the Young’s equation leads to
W A =   γ O / W ( 1 cos θ ) 0 .
With the unlikely condition of θ = 0 for spontaneous liberation (droplet detachment from the solid surface), Equation (7) confirms the need for energy to detach oil droplets from the wetted surface. In order to detach an oil droplet from the solid surface the hydrodynamic lift force must exceed the contributions from the body and adhesion forces. An approximation of the adhesion force for a partially wetting droplet is, F A = π r γ O / W sin ( π θ ) , where r is the radius of oil-solid surface contact area [20]. The contour map in Figure 3 indicates the strongest adhesion (red color) when the oil-water interfacial tension and water droplet contact angle are high. Therefore, reducing both the oil-water interfacial tension and oil-water-solid three-phase contact angle leads to more favorable oil droplet liberation.

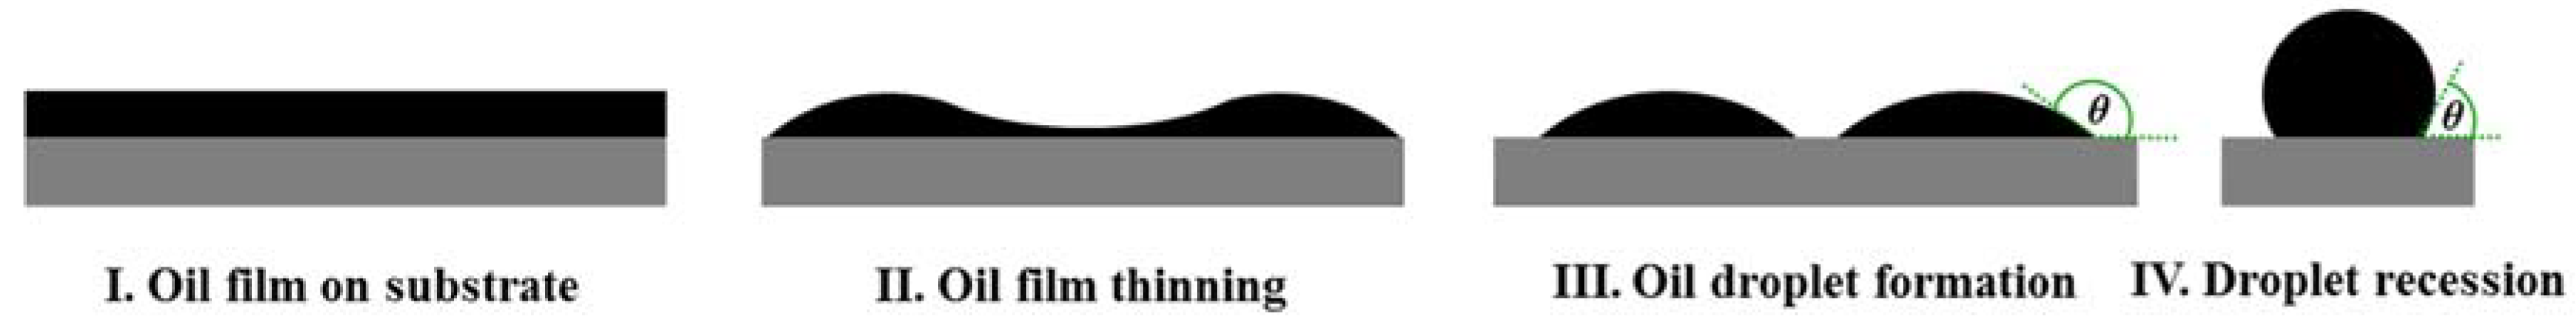
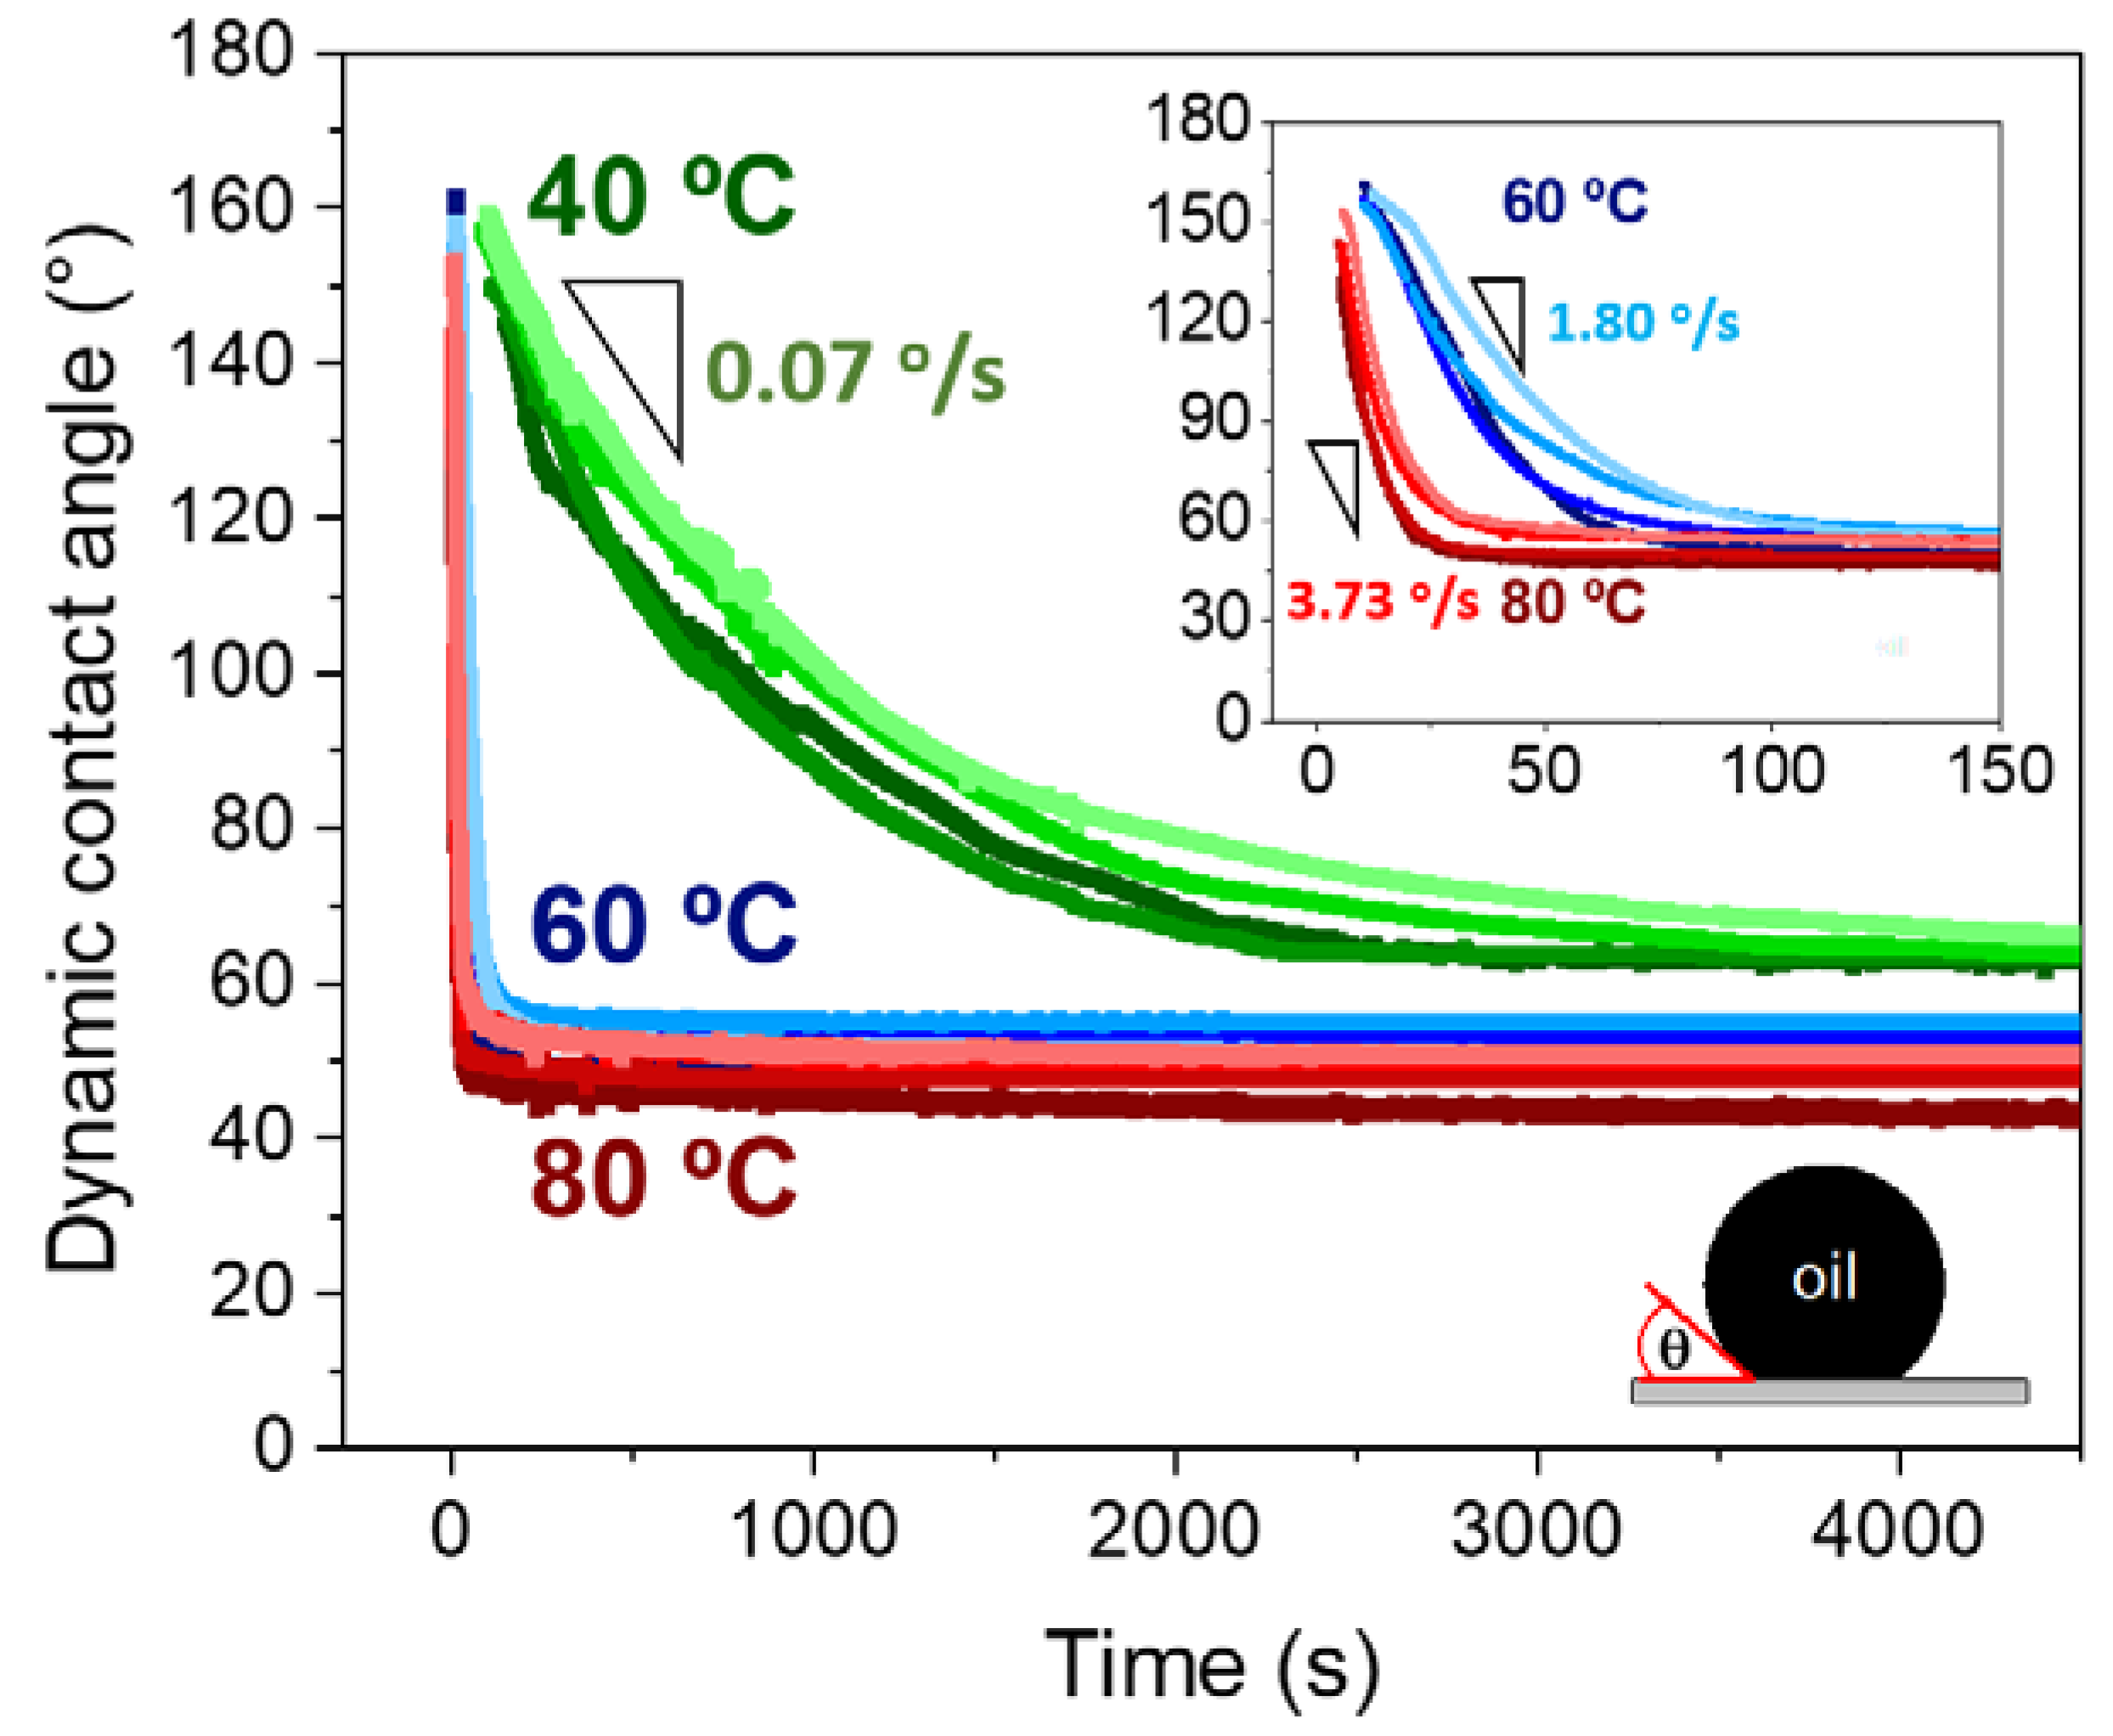
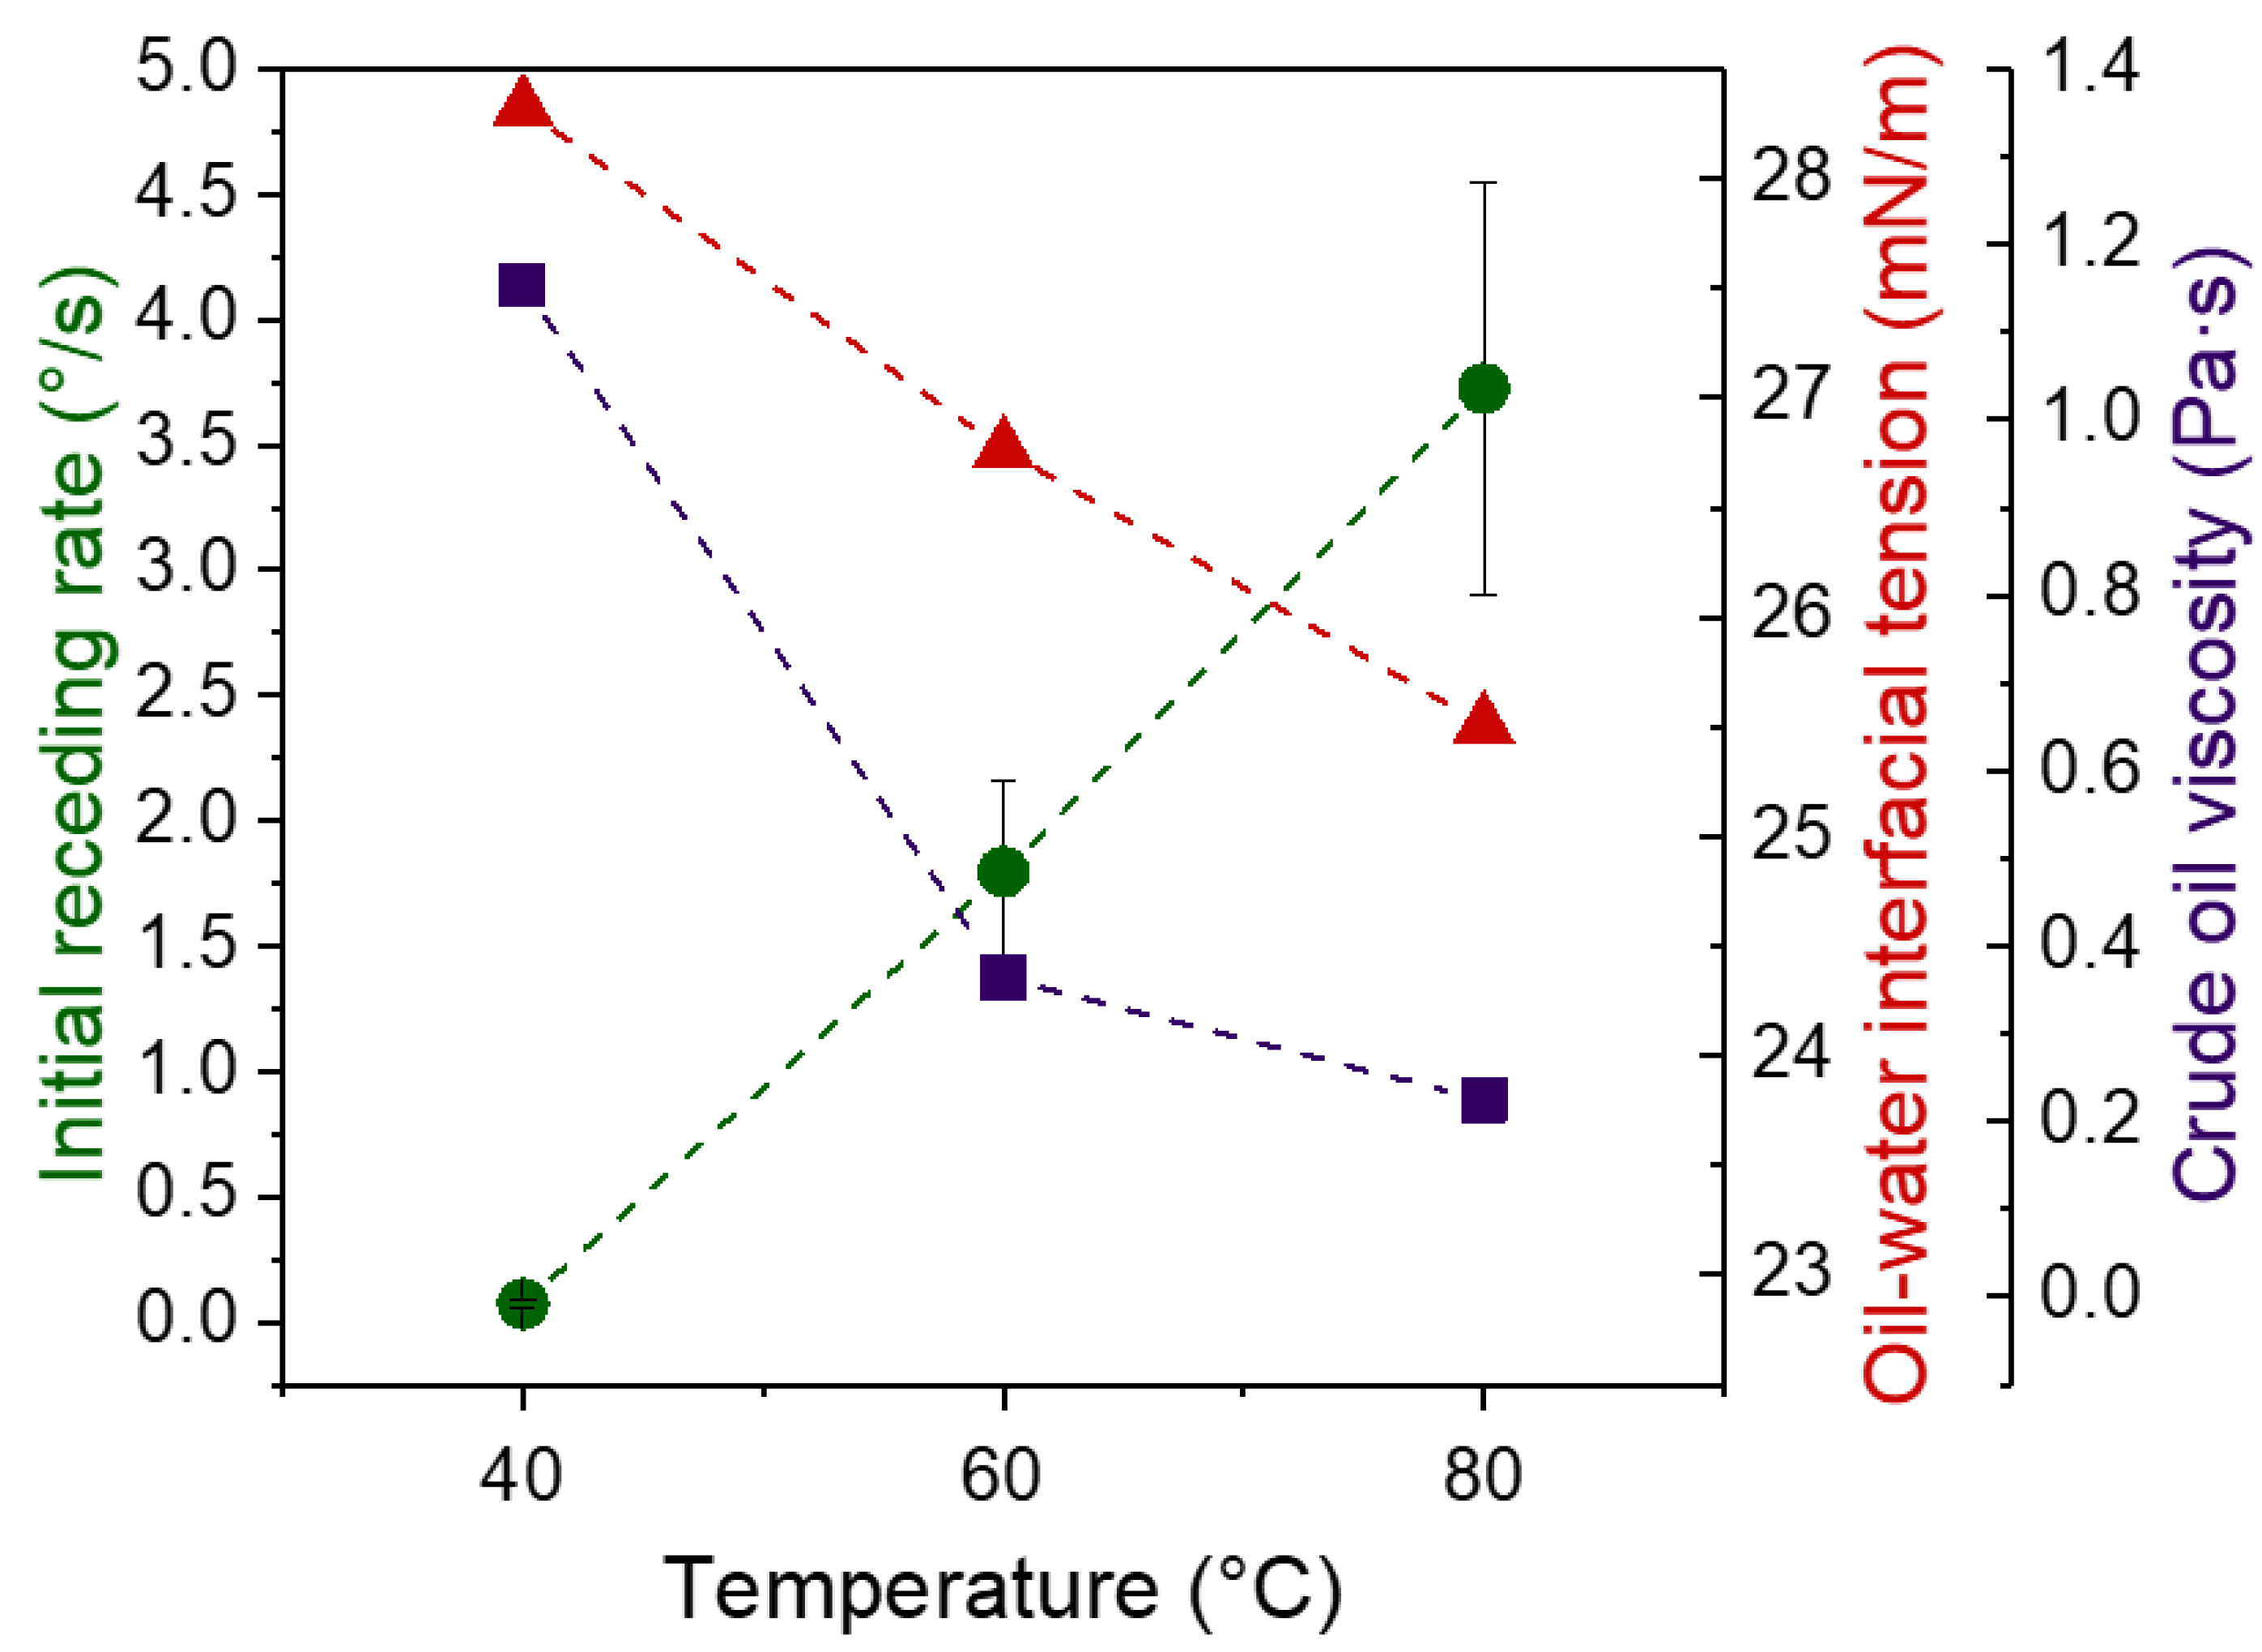
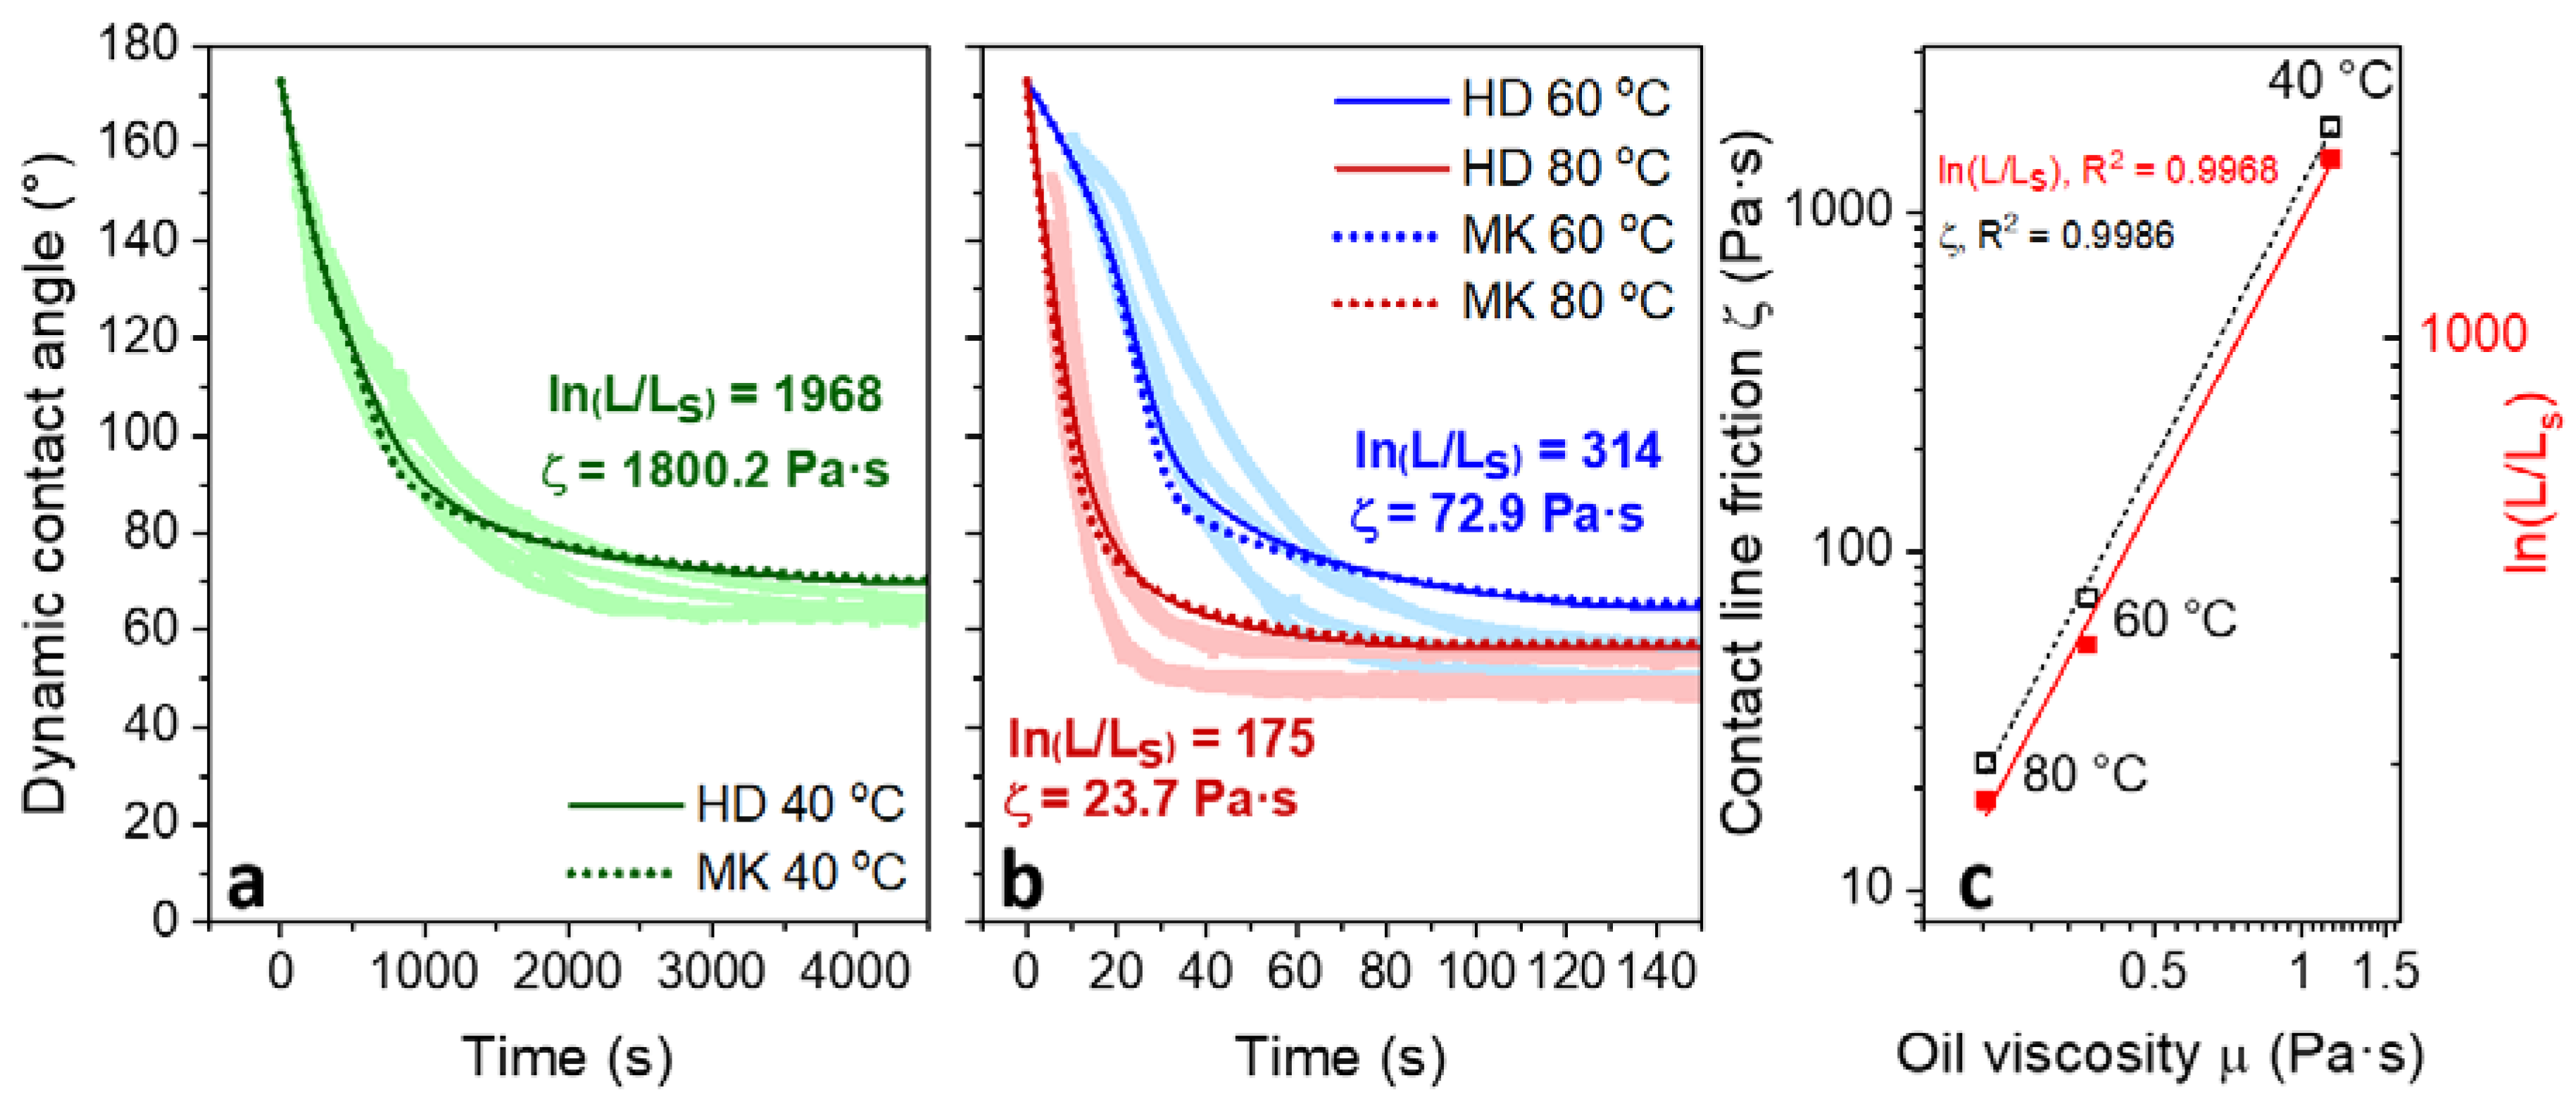
3. Dynamics of oil Film Recession

After creation of a hole on the oil film, the oil film recedes rapidly, governed by the receding force, F R = γ O / W [ cos ( π θ d ) cos ( π θ ) ] , acting at the three-phase contact line ( θ d is the dynamic contact angle), with FR diminishing towards the new equilibrium wetted-state, hence, the velocity of the three-phase contact line decreases with time. The dynamics of oil displacement on a solid surface are frequently described using the (i) hydrodynamic (HD); (ii) molecular-kinetic (MK); or (iii) combined models.
For more viscous fluids, such as crude oil, the hydrodynamic model relies on the solution of creeping flow in the vicinity of the three-phase contact line, with the no slip boundary condition relaxed to allow for finite slipping of the fluid/fluid contact line on a solid surface. Considering an effective slip length (LS), Cox presented a comprehensive hydrodynamic solution by segmenting the dynamic three-phase contact line into inner, intermediate, and outer regions, and correlated the apparent contact angle to the three-phase contact line displacement velocity, U [21,22]
  U = γ O / W 9 μ o [ ( π θ ) 3 ( π θ d ) 3 ] [ ln ( L L S ) ] 1  
where μ o is the oil viscosity, θ is the contact angle measured through the water phase, and L and LS are the characteristic length of the oil droplet and the slip length, respectively. While determination of the slip length is nontrivial, the term is often used as a fitting parameter of the experimental data.
The molecular-kinetic model accounts for molecular displacements (adsorption/desorption) in the vicinity of the dynamic three-phase contact line. The model assumes that the solid surface behaves as a source of identical adsorption sites, and liquid molecules can detach and attach to neighboring sites by overcoming an energy barrier to molecular displacements [23]. The work to overcome the energy barrier is provided by a driving force governed by γ O / W and an imbalance between the equilibrium and dynamic wetting states. The three-phase contact line displacement is described in terms of molecular displacement, defined as the distance between adsorption sites ( λ ) and a frequency ( κ 0 ) of adsorption/desorption events at equilibrium, as shown in Figure 4.
The relationship between the dynamic contact angle and the three-phase contact line velocity is given by
  U = 2 κ 0 λ sin h ( γ O / W [ cos ( π θ d ) cos ( π θ ) ] λ 2 2 k B T )  
where k B is the Boltzmann constant and T the absolute temperature. The molecular displacement parameters ( λ and κ 0 ) are often combined and treated as the coefficient of contact-line friction, ζ = k B T κ 0 λ 3 , to describe the energy dissipated at the three-phase contact line, and neglecting any viscous dissipation in the bulk liquid [24,25]. Similar to the HD model, ζ is treated as an adjustable parameter of the experimental data. Simplification of Equation (9) then follows when the sin h function is small; i.e., not far from equilibrium—and Equation (9) reduces to the linear form
  U = γ O / W ζ [ cos ( π θ d ) cos ( π θ ) ]  
Since each model neglects a contributing factor, a combined model approach can be considered to account for both the contact-line friction and viscous dissipation. As described by de Gennes and Brochard-Wyart [26,27], the combined model for contact-line displacement is given by
U = γ O / W [ cos ( π θ d ) cos ( π θ ) ] ζ + 6 μ o θ d ln ( L L S )
The sequence of images in Figure 5 show the dewetting process for an oil droplet deposited on a solid surface. In this example, a 10 µL droplet of extra heavy oil (13.6° API at 20 °C; SARA: 7.4% saturates, 37.8% aromatics, 15.3% resins, and 39.5% asphaltenes) was deposited on a glass substrate with a water contact angle <5°. Since the oil viscosity was ~6700 mPa·s at 20 °C, the substrate was heated to ~50 °C to promote faster spreading of the oil droplet on the solid surface. With the oil droplet at the equilibrium wetted-state, Milli-Q water was pumped underneath the oil-wetted solid surface at 1400 mL/min to completely submerge the oil droplet. The measurement cell temperature was maintained using a circulating water bath. Since d G d A < 0 , oil droplet recession occurs spontaneously and the oil-solid contact area reduced to attain a new equilibrium wetted-state, as described by Equation (4).
The rate of oil film dewetting can be determined from the dynamic contact angle, see Figure 6, with faster dewetting dynamics observed for higher temperature environments. Clearer differentiation between 60 °C and 80 °C is shown in the inset of Figure 6, with the new equilibrium wetted-states (oil-water-solid surface) attained within a few minutes, contrasting the 40 °C sample, which required more than 1 h to reach equilibrium. Moreover, the contact angles at equilibrium were shown to depend on temperature, decreasing from 63.7° to 54.1° and 51.3° with increasing temperature from 40 °C to 60 °C and 80 °C, respectively. Equation (4) shows that changes in the equilibrium wetted-state result from a change in the balance of energies acting on the three interfaces. Measuring γ O / W at equivalent temperatures, Figure 7 confirms a small decrease in γ O / W with increasing temperature. Hence, if it were assumed that γ O / S and γ S / W remained independent of temperature, then θ would decrease in good agreement with Equation (4). Previous studies showed variation in the oil-water interfacial tension as a function of pH and temperature [12,13,28,29,30,31], with the effect attributed to the partial solubility of naphthenic acids in water [32,33].
Naphthenic acids are considered to be cyclic carboxylic acids of the general form R–COOH, where R can be any cyclo-aliphatic group [34]. Compared to asphaltenes, naphthenic acids are of lower molecular weight, typically less than 450 g/mol, spanning mainly C10 to C50 compounds with up to six fused ring structures that are mostly saturated [35]. Naphthenic acids preferentially adsorb on carbonate solid surfaces mainly by chemical interactions to modify the wettability from water-wet to oil-wet as the surface becomes saturated, although the process is reversible at elevated temperatures [36,37].
The initial receding rate ( d θ d t ) of the oil film was compared for each temperature with the rates correlated to changes in γ O / W and μ o , see Figure 7. Based on the HD model for contact line displacement (Equation (8)), which includes both parameters, the oil viscosity is the rate dependent parameter since the change in oil viscosity (−80.9%) with temperature is more significant than that of oil-water interfacial tension (−9.9%); between 60 °C and 80 °C the oil viscosity decreased by 38.9% and the initial receding rate increased by 107.2%. The same oil displacement data was fitted to both the HD and MK models (Figure 8). A least-squares difference between the experimental and theoretical θ d was made
Δ = t = 0 t e ( θ d , t , m θ d , t , e ) 2  
where θ d , t , m and θ d , t , e are the theoretical and experimental dynamic contact angles at time t, respectively, and the model fitting parameters were determined by minimizing the least-squares value.
During the process of oil film dewetting, the model fits appear in reasonable agreement with the experimental data. Slight variation is magnified at higher temperatures when the receding dynamics can be considered rapid for extra heavy crude oil, and experimental variability is more evident. The adjustable fitting parameters for each model (HD— ln ( L L S ) , MK— ζ ) reduced with increasing temperature, suggesting that the slip length of fluid/fluid contact line on a solid surface (LS) increases and the coefficient of contact-line friction decreases when the oil viscosity is reduced, in good agreement with previous findings [38,39]. While our study only considered dewetting dynamics in Milli-Q water the effect of water chemistry on oil film dewetting has received little attention and is an area for further study. High salinity brine can increase oil-water interfacial tension [40], enhance solvation forces between solid-liquid interfaces [41], bind surfactants to substrate via multicomponent ion exchange [42], and impact the stability of chemical additives used for EOR.

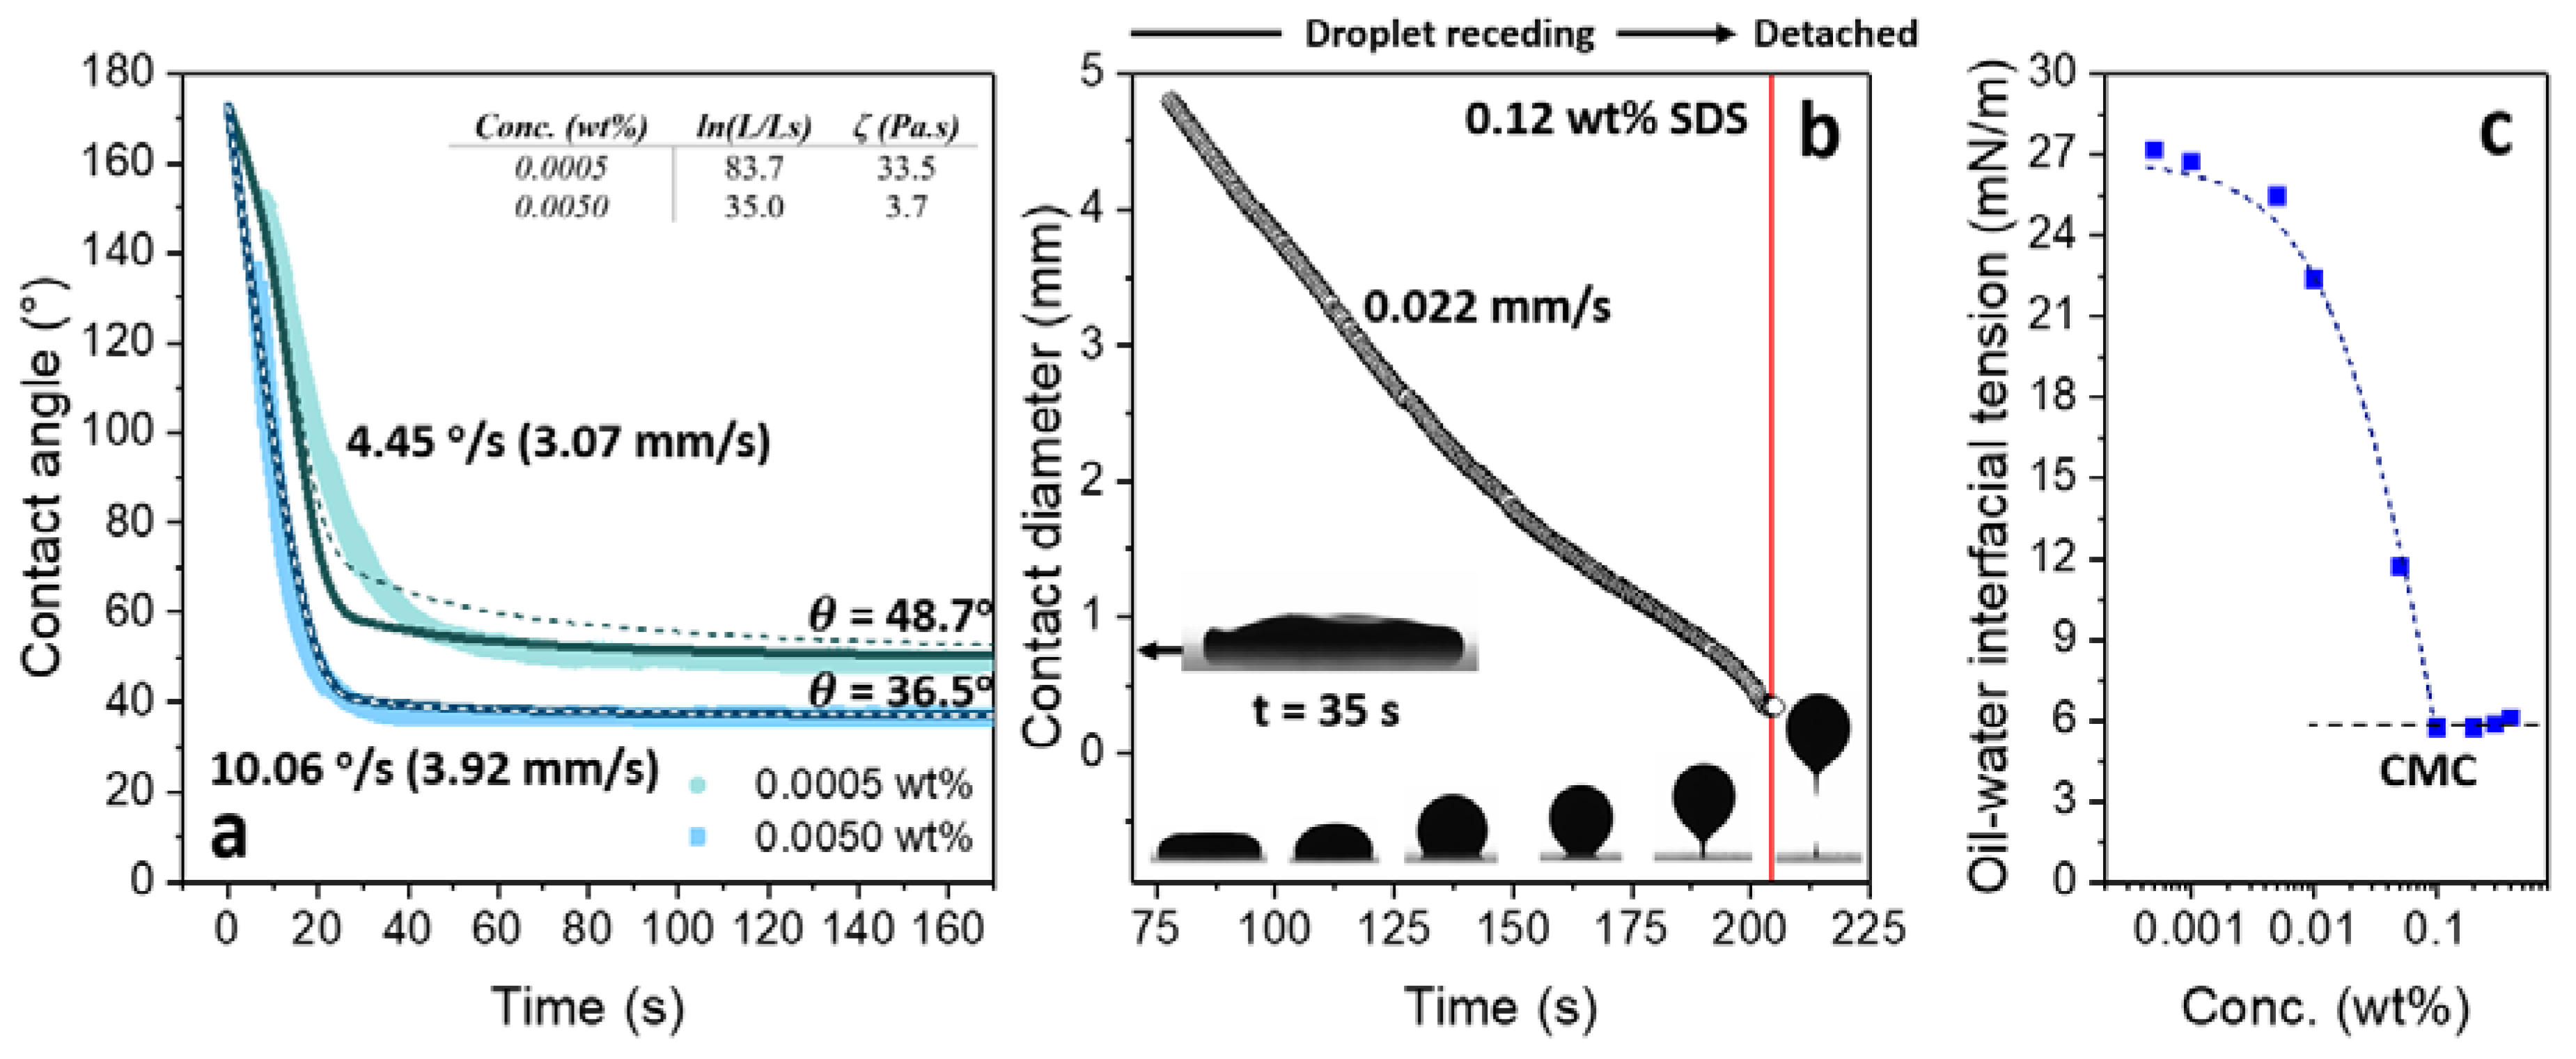
4. Surfactant Oil Droplet Displacement

Surfactants are widely used in EOR to reduce γ O / W and enhance water-wetting of the solid surface. Surfactants are often described as amphiphilic molecules composed of a hydrophilic head and a hydrophobic tail, thus surfactants favorably partition at solid-liquid and liquid-liquid interfaces. The accumulation of surfactants at an interface is a function of the surfactant concentration in the bulk fluid as described by the general form of the Gibbs’ adsorption equation for a binary, isothermal system, d γ = R T Γ s d ln C s , where Γ s is the surface excess of surfactant, C s the surfactant concentration in the bulk fluid, and RT the thermal energy of the system. As a function of concentration, surfactants in solution exist in the monomer-form at low surfactant concentrations, reaching a concentration of maximum solubility of the monomer-form, forming micelles via self-association. This concentration is termed the critical micelle concentration (CMC). Surfactant adsorption and displacement of organic species on solid surfaces and the resultant wettability modification is dependent on the surfactant concentration. At extremely low concentrations, surfactant monomers adsorb as individual molecules with no interaction between the adsorbed molecules. At higher concentrations (<CMC) surfactant molecules associate to form patchy hemi-micelles on the solid surface, with surfactants coordinating in the tail-tail confirmation. Further increases in concentration lead to saturation of all available surface sites and the formation of a surfactant bi-layer at the CMC [43]. Formation of a bi-layer would orientate the surfactant hydrophilic head group away from the solid surface, thus increasing the water-wetting nature of the reservoir rock, favorable for oil droplet displacement (Equations (5) and (7)). Mechanisms for wettability modification by different surfactants are described below.
Composition of the reservoir surface (sandstone, carbonate, and deposited organic species) often dictates the surfactant selection for wettability modification, with surfactants categorized as cationic, anionic and non-ionic, based on the charge characteristics of hydrophilic groups. Surfactant adsorption on the solid surface can occur via electrostatic and van der Waals forces, and hydrogen bonding, with the extent of wettability modification a function of several properties including surfactant adsorption kinetics, surfactant structure, temperature, pH, salinity. A brief summary of surfactants considered for EOR is provided in Table A1, with remarks provided for changes in solid surface wettability and interfacial tension.
While electrostatic interactions are often considered to describe surfactant-solid surface adsorption, such simplicity does not describe the potential for surfactants to modify solid surface wettability, when many other factors such as oil saturation, clay content, divalent cations, pH, and temperature influence the action of the surfactant.
Cationic surfactants are frequently used to treat carbonate reservoirs and include permanently charged ammonium groups (ammonium bromide and ammonium chloride) [44]. Adsorbed polar components of crude oil (i.e., negatively charged naphthenic acids) can be removed from the solid surface by forming ion pairs with cationic surfactants via strong ionic interaction. Removal of contaminants transforms the solid surface wettability to more water-wet [44,45]. The use of cationic surfactants to treat sandstone has also been demonstrated, although the chemical effectiveness in carbonate reservoirs is greater [46].
Anionic surfactants including sulfates, sulfonates, phosphates, and carboxylates, have been shown to modify wettability in both carbonate and sandstone reservoirs. Wettability modification occurs via two mechanisms [44,45]: (i) anionic surfactants interact with the organic species via hydrophobic forces, exposing the surfactant head group to make the solid surface more water-wet (wettability modification for sandstone reservoirs); and (ii) via strong electrostatic forces with carbonate surfaces, anionic surfactants can displace organic species exposing the underlying water-wet surface [46].
Non-ionic surfactants such as alcohols, esters and ethers have been used to modify the wettability of carbonate and sandstone surfaces [47], being highly effective in high salinity water. With no contribution from electrostatic forces, non-ionic surfactants interact via hydrophobic forces with deposited organic species, and hydrogen bonding with hydroxyl groups on the solid surface [48,49]. Research has shown that non-ionic surfactants can modify highly oil-wet carbonate to weakly oil-wet or even water-wet (θ < 80°) following the addition of 0.1 wt % surfactant [50].
Sodium dodecyl sulfate (SDS), an anionic surfactant, was used to displace an oil film deposited on a glass substrate at 60 °C (Figure 9a). Adding SDS to the aqueous phase reduced γ O / W , and the CMC was measured at ~0.1 wt % (3.5 mM) at 60 °C (Figure 9c). Increasing the SDS concentration from 5 × 10⁻⁴ wt % to 5 × 10⁻³ wt % increased both the rate of oil film displacement and equilibrium oil droplet contact angle (inferred from lower water contact angle, θ ). The equilibrium contact angle reduced from 54.1° in the absence of SDS to 48.7° and 36.5° for 5 × 10⁻⁴ wt % and 5 × 10⁻³ wt % SDS, respectively. Fitting the HD and MK models confirmed an increased slip length (LS) and reduced coefficient of contact-line friction ( ζ ) at higher SDS concentrations. Figure 9b illustrates the benefit of injecting surfactants at a concentration greater than the CMC. The very low oil-water interfacial tension (~5.75 mN/m) causes the oil film to continually recede and eventually detach from the solid surface when the oil droplet buoyant force (3.77 µN) exceeds the solid surface-oil droplet adhesion force (2.01 µN).

5. Nanoparticle Oil Droplet Displacement

The application of ultra-small particles (nanoparticles) to enhance oil film displacement has been demonstrated. Nanoparticles are typically 1 to 100 nm and are ideal for EOR applications with particle sizes smaller than the pore diameter, hence nanofluids flow through the porous media without obstructing the porous network. In addition, their high surface area to volume ratio increases their effectiveness at low particle concentrations, and promotes their kinetic stability [51]. An overview of nanoparticles (nanofluids) used to displace oil films is provided in Table A2.
For oil film displacement, different nanoparticles have been considered including metal oxides, organic, inorganic, and composite particles. Metal oxides nanoparticles (Al2O3, CuO, TiO2 and Fe2O3) have been shown to lower γ O / W [52] and increase the disjoining pressure between the solid surface and oil-water interface [53]. The interfacial tension decreases as nanoparticles partition at the oil-water interface from the aqueous phase. Unlike surfactants, nanoparticles are not amphiphilic and their affinity to partition at an oil-water interface is governed by their particle size and surface wettability. The general expression of   E = π a 2 γ O / W ( 1 ± cos θ ) 2 , describes the particle detachment energy from an oil-water interface (±describes detachment into either liquid phase), where a is the particle radius [54]. When cos θ = 0 the particle detachment energy is maximized, although for nanoparticles E can be of the order of a few k B T which can result in reversible adsorption, similar to a surfactant molecule.
The reduction in oil-water interfacial tension has been shown to correlate to the nanoparticle size and the particle specific surface area [55]. Al2O3 nanoparticles of diameter 20 nm and 45 nm were shown to lower the oil-water interfacial tension to ~13.6 mN/m and ~8.6 mN/m, respectively [56]. Compared to surfactants, interfacial tension reduction by nanoparticles is often smaller. For example, silica nanoparticles (7–14 nm) dosed at 0.01–0.10 wt % reduced γ O / W to ~10 mN/m from ~15–20 mN/m [57,58,59], while TiO2 nanoparticles (58 nm) reduced γ O / W from 23 mN/m to 18 mN/m when dosed at 0.01–0.05 wt % [53]. As such, enhanced oil film displacement by nanoparticles is likely to occur via other mechanisms; i.e., structural disjoining pressure and wettability modification.
Structural disjoining pressure is a consequence of nanofluids exhibiting super-spreading behavior. Nanoparticles self-assemble in the vicinity of the three-phase contact line to form a liquid wedge at the de-pinning point, see Figure 10. As nanoparticles accumulate in the liquid wedge a structural disjoining pressure (Equation (14)) gradient is established with the highest pressure at the oil droplet-solid surface vertex, driving the nanofluid to spread and cause the oil film to recede. As explained by Wasan and co-workers [60,61], the spreading coefficient (S) of the nanofluid is determined by the sum of the capillary pressures at the equilibrium film thickness ( Π 0 ( h e ) ) and disjoining pressure ( Π ( h ) )
  S = Π 0 ( h e ) h e + h e Π ( h ) d h  
When the thickness of the liquid wedge exceeds one particle diameter, nanoparticles accumulate in ordered layers. This layered arrangement of nanoparticles increases the excess pressure in the liquid wedge with the structural disjoining pressure described based on the theory of thin liquid films [63]:
  Π s t ( h ) = Π 0 cos ( ω h + 2 ) e κ h + Π 1 e δ ( h d ) ,   h   d   Π s t ( h ) = P ,   0 < h < d
where d is the nanoparticle diameter, P the osmotic pressure of nanofluid, and all other parameters (Π0, Π1, ω, 2 , κ and δ) are fitted as cubic polynomials varying with particle concentration. Contributions from van der Waals, electrostatic and structural forces have been considered by Chengara et al. [11] (Figure 10). The structural forces are long range and govern the behavior of thick liquid films, with nanoparticle size, concentration, temperature, and fluid salinity, all contributing to the magnitude of the structural disjoining pressure.
Wettability modification by nanoparticles enhances oil droplet displacement when nanoparticles deposit on the solid surface. The deposition/adsorption is influenced by electrostatic forces, with the nanoparticle decorated solid surface more water-wet due to deposition of hydrophilic particles to form a heterogeneous surface and increased nano/micron-scale roughness [64,65,66,67,68]. Wettability of heterogeneous surfaces has been described by Cassie-Baxter [69], with the apparent contact angle on a composite solid surface given by, cos θ C B = f 1 cos θ 1 + f 2 cos θ 2 , where f 1 is the fractional area of the surface with contact angle θ 1 , f 2 is the fractional area of the surface with contact angle θ 2 , and θ C B is the Cassie-Baxter contact angle. The Cassie-Baxter model can be combined with the Wenzel wetting model [70] to account for surface roughness effects, cos θ W = R cos θ C B , where R is the ratio of the true area of the solid to its planar projection. With R always greater than 1, the Wenzel model confirms nano/micron-scale roughness lowers the contact angle of a water-wet surface, thus increasing the potential for oil droplet displacement. For example, metal oxide nanoparticles (ZrO2 and NiO < 50 nm) were shown to deposit on an oil-wet surface modifying the contact angle from 152° (untreated surface) to 44° and 86° for ZrO2 and NiO, respectively. The mean roughness of those surfaces was shown to increase from 70.6 nm (untreated surface) to 2.32 µm (ZrO2 treated surface) and 330 nm (NiO treated surface) [71].
Oil film displacement can be enhanced when nanoparticles are mixed with surfactants. Fluid blends lower the oil-water interfacial tension below a surfactant only system, with surfactants increasing the interfacial activity of nanoparticles [72]. The decrease in oil-water interfacial tension depends on the surfactant-particle interaction and surfactant concentration [73]. The effect of nanoparticles is lessened at surfactant concentrations greater than the CMC. The use of surfactant blends and composite particles (polymer-coated particles) to enhance oil film displacement have also been considered but such mechanisms are considered outside the scope of this paper [74,75]. Recent studies, which have considered composite fluids (particles), have been summarized in Table A3.

6. Conclusions

While demand for oil continues to rise, challenges in extraction become ever more complex. Extraction from confined, unfavorable environments, and production of unconventional oil is increasing the dependence on alternative extraction methods to deliver enhanced oil recovery. Often the interaction between the oil and solid surface limits recovery with oil strongly adhered to an oil-wet surface. Oil film recession is spontaneous when the solid surface is water-wet, and the adhesion force to be overcome to liberate an oil droplet from a solid surface diminishes with decreasing contact angle and oil-water interfacial tension. The rate of oil film recession and oil droplet equilibrium contact angle can be modified through the careful selection of chemicals. Surfactants have extensively been considered and used in production to lower oil-water interfacial tension and modify the solid surface to more water-wet. An alternative mechanism for oil film displacement has been identified when using nanofluids. Accumulation of nanoparticles in a liquid wedge between oil and solid surface results in a long range structural disjoining pressure gradient causing the three-phase contact line to move (i.e., oil film recede due to super-spreading of the nanofluid).
Controlling interfacial behavior in the reservoir provides a route for enhanced oil recovery. Significant research effort is ongoing to design more effective chemicals that perform in challenging environments (temperature, pressure, salinity, clays), deliver performance at the targeted site (i.e., minimize material loss), and do not impact the environment. Enhanced oil recovery will ensure effective utilization of crude oil resources, and the fundamental mechanisms governing oil film displacement and oil droplet detachment are underpinned by knowledge of interfacial and colloidal forces.

Author Contributions

S.T. performed the experiments; S.T. and D.H. analyzed the data; S.T. and D.H. drafted the manuscript; T.V.J.C. and D.P. reviewed the final manuscript.

Funding

Royal Academy of Engineering Industry-Academia Partnership Program (IAPP1/100150); White-Elephant Academics Scheme of Chiang Mai University.

Acknowledgments

S.T. acknowledges the PhD scholarship from the White-Elephant Academics Scheme of Chiang Mai University. All authors would like to acknowledge the Royal Academy of Engineering and its support through the Industry-Academia Partnership Program (Grant reference: IAPP1/100150).

Conflicts of Interest

The authors declare no conflict of interest.

Appendix A

Table A1. Surfactants.
SurfactantsConc.Solid SurfaceOil TypeRemarks aRef.
Cationic surfactants
n-C8-N(CH3)3Br (C8TAB) in brine4.0 wt %ChalkCrude oil mixed with heptaneContact angle = 57°,
IFT b = 2.85 mN/m
[44]
n-C10-N(CH3)3Br (C10TAB) in water0.4 wt %CalciteDecane mixed with naphthenic acidsIFT = 2.67 mN/m[45]
n-C12-N(CH3)3Br (C12TAB) in water0.4 wt %CalciteDecane mixed with naphthenic acidsIFT = 0.59 mN/m[45]
n-C12-N(CH3)3Br (C12TAB) in brine5.0 wt %ChalkCrude oil mixed with heptaneContact angle = 12°,
IFT = 0.81 mN/m
[44]
n-C16-N(CH3)3Br (C16TAB) in brine1.0 wt %ChalkCrude oil mixed with heptaneContact angle = 27°,
IFT = 0.38 mN/m
[44]
Cetyltrimethylammonium bromide (CTAB) in brine0.3 wt %QuartzCrude oilContact angle = 57°[76]
n-Decyl triphenylphosphonium bromide (C10TPPB) in water0.4 wt %CalciteDecane mixed with naphthenic acidsIFT = 3.56 mN/m[45]
Cocoalkyltrimethyl ammonium chloride (CAC) in brine75–2620 ppm
(0.0075–0.262 wt %)
DolomiteCrude oil [47]
Dodecyltrimethylammonium bromide (DTAB) in brine0.5 wt %CalciteCrude oilContact angle = 69°,
IFT = 4.8 mN/m
[77]
Dodecyltrimethylammonium bromide (DTAB) in brine0.06 wt %QuartzCrude oilContact angle = 95°,
IFT = 2.49 mN/m
[78]
n-(C8-C18)-N(CH3)2(CH2-Ph)Cl (ADMBACl) in brine0.5 wt %ChalkCrude oil mixed with heptaneContact angle = 26°,
IFT = 0.41 mN/m
[44]
n-C8-Ph-(EO)2-N(CH3)2(CH2-Ph)Cl (Hyamine) in brine0.2 wt %ChalkCrude oil mixed with heptaneContact angle = 21°,
IFT = 0.48 mN/m
[44]
Coconut oil alkyl trimethylammonium chloride (ARQUAD C-50) in water0.4 wt %CalciteDecane mixed with naphthenic acidsIFT = 0.53 mN/m[45]
Trimethyl tallowalky ammonium choride (ARQUAD T-50) in water0.4 wt %CalciteDecane mixed with naphthenic acidsIFT = 0.69 mN/m[45]
Methyldodecylbis ammonium tribromide0.0001–1 mMMicaKerosene mixed with n-decaneContact angle = 87°,
IFT = 0.18 mN/m
[79]
Anionic surfactants
n-(C12-C15)-(EO)15-SO3Na (S-150) in brine0.5 wt %ChalkCrude oil mixed with heptaneContact angle = 63°,
IFT = 2.29 mN/m
[44]
n-C13-(EO)8-SO3Na (B 1317) in brine0.5 wt %ChalkCrude oil mixed with heptaneContact angle = 40°,
IFT = 0.78 mN/m
[44]
n-C8-(EO)3-SO3Na (S-74) in brine0.5 wt %ChalkCrude oil mixed with heptaneContact angle = 49°,
IFT = 6.72 mN/m
[44]
n-(C12-C15)-(PO)4-(EO)2-OSO3Na (APES) in brine1.0 wt %ChalkCrude oil mixed with heptaneContact angle = 44°,
IFT = 0.082 mN/m
[44]
n-(C8O2CCH2)(n-C8O2C)CH-SO3Na (Cropol) in brine0.5 wt %ChalkCrude oil mixed with heptaneContact angle = 55°,
IFT = 8.77 mN/m
[44]
n-C8-(EO)8-OCH2-COONa (Akypo) in brine0.5 wt %ChalkCrude oil mixed with heptaneContact angle = 48°,
IFT = 2.99 mN/m
[44]
n-C9-Ph-(EO)x-PO3Na (Gafac) in brine0.5 wt %ChalkCrude oil mixed with heptaneContact angle = 75°,
IFT = 0.42 mN/m
[44]
Sodium dodecyl sulfate (SDS) in brine0.1 wt %ChalkCrude oil mixed with heptaneContact angle = 39°,
IFT = 2.95 mN/m
[44]
Sodium dodecyl sulfate (SDS) in water0.4 wt %CalciteDecane mixed with naphthenic acidsIFT = 4.77 mN/m[45]
Sodium dodecyl 3EO sulfate in brine0.05 wt %CalciteCrude oilContact angle ~ 45°,
IFT = 0.003 mN/m
[80]
Alkyldiphenyloxide disulfonate in Na2CO3/NaCl0.05 wt %CalciteCrude oilContact angle ~ 110°,
IFT = 0.0011 mN/m
[50]
Polyether sulfonate in Na2CO3/NaCl0.30 wt %CalciteCrude oilContact angle ~ 80°,
IFT = 0.00812 mN/m
[50]
Sodium nonyl phenol ethoxylated sulfate (4EO) in Na2CO3/NaCl0.05 wt %CalciteCrude oilContact angle ~ 60°,
IFT = 0.003 mN/m
[50]
C12-C13 propoxy sulfate (8PO) in Na2CO3/NaCl0.05 wt %CalciteCrude oilContact angle ~ 40°,
IFT = 0.0001 mN/m
[50]
Alkyldiphenyloxide disulphonate + C14T-isofol propoxy sulfate (8PO) in Na2CO3/NaCl0.075 wt %CalciteCrude oilContact angle ~ 70°,
IFT = 0.116 mN/m
[50]
Methyl alcohol+Proprietary sulfonate in brine0.02–0.20 wt %Shale (siliceous)Crude oilContact angle = 38°,
IFT = 0.4 mN/m)
[81]
Sodium laureth sulfate in brine0.02–0.05 wt %QuartzCrude oilContact angle ~ 110°,
IFT = 2.007 mN/m
[76]
Sodium lauryl monoether sulfate in brine0.035 wt %QuartzCrude oilContact angle = 116.1°,
IFT = 2.49 mN/m
[78]
Nonionic surfactants
Poly-oxyethylene alcohol (POA) in brine750–1050 ppm
(0.075–0.105 wt %)
DolomiteCrude oilIFT = 2.0 mN/m[47]
Ethoxylated C11-C15 secondary alcohol (Tergitol 15-S-3) in water0.4 wt %CalciteDecane mixed with naphthenic acidsIFT = 4.44 mN/m[45]
Ethoxylated C11-C15 secondary alcohol (Tergitol 15-S-7) in water0.4 wt %CalciteDecane mixed with naphthenic acidsIFT = 1.39 mN/m[45]
Ethoxylated C11-C15 secondary alcohol (Tergitol 15-S-40) in water0.4 wt %CalciteDecane mixed with naphthenic acidsIFT = 11.5 mN/m[45]
Nonylphenoxypoly(ethyleneoxy)ethanol (Igepal CO-530) in water0.4 wt %CalciteDecane mixed with naphthenic acidsIFT = 0.33 mN/m[45]
C12-C15 linear primary alcohol ethoxylate (Neodol 25-7) in water0.4 wt %CalciteDecane mixed with naphthenic acidsIFT = 2.02 mN/m[45]
Secondary alcohol ethoxylate in Na2CO3/NaCl0.10 wt %CalciteCrude oilContact angle ~ 20°,
IFT = 0.0017 mN/m
[50]
Nonyl phenol ethoxylate in Na2CO3/NaCl0.10 wt %CalciteCrude oilContact angle ~ 80°,
IFT = 0.0006 mN/m
[50]
Branched alcohol oxyalkylate in brine0.02–0.20 wt %Shale (siliceous)Crude oilContact angle = 60°,
IFT = 9.8 mN/m
[81]
Polyoxyethylene octyl phenyl ether in brine0.04 wt %QuartzCrude oilContact angle = 95°,
IFT = 4.05 mN/m
[76]
Alkylpolyglycosides in brine0.05 wt %QuartzCrude oilContact angle = 58.8°,
IFT = 2.49 mN/m
[78]
a not all studies reported contact angle or interfacial tension data. b IFT is interfacial tension.
Table A2. Nanoparticles/fluids.
Nanoparticles/FluidsSolid SurfaceOil TypeRemarks aRef.
Metal oxides
TiO2
(0.01–1 wt %)
SandstoneHeavy oilContact angle = 90°[82]
TiO2
(0.01–0.10 wt %)
SandstoneHeavy crude oilSlight IFT b reduction ~ Δ γ =   1 mN/m[52]
TiO2
(0.01–0.05 wt %)
SandstoneHeavy oilContact angle change from 127° to 81°,
Slight IFT reduction
[53]
Al2O3
(0.01–0.10 wt %)
SandstoneHeavy crude oilSlight IFT reduction ~ Δ γ =   1 mN/m[52]
NiO
(0.01–0.10 wt %)
SandstoneHeavy crude oilSlight IFT reduction ~ Δ γ =   1 mN/m[52]
Organic
Janus nanoparticles
(0.0025–0.0004 mM)
NA cHexaneIFT = 12 mN/m[83]
Carbon nanotubes
(0.05–0.50 wt %)
GlassCrude oilIFT reduction ~ 3 mN/m[84]
Nanocellulose
(0.2–1.0 wt %)
GlassCrude oilIFT = 0.7 mN/m[85]
Inorganic
SiO2
(0.1–0.6 wt %)
CarbonateCrude oilContact angle = 51°[86]
SiO2
(0.5–4.0 wt %)
Calcite (oil-wet)n-decaneContact angle = 20°[87]
SiO2
(0.1–5 wt %)
GlassCrude oilContact angle = 0°[88]
SiO2
(0.025–0.2 wt %)
Calcite (oil-wet)n-heptaneContact angle = 41.7°[89]
SiO2
(0.4 effective volume fraction)
GlassModel oil [60]
SiO2
(0.01–0.10 wt %)
SandstoneCrude oilContact angle = 22°,
IFT = 7.9 mN/m
[57]
SiO2
(0.10 wt %)
SandstoneLight crude oilContact angle change from 34° to 32°,
IFT reduced from 20 to 10 mN/m
[58]
SiO2
(0.01–0.10 wt %)
SandstoneHeavy crude oilSlight IFT reduction ~ Δ γ =   1 mN/m[52]
Hydrophilic silica
(0.01–0.10 wt %)
Glass/SandstoneLight crude oilContact angle ~ 20°,
IFT ~ 8 mN/m
[59]
Hydrophilic, neutralized, and hydrophobic silica
(0.2–0.3 wt %)
SandstoneCrude oilContact angle ~ 35°[57]
Hydrophobic silica
(0.1–0.4 wt %)
SandstoneCrude oilContact angle = 95.4°,
IFT = 1.75 mN/m
[90]
Nanostructure particles
(0.05–0.50 wt %)
SandstoneLight crude oilWettability index = 0.36 (wettability index = 1 is water-wet)[91]
Silica colloidal nanoparticles
(0.05–0.50 wt %)
SandstoneLight crude oilWettability index = 0.57 (wettability index = 1 is water-wet)[91]
a not all studies reported contact angle or interfacial tension data. b IFT is interfacial tension. c NA is not available.
Table A3. Composite fluids.
Composite FluidsSolid SurfaceOil TypeRemarks aRef.
Blend systems
SDS and SiO2
(Patented nanofluid—No reported concentration)
GlassCrude oilContact angle = 1.2°[62]
SDS and hydrophilic and hydrophobic SiO2
(Surfactant: 100–6000 ppm, particle: 1000–2000 ppm)
SandstoneKeroseneIFT b = 1.81 mN/m[72]
SDS and ZrO2
(Surfactant: 0.001–5 CMC, particle: 0.001–0.050 wt %)
NA cn-heptaneIFT = 10 mN/m[92]
Composite nanoparticles
Zwitterionic polymer and SiO2 (coated)
(No reported concentration)
Sandstonen-decaneIFT = 35 mN/m[74]
a not all studies reported contact angle or interfacial tension data. b IFT is interfacial tension. c NA is not available.

References

  1. BP. 2017 Energy Outlook; BP: London, UK, 2017. [Google Scholar]
  2. BP. BP Statistical Review of World Energy 2017; BP: London, UK, 2017. [Google Scholar]
  3. Treiber, L.E.; Owens, W.W. A Laboratory Evaluation of the Wettability of Fifty Oil-Producing Reservoirs; Society of Petroleum Engineers: Richardson, TX, USA, 1972. [Google Scholar]
  4. Chilingar, G.V.; Yen, T.F. Some Notes on Wettability and Relative Permeabilities of Carbonate Reservoir Rocks, II. Energy Sources 1983, 7, 67–75. [Google Scholar] [CrossRef]
  5. Pu, W.-F.; Yuan, C.-D.; Wang, X.-C.; Sun, L.; Zhao, R.-K.; Song, W.-J.; Li, X.-F. The Wettability Alteration and the Effect of Initial Rock Wettability on Oil Recovery in Surfactant-based Enhanced Oil Recovery Processes. J. Dispers. Sci. Technol. 2016, 37, 602–611. [Google Scholar] [CrossRef]
  6. Natarajan, A.; Kuznicki, N.; Harbottle, D.; Masliyah, J.; Zeng, H.; Xu, Z. Understanding Mechanisms of Asphaltene Adsorption from Organic Solvent on Mica. Langmuir 2014, 30, 9370–9377. [Google Scholar] [CrossRef] [PubMed] [Green Version]
  7. Standal, S.; Haavik, J.; Blokhus, A.M.; Skauge, A. Effect of polar organic components on wettability as studied by adsorption and contact angles. J. Pet. Sci. Eng. 1999, 24, 131–144. [Google Scholar] [CrossRef]
  8. Kupai, M.M.; Yang, F.; Harbottle, D.; Moran, K.; Masliyah, J.; Xu, Z.H. Characterising rag-forming solids. Can. J. Chem. Eng. 2013, 91, 1395–1401. [Google Scholar] [CrossRef] [Green Version]
  9. Zeng, H.; Zou, F.; Horvath-Szabo, G.; Andersen, S. Effects of Brine Composition on the Adsorption of Benzoic Acid on Calcium Carbonate. Energy Fuels 2012, 26, 4321–4327. [Google Scholar] [CrossRef]
  10. Jadhunandan, P.P.; Morrow, N.R. Effect of Wettability on Waterflood Recovery for Crude-Oil/Brine/Rock Systems; Society of Petroleum Engineers: Richardson, TX, USA, 1995. [Google Scholar]
  11. Chengara, A.; Nikolov, A.D.; Wasan, D.T.; Trokhymchuk, A.; Henderson, D. Spreading of nanofluids driven by the structural disjoining pressure gradient. J. Colloid Interface Sci. 2004, 280, 192–201. [Google Scholar] [CrossRef] [PubMed]
  12. Bakhtiari, M.T.; Harbottle, D.; Curran, M.; Ng, S.; Spence, J.; Siy, R.; Liu, Q.X.; Masliyah, J.; Xu, Z.H. Role of Caustic Addition in Bitumen-Clay Interactions. Energy Fuels 2015, 29, 58–69. [Google Scholar] [CrossRef]
  13. Flury, C.; Afacan, A.; Bakhtiari, M.T.; Sjoblom, J.; Xu, Z. Effect of Caustic Type on Bitumen Extraction from Canadian Oil Sands. Energy Fuels 2014, 28, 431–438. [Google Scholar] [CrossRef]
  14. Swiech, W.; Taylor, S.; Zeng, H. The Role of Water Soluble Species in Bitumen Recovery from Oil Sands. In Proceedings of the SPE Heavy Oil Conference-Canada, Society of Petroleum Engineers, Calgary, AB, Canada, 10–12 June 2014. [Google Scholar]
  15. Liu, J.; Zhou, Z.; Xu, Z.; Masliyah, J. Bitumen–Clay Interactions in Aqueous Media Studied by Zeta Potential Distribution Measurement. J. Colloid Interface Sci. 2002, 252, 409–418. [Google Scholar] [CrossRef] [PubMed]
  16. Czarnecki, J.; Radoev, B.; Schramm, L.L.; Slavchev, R. On the nature of Athabasca Oil Sands. Adv. Colloid Interface Sci. 2005, 114, 53–60. [Google Scholar] [CrossRef] [PubMed]
  17. Sharma, A. Disintegration of macroscopic fluid sheets on substrates—A singular perturbation approach. J. Colloid Interface Sci. 1993, 156, 96–103. [Google Scholar] [CrossRef]
  18. Srinivasa, S.; Flury, C.; Afacan, A.; Masliyah, J.; Xu, Z. Study of Bitumen Liberation from Oil Sands Ores by Online Visualization. Energy Fuels 2012, 26, 2883–2890. [Google Scholar] [CrossRef]
  19. Bertrand, E.; Blake, T.D.; de Coninck, J. Dynamics of dewetting. Colloids Surfaces A Physicochem. Eng. Asp. 2010, 369, 141–147. [Google Scholar] [CrossRef]
  20. Basu, S.; Nandakumar, K.; Masliyah, J.H. A Model for Detachment of a Partially Wetting Drop from a Solid Surface by Shear Flow. J. Colloid Interface Sci. 1997, 190, 253–257. [Google Scholar] [CrossRef] [PubMed]
  21. Cox, R.G. The dynamics of the spreading of liquids on a solid surface. Part 1. Viscous flow. J. Fluid Mech. 1986, 168, 169–194. [Google Scholar] [CrossRef]
  22. Cox, R.G. The dynamics of the spreading of liquids on a solid surface. Part 2. Surfactants. J. Fluid Mech. 2006, 168, 195–220. [Google Scholar] [CrossRef]
  23. Blake, T.D.; Haynes, J.M. Kinetics of liquid/liquid displacement. J. Colloid Interface Sci. 1969, 30, 421–423. [Google Scholar] [CrossRef]
  24. Blake, T.D. The physics of moving wetting lines. J. Colloid Interface Sci. 2006, 299, 1–13. [Google Scholar] [CrossRef] [PubMed]
  25. Blake, T.D.; de Coninck, J. The influence of solid–liquid interactions on dynamic wetting. Adv. Colloid Interface Sci. 2002, 96, 21–36. [Google Scholar] [CrossRef]
  26. De Gennes, P.G. Wetting: Statics and dynamics. Rev. Mod. Phys. 1985, 57, 827–863. [Google Scholar] [CrossRef]
  27. Brochard-Wyart, F.; de Gennes, P.G. Dynamics of partial wetting. Adv. Colloid Interface Sci. 1992, 39, 1–11. [Google Scholar] [CrossRef]
  28. Schramm, L.L.; Smith, R.G. The influence of natural surfactants on interfacial charges in the hot-water process for recovering bitumen from the athabasca oil sands. Colloids Surfaces 1985, 14, 67–85. [Google Scholar] [CrossRef]
  29. Drelich, J.; Miller, J.D. Surface and interfacial tension of the Whiterocks bitumen and its relationship to bitumen release from tar sands during hot water processing. Fuel 1994, 73, 1504–1510. [Google Scholar] [CrossRef]
  30. Drelich, J.; Bukka, K.; Miller, J.D.; Hanson, F.V. Surface Tension of Toluene-Extracted Bitumens from Utah Oil Sands as Determined by Wilhelmy Plate and Contact Angle Techniques. Energy Fuels 1994, 8, 700–704. [Google Scholar] [CrossRef]
  31. Long, J.; Drelich, J.; Xu, Z.; Masliyah, J.H. Effect of Operating Temperature on Water-Based Oil Sands Processing. Can. J. Chem. Eng. 2007, 85, 726–738. [Google Scholar] [CrossRef]
  32. Rogers, V.V.; Liber, K.; MacKinnon, M.D. Isolation and characterization of naphthenic acids from Athabasca oil sands tailings pond water. Chemosphere 2002, 48, 519–527. [Google Scholar] [CrossRef]
  33. Grewer, D.M.; Young, R.F.; Whittal, R.M.; Fedorak, P.M. Naphthenic acids and other acid-extractables in water samples from Alberta: What is being measured? Sci. Total Environ. 2010, 408, 5997–6010. [Google Scholar] [CrossRef] [PubMed]
  34. Masliyah, J.H.; Xu, Z.; Czarnecki, J.A. Handbook on Theory and Practice of Bitumen Recovery from Athabasca Oil Sands: Theoretical Basis; Kingsley Knowledge Pub.: Cochrane, AB, Canada, 2011. [Google Scholar]
  35. Schramm, L.L.; Stasiuk, E.N.; MacKinnon, M. Surfactants in Athabasca oil sands slurry conditioning, flotation recovery, and tailings processes. In Surfactants: Fundamentals and Applications in the Petroleum Industry; Schramm, L.L., Ed.; Cambridge University Press: Cambridge, UK, 2000; pp. 365–430. [Google Scholar]
  36. Kelesoglu, S.; Volden, S.; Kes, M.; Sjoblom, J. Adsorption of naphthenic acids onto mineral surfaces studied by quartz crystal microbalance with dissipation monitoring (QCM-D). Energy Fuels 2012, 26, 5060–5068. [Google Scholar] [CrossRef]
  37. Ding, L.; Rahimi, P.; Hawkins, R.; Bhatt, S.; Shi, Y. Naphthenic acid removal from heavy oils on alkaline earth-metal oxides and ZnO catalysts. Appl. Catal. A Gen. 2009, 371, 121–130. [Google Scholar] [CrossRef]
  38. Duvivier, D.; Seveno, D.; Rioboo, R.; Blake, T.D.; de Coninck, J. Experimental Evidence of the Role of Viscosity in the Molecular Kinetic Theory of Dynamic Wetting. Langmuir 2011, 27, 13015–13021. [Google Scholar] [CrossRef] [PubMed]
  39. Lin, F.; He, L.; Primkulov, B.; Xu, Z. Dewetting Dynamics of a Solid Microsphere by Emulsion Drops. J. Phys. Chem. C 2014, 118, 13552–13562. [Google Scholar] [CrossRef]
  40. Moeini, F.; Hemmati-Sarapardeh, A.; Ghazanfari, M.-H.; Masihi, M.; Ayatollahi, S. Toward mechanistic understanding of heavy crude oil/brine interfacial tension: The roles of salinity, temperature and pressure. Fluid Phase Equilib. 2014, 375, 191–200. [Google Scholar] [CrossRef]
  41. Basu, S.; Sharma, M.M. Measurement of Critical Disjoining Pressure for Dewetting of Solid Surfaces. J. Colloid Interface Sci. 1996, 181, 443–455. [Google Scholar] [CrossRef]
  42. Haagh, M.E.J.; Siretanu, I.; Duits, M.H.G.; Mugele, F. Salinity-Dependent Contact Angle Alteration in Oil/Brine/Silicate Systems: The Critical Role of Divalent Cations. Langmuir 2017, 33, 3349–3357. [Google Scholar] [CrossRef] [PubMed]
  43. Somasundaran, P.; Zhang, L. Adsorption of surfactants on minerals for wettability control in improved oil recovery processes. J. Pet. Sci. Eng. 2006, 52, 198–212. [Google Scholar] [CrossRef]
  44. Standnes, D.C.; Austad, T. Wettability alteration in chalk: 2. Mechanism for wettability alteration from oil-wet to water-wet using surfactants. J. Pet. Sci. Eng. 2000, 28, 123–143. [Google Scholar] [CrossRef]
  45. Wu, Y.; Shuler, P.J.; Blanco, M.; Tang, Y.; Goddard, W.A. An Experimental Study of Wetting Behavior and Surfactant EOR in Carbonates with Model Compounds; Society of Petroleum Engineers: Richardson, TX, USA, 2008. [Google Scholar]
  46. Jarrahian, K.; Seiedi, O.; Sheykhan, M.; Sefti, M.V.; Ayatollahi, S. Wettability alteration of carbonate rocks by surfactants: A mechanistic study. Colloids Surfaces A Physicochem. Eng. Asp. 2012, 410, 1–10. [Google Scholar] [CrossRef]
  47. Xie, X.; Weiss, W.W.; Tong, Z.; Morrow, N.R. Improved Oil Recovery from Carbonate Reservoirs by Chemical Stimulation; Society of Petroleum Engineers: Richardson, TX, USA, 2004. [Google Scholar]
  48. Curbelo, F.D.S.; Santanna, V.C.; Neto, E.L.B.; Dutra, T.V.; Dantas, T.N.C.; Neto, A.A.D.; Garnica, A.I.C. Adsorption of nonionic surfactants in sandstones. Colloids Surfaces A Physicochem. Eng. Asp. 2007, 293, 1–4. [Google Scholar] [CrossRef]
  49. Park, S.; Lee, E.S.; Sulaiman, W.R.W. Adsorption behaviors of surfactants for chemical flooding in enhanced oil recovery. J. Ind. Eng. Chem. 2015, 21, 1239–1245. [Google Scholar] [CrossRef]
  50. Gupta, R.; Mohanty, K. Temperature Effects on Surfactant-Aided Imbibition into Fractured Carbonates; Society of Petroleum Engineers: Richardson, TX, USA, 2010. [Google Scholar]
  51. Vafaei, S.; Borca-Tasciuc, T.; Podowski, M.Z.; Purkayastha, A.; Ramanath, G.; Ajayan, P.M. Effect of nanoparticles on sessile droplet contact angle. Nanotechnology 2006, 17, 2523–2527. [Google Scholar] [CrossRef] [PubMed]
  52. Alomair, O.A.; Matar, K.M.; Alsaeed, Y.H. Nanofluids Application for Heavy Oil Recovery; Society of Petroleum Engineers: Richardson, TX, USA, 2014. [Google Scholar]
  53. Ehtesabi, H.; Ahadian, M.M.; Taghikhani, V. Enhanced Heavy Oil Recovery Using TiO2 Nanoparticles: Investigation of Deposition during Transport in Core Plug. Energy Fuels 2015, 29, 1–8. [Google Scholar] [CrossRef]
  54. Binks, B.P. Particles as surfactants—Similarities and differences. Curr. Opin. Colloid Interface Sci. 2002, 7, 21–41. [Google Scholar] [CrossRef]
  55. Fan, H.; Striolo, A. Nanoparticle effects on the water-oil interfacial tension. Phys. Rev. E 2012, 86, 051610. [Google Scholar] [CrossRef] [PubMed]
  56. Chinnam, J.; Das, D.K.; Vajjha, R.S.; Satti, J.R. Measurements of the surface tension of nanofluids and development of a new correlation. Int. J. Therm. Sci. 2015, 98, 68–80. [Google Scholar] [CrossRef]
  57. Hendraningrat, L.; Li, S.; Torsæter, O. A coreflood investigation of nanofluid enhanced oil recovery. J. Pet. Sci. Eng. 2013, 111, 128–138. [Google Scholar] [CrossRef]
  58. Parvazdavani, M.; Masihi, M.; Ghazanfari, M.H. Monitoring the influence of dispersed nano-particles on oil–water relative permeability hysteresis. J. Pet. Sci. Eng. 2014, 124, 222–231. [Google Scholar] [CrossRef]
  59. Li, S.; Hendraningrat, L.; Torsaeter, O. Improved Oil Recovery by Hydrophilic Silica Nanoparticles Suspension: 2-Phase Flow Experimental Studies. In Proceedings of the International Petroleum Technology Conference, Beijing, China, 26–28 March 2013. [Google Scholar]
  60. Wasan, D.T.; Nikolov, A.D. Spreading of nanofluids on solids. Nature 2003, 423, 156–159. [Google Scholar] [CrossRef] [PubMed]
  61. Kondiparty, K.; Nikolov, A.; Wu, S.; Wasan, D. Wetting and Spreading of Nanofluids on Solid Surfaces Driven by the Structural Disjoining Pressure: Statics Analysis and Experiments. Langmuir 2011, 27, 3324–3335. [Google Scholar] [CrossRef] [PubMed]
  62. Zhang, H.; Nikolov, A.; Wasan, D. Enhanced Oil Recovery (EOR) Using Nanoparticle Dispersions: Underlying Mechanism and Imbibition Experiments. Energy Fuels 2014, 28, 3002–3009. [Google Scholar] [CrossRef]
  63. Trokhymchuk, A.; Henderson, D.; Nikolov, A.; Wasan, D.T. A Simple Calculation of Structural and Depletion Forces for Fluids/Suspensions Confined in a Film. Langmuir 2001, 17, 4940–4947. [Google Scholar] [CrossRef]
  64. Winkler, K.; Paszewski, M.; Kalwarczyk, T.; Kalwarczyk, E.; Wojciechowski, T.; Gorecka, E.; Pociecha, D.; Holyst, R.; Fialkowski, M. Ionic Strength-Controlled Deposition of Charged Nanoparticles on a Solid Substrate. J. Phys. Chem. C 2011, 115, 19096–19103. [Google Scholar] [CrossRef]
  65. Darlington, T.K.; Neigh, A.M.; Spencer, M.T.; Guyen, O.T.N.; Oldenburg, S.J. Nanoparticle characteristics affecting environmental fate and transport through soil. Environ. Toxicol. Chem. 2009, 28, 1191–1199. [Google Scholar] [CrossRef] [PubMed]
  66. Bayat, A.E.; Junin, R.; Samsuri, A.; Piroozian, A.; Hokmabadi, M. Impact of Metal Oxide Nanoparticles on Enhanced Oil Recovery from Limestone Media at Several Temperatures. Energy Fuels 2014, 28, 6255–6266. [Google Scholar] [CrossRef]
  67. Li, Y.V.; Cathles, L.M.; Archer, L.A. Nanoparticle tracers in calcium carbonate porous media. J. Nanopart. Res. 2014, 16, 2541. [Google Scholar] [CrossRef]
  68. Li, Y.V.; Cathles, L.M. Retention of silica nanoparticles on calcium carbonate sands immersed in electrolyte solutions. J. Colloid Interface Sci. 2014, 436, 1–8. [Google Scholar] [CrossRef] [PubMed]
  69. Cassie, A.B.D.; Baxter, S. Wettability of porous surfaces. Trans. Faraday Soc. 1944, 40, 546–551. [Google Scholar] [CrossRef]
  70. Wenzel, R.N. Resistance of solid surfaces to wetting by water. Ind. Eng. Chem. 1936, 28, 988–994. [Google Scholar] [CrossRef]
  71. Nwidee, L.N.; Al-Anssari, S.; Barifcani, A.; Sarmadivaleh, M.; Lebedev, M.; Iglauer, S. Nanoparticles influence on wetting behaviour of fractured limestone formation. J. Pet. Sci. Eng. 2017, 149, 782–788. [Google Scholar] [CrossRef]
  72. Zargartalebi, M.; Barati, N.; Kharrat, R. Influences of hydrophilic and hydrophobic silica nanoparticles on anionic surfactant properties: Interfacial and adsorption behaviors. J. Pet. Sci. Eng. 2014, 119, 36–43. [Google Scholar] [CrossRef]
  73. Ahualli, S.; Iglesias, G.R.; Wachter, W.; Dulle, M.; Minami, D.; Glatter, O. Adsorption of Anionic and Cationic Surfactants on Anionic Colloids: Supercharging and Destabilization. Langmuir 2011, 27, 9182–9192. [Google Scholar] [CrossRef] [PubMed]
  74. Choi, S.K.; Son, H.A.; Kim, H.T.; Kim, J.W. Nanofluid Enhanced Oil Recovery Using Hydrophobically Associative Zwitterionic Polymer-Coated Silica Nanoparticles. Energy Fuels 2017, 31, 7777–7782. [Google Scholar] [CrossRef]
  75. ShamsiJazeyi, H.; Miller, C.A.; Wong, M.S.; Tour, J.M.; Verduzco, R. Polymer-coated nanoparticles for enhanced oil recovery. J. Appl. Polym. Sci. 2014, 131. [Google Scholar] [CrossRef] [Green Version]
  76. Hou, B.; Wang, Y.; Cao, X.; Zhang, J.; Song, X.; Ding, M.; Chen, W. Surfactant-Induced Wettability Alteration of Oil-Wet Sandstone Surface: Mechanisms and Its Effect on Oil Recovery. J. Surfactants Deterg. 2016, 19, 315–324. [Google Scholar] [CrossRef]
  77. Karimi, M.; Al-Maamari, R.S.; Ayatollahi, S.; Mehranbod, N. Wettability alteration and oil recovery by spontaneous imbibition of low salinity brine into carbonates: Impact of Mg2+, SO42− and cationic surfactant. J. Pet. Sci. Eng. 2016, 147, 560–569. [Google Scholar] [CrossRef]
  78. Hou, B.; Wang, Y.; Cao, X.; Zhang, J.; Song, X.; Ding, M.; Chen, W. Mechanisms of Enhanced Oil Recovery by Surfactant-Induced Wettability Alteration. J. Dispers. Sci. Technol. 2016, 37, 1259–1267. [Google Scholar] [CrossRef]
  79. Zhang, R.; Qin, N.; Peng, L.; Tang, K.; Ye, Z. Wettability alteration by trimeric cationic surfactant at water-wet/oil-wet mica mineral surfaces. Appl. Surf. Sci. 2012, 258, 7943–7949. [Google Scholar] [CrossRef]
  80. Hirasaki, G.; Zhang, D.L. Surface Chemistry of Oil Recovery from Fractured, Oil-Wet, Carbonate Formations; Society of Petroleum Engineers: Richardson, TX, USA, 2004. [Google Scholar]
  81. Alvarez, J.O.; Schechter, D.S. Wettability Alteration and Spontaneous Imbibition in Unconventional Liquid Reservoirs by Surfactant Additives; Society of Petroleum Engineers: Richardson, TX, USA, 2017. [Google Scholar]
  82. Ehtesabi, H.; Ahadian, M.M.; Taghikhani, V.; Ghazanfari, M.H. Enhanced Heavy Oil Recovery in Sandstone Cores Using TiO2 Nanofluids. Energy Fuels 2014, 28, 423–430. [Google Scholar] [CrossRef]
  83. Glaser, N.; Adams, D.J.; Böker, A.; Krausch, G. Janus Particles at Liquid−Liquid Interfaces. Langmuir 2006, 22, 5227–5229. [Google Scholar] [CrossRef] [PubMed]
  84. Soleimani, H.; Baig, M.K.; Yahya, N.; Khodapanah, L.; Sabet, M.; Demiral, B.M.R.; Burda, M. Impact of carbon nanotubes based nanofluid on oil recovery efficiency using core flooding. Results Phys. 2018, 9, 39–48. [Google Scholar] [CrossRef]
  85. Wei, B.; Li, Q.; Jin, F.; Li, H.; Wang, C. The potential of a novel nanofluid in enhancing oil recovery. Energy Fuels 2016, 30, 2882–2891. [Google Scholar] [CrossRef]
  86. Roustaei, A.; Bagherzadeh, H. Experimental investigation of SiO2 nanoparticles on enhanced oil recovery of carbonate reservoirs. J. Pet. Explor. Prod. Technol. 2015, 5, 27–33. [Google Scholar] [CrossRef]
  87. Al-Anssari, S.; Barifcani, A.; Wang, S.; Maxim, L.; Iglauer, S. Wettability alteration of oil-wet carbonate by silica nanofluid. J. Colloid Interface Sci. 2016, 461, 435–442. [Google Scholar] [CrossRef] [PubMed]
  88. Maghzi, A.; Mohammadi, S.; Ghazanfari, M.H.; Kharrat, R.; Masihi, M. Monitoring wettability alteration by silica nanoparticles during water flooding to heavy oils in five-spot systems: A pore-level investigation. Exp. Therm. Fluid Sci. 2012, 40, 168–176. [Google Scholar] [CrossRef]
  89. Monfared, A.D.; Ghazanfari, M.H.; Jamialahmadi, M.; Helalizadeh, A. Potential Application of Silica Nanoparticles for Wettability Alteration of Oil–Wet Calcite: A Mechanistic Study. Energy Fuels 2016, 30, 3947–3961. [Google Scholar] [CrossRef]
  90. Shahrabadi, A.; Bagherzadeh, H.; Roostaie, A.; Golghanddashti, H. Experimental Investigation of HLP Nanofluid Potential to Enhance Oil Recovery: A Mechanistic Approach; Society of Petroleum Engineers: Richardson, TX, USA, 2012. [Google Scholar]
  91. Li, S.; Genys, M.; Wang, K.; Torsæter, O. Experimental Study of Wettability Alteration during Nanofluid Enhanced Oil Recovery Process and Its Effect on Oil Recovery; Society of Petroleum Engineers: Richardson, TX, USA, 2015. [Google Scholar]
  92. Esmaeilzadeh, P.; Hosseinpour, N.; Bahramian, A.; Fakhroueian, Z.; Arya, S. Effect of ZrO2 nanoparticles on the interfacial behavior of surfactant solutions at air–water and n-heptane–water interfaces. Fluid Phase Equilib. 2014, 361, 289–295. [Google Scholar] [CrossRef]
Figure 1. Schematic showing the four stages of oil film dewetting from a uniform thick film (I) to film thinning (II); formation of discrete oil patches (III); and recession of oil patches to form oil droplets at the new equilibrium wetting condition (IV).
Colloids 02 00030 g001
Figure 2. Disjoining pressure ( Π = Π e l   + Π v d W ) as a function of thin-water layer thickness (h) and pH. Zeta potentials ( ψ ) at pH 3, 5 and 9 are: 2.5, −55.6 and −78.2 mV for oil (bitumen) [15], and −12, −30 and −38 mV for silica, respectively. The Hamaker constant (ASWB) for silica/water/oil system is 5.7 × 10⁻²¹ J [16]. Π v d W =   A S W B 6 π h 3 , Π e l =   1 2 ε ε 0 κ 2 2 ψ 1 ψ 2 cos h ( κ h ) ψ 1 2 ψ 2 2 sin h 2 ( κ h ) , where ε and ε 0 are the dielectric permittivity of vacuum and relative dielectric permittivity of water, respectively. κ is the Debye length, which accounts for changes in salinity.
Colloids 02 00030 g002
Figure 3. Apparent adhesion force for a partially wetting droplet (droplet volume = 10 µL).
Colloids 02 00030 g003
Figure 4. Molecular-kinetic model describes the distance between adsorption sites ( λ ) and a frequency ( κ 0 ) of adsorption/desorption events. Figure adapted from Blake [24].
Colloids 02 00030 g004
Figure 5. Time-dependent dewetting of an extra heavy oil droplet on a hydrophilic solid surface. The solid surface and water temperature were maintained at 40 °C. Images were captured at 20 fps for the first 15 min and 2 fps thereafter. Data captured using the Theta tensiometer (Biolin Scientific).
Colloids 02 00030 g005
Figure 6. Dewetting dynamics of an extra heavy oil film immersed in Milli-Q water at different temperatures: 40 °C, 60 °C, and 80 °C. Inset is an expanded region of the initial dewetting dynamics to differentiate between the two higher temperatures. Each experimental condition was repeated four times with measurement variability considered to be negligible.
Colloids 02 00030 g006
Figure 7. Initial oil droplet receding rate as a function of temperature, correlated to changes in oil viscosity and oil-water interfacial tension (error ± 0.03 mN/m). Symbols: circle—oil droplet receding rate, triangle— γ O / W , square— μ o .
Colloids 02 00030 g007
Figure 8. Hydrodynamic (HD) and molecular-kinetic (MK) model fittings of oil film dewetting at 40 °C (a), 60 °C and 80 °C (b). Shaded lines represent the experimental data and the HD and MK models identified by the solid and dash lines, respectively. (c) Optimal fitting parameters, HD (closed symbols)— ln ( L L S ) , MK (open symbols)— ζ .
Colloids 02 00030 g008
Figure 9. (a) Oil film dewetting at 60 °C ( ρ o i l @ 60   ° C = 946 kg/m3) with increasing sodium dodecyl sulfate (SDS) concentration (5 × 10⁻⁴ wt % and 5 × 10⁻³ wt %). Shaded lines represent the experimental data with the HD and MK models identified by the solid and dash lines, respectively; (b) Oil film dewetting at 60 °C with the SDS concentration above the CMC (SDS = 0.12 wt %). The solid surface-oil droplet contact diameter reaches a minimum of 0.34 mm at the point of oil droplet detachment; (c) Extra heavy oil-water interfacial tension as a function of the SDS concentration. The CMC was ~0.1 wt % at 60 °C.
Colloids 02 00030 g009
Figure 10. Schematic showing the ordered accumulation of nanoparticles to form a liquid wedge. The structural disjoining pressure increases towards the de-pinning point. The structural disjoining pressure exceeds the Laplace pressure, deforming the meniscus profile as represented by inner and outer contact lines. The contribution from the long range structural disjoining pressure dominates the short range electrostatic and van der Waals forces. The figure has been modified from Zhang et al. [62] and Chengara et al. [11].
Colloids 02 00030 g010

