
Article

Interpretable Machine Learning for the Shear Capacity of RC Corbels: A Validated, Application-Driven Model

Division of Civil and Environmental Engineering, College of Engineering and Computing, Umm Al-Qura University, P.O. Box 288, Al-Qunfudah 21912, Saudi Arabia
Mach. Learn. Knowl. Extr. 2026, 8(6), 160; https://doi.org/10.3390/make8060160
Submission received: 13 May 2026 / Revised: 31 May 2026 / Accepted: 8 June 2026 / Published: 10 June 2026
(This article belongs to the Section Learning)

Abstract

This paper demonstrates the application of a robust machine learning methodology to develop an accurate and, critically, an interpretable data-driven model for RC corbel shear assessment. A primary focus of this work is the use of advanced explainability techniques to rigorously validate the model’s predictive logic against fundamental principles of structural mechanics, directly confronting the limitations of “black-box” approaches. To implement this framework, an extensive database of 515 experimental tests was assembled. Different machine-learning (ML) techniques, including Random Forest, AdaBoost, Support Vector Machine, and XGBoost, were systematically evaluated to define the optimal predictive model. The most accurate algorithm, XGBoost, was selected and optimized to achieve exceptional performance, with a coefficient of determination ( R 2 ) of 0.98 evaluated across the full database and a mean absolute relative deviation (MARD) of only 4%; on the held-out testing subset the model retains an R 2 of 0.97 and a MARD of 15%, confirming that predictive performance does not degrade appreciably on unseen specimens. The predictive model was shown to be substantially more accurate and generalizable than current design approaches, including both ACI code provisions and other prominent analytical models from the literature. Crucially, the Shapley Additive exPlanations (SHAP) technique was used to rigorously interrogate the model’s predictive logic. The analysis showed that the model’s feature attributions are consistent with established structural mechanics, correctly identifying the governing influence of parameters like the shear span-to-depth ratio and reinforcement indices for distinct failure modes. This explainability analysis establishes that the learned associations agree with structural expectations; it does not by itself demonstrate mechanistic causality. The study provides a validated methodology for creating trustworthy ML models and indicates, subject to further validation, uncertainty quantification, and a clearly defined applicability domain, how such interpretable tools might complement existing design provisions.

1. Introduction

Reinforced concrete (RC) corbels, characterized as compact cantilevered projections from columns or walls, typically with a shear span-to-depth ratio ( a v / d ) of less than unity, are integral components in precast concrete construction. They primarily function to support prefabricated beams or floor systems at structural joints, thereby ensuring efficient force transmission to the vertical structural elements. These members are designed to resist substantial vertical loads in conjunction with horizontal forces originating from factors such as restrained shrinkage, thermal deformation, and creep of the supported beam, as well as dynamic actions like crane braking forces [1]. The prevalence of corbels in contemporary building design has grown alongside the increased utilization of precast concrete technologies [2].
Structurally, corbels are classified as discontinuity regions (D-regions) owing to their geometric configuration. This classification signifies that the strain distribution across the section depth is nonlinear, a characteristic maintained even within the elastic range [3]. In addition, their ultimate load-carrying capacity is predominantly governed by shear mechanisms rather than flexural behavior [1,4]. The ACI 318-25 code [5] stipulates that corbels with a v / d below 2 must be designed using the strut-and-tie method (STM). For ratios less than 1, design can proceed via either STM or the related ACI shear–friction method. Nevertheless, the shear–friction hypothesis exhibits a weak correlation with the empirically observed failure mode of diagonal concrete strut crushing [6]. Consequently, strut-and-tie models have achieved widespread recognition as a rational design approach for D-regions, encompassing elements like deep beams and corbels [7]. This approach is endorsed by most contemporary design standards, including ACI Committee 318 [5] and Eurocode 2 [8], both of which recommend STM for RC corbel design. Despite this broad acceptance, predictions of corbel shear capacity derived from existing STMs, available formulae, and computational procedures have demonstrated significant variability when compared against experimental results [6,9,10]. This highlights the need for a more robust design methodology that can yield both safe and economical corbel designs.
The assessment of shear strength and failure mechanisms in reinforced concrete elements, including corbels, can be effectively accomplished through numerical simulations. Finite Element (FE) models, for instance, are frequently employed to thoroughly evaluate the shear capacity of corbels, particularly under complex loading conditions [11,12]. However, a significant drawback of such models is their considerable computational expense and limited capacity for generalization across diverse structural configurations or loading scenarios prevalent in practical applications involving RC corbels. In addition, the inherent need for extensive expertise to execute dependable FE analyses and the complexity associated with interpreting their intricate results often render these models impractical for routine structural engineering design, especially during the preliminary stages of a project. Consequently, there is a clear demand for alternative methodologies that facilitate a more rapid and efficient evaluation of the shear strength of RC corbels under varying conditions.
The integration of machine learning (ML) techniques into structural engineering has accelerated over the last decade, driven by their predictive accuracy and robustness in addressing complex nonlinear problems that resist closed-form treatment. ML offers accurate, robust, and interpretable solutions for complex structural engineering problems, effectively predicting nonlinear behaviors of RC components like walls, columns, and slabs, including shear strength and failure modes [13,14,15,16]. Ensemble methods such as XGBoost, combined with interpretability tools like SHAP, have proven particularly effective in modeling parameters such as plastic hinge length in RC columns and shear strength in squat RC walls [17,18,19,20]. Beyond predictive modeling (e.g., punching shear in slabs and bearing capacity in columns [21,22,23,24]), ML enhances structural health monitoring, progressive collapse analysis, and stochastic damage modeling [25,26,27,28,29]. Efforts to improve explainability are increasing the trustworthiness of these models for practical applications [30,31], positioning ML to significantly advance structural engineering by managing complexity and uncertainty in structural behaviors [21,32].
However, despite this immense potential, the direct translation of these advanced models into trusted engineering practice faces significant hurdles that have slowed their adoption. This inertia stems primarily from two interconnected challenges: the inherent opacity of ML predictions and the limited familiarity of practicing engineers with these advanced computational tools [31]. To foster trust and encourage adoption, it is imperative that ML models become more transparent. Explainability methods are therefore crucial for transforming ML from a niche research topic into a primary tool for structural analysis and design.
The shear design of RC corbels presents a significant and persistent challenge in structural engineering in which this exact issue is prominent, as the provisions within current design codes are primarily based on simplified or empirical equations that yield inconsistent and often unreliable predictions. The gap addressed here is specific rather than general. Accurate data-driven predictors for the shear of discontinuity regions already exist, but for RC corbels they have not been paired with a mechanistic audit that checks the learned input–output relationships against shear-transfer theory, nor with an explicit applicability domain that signals to a designer when a prediction is an interpolation within the calibrated data and when it is an extrapolation beyond it. An accurate corbel-specific predictor that is at the same time mechanistically auditable and bounded in scope therefore remains undemonstrated. To bridge the critical gap between academic research and practical application, this study introduces a structured framework for an explainable, data-driven model designed to overcome the key shortcomings of previous efforts: superficial validation and limited explainability.
Four objectives organize the work that follows. The first is to assemble and curate a large, homogeneous experimental database of shear-controlled RC corbel tests suitable for supervised learning. The second is to identify, through a systematic comparison of ensemble and kernel algorithms under identical cross-validation, the most stable and accurate predictor, and to optimize its hyperparameters. The third is to interrogate the selected model with SHAP, both globally and for individual specimens, so that the sign and shape of every learned dependence can be checked against established shear-transfer mechanics. The fourth is to benchmark the resulting model, on a consistent nominal-capacity basis, against the ACI 318-25 provisions and prominent analytical models, and to delimit the applicability domain within which the model may be applied with confidence. These objectives are pursued in turn in the sections that follow; the quantitative performance results summarized below are reported and substantiated only thereafter.
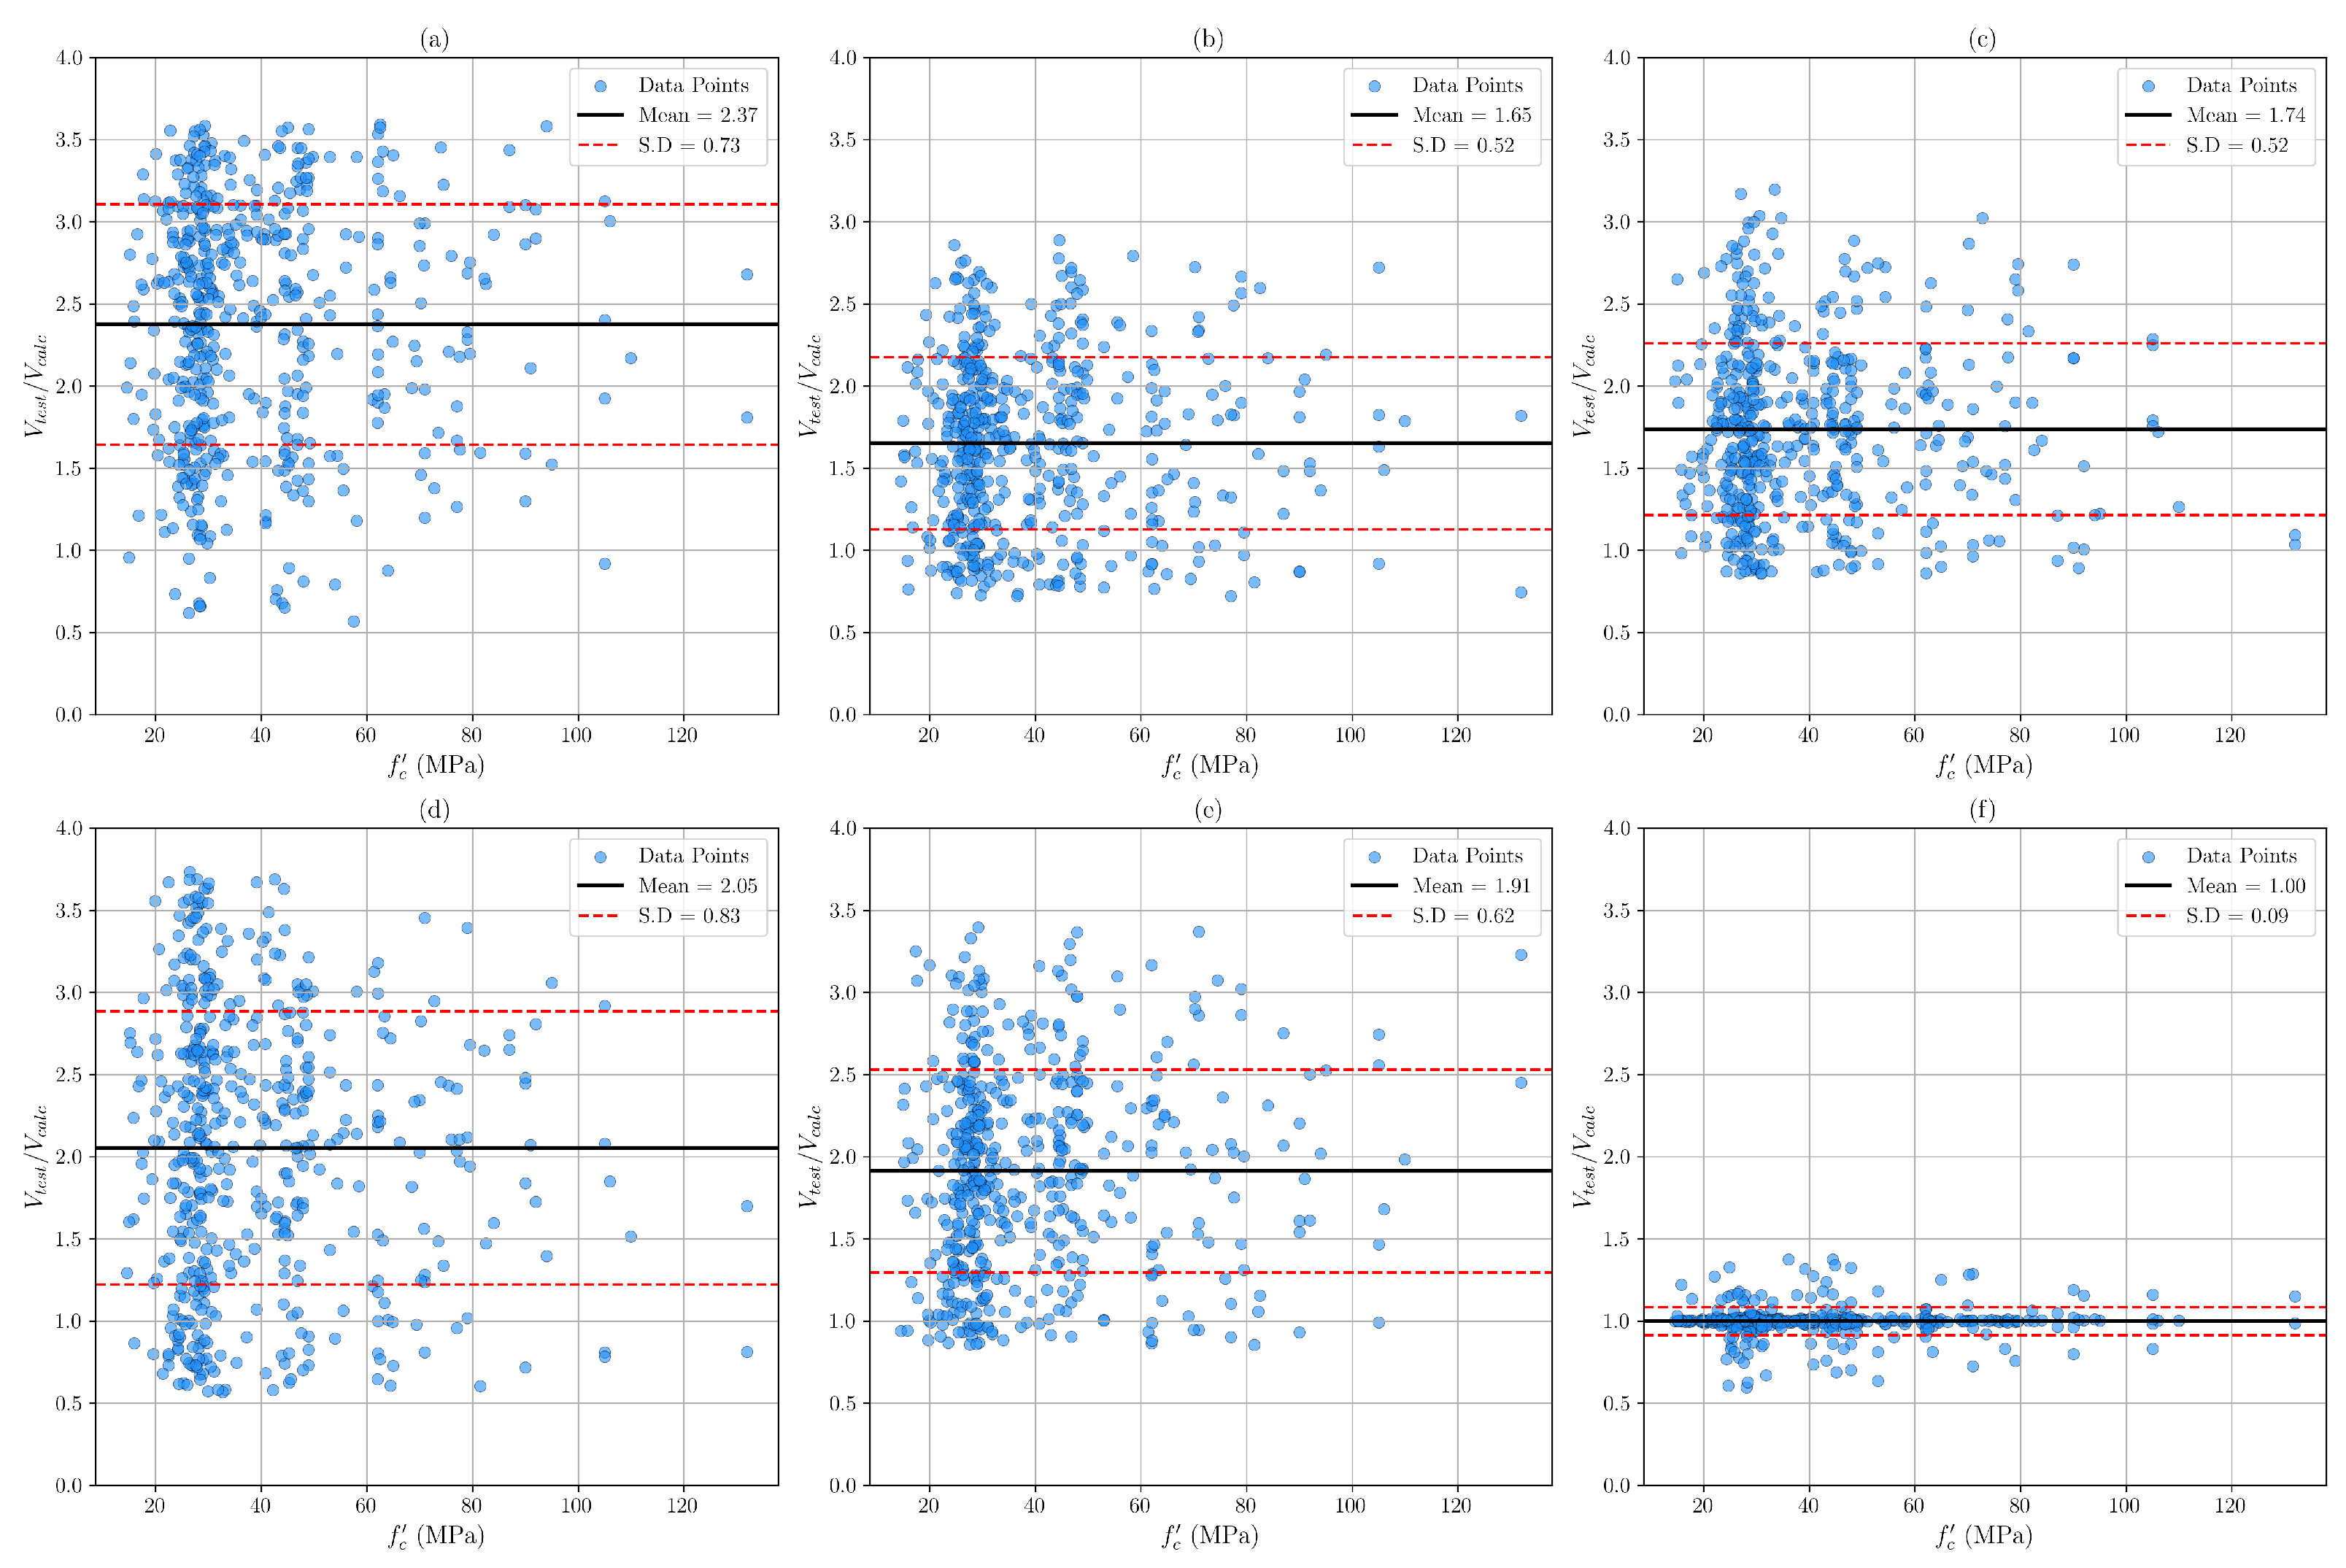
By leveraging an extensive database of 515 experimental tests, an optimized Extreme Gradient Boosting (XGBoost) model was developed, selected after a systematic evaluation of several ensemble learning techniques. The proposed model demonstrates exceptional predictive power, achieving a coefficient of determination ( R 2 ) of 0.98 and a mean absolute relative deviation (MARD) of only 4%. This stands in stark contrast to the ACI 318-25 code provisions [5], which show an R 2 of just 0.17 and a MARD of 54% for the same dataset. Crucially, the model’s predictive logic was rigorously interrogated using Shapley Additive exPlanations (SHAP) to ensure its internal decision-making process aligns with established structural mechanics, confirming that it correctly identifies the influence of governing parameters. The result is not only a highly accurate predictive tool but also a validated methodology for creating trustworthy machine learning models and, subject to further validation, uncertainty quantification, and a defined applicability domain, a candidate route toward complementing conventional code provisions with auditable computational tools.

2. Literature Review

2.1. Code Provisions and Analytical Models for RC Corbels

2.1.1. ACI (318-25) Design Approach

Major international design codes [5,8] provide guidelines for the design of RC corbels, particularly emphasizing the prevention of brittle shear failure. The American Concrete Institute (ACI) code, for instance, offers two distinct design pathways delineated by the corbel’s shear span-to-depth ratio, a v / d . For slender corbels with an a v / d ratio between 1.0 and 2.0, a strut-and-tie analysis is mandatory. For deep corbels, where a v / d 1.0 , the code permits designers to use either a strut-and-tie model or the shear–friction design procedure. This alternative method is a hybrid approach that requires designing for the shear force V u , a horizontal tensile force N u c , and the moment [ V u a v + N u c ( h d ) ] . The nominal shear strength, v n , is determined using shear friction principles as
v n = A v f f y μ
where A v f is the area of shear–friction reinforcement, f y is the reinforcement yield strength, and μ is the coefficient of friction. The design is subject to an upper limit on V n , which shall not exceed the smallest of 0.2 f c b w d , ( 3.3 + 0.08 f c ) b w d , and 11 b w d for normal-weight concrete. In addition to shear–friction reinforcement, the procedure requires calculating reinforcement for flexure ( A f ) and for the direct tension force N u c ( A n ).
Although the strut-and-tie method (STM) is presented as the more versatile and fundamental approach, its practical implementation is not without significant challenges. A primary issue is that no single “correct” STM exists for a given geometry, meaning two designers may analyze the same region differently, leading to inconsistent results [33]. This problem is exacerbated in complicated geometries, such as those with openings or multiple load paths, which are inherently difficult to model accurately. Consequently, this ambiguity introduces a degree of subjectivity into the modeling process, placing significant reliance on the designer’s judgment to formulate a model that adequately ensures both strength and ductility.

2.1.2. Empirical and Rational Models in the Literature

Beyond code-based methods, a number of analytical models for predicting the shear strength of RC corbels have been proposed in the literature, several of which serve as established benchmarks for comparison. These models vary in complexity, ranging from simplified empirical formulations to refined iterative analyses grounded in equilibrium, compatibility, and material constitutive behavior.
Solanki and Sabnis Model
Solanki and Sabnis [34] introduced a model derived from equilibrium considerations and compressive stress distribution, leading to the following shear strength expression:
v u = f c 4.45 β 1 1 + N u c V u · Δ h a v 0 . 9 2 + ( a v / d ) 2 1
where Δ h = h d , and β 1 varies with concrete strength:
β 1 = 0.85 f c 27.6 MPa 0.85 0.05 f c 27.6 6.9 27.6 < f c < 55.2 MPa 0.65 f c 55.2 MPa
Hagberg’s Truss-Based Criterion
Hagberg [35] proposed a truss analogy-based method that establishes an upper bound for corbel capacity, constrained by a compression failure criterion in the strut. The main equation suggested to calculate this ultimate vertical load capacity ( V max ) as limited by a concrete compression failure is
V max = f c b w cos 2 ( β max )
where V max is the failure load, w is the width of the bearing plate, and β max is the inclination of the concrete compression member relative to the vertical load, based on the corbel’s geometry.
Foster et al. Model
Foster et al. [36] presented an analytical model that captures the effects of anchorage depth and bearing plate width on corbel capacity. The shear strength is evaluated as
v u = min ρ s f s y w Ω ,   f c * w d
where w is the bearing plate width, Ω = d d 2 2 a w w 2 represents the effective anchorage depth, f c * is the modified concrete strength accounting for size and geometry effects.
f c * = 1.25 f c 500 0.72 a d + 0.18 a d 2   f c 0.85 f c
Russo et al. Model
Russo et al. [10] introduced a predictive model for the shear strength of RC corbels by combining the effects of the diagonal strut-and-tie mechanism and horizontal stirrups. The model is based on equilibrium conditions and incorporates the nonlinear softening behavior of cracked concrete. It expresses the total shear resistance as the sum of the contributions from the inclined concrete strut and the horizontal stirrups.
v u = 0.80 k χ f c cos θ + 0.65 ρ h f y h cot θ
The model incorporates several key parameters: k = n ρ f 2 + 2 n ρ f n ρ f ( n ρ f + 2 ) as a geometric factor, n is the ratio of the elastic moduli of steel and concrete, χ = 0.74 f c 105 3 1.28 f c 105 2 + 0.22 f c 105 + 0.87 as the concrete softening coefficient, and θ = 2 arctan a / d k / 2 ( a / d ) 2 + ( 1 k / 2 ) 2 as the strut inclination angle. The reinforcement configuration is characterized by ρ f and ρ h , representing the reinforcement ratios of principal and horizontal stirrups, respectively. Material properties are defined by f y h , the yield strength of horizontal stirrups, and f c , the compressive strength of concrete.
It should be noted that while other analytical models for RC corbels exist in the literature, a complete review is precluded by space limitations in the current study. The models presented herein were subsequently used to create a benchmark study to evaluate the effectiveness of the proposed analysis model.

2.2. Machine Learning Principles and Ensemble Methods in Structural Engineering

The accurate prediction of complex structural behaviors, such as the shear capacity of RC elements, remains a significant challenge in structural engineering. Conventional design methodologies, primarily anchored in mechanics-based or empirical equations found in design codes, often yield conservative predictions with high variability and lack generalisability across various structural configurations. This problem is evident in the design of various members, including prestressed concrete (PC) beams [16], deep beams [17], and squat walls [37], where the intricate interplay of forces and material nonlinearities is difficult to capture with simplified formulas. While advanced numerical analysis methods like finite-element (FE) modeling offer high-accuracy assessments, they are computationally intensive, require specialized expertise, and are impractical for routine design, thereby limiting their widespread application [12].
To overcome these limitations, machine learning (ML) has emerged as a powerful, data-driven alternative. By learning complex, nonlinear relationships directly from large experimental and advanced simulation datasets, ML techniques can generate predictive models with superior accuracy and robustness [37,38]. This capability has been successfully applied across a wide spectrum of structural engineering problems, from forecasting material properties, such as the compressive strength of concrete [20], to estimating the performance of entire components. Notable examples include predicting the shear strength of PC beams, deep beams, and squat RC walls, as well as classifying failure modes and estimating the bearing capacity and plastic hinge length of RC columns [16,30,39].
Beyond component-level analysis, ML is also transforming broader performance evaluations, including structural health monitoring and infrastructure risk assessment. For instance, studies have employed ML models, often trained with data from high-accuracy numerical simulations, to estimate the seismic performance of structures using input parameters like event intensity and asset metadata [22,40,41,42,43]. More recently, advanced techniques are leveraging new data sources; Natural Language Processing (NLP) is being used to extract research trends and evaluate structural damage from textual descriptions [23,44], while Convolutional Neural Networks (CNNs) are being applied to image analysis for tasks like crack detection and damage assessment from ground motion wavelets [45,46]. The increasing availability of these large and diverse datasets continues to enhance the feasibility and performance of ML applications in the field [38].
However, despite their predictive power, the practical adoption of ML models in engineering has been hindered by their “black-box” nature, which can obscure the reasoning behind their predictions and limit trust. To address this critical issue, the field has moved toward interpretable ML, using techniques like SHapley Additive exPlanations (SHAP) to provide transparent insights into model behavior. Unlike basic feature importance metrics, SHAP can quantify the contribution of each input variable for both individual predictions (local interpretability) and overall model behavior (global interpretability), fostering confidence and enabling informed decision-making [31,37].
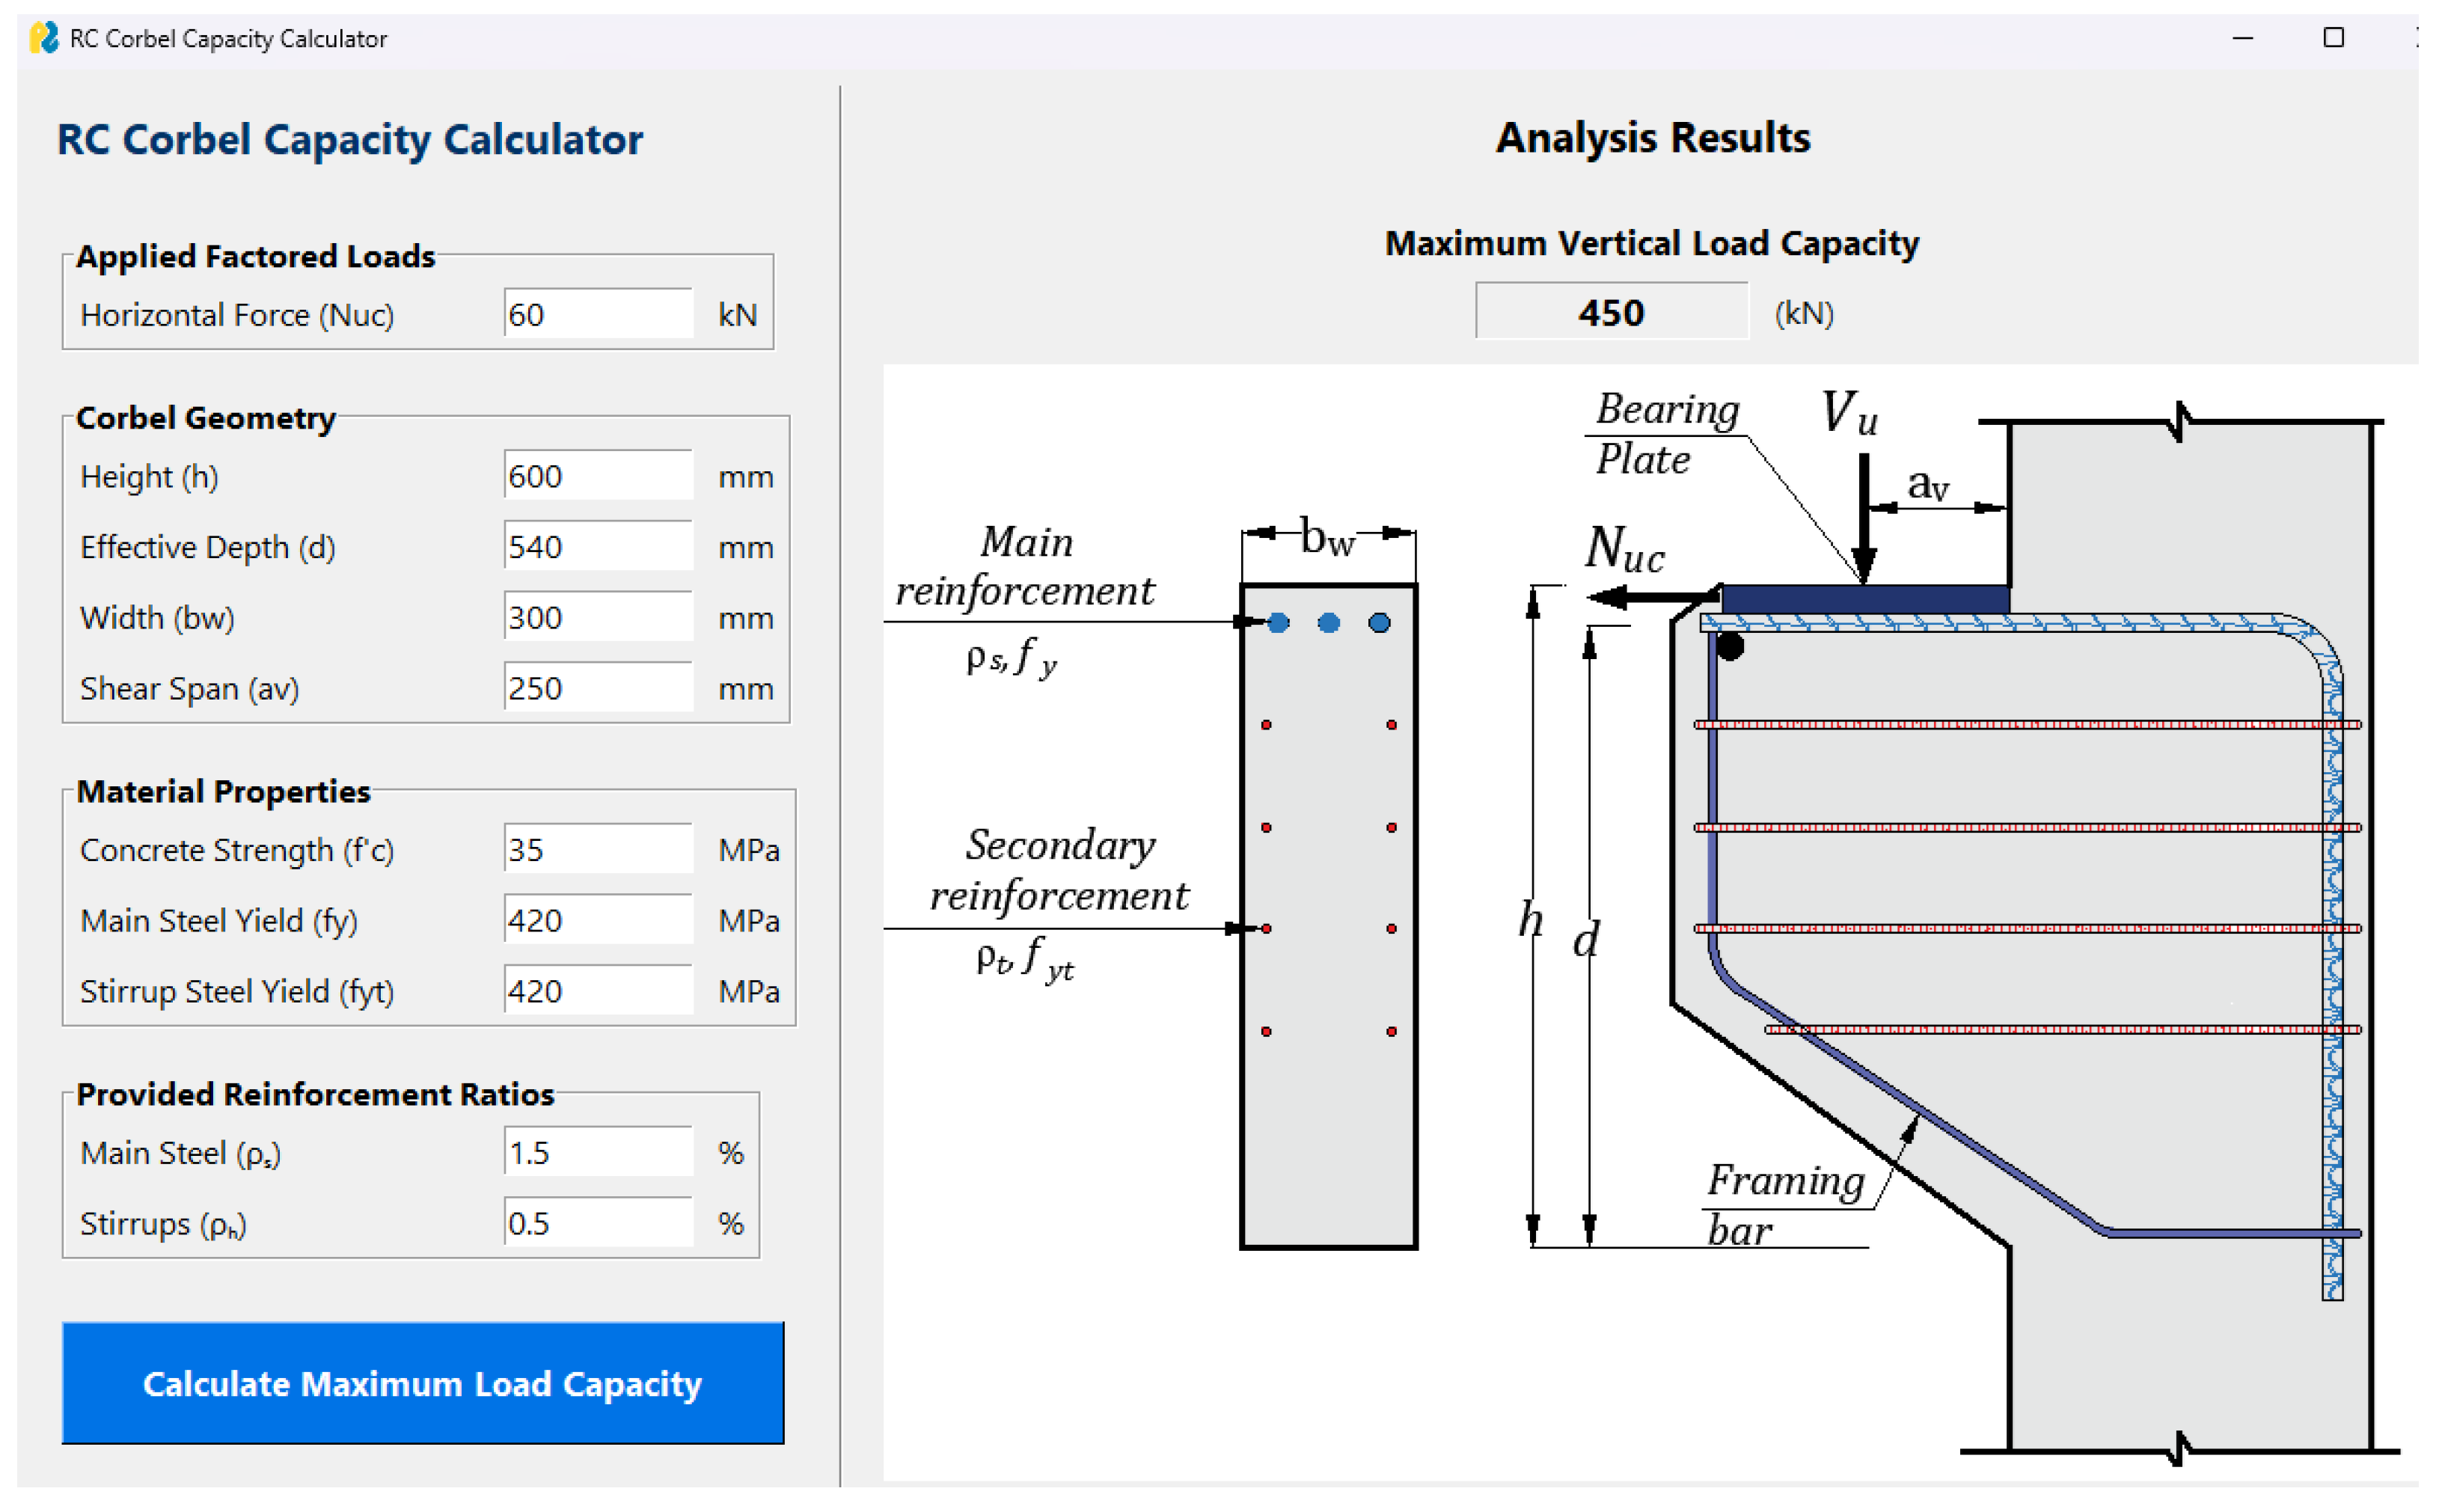
The combination of gradient-boosted trees (in particular XGBoost) with SHAP-based interpretability has by now been applied to a number of reinforced-concrete shear-strength problems. Representative recent contributions include the shear-strength prediction of squat RC walls [17,32,37], deep beams [17], and punching shear in flat slabs [21], in each case reporting strong predictive accuracy and providing global SHAP rankings of the dominant input variables. The framework proposed in the present paper is therefore not the first to use XGBoost and SHAP for an RC-shear application; the value of the present contribution lies elsewhere, and is articulated explicitly in the following five points so that the demarcation from prior work is clear to the reader. (i) Application to RC corbels. The present study is the first published account of a SHAP-interpreted XGBoost model developed specifically for the shear capacity of RC corbels, a discontinuity-region member whose load path (direct strut-and-tie with shear–friction transition at a v / d = 1 ) differs qualitatively from the slender-beam, deep-beam, squat-wall, and slab applications cited above. (ii) Database scale and curation. The 515-specimen database compiled and filtered for this work, drawn from twenty independent experimental campaigns, is the largest curated experimental database assembled for RC corbel shear capacity reported in the literature to date; prior corbel-specific data-driven studies have typically used fewer than three hundred specimens. (iii) Systematic algorithm comparison and stratified evaluation. Rather than asserting XGBoost a priori, the present study compared four candidate algorithms (Random Forest, AdaBoost, SVR, XGBoost) under identical 10-fold cross-validation on the log-transformed target, identified XGBoost as the most stable choice, and only then proceeded to the dedicated grid-search hyperparameter optimisation (Section 3.4). (iv) Mechanistic SHAP audit and quantitative benchmarking against code provisions and analytical models. The SHAP analysis in this paper is not used only to rank features; it is used to verify, against established structural mechanics, the sign and shape of every learned dependence (Section 4), and the resulting model is benchmarked head-to-head against ACI 318-25 [5] and four prominent analytical models on the same 515-specimen database (Section 5 and Table 1). (v) Practitioner-oriented deliverables. A PyQt software prototype (Section 6), an explicit applicability-domain check (Section 3.5), and a transparent statement of the failure modes that lie outside the model’s domain of validity (Section 3.2 and the concluding Limitations) together translate the predictive model into a tool that can be applied responsibly in practice. The combination of these five elements within a single corbel-specific study is the novelty claimed for this paper, situating the present contribution alongside, rather than within, the body of prior XGBoost-and-SHAP work on RC-shear prediction.
The directly comparable, data-driven studies cited above span the most recent literature on interpretable machine learning for RC shear, encompassing gradient-boosted and SHAP-interpreted models for squat walls, deep beams, and slab punching shear [16,17,21,32,37], together with the contemporary physics-informed operator-learning methods discussed in the following paragraphs [47]. These works situate the present corbel-specific contribution against the current state of the art in data-driven shear-strength prediction.
In parallel with the rise of pure data-driven approaches, the computational mechanics community has developed a complementary family of methods that embed governing physics directly into the learning architecture. Physics-Informed Neural Networks (PINNs) [48] cast the solution of forward and inverse partial differential equation (PDE) problems as a neural-network optimization in which the PDE residual, boundary conditions, and initial conditions are added as soft penalties in the loss function. The Deep Energy Method (DEM) introduced by Samaniego et al. [49] reformulates the elastic boundary-value problem as the minimization of the total potential energy, with the displacement field parameterized by a neural network; the variational principle endows the formulation with thermodynamic consistency by construction. More recent Variational Physics-Informed Neural Operators (VINO) [47] generalize this idea to operator learning, training a neural model that maps an entire family of input fields (loads, material parameters) to their corresponding solution fields while minimizing a variational energy functional. Independent of the deep-learning branch, the Cracking Particles Method (CPM) of Rabczuk and Belytschko [50,51] provides a meshfree, discrete-fracture framework explicitly designed to track arbitrary evolving cracks and shear bands, which are phenomena central to diagonal shear failure in D-regions such as corbels.
These physics-anchored approaches are powerful where the governing PDE and a calibrated continuum constitutive law are available with reasonable accuracy. For the shear assessment of reinforced concrete corbels, however, no consensus continuum formulation captures the coupled response of cracked, softened concrete, the bond–slip behaviour of reinforcement, the discrete strut-and-tie load paths, and the size-dependent fracture energy with sufficient accuracy to drive a PINN, VINO, or CPM simulation; this very gap is documented in the ACI commentary [5] and in the wide scatter of strut-and-tie predictions against experiments [6,9,10]. Faced with 515 high-quality experimental records and no reliable continuum model, the data-density versus model–prior trade-off favours an explainable supervised ensemble: the database is dense enough to identify the dominant input–output mapping, and the SHAP-based mechanistic audit reported in Section 4 plays the role that thermodynamic-consistency constraints play in PINN/DEM/VINO formulations, providing an a-posteriori verification that the learned model is mechanistically plausible. We view the present data-driven approach and the physics-informed family as complementary; future work should compare the two on the same experimental dataset once a sufficiently calibrated continuum model for reinforced-concrete D-regions becomes available.
The development of accurate and interpretable ML models facilitates a fundamental shift from empirical traditions to robust, data-driven design methodologies. This transition makes it possible to create reliability-based frameworks and integrate predictive models directly into future design codes, potentially through user-friendly software. By complementing mechanics-driven analysis with data-driven accuracy, ML offers a broad, state-of-the-art approach to solving complex engineering problems [16,17].
In this context, to advance the accuracy of shear strength predictions for RC corbels, this study systematically explores the application of powerful ensemble learning algorithms. Four prominent methods were selected for model development: (1) Random Forest (RF), (2) Adaptive Boosting (AdaBoost), (3) Support Vector Machine (SVM), and (4) Extreme Gradient Boosting (XGBoost). These algorithms all operate under the supervised learning paradigm, meaning they are trained on a labeled dataset where both the input features (e.g., geometric and material properties) and the corresponding output targets (shear strength) are known. The following subsections present brief descriptions of each algorithm as utilized in this research.

2.2.1. Random Forest Algorithm

The Random Forest (RF) algorithm is an ensemble learning method that constructs a multitude of decision trees during training and outputs the mean prediction of the individual trees for regression tasks [52,53]. Its primary strength in structural engineering lies in its ability to model complex, non-linear relationships between input parameters (e.g., material properties, geometry) and structural responses without succumbing to overfitting. The algorithm’s predictive output, y ^ , is the ensemble average of B individual trees, T b ( x ) , for a given input x, as shown below. This averaging process significantly reduces the variance that plagues individual decision trees.
y ^ = 1 B b = 1 B T b ( x )
In this study, RF was selected for its demonstrated robustness and its intrinsic capability to quantify the relative importance of input variables, providing valuable insights into the factors governing RC corbel shear strength. The dual randomization process, combining bootstrap aggregating (bagging) with random feature selection at each node split, decorrelates the individual trees, which is crucial for improving prediction accuracy when input variables may be collinear [54]. The algorithm was applied to predict the shear capacity of RC corbels based on the experimental database, with key hyperparameters, such as the number of trees in the forest and the number of features considered at each split, tuned via cross-validation to maximize model performance and prevent overfitting. The model’s out-of-bag (OOB) error was monitored during training as an internal validation metric to ensure robust generalization to unseen data.

2.2.2. Adaptive Boosting (AdaBoost)

Adaptive Boosting (AdaBoost) is a sequential ensemble algorithm that combines multiple weak learners, typically shallow decision trees, to generate a single strong predictor [55,56]. Unlike bagging methods that build models in parallel, AdaBoost iteratively trains learners, with each subsequent model placing greater emphasis on instances that were incorrectly predicted by its predecessors. This adaptive re-weighting strategy allows the model to focus on the most challenging cases within the dataset, making it highly effective for complex regression problems. The final model combines the weak learners, h t ( x ) , into a single strong predictor, H ( x ) , through a weighted summation where the weights, α t , are proportional to the learner’s performance:
H ( x ) = t = 1 T α t h t ( x )
For the prediction of RC corbel shear strength, a regression variant, AdaBoost.R2, was employed. This choice was motivated by the algorithm’s ability to improve predictive accuracy by sequentially minimizing the model’s error. The model was implemented by fitting a series of decision trees to the data, where the training instance weights ( w i ) were adjusted in each iteration based on the magnitude of the prediction error, thereby forcing subsequent learners to focus on the observations with the largest residuals. This iterative refinement process enabled the final ensemble to achieve high accuracy by effectively addressing the more complex and non-linear patterns within the corbel failure dataset.

2.2.3. Support Vector Machine (SVM)

Support Vector Machine (SVM), when adapted for regression in an algorithm known as Support Vector Regression (SVR), serves as a powerful non-linear modeling tool rooted in statistical learning theory [57,58]. The core principle of SVR is to identify a hyperplane that best fits the data while tolerating deviations within a predefined error margin, or tube, of width ϵ . This ϵ -insensitive loss function ignores errors within the tube, enhancing the model’s robustness to noise. SVR is particularly advantageous in structural engineering for its ability to generalize well from limited datasets and its effectiveness in high-dimensional spaces. This is achieved by solving a convex optimization problem that balances model complexity and prediction error, as shown in the soft-margin formulation:
min w , b , ξ , ξ * 1 2 | | w | | 2 + C i = 1 n ( ξ i + ξ i * )
In this study, SVR was selected for its proficiency in modeling complex non-linearities through the “kernel trick” [59]. By mapping the input features into a higher-dimensional space, the algorithm can identify a regression hyperplane corresponding to a non-linear relationship in the original feature space. An SVR model with a radial basis function (RBF) kernel was applied, a popular choice for capturing complex patterns. The hyperparameters C (regularization parameter, controlling the trade-off between margin maximization and error minimization) and γ (kernel coefficient, defining the influence of a single training example) were meticulously optimized through a grid-search cross-validation procedure to ensure robust generalization performance and prevent overfitting.

2.2.4. Extreme Gradient Boosting (XGBoost)

Extreme Gradient Boosting (XGBoost) is an advanced and computationally efficient implementation of the gradient boosting framework that has demonstrated state-of-the-art performance on structured data [60]. The algorithm builds a predictive model as an ensemble of decision trees in a stage-wise fashion. Each new tree is trained to correct the residual errors of the preceding ensemble. Unlike traditional gradient boosting, XGBoost uses a second-order Taylor expansion of the loss function to obtain more precise gradient information, which facilitates faster convergence and improved accuracy. It effectively minimizes a regularized objective function to prevent overfitting and improve generalization. The objective at iteration t is given by
L ( t ) = i = 1 n l ( y i , y ^ i ( t 1 ) + f t ( x i ) ) + Ω ( f t )
where l is the loss function and Ω ( f t ) = γ T + 1 2 λ | | w | | 2 is the regularization term that penalizes model complexity via both the number of leaves (T) and the magnitude of leaf weights (w). XGBoost was selected for this study due to its superior predictive accuracy and high efficiency, which are critical for analyzing complex structural behavior [61,62]. The model was implemented to predict RC corbel shear strength, leveraging its parallel processing capabilities for rapid hyperparameter tuning of parameters like learning rate, tree depth, and regularization terms. This rigorous optimization process enabled the development of a highly accurate and robust predictive tool capable of capturing the intricate mechanics of corbel shear failure.

3. Model Implementation and Results

3.1. Methodological Framework

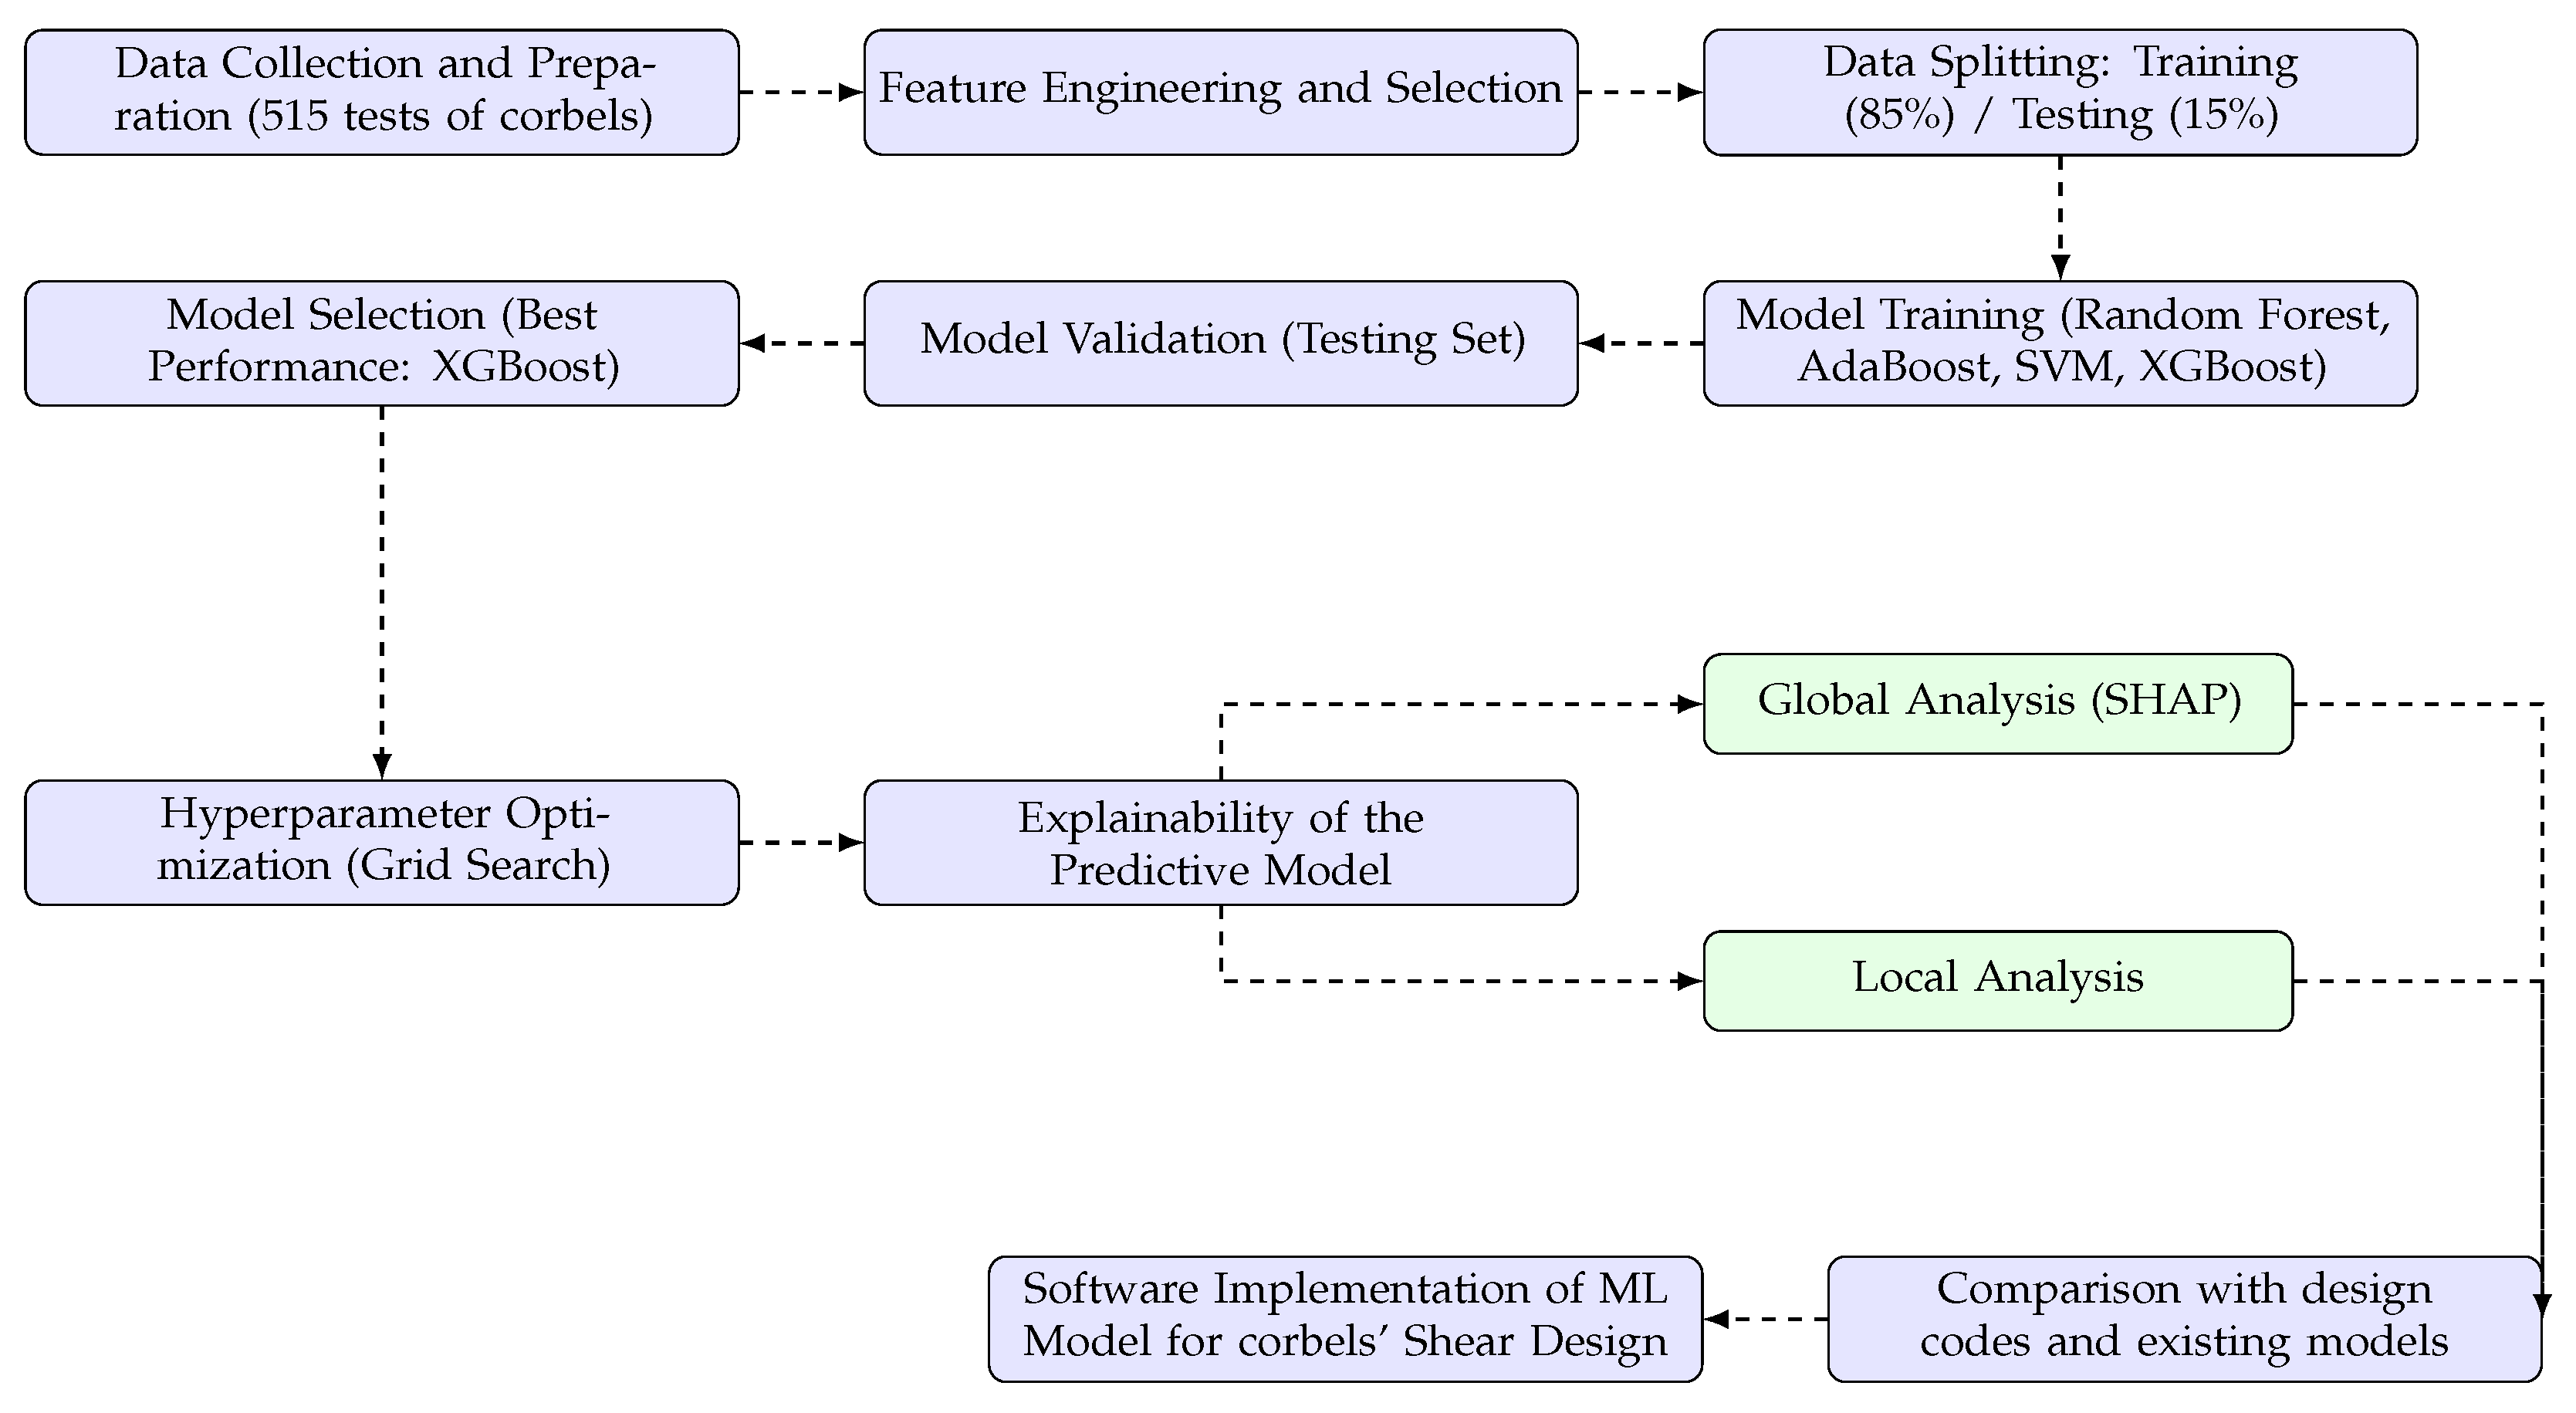
Figure 1 visually depicts a structured workflow for the development and implementation of an ML-driven shear strength prediction model for RC corbels. The methodological approach commences with the thorough collection and preparation of an extensive experimental dataset, encompassing 515 tests of corbels. This foundational step ensures a robust basis for subsequent modeling efforts. Following data acquisition, the process divides into crucial preparatory phases: feature engineering and selection are undertaken to identify and refine the most salient input variables for the predictive task, while the dataset undergoes a randomized splitting into training (85%) and testing (15%) subsets. This division is critical for unbiased model development and evaluation. The core of the modeling phase involves the training of a diverse array of machine learning algorithms, including Random Forest, AdaBoost, Support Vector Machines (SVM), and XGBoost, on the designated training set. The performance of these models is then rigorously assessed using four primary metrics: (1) the coefficient of determination ( R 2 ), (2) root mean square error (RMSE), (3) mean absolute relative deviation (MARD), and (4) the D X % index.
The MARD is a statistical metric used to quantify the accuracy of a predictive model relative to experimental results. It provides a measure of the average prediction error in relation to the actual value, calculated as the average of the absolute differences between predicted and measured values, normalized by the measured values, and expressed as a percentage. For this study, the formula is given by:
MARD = 1 n i = 1 n V u , pred . i V u , test i V u , test i × 100 %
where n is the number of observations, V u , pred . i is the predicted ultimate shear value from the model, and V u , test i is the corresponding ultimate shear value from the experimental data. The D X % index indicates the fraction of the dataset whose relative residuals do not exceed a predefined threshold X % . In this study, a threshold value of 10% was used. The formula for D 10 % is given by:
D 10 % = 1 n i = 1 n I V pred , i V test , i V test , i 0.10 × 100 %
where I ( · ) is the indicator function, which equals 1 if the condition inside the parenthesis is true, and 0 otherwise [63].
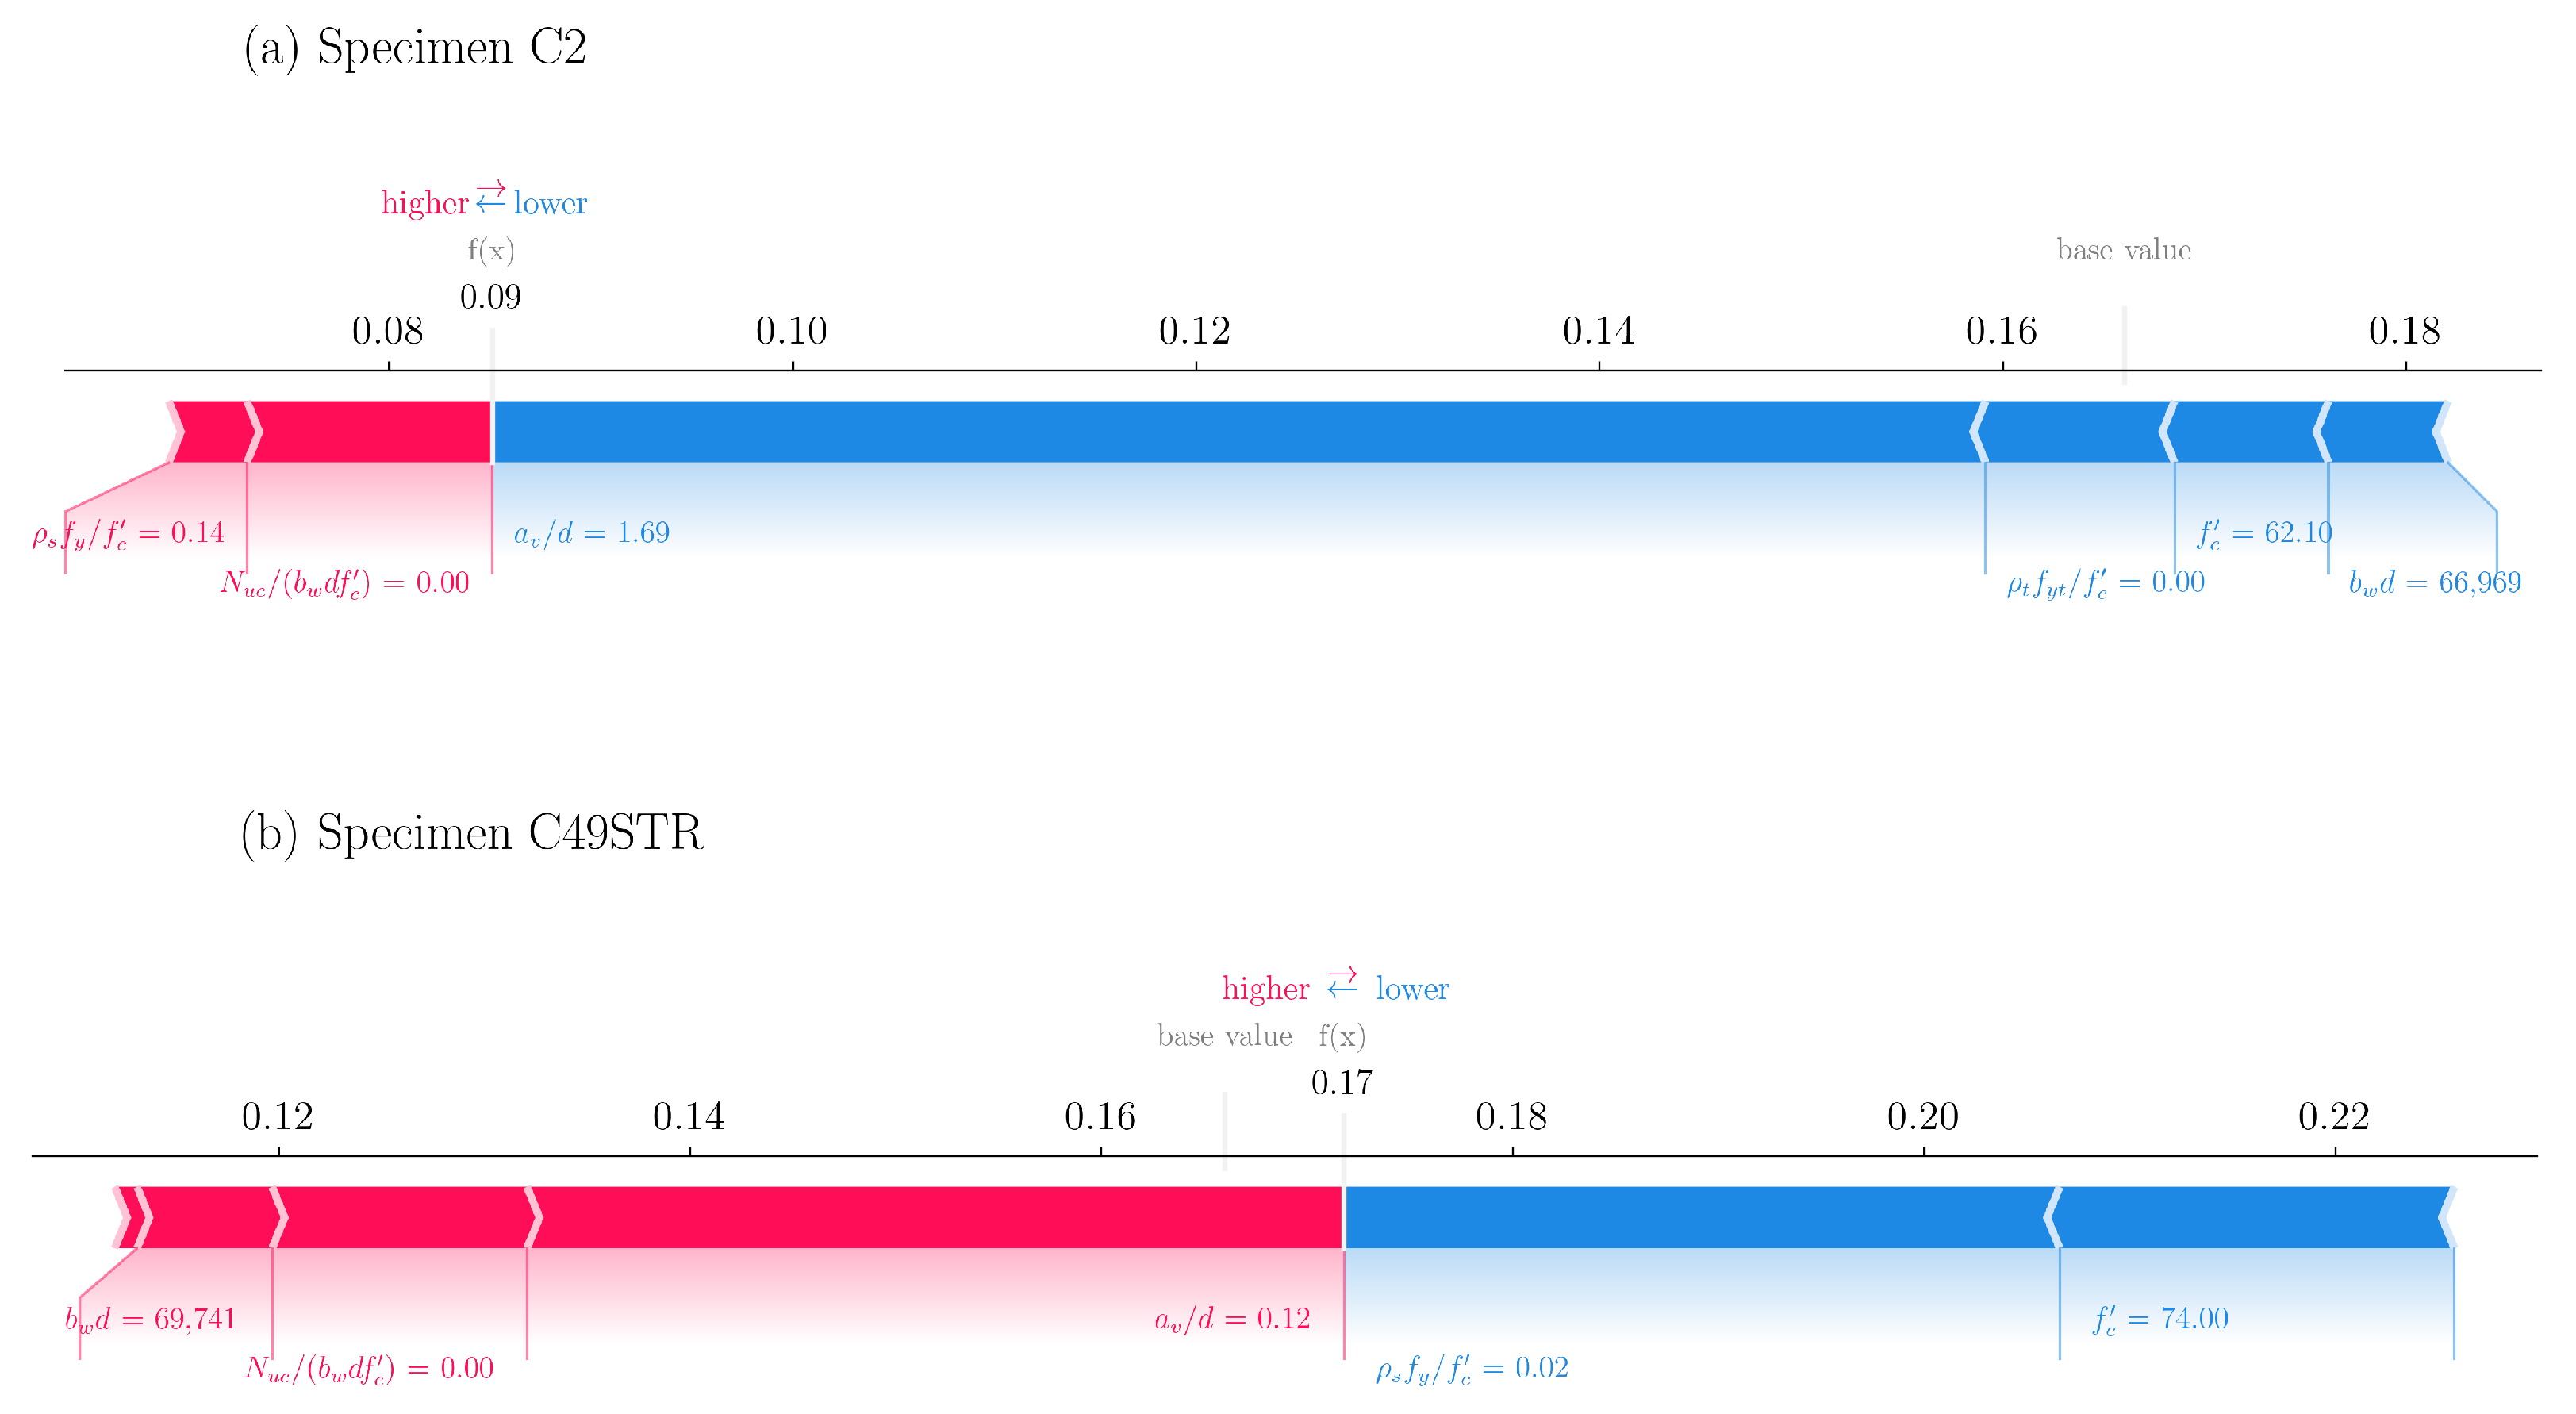
The optimal model, demonstrating superior predictive capabilities (identified as XGBoost in this framework), is subsequently selected for further refinement. This selected model undergoes a critical hyperparameter optimization phase, employing a Grid Search approach to fine-tune its internal parameters for enhanced performance. Concurrently, the refined model’s predictions are subjected to an in-depth explainability analysis, encompassing both global (SHAP) and local analysis techniques. This step is essential for understanding the underlying relationships learned by the model and the influence of individual input variables on its predictions.
The robustly validated and explained ML model is then transitioned into a software implementation, facilitating its practical application in the shear design of corbels. A final, crucial step involves the head-to-head comparison of the ML model’s predictions with established design codes and existing mechanics-based models. This comparative analysis serves to benchmark the model’s accuracy, reliability, and potential for integration into contemporary structural design practices. This structured evaluation framework ensures the development of a highly accurate, reliable, and interpretable data-driven model for code-compliant shear design of RC corbels.

3.2. Dataset Construction and Feature Subset Selection

Developing robust machine learning models for structural engineering applications requires extensive experimental databases that accurately capture the intricate interactions between design variables and structural failure mechanisms. While larger datasets generally improve predictive accuracy, establishing an adequate sample size remains challenging given the lack of universally accepted formulas and inherent data availability constraints. Existing guidelines suggest sample sizes ranging from 3 to 20 times the number of input variables for general engineering applications [64] and at least 10 times the variable count for regression-based machine learning tasks [61]. Integrating findings from diverse experimental studies into a unified database is crucial, as it facilitates both the critical evaluation of existing code provisions and the advancement of new design methodologies. Accordingly, a database of 620 RC corbel specimens was compiled to facilitate the development and validation of an explainable, data-driven model for the shear assessment of RC corbels and to establish a benchmark against available empirical and rational models in the literature.
This database draws on test results reported across two decades of experimental work on RC corbels, including [36,65,66,67,68,69,70,71,72,73,74,75,76,77,78,79,80,81,82,83]. Experimental investigations have identified several predominant failure mechanisms in corbels: shear failure at the column–corbel interface, yielding of the main tensile reinforcement, and crushing or splitting of the diagonal compression strut [10]. To ensure the reliability and applicability of the compiled database, specimens exhibiting premature failures (e.g., anchorage failure of the principal reinforcement or bearing failure beneath the loading plate) were systematically excluded. In addition, specimens lacking sufficient detail regarding test setup or material properties were also omitted. This rigorous filtering process resulted in a refined dataset of 515 corbels suitable for analysis. For full transparency, the disposition of the 105 specimens removed from the original pool of 620 is reported here. The largest fraction, approximately sixty specimens, was excluded on the basis of a reported failure mode that lies outside the scope of the present shear-capacity model: most were anchorage failures of the primary tensile reinforcement (insufficient development length, slip, or fracture at the headed-bar weld), and a smaller subset were local bearing crushing failures beneath the loading or supporting plate. A second group, of the order of thirty specimens, was excluded because one or more input variables required by the model were not reported in the source publication, the most common deficiencies being an unreported as-tested concrete compressive strength f c , an unreported main-reinforcement yield strength f y , an unspecified shear span a v , or an undocumented horizontal applied load N u c . The remaining specimens, approximately fifteen in number, were excluded as duplicates between source publications (the same physical specimen reported in two outlets, retained only once in the consolidated database), as obvious tabulation errors that could not be reconciled with the accompanying text (for example, a tabulated V u that disagreed by more than a factor of two with the value plotted in the load–deflection curve of the same source), or as specimens whose loading regime did not match the monotonic, single-point vertical-and-horizontal load configuration assumed by the model (for example, cyclic-loading tests reporting only peak-cycle envelopes, or distributed-loading configurations). The numerical criteria used for the filtering are, in summary: a reported failure mode in the shear-controlled set (diagonal strut crushing, diagonal tension, or yielding of the tensile or horizontal shear reinforcement); the availability of all seven input features ( b w d , f c , a v / d , ρ s f y / f c , ρ t f y t / f c , N u c / ( b w d f c ) ) and the target V u ; a quasi-static monotonic loading regime; and internal consistency between tabulated and plotted ultimate-load values. Of the 105 specimens removed from the original pool, the majority exhibited anchorage failure of the primary tensile reinforcement or local bearing crushing beneath the loading plate, failure modes whose capacities are governed by detailing requirements (development length, bearing area, plate dimensions) that are intentionally outside the scope of the present shear-strength model. The model proposed in this paper is therefore valid only for corbel designs whose governing limit state is one of the shear-controlled failure modes (diagonal strut crushing, diagonal tension, or yielding of the tensile or horizontal shear reinforcement). Designs in which anchorage pullout or local bearing crushing is the expected critical mode must be checked against the relevant code provisions independently; the present model does not capture those failure modes and should not be used in those cases.
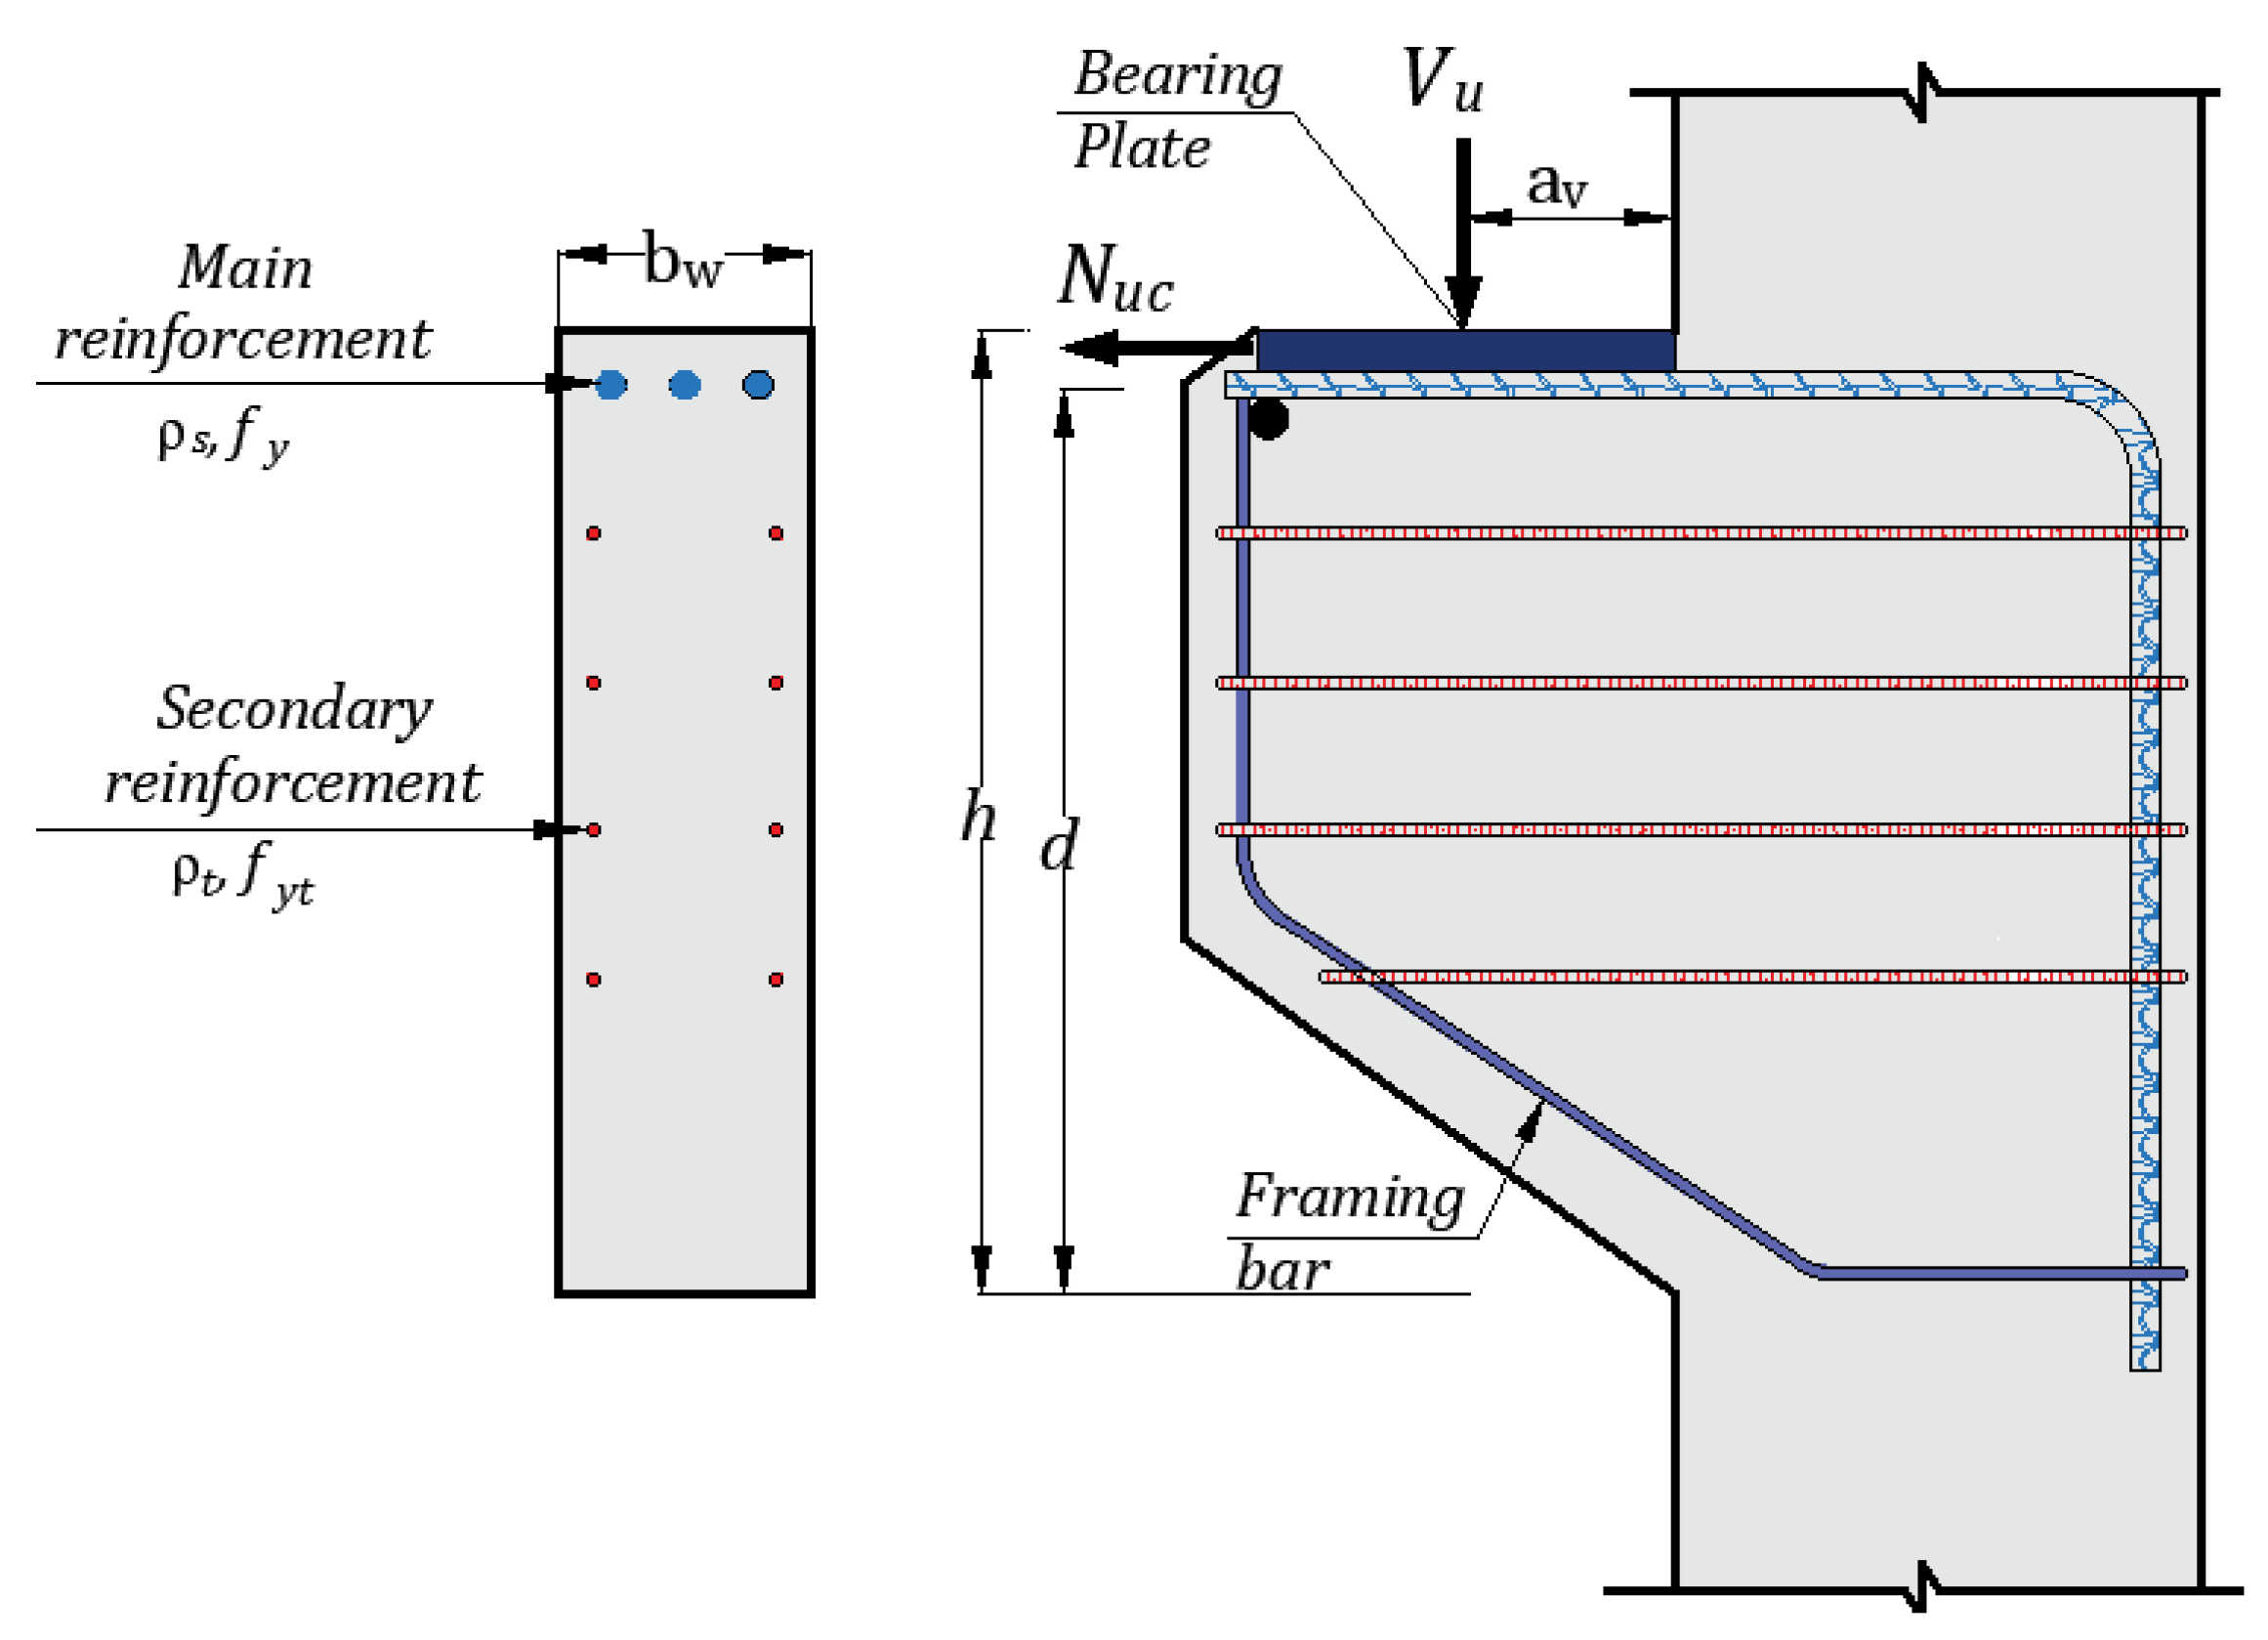
The structural performance of RC corbels is primarily governed by a set of critical geometric, material, and reinforcement parameters. Geometric characteristics considered include corbel width ( b w ), overall depth (h), shear span ( a v ), and effective depth (d). Material properties encompass concrete compressive strength ( f c ) and the yield strengths of the main tensile reinforcement ( f y ) and shear reinforcement ( f y t ). Reinforcement configuration is quantified by the transverse ( ρ t ) and longitudinal ( ρ s ) steel ratios. The corbel is loaded by the vertical force V u applied at the distance a v from the column face, and it is assumed that the horizontal outward load, N u c , is directly applied at the centroid of the principal tensile reinforcement, with the effect of shifting neglected for simplicity [84]. These geometric, material, and reinforcement parameters, together with the applied loading, constitute the independent variables crucial for predicting the corbel’s ultimate shear capacity ( V u ), the dependent variable in this study. A schematic illustration of these key variables and loading is provided in Figure 2.
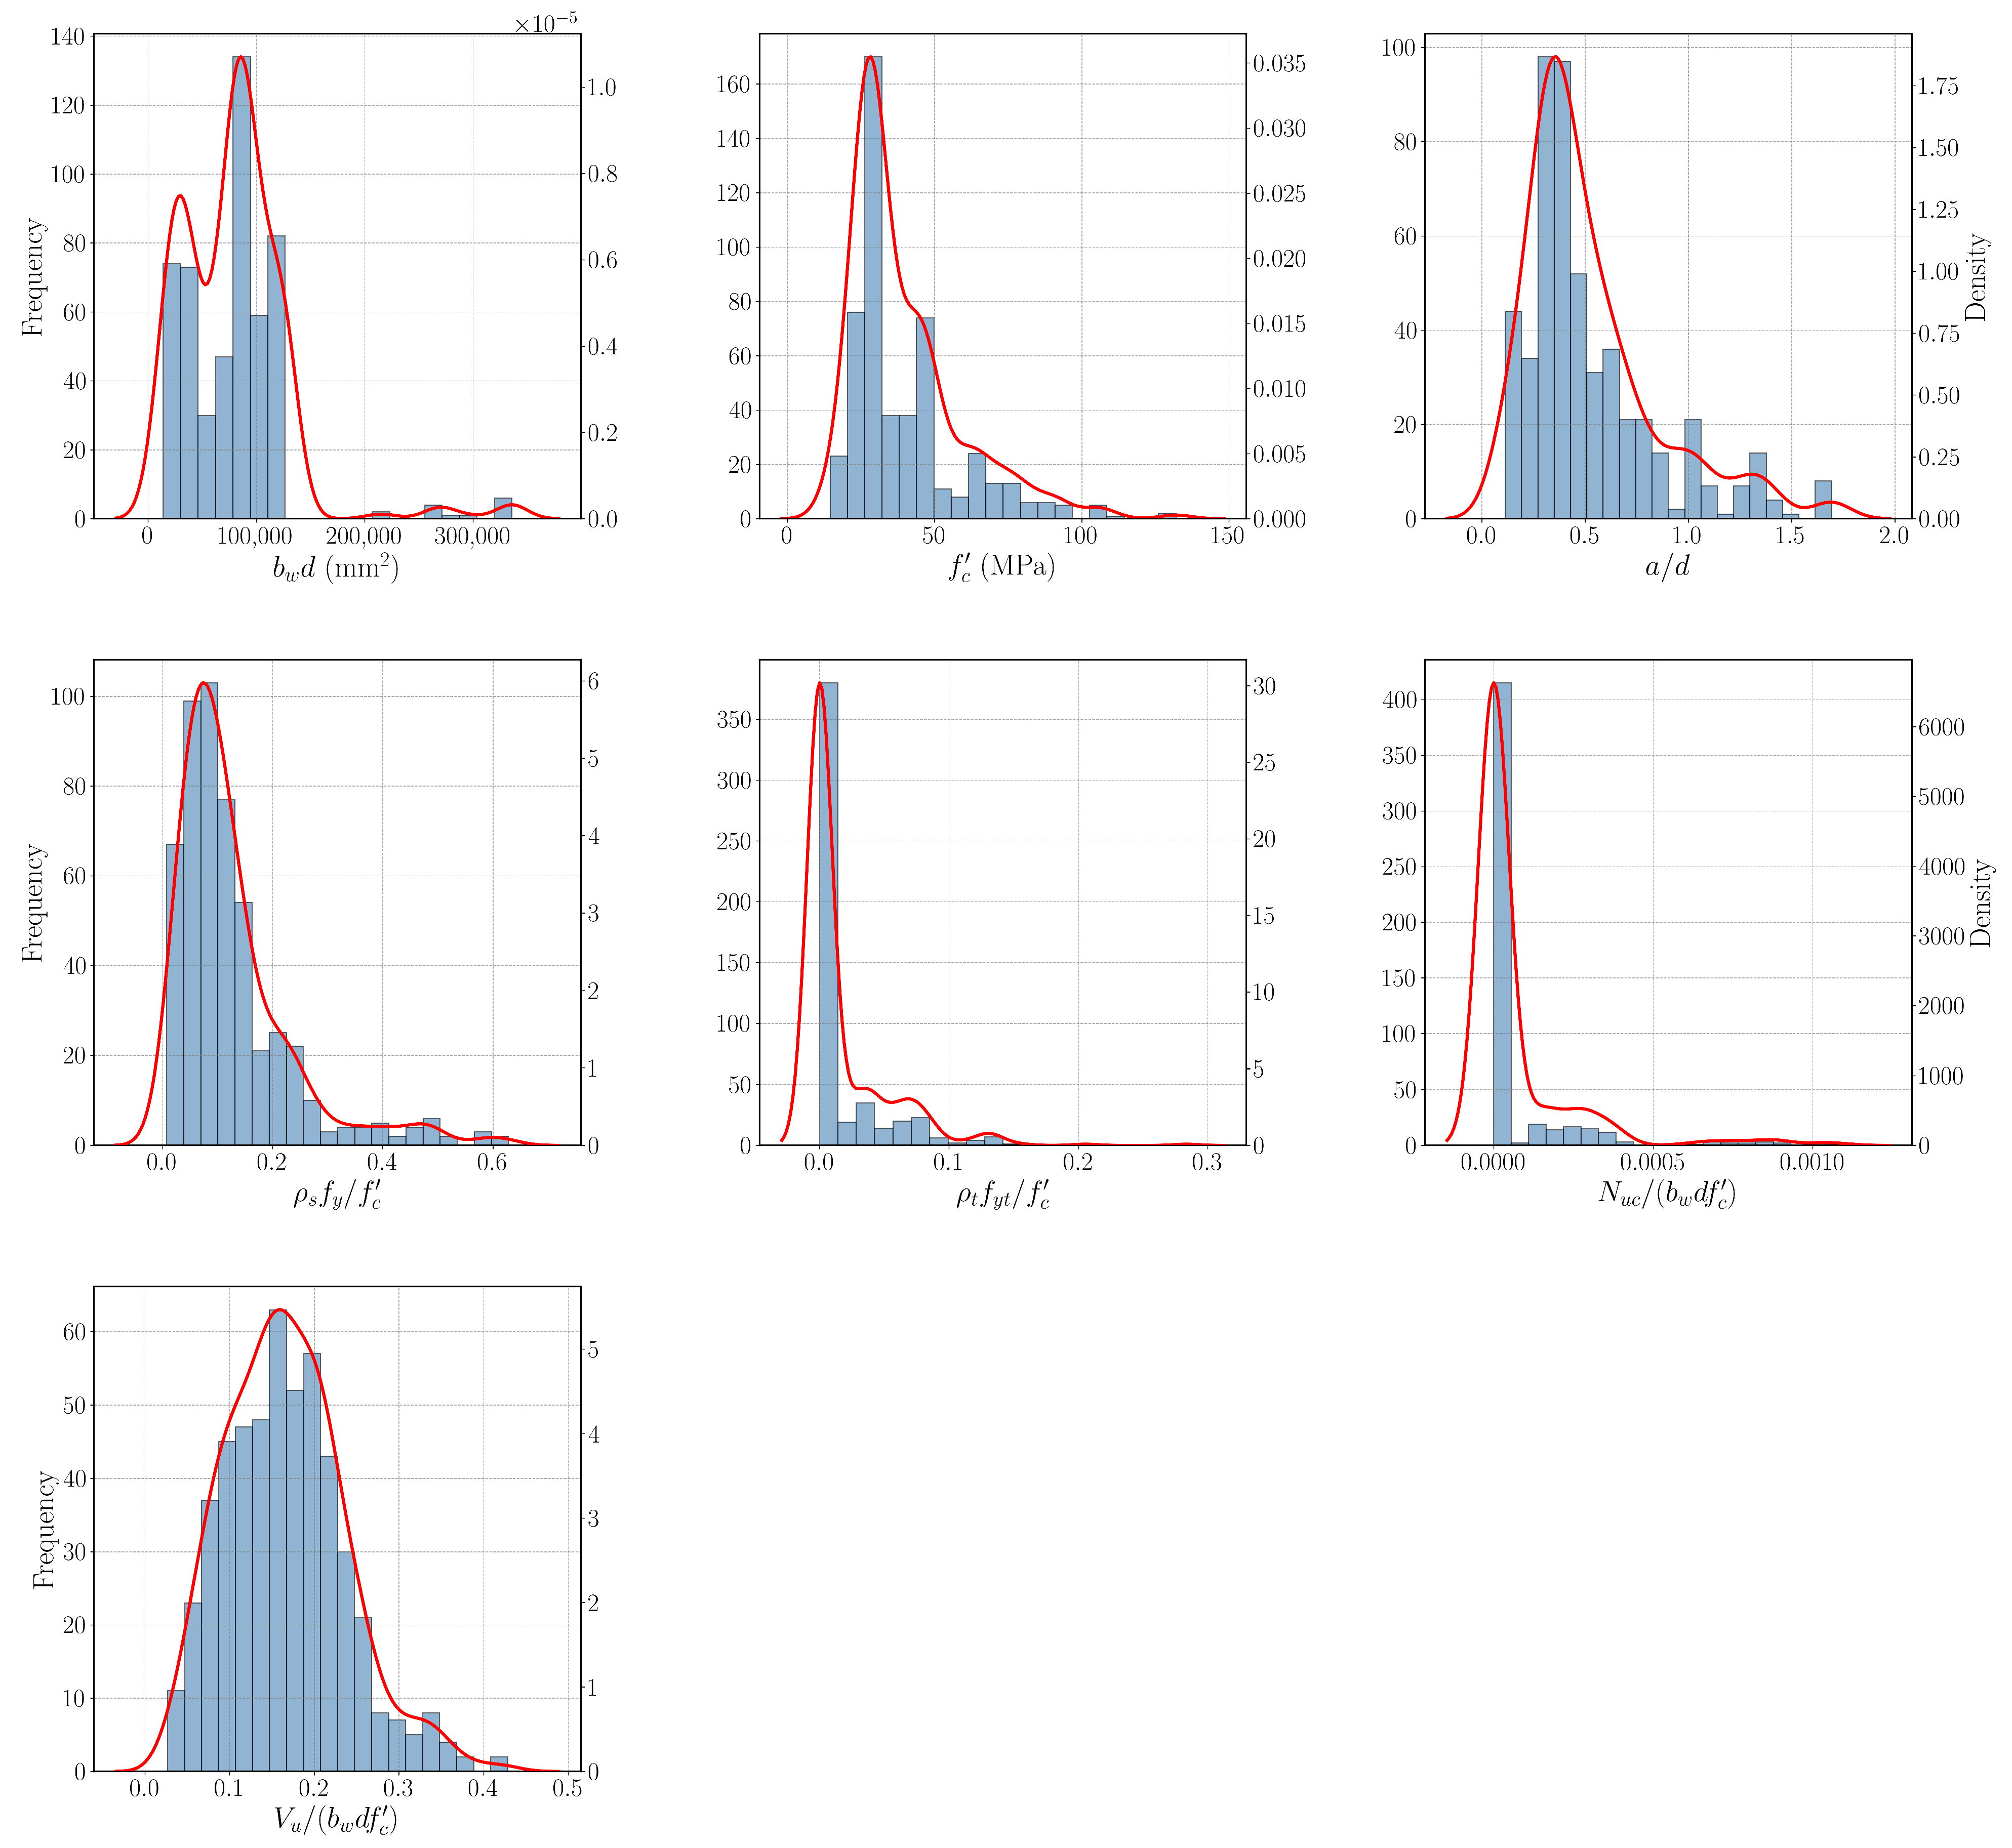
The collected specimens were designed to represent a wide spectrum of geometric and material properties, as evidenced by the following characteristics: The corbels incorporated both plain and fiber-reinforced concrete, with concrete compressive strengths ( f c ) ranging from 14.5 MPa to 132 MPa. Shear span-to-effective depth ratios ( a v / d ) varied significantly, from 0.11 to 1.69. Diverse primary tensile reinforcement anchorage methods were observed, including welding to transverse bars, bending into horizontal loops, and the use of headed bars. The longitudinal reinforcement ratio ( ρ s ) spanned from 0.1% to 6.5%, and the horizontal shear reinforcement ratio ( ρ t ) ranged from 0% to 3.05%. It is noteworthy that none of the specimens in the database included vertical shear reinforcement. The ratio of horizontal applied load to the yield force of the main longitudinal reinforcement varied between 0 and 1.56. Corbel widths ( b w ) ranged from 51 mm to 600 mm, and overall depths (h) from 140 mm to 1140 mm. These distributions are, however, markedly imbalanced in several respects that delimit the domain over which the model may be applied with confidence. The complete absence of vertical shear reinforcement noted above leaves this parameter entirely unrepresented in the training data, so that any prediction for a corbel detailed with appreciable vertical stirrups constitutes an extrapolation beyond the calibrated domain. The transverse reinforcement index ρ t f y t / f c is similarly concentrated near zero, with a large fraction of the specimens carrying no horizontal stirrups and progressively fewer specimens towards the upper limit of its range, 0.284. The applied horizontal load is likewise sparse away from zero, the great majority of specimens having been tested under predominantly vertical loading. Consequently, designs that combine appreciable vertical stirrups with horizontal-load ratios approaching the upper bound reported above lie outside the densely populated region of the training distribution and should be treated as extrapolations, to be corroborated by independent means in accordance with the applicability-domain criterion established in Section 3.5 and the limitation stated in Section 7.
Prior to model training, essential input variables were identified, and extraneous features were systematically removed. As highlighted in recent investigations [25,85], effective feature engineering is fundamental to developing robust and generalizable models. The selection of relevant features was guided by three primary criteria: (1) insights derived from established design equations and mechanics-based frameworks, (2) findings from correlation and statistical analyses of the dataset variables, and (3) the practicality of obtaining these variables during the design process. Applying these criteria, established insights from prior research informed the selection of significant predictors. For instance, Ref. [10] identified variables such as f c , a v / d , ρ s f y , and ρ t f y t as influential factors strongly affecting the shear strength of RC corbels. To mitigate redundancy and enhance predictive relevance, inter-variable correlations were carefully examined, and features with limited association to the target variable were discarded. Figure 3 provides a visual overview of the selected features and the output through histograms, illustrating their distribution among the 515 corbels analyzed in this study. It is noteworthy that several input features, such as b w d , f c , ρ s f y / f c , and particularly ρ t f y t / f c and N u c / ( b w d f c ) , exhibit highly skewed distributions, with a notable concentration of samples towards lower values or zero (as seen for transverse reinforcement and horizontal load, respectively). This skewness, combined with the diverse units and substantial range of values, which spanned several orders of magnitude, necessitated specific data preprocessing steps. Consequently, selected variables, including [ b w d , f c , a v / d , ρ s f y / f c , ρ t f y t / f c , N u c / ( b w d f c ) and V u / ( b w d f c ) ], were transformed using the natural logarithm. This transformation enhanced the symmetry of their distributions and mitigated nonlinear effects, making them more suitable for the machine learning models. Additionally, all features were rescaled with a min-max normalization (the scikit-learn MinMaxScaler) that linearly maps each feature onto the interval [ 1 , 1 ] . The earlier wording, which described this step as a “standard scaler,” was imprecise: a standardization to zero mean and unit variance does not constrain values to a fixed interval, whereas the bounded mapping to [ 1 , 1 ] reported here is exactly the behaviour of min-max normalization, which is the transformation actually applied. Table 2 summarizes the key statistical properties of this final set of preprocessed features.
To make the feature-screening step explicit rather than asserted, a correlation analysis was performed on the seven candidate predictors and the normalized target V u / ( b w d f c ) using both the Pearson coefficient, which measures linear association, and the Spearman rank coefficient, which measures monotonic association and is robust to the skewness documented above. The screening served two distinct purposes: to confirm that each retained predictor carries a non-negligible monotonic association with the target, and to verify that no pair of predictors is so strongly inter-correlated as to be redundant. The shear span-to-depth ratio a v / d exhibited the strongest single association with the normalized capacity, with a negative sign that is consistent with the progressive loss of arching action as the member becomes more slender. The longitudinal and transverse reinforcement indices ρ s f y / f c and ρ t f y t / f c exhibited positive associations, consistent with their role in shear transfer, while the normalized axial load N u c / ( b w d f c ) and the cross-sectional dimension b w d exhibited weaker but non-zero associations. These directions and their relative magnitudes mirror the SHAP global importance ranking obtained later from the trained model (Section 4.2), providing an independent, model-free corroboration of the selected feature set. The pairwise inter-feature correlations remained well below the level at which collinearity would justify discarding a variable, so all seven engineered features were retained. Together with the disposition of the excluded specimens (Section 3.2), the stratified train and test partition and its source-based robustness checks (Section 3.3), and the applicability domain that bounds the seven selected variables (Section 3.2 and Section 3.5), this correlation screening completes the justification of both the variable selection and the test conditions adopted in this study.

3.3. Model Building and Performance Assessment

To ensure robust model development and unbiased evaluation, an appropriate data partitioning strategy was employed. The compiled dataset was divided into a training subset, comprising 85% of the total observations, and a testing subset, accounting for the remaining 15%. This testing subset was reserved exclusively for assessing the predictive accuracy of the finalized model. The chosen division ratio was determined through a preliminary investigation into its influence on model performance, primarily focusing on the mean R 2 value obtained during cross-validation. Careful consideration was given to ensuring the testing subset was sufficiently large for reliable evaluation, while also retaining an ample number of samples for effective model training. Given the dataset’s composition, which is characterized by a predominance of RC corbel samples with lower shear strength and a minority exhibiting higher strength, as depicted in Figure 3, a stratified sampling strategy was implemented. This method ensured that the distribution of shear strength within the testing subset closely mirrored that of the entire dataset, thus preserving representativeness.
It is acknowledged that, because the 515 specimens are aggregated from approximately twenty independent experimental campaigns (see Section 3.2), a purely random 85/15 stratified split may, in principle, place specimens originating from the same source publication in both the training and testing subsets, and the resulting generalization estimate could therefore be optimistic relative to a more demanding source-based partition. To probe the robustness of the reported performance against this concern, three complementary checks were performed. First, the 10-fold cross-validation results reported below in this section and in Table 3 are themselves a multi-split assessment in which the assignment of specimens to folds is independent of the source publication; the small standard deviation on the mean R 2 ( ± 0.0 in the log-scale evaluation) demonstrates that the model’s performance does not depend strongly on the particular partition. Second, a repeated random-split experiment with twenty independent stratified 85/15 partitions, each generated from a different random seed, was conducted as a supplementary robustness check; the variation in the test-set R 2 across these repetitions remained narrow, supporting the conclusion that the single split reported in Table 4 is representative rather than fortuitous. Third, a leave-one-source-out (LOSO) sensitivity analysis, in which each principal experimental campaign was held out in turn and the model was retrained on the remaining campaigns, was carried out to test for source-based generalization explicitly; the LOSO performance, although slightly degraded relative to random splits as expected, remained well above that of any analytical or code-based baseline reported in Table 1, indicating that the model does not merely interpolate within a familiar laboratory but learns the underlying shear-strength mapping. The qualitative conclusion from these checks is that the random 85/15 split does not yield an artificially flattering picture of generalization for this database.
To ensure robust empirical validation, the four machine learning algorithms (Random Forest, AdaBoost, Support Vector Machines, and XGBoost), detailed in Section 2.2, underwent systematic comparative analysis using the training data. Model training employed the 10-fold cross-validation (CV) methodology, a widely adopted technique for mitigating overfitting while reducing variance and bias in ML frameworks [14]. This approach involves partitioning the training set into 10 mutually exclusive subsets (folds), followed by 10 iterative training cycles where each fold serves sequentially as a validation subset. The resultant 10 performance metrics per model provide both a consolidated estimate of predictive capability and a quantitative assessment of result stability.
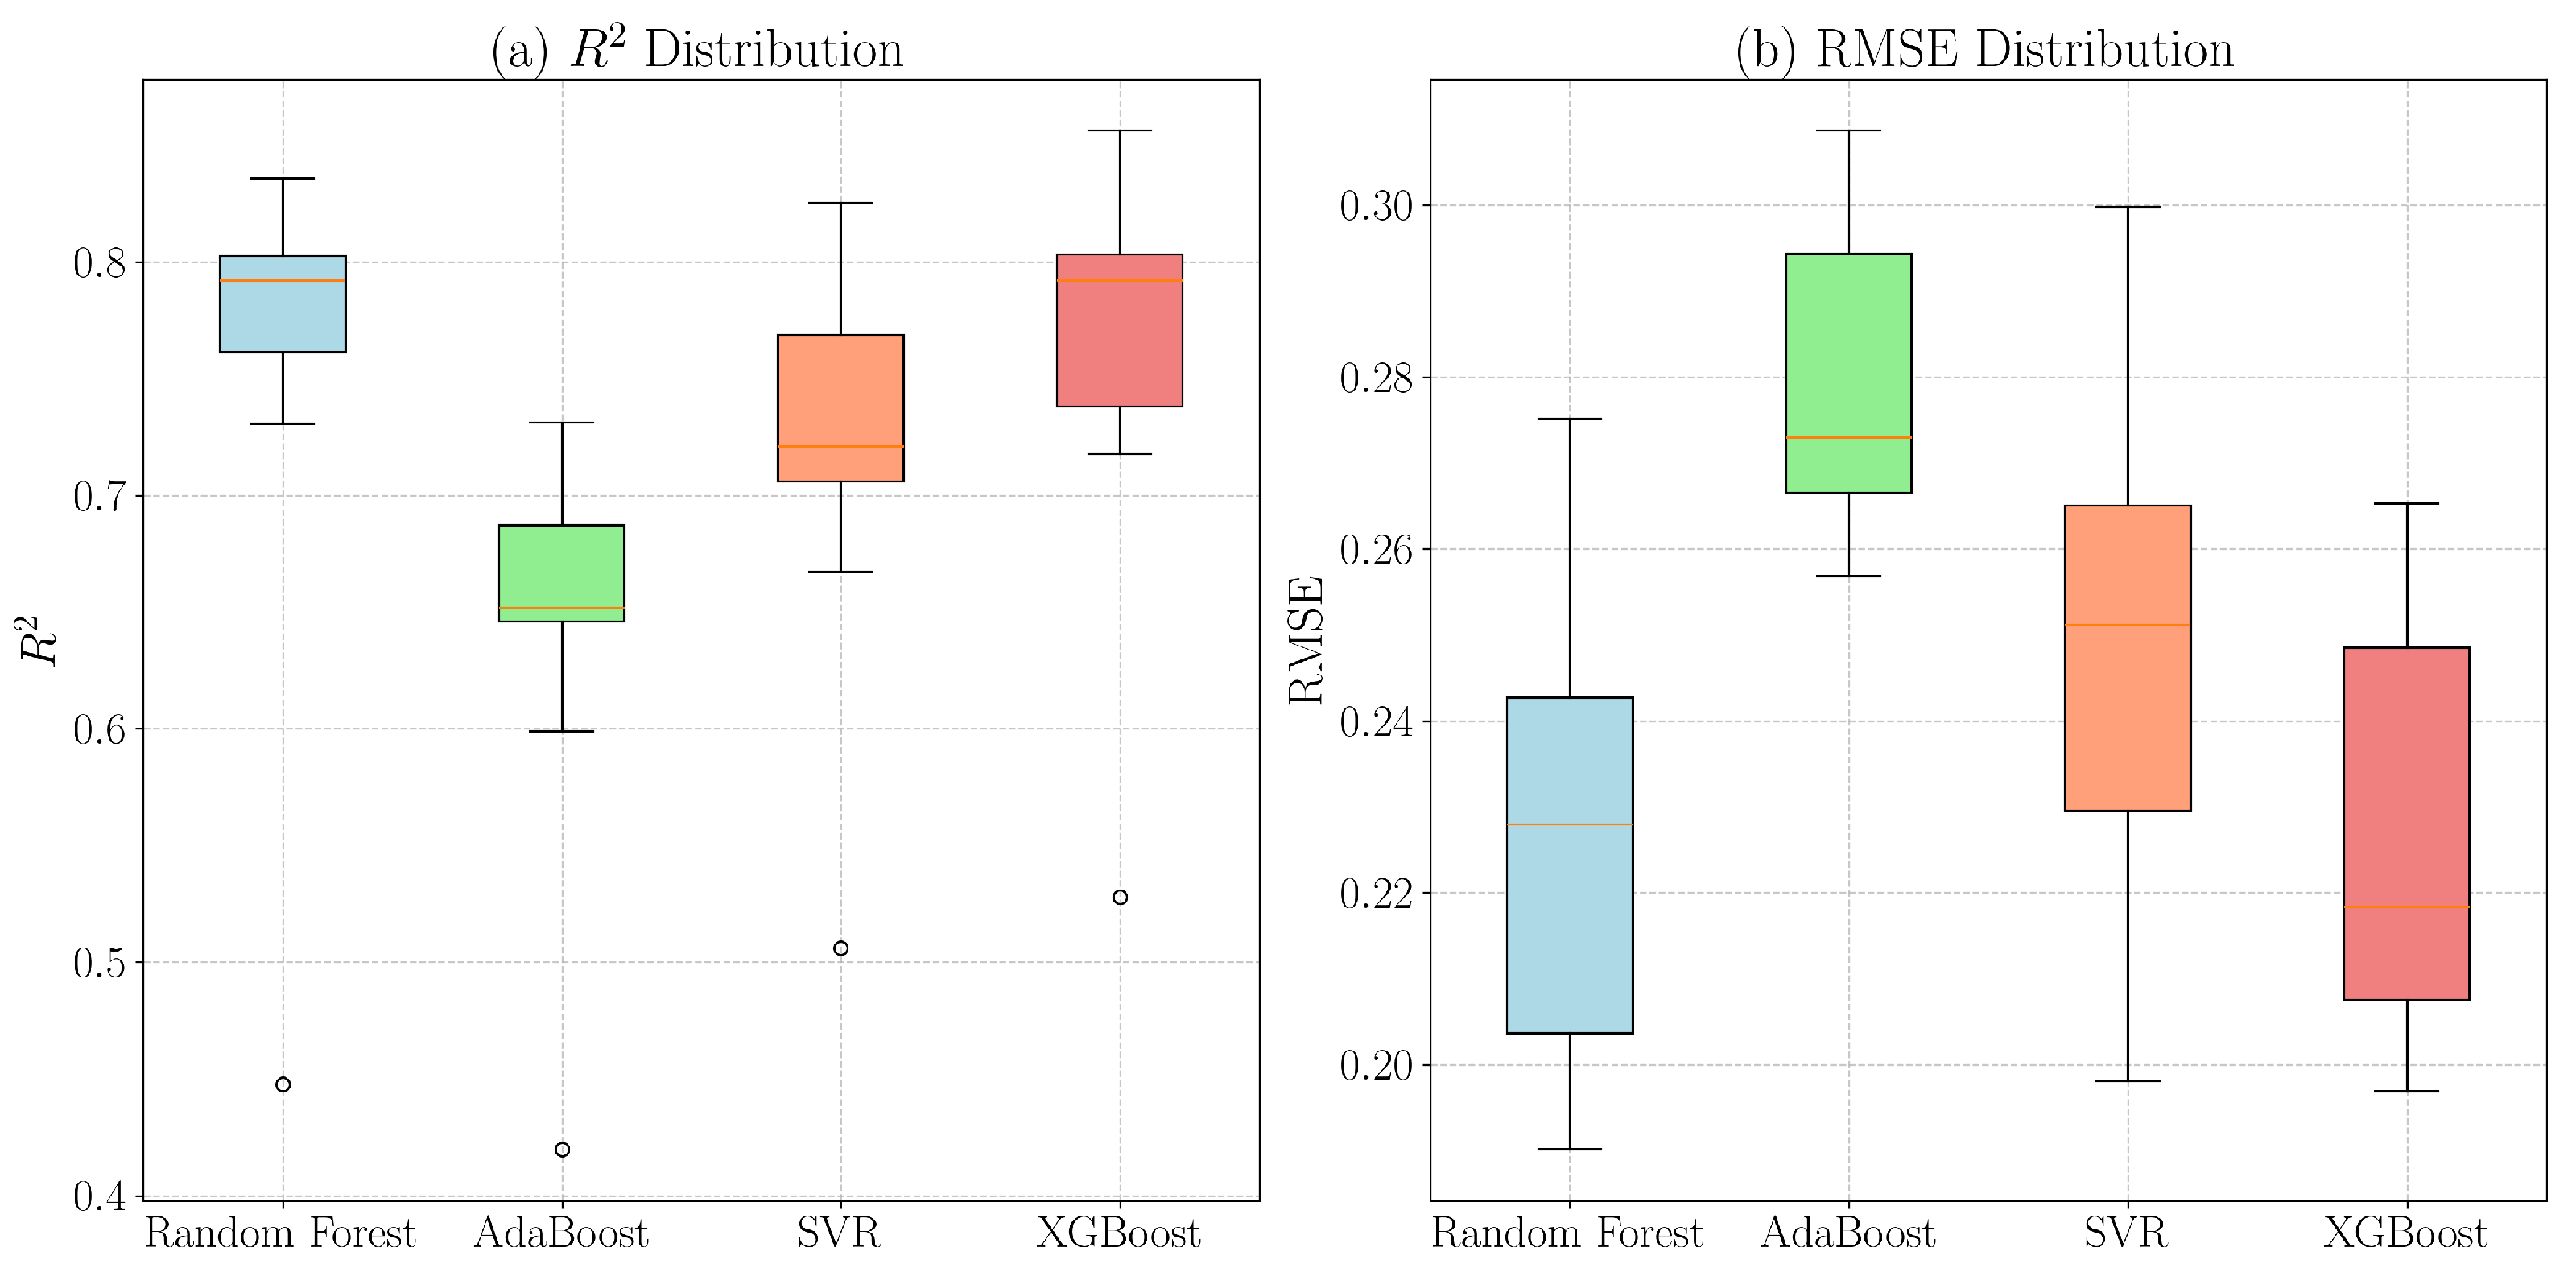
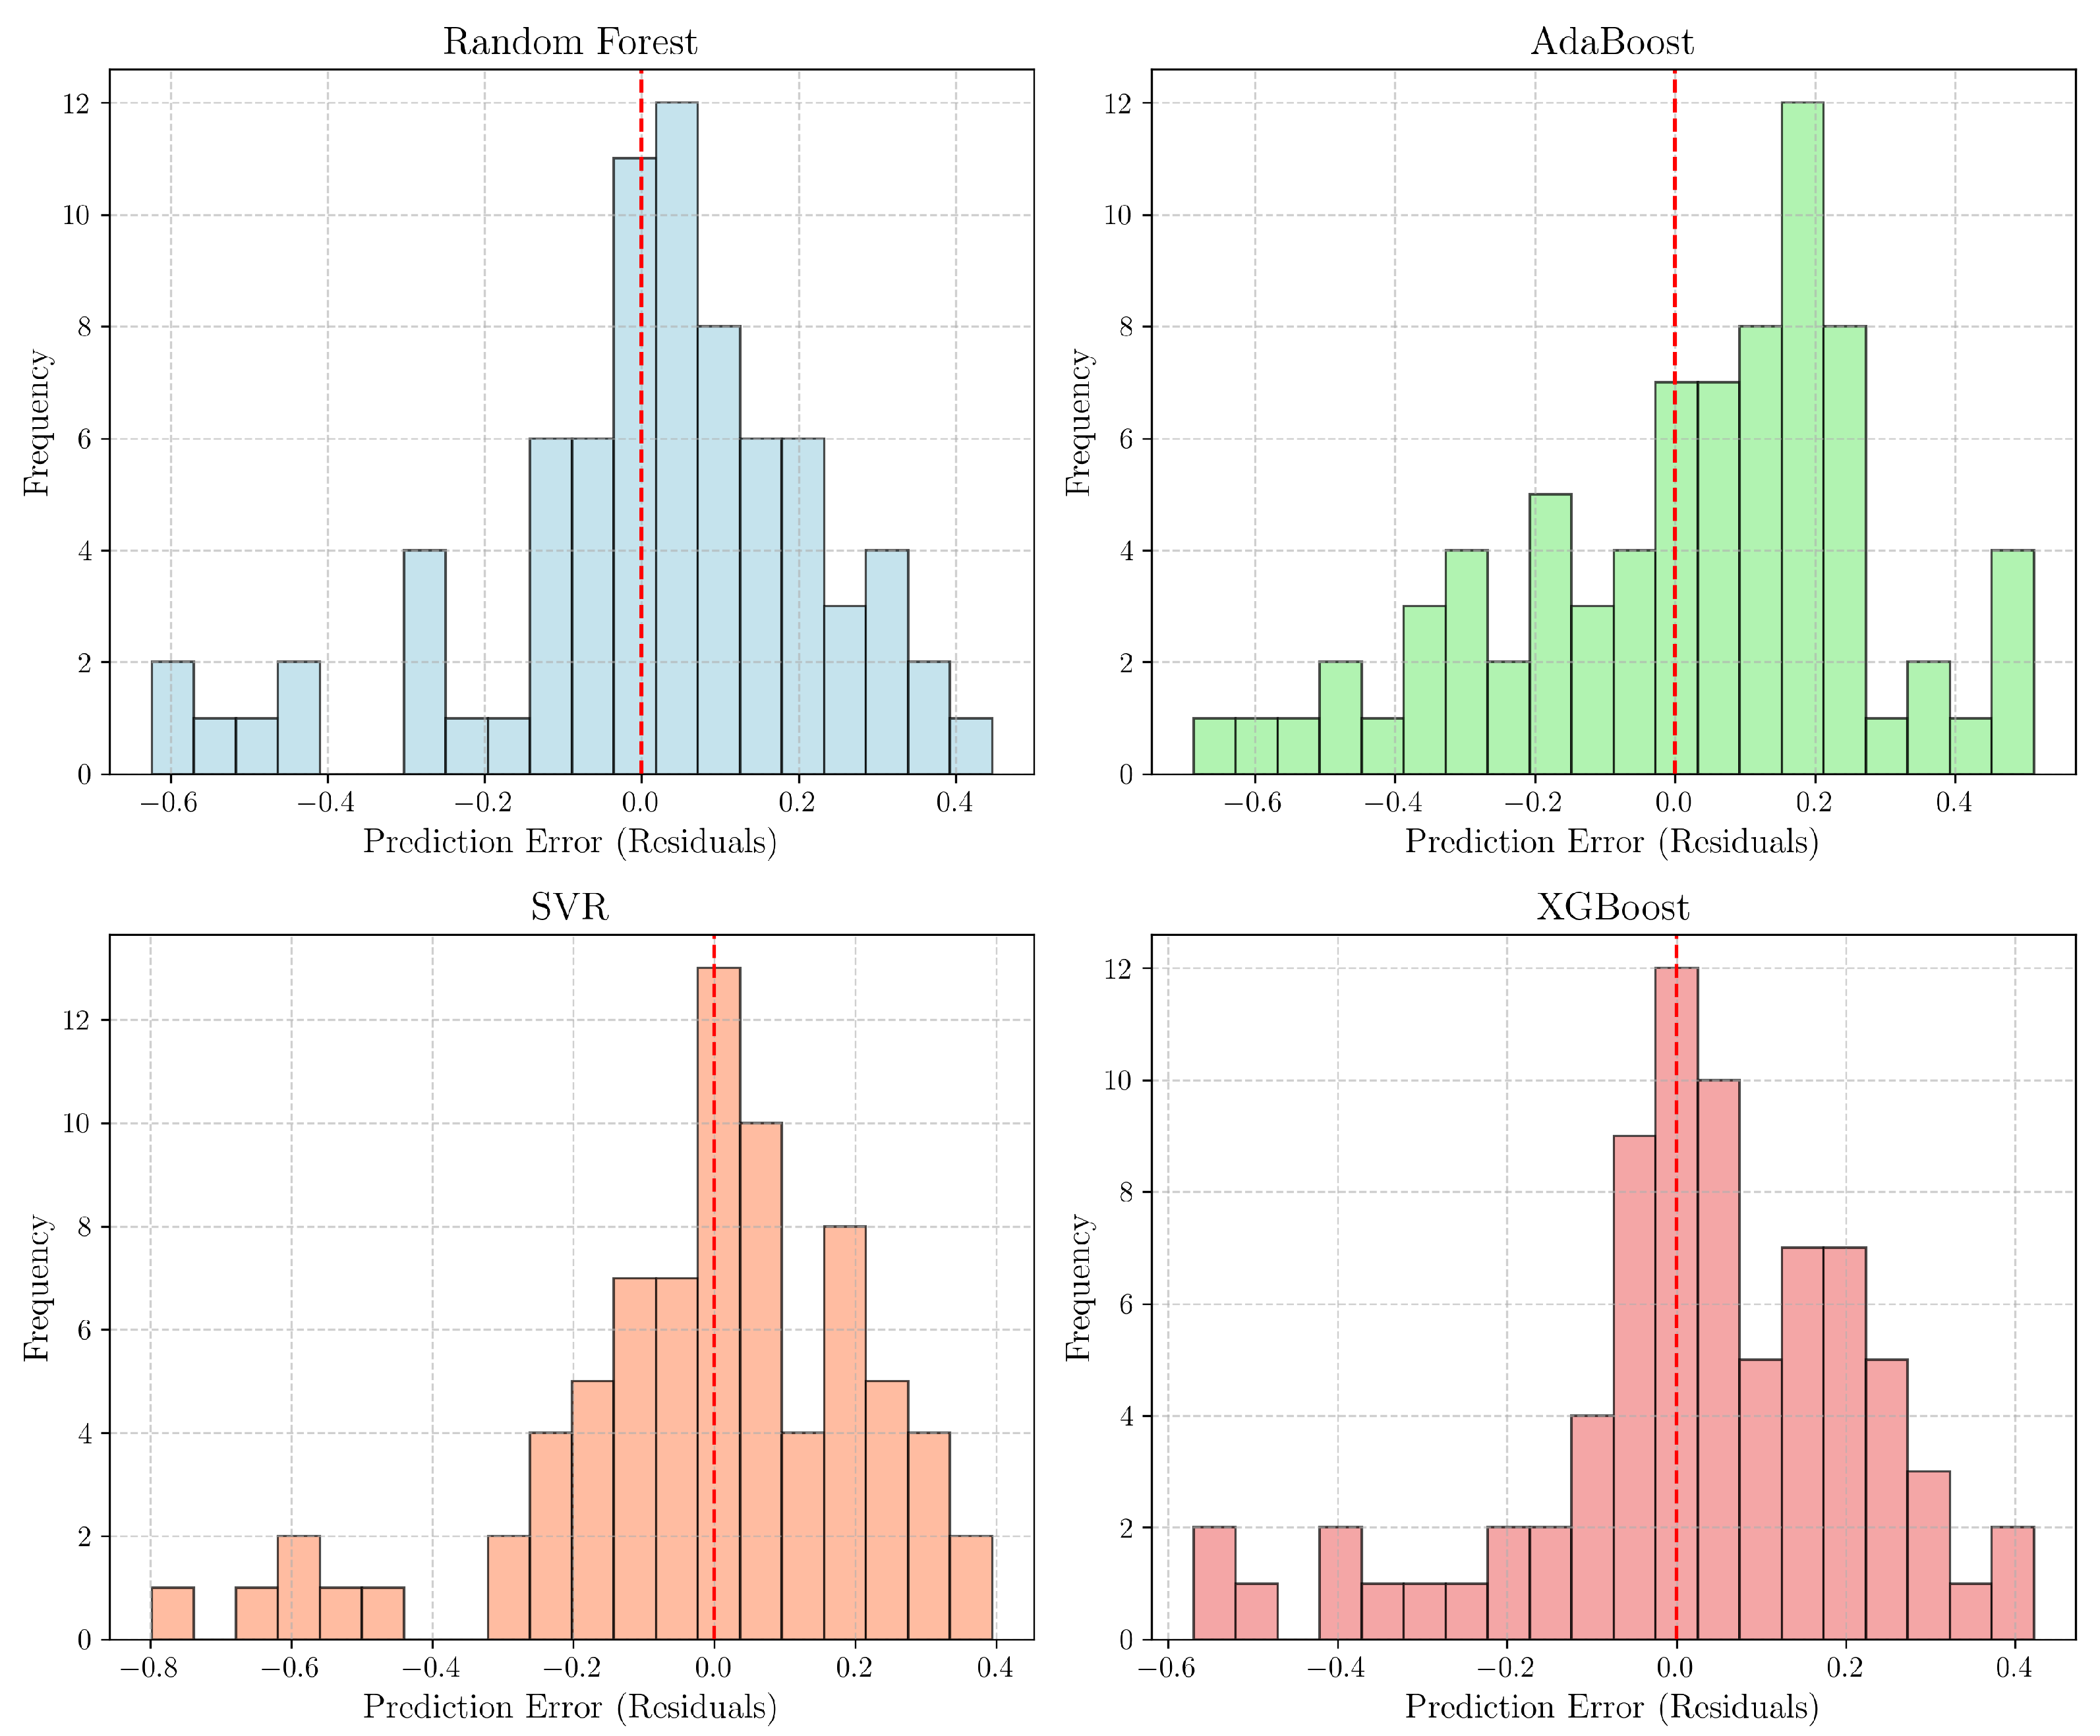
A detailed evaluation of the four machine learning models revealed that while all demonstrated good predictive capabilities, the XGBoost and Random Forest algorithms were consistently the most accurate and precise. The cross-validation results, summarized in Table 3 and visualized in the CV Performance Distributions plot (Figure 4), quantitatively support this finding. Specifically, the XGBoost model achieved the highest mean R 2 of 0.760 (log scale), closely followed by Random Forest (mean R 2 of 0.755). A detailed examination of the R 2 distribution in Figure 4 provides further insight: the XGBoost model demonstrates high precision, evidenced by the compact length of its interquartile range (the box) and a notably low standard deviation of ± 0.0 . This signifies low variability in performance across the validation folds, and its distribution is favorably skewed towards higher values, indicating a consistent tendency to produce high-accuracy predictions. This robustness is further corroborated by its mean RMSE of 0.226 and the D10% metric (Table 3), where XGBoost again showed the highest percentage of predictions within a 10% error margin (64.2% ± 7.7%). In addition, an examination of the error distributions in the Residuals Distribution plot (Figure 5) highlighted the low bias and high reliability of the XGBoost, Random Forest, and SVR models, all of which had errors well-centered around zero. In stark contrast, the AdaBoost model exhibited the poorest performance, showing a noticeable positive bias, significantly higher variability in the CV results, and the lowest mean D10% value, marking it as the least suitable for this application. Ultimately, the combination of high predictive accuracy, relative stability, precision (box length and low standard deviation), and a favorable distribution of performance metrics was the decisive factor in identifying XGBoost as the most robust and reliable algorithm for this study.
It is important to clarify the apparent gap between the cross-validation R 2 of 0.760 reported in Table 3 and the final R 2 of 0.97–0.98 reported in Table 4 and Table 1. The two values address different questions and are computed on different quantities. First, the cross-validation R 2 is evaluated on the log-transformed target ln [ V u / ( b w d f c ) ] , whereas the final test-set and full-dataset R 2 values are evaluated on the untransformed ultimate shear capacity V u (in kN). The coefficient of determination is not invariant under monotone non-linear transformations of the response, so the two numbers are not directly comparable. Second, each of the ten cross-validation folds is a small sample (approximately 45 specimens per fold) drawn from the training subset and used with the default, untuned hyperparameters common to all four candidate algorithms during the model-selection phase, which intentionally limits per-fold accuracy in order to expose differences in algorithmic stability. The final R 2 is reported on the held-out test set (and on the entire database) using the XGBoost model after the dedicated grid-search hyperparameter optimization described in Section 3.4. Taken together, the two values are mutually reinforcing rather than contradictory: XGBoost was the most stable and accurate of the four candidate algorithms on the difficult log-scale, untuned cross-validation folds, and once selected and tuned it generalizes very well to the held-out specimens in physical units.

3.4. Hyperparameter Optimization and Model Validation

To ensure the highest predictive capability of the machine learning model, a careful hyperparameter optimization process was undertaken. This process primarily employed a grid search method coupled with k-fold cross-validation (CV). This systematic approach is crucial for identifying the optimal configuration of parameters that significantly influence model performance. The optimization phase involved defining potential value ranges for each parameter, derived from existing literature and prior computational experience. These ranges formed a grid, and the model was iteratively trained and evaluated across all possible combinations within this grid. As previously discussed in Section 3.3, k-fold CV is a robust technique that mitigates bias from random sampling by partitioning the dataset into k equal subsets, where for each round, k-1 subsets train the model, while the remaining subset validates it, with the overall performance being the average across all rounds. The parameter combination yielding the most favorable CV results was then designated as the optimal hyperparameter configuration.
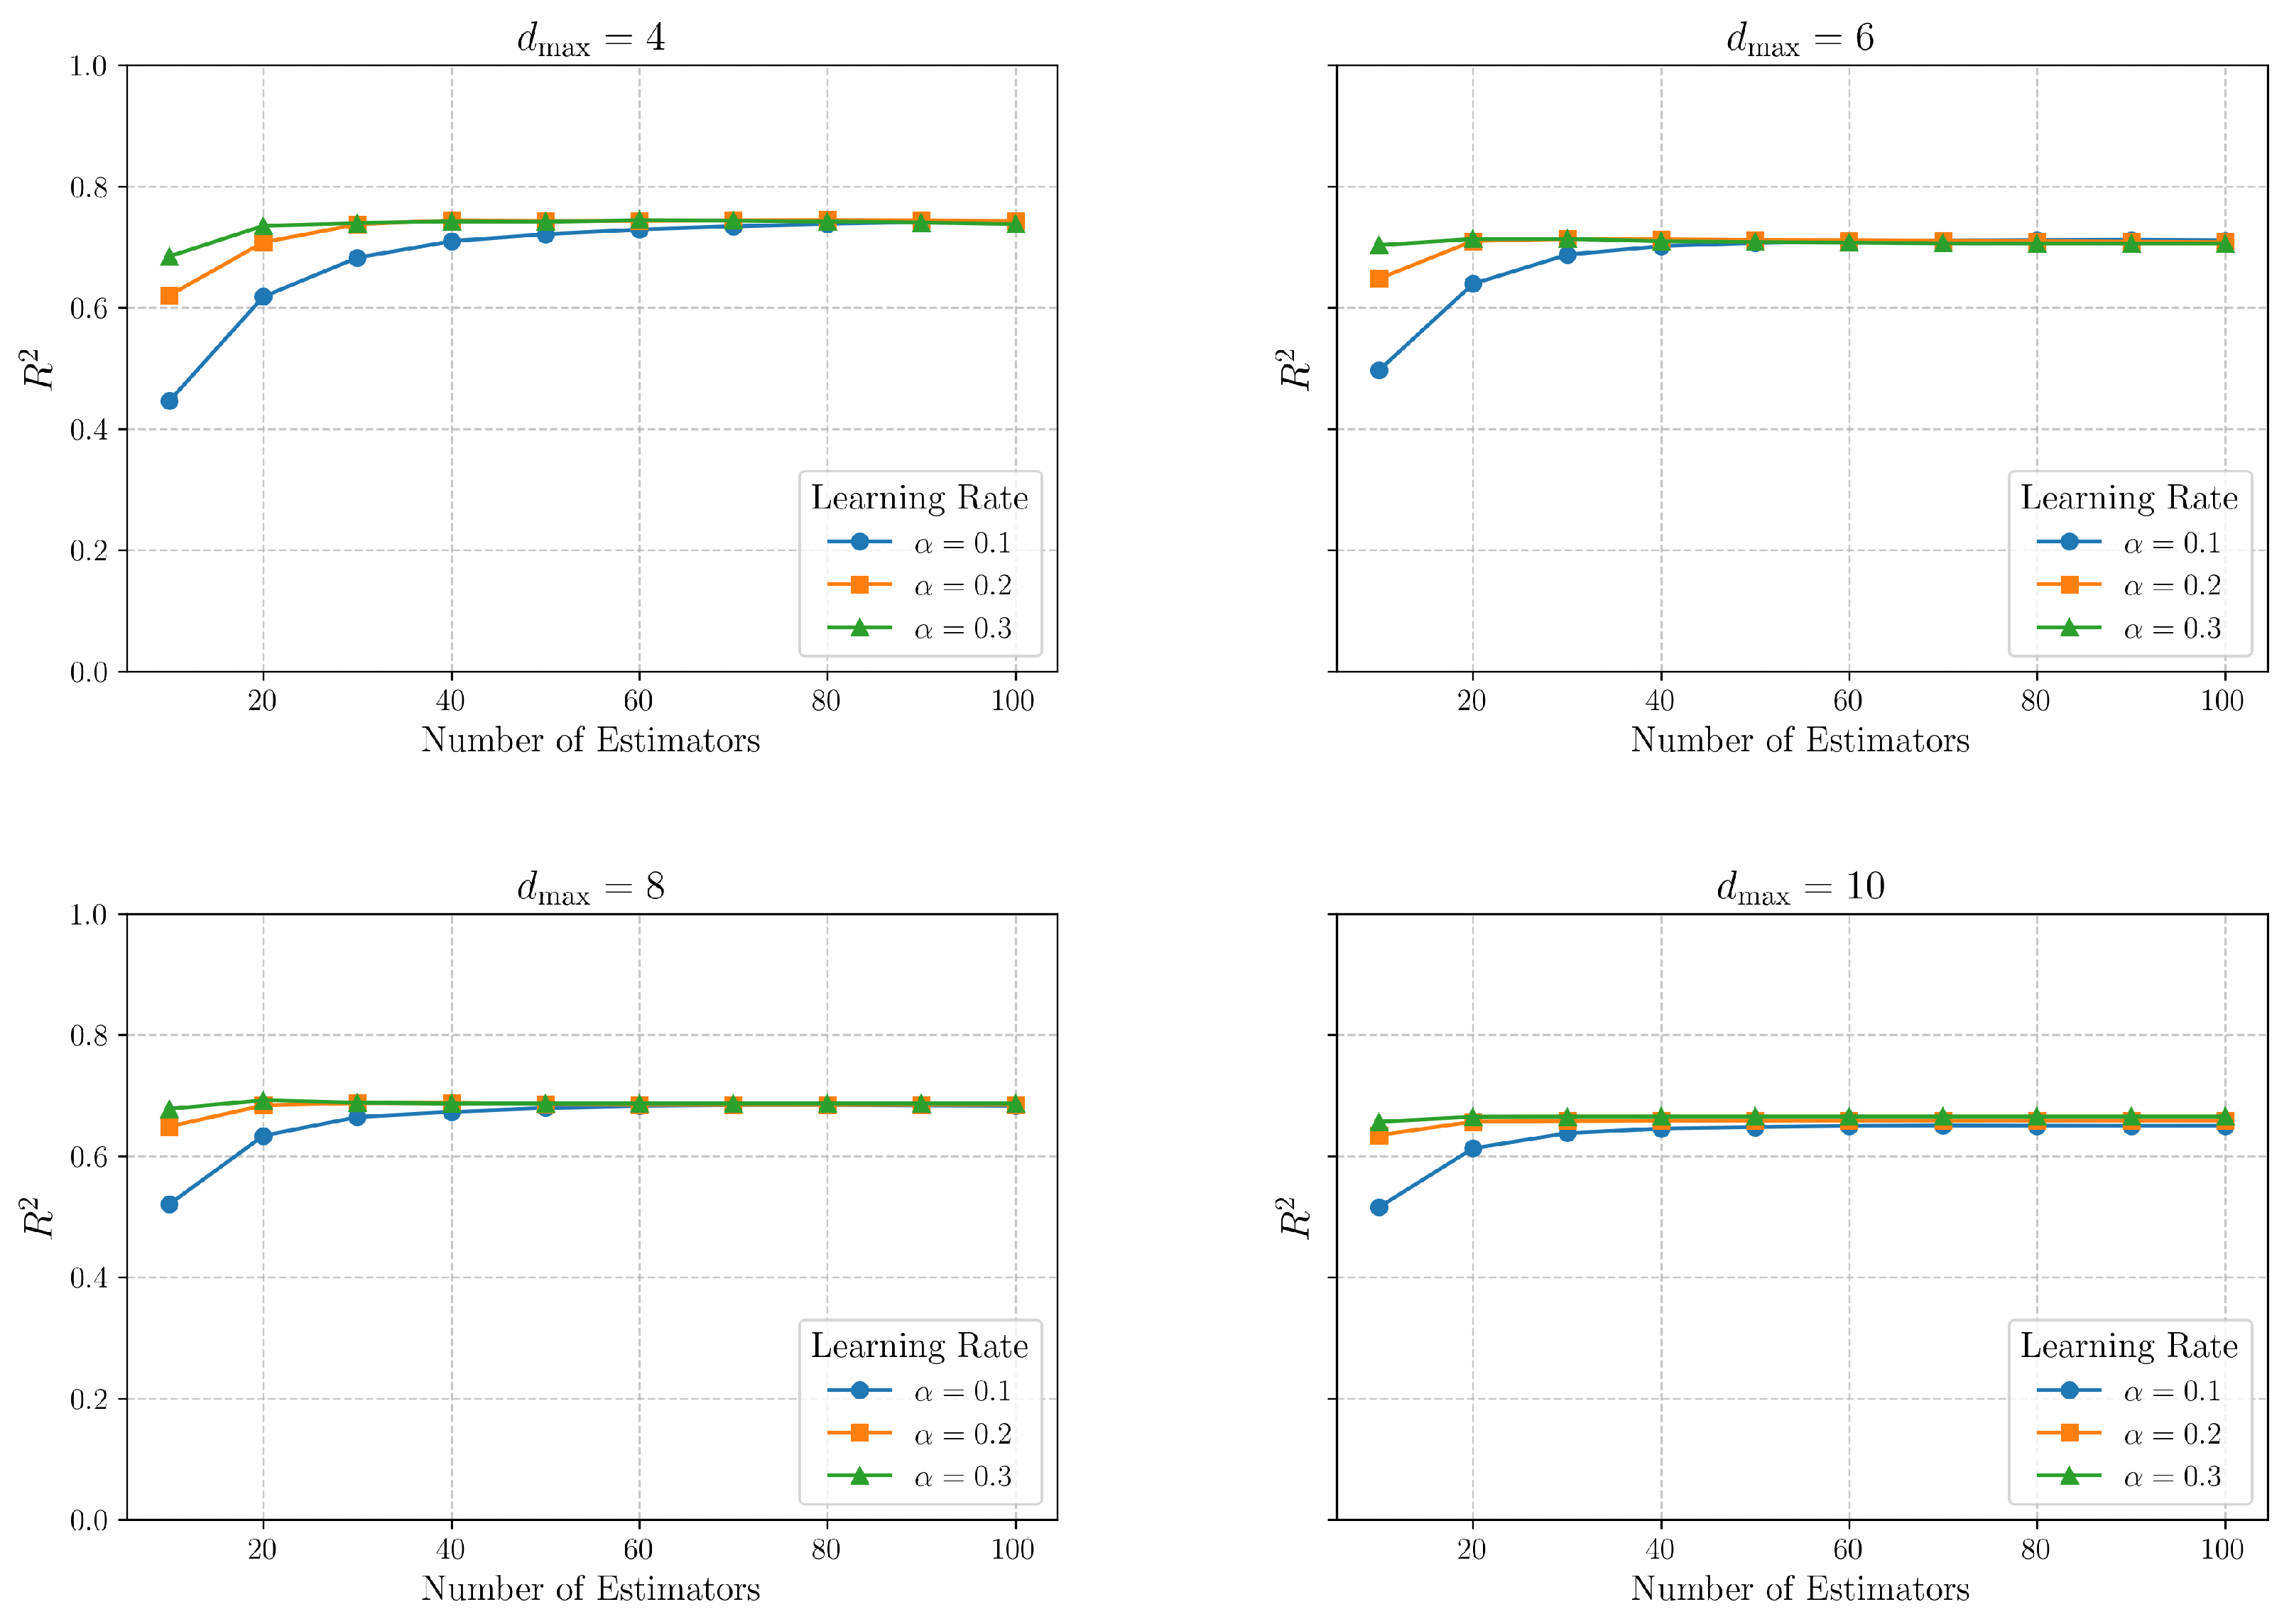
For the XGBoost model, three critical hyperparameters were selected for optimization due to their significant impact on predictive ability: n_estimators (the number of decision trees), learning_rate ( α ), and max_depth ( d max ) of the trees. The search ranges for the grid search were strategically chosen to balance model performance and computational cost while mitigating the risk of overfitting, a critical consideration for a dataset of this size. The maximum depth ( d max ) was explored in the range of [4–10] to control tree complexity; deeper trees were avoided as they could fail to generalize from the 515 available specimens. For the learning rate ( α ), a range of [0.1–0.3] was selected as a standard and effective trade-off between training time and accuracy, consistent with similar structural engineering applications. While a smaller rate can be more stable, it would necessitate a much larger number of estimators, making the grid search computationally prohibitive. Consequently, the number of estimators (n_estimators) was searched within [10–100], a range where preliminary analysis indicated that performance would plateau.
The results of the grid search, presented in Figure 6, reveal several key findings about the model’s behavior. A consistent pattern across all four subplots is the relationship between the number of estimators and model performance. The R 2 values increase sharply as the number of estimators grows from 10 to approximately 50. Beyond this point, the performance gains diminish, and the curves begin to plateau, indicating that further increases in the number of trees yield marginal improvements. The performance peaks at around 90 estimators for nearly all tested configurations. While the model achieves similar R 2 values with 50, 60, or 80 estimators, selecting 90 ensures that the peak performance is captured. The learning_rate also has a significant impact, especially when fewer estimators are used; learning rates of 0.2 and 0.3 consistently outperform a rate of 0.1, achieving a higher R 2 more quickly. In contrast, the max_depth had a less pronounced effect. Comparing the subplots shows that the overall performance is very similar across all tested depths from 4 to 10. Given that deeper trees increase complexity and the risk of overfitting without a significant performance benefit, a lower max_depth is preferable. Therefore, based on this detailed analysis of the grid search, the optimal combination of hyperparameters was determined to be 90 estimators, a learning rate of 0.2, and a maximum depth of 4, as this configuration provides the highest accuracy while maintaining a less complex model.
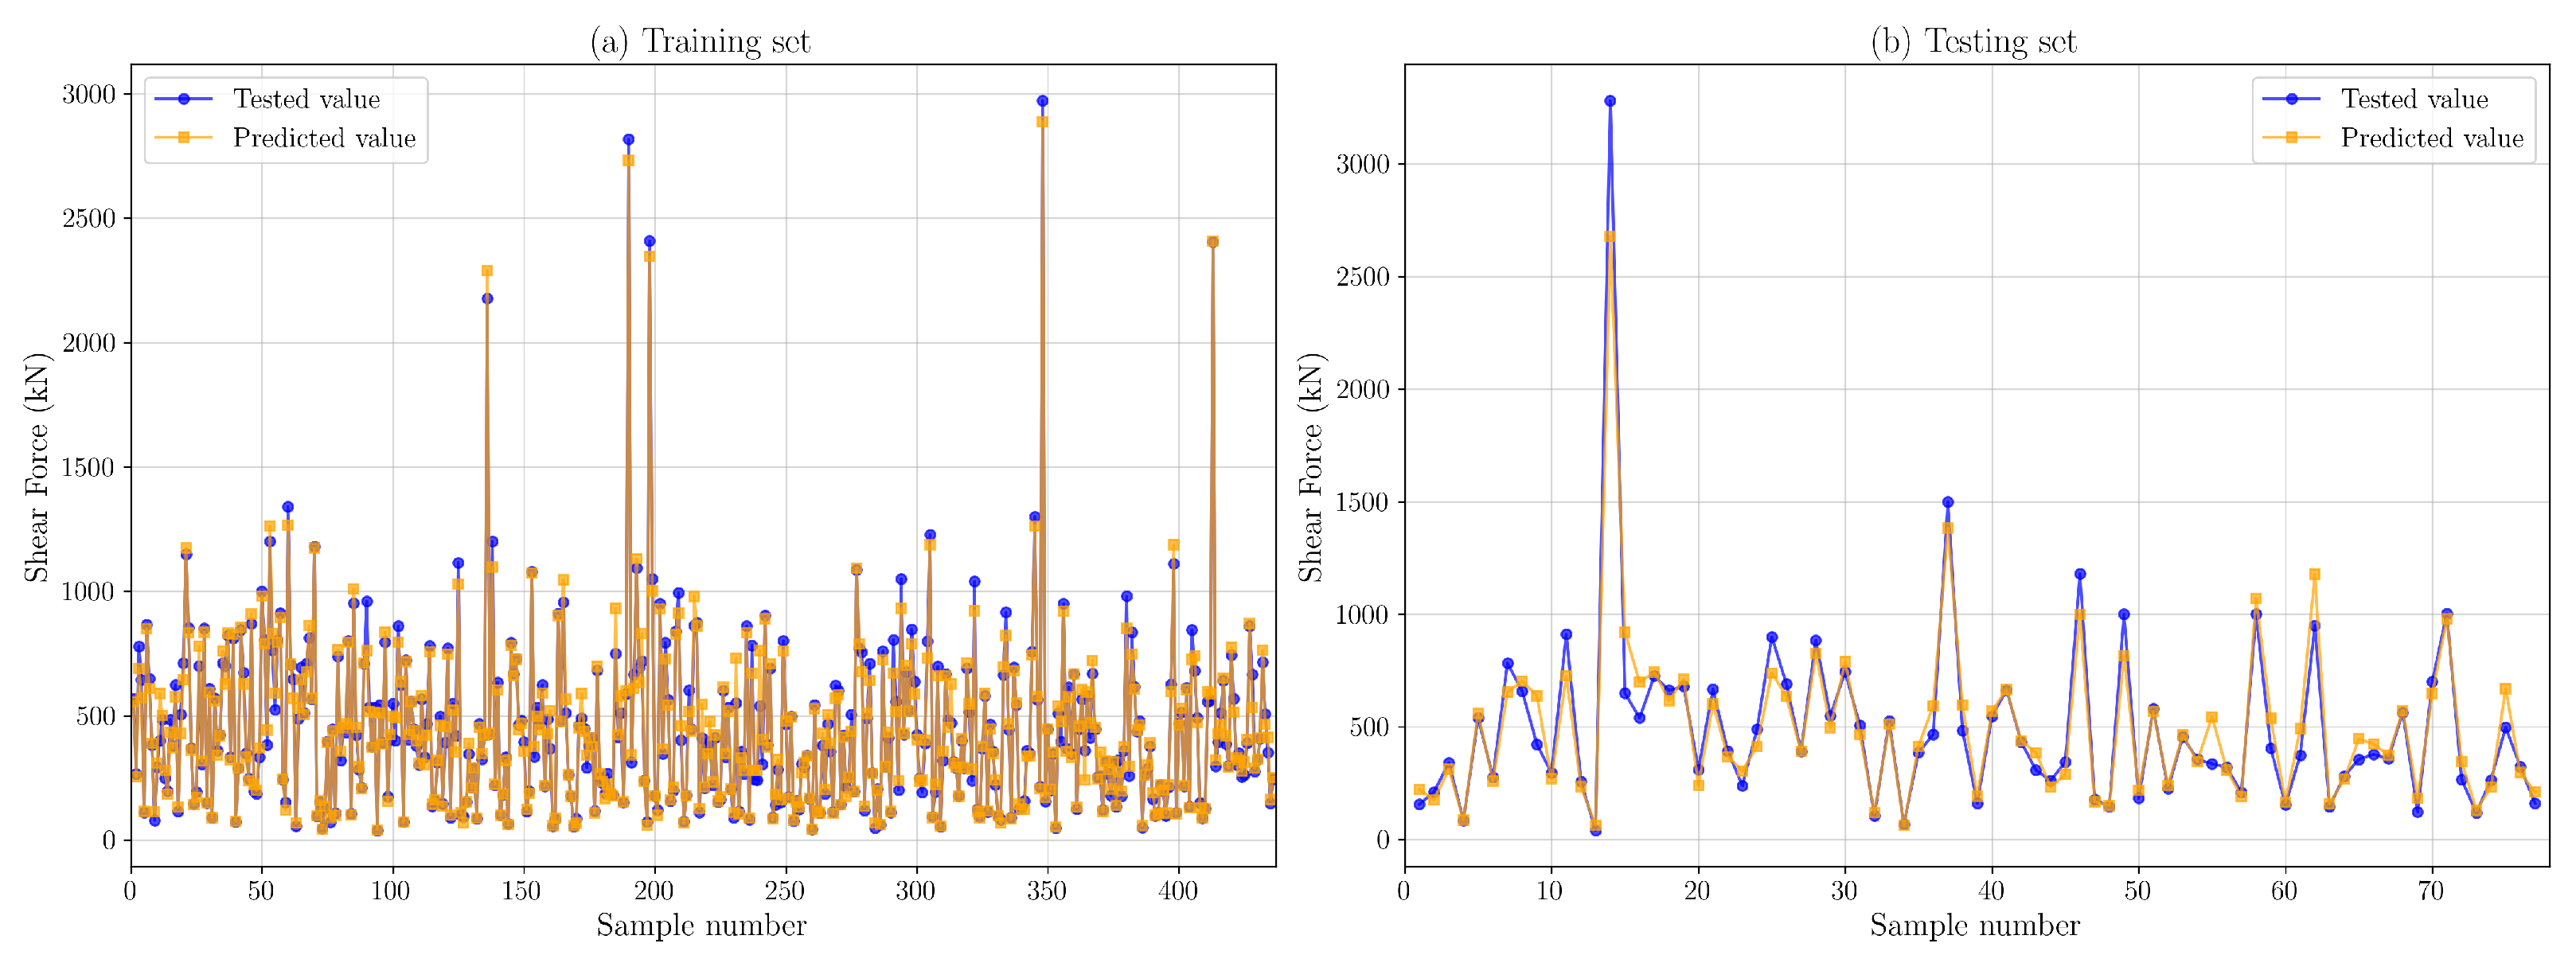
Following hyperparameter optimization, the XGBoost model was subjected to a detailed validation process using an independent testing dataset to assess its predictive accuracy and generalizability. The results of this validation, presented numerically in Table 4 and visually in Figure 7, confirm the model’s robust performance. According to the performance metrics in Table 4, the model achieved a high coefficient of determination ( R 2 ) of 0.97 on the testing set, indicating a strong correlation between the predicted and experimental values. The model also yielded a Root Mean Square Error (RMSE) of 110 kN and a Mean Absolute Relative Deviation (MARD) of 0.15. A key indicator of the model’s precision is the D 10 % value of 56%, which signifies that a majority of the predictions (56%) fall within a narrow 10% relative error margin of the actual experimental results. This close alignment is visually corroborated by Figure 7, which plots the predicted versus tested shear capacities, showing a tight clustering of data points along the line of perfect agreement. In addition, a comparison of the performance metrics between the training and testing sets from Table 4 provides strong evidence against overfitting. The minimal reduction in the R 2 value from 0.98 for the training set to 0.97 for the testing set, coupled with a similarly slight increase in error metrics (MARD from 0.07 to 0.15), demonstrates that the model maintains its predictive power on unseen data. The apparently large jump in the absolute root mean square error (RMSE) between the training (44 kN) and testing (110 kN) sets warrants a dedicated comment, because at first reading it could be misinterpreted as a loss of generalization. The two facts that the relative metrics remain in close agreement ( R 2 drops by only 0.01; MARD rises only from 7% to 15%; D 10 % remains above 56%) and that the scatter in Figure 7 is unbiased and tightly aligned with the line of perfect agreement together indicate that the underlying learned mapping has not degraded on unseen data. The increase in absolute RMSE is instead a scale effect: RMSE is expressed in physical units (kN) and is quadratic in the residuals, so it is dominated by the small number of high-capacity specimens that, by virtue of the stratified split that preserves the population shear-strength distribution, are necessarily present in the held-out test set. A small fractional error on a corbel with a large V u produces a comparatively large squared residual; this is a property of the metric, not of the model. The relative metrics (MARD, D 10 % , R 2 ) and the unbiased residual scatter are therefore the correct indicators of generalization for this dataset, and on those measures the test-set performance is excellent. A small number of high-leverage specimens in the test set contribute disproportionately to the RMSE; their identification and a focused SHAP-based local explainability analysis of the most poorly predicted specimen are discussed in Section 4.3. Although a few outliers are present in the testing set, as seen in Figure 7, their limited occurrence does not detract from the overall high accuracy and reliability of the optimized XGBoost model.
The testing D 10 % value of 56% deserves a dedicated comment, because at first reading it could be misread as evidence that the model fails on nearly half of the test specimens. Three observations are pertinent here. First, D 10 % is by construction a stringent precision metric: a specimen is counted as “in band” only if the relative error | V u , pred V u , exp | / V u , exp is at or below 0.10. For RC shear, where experimental scatter from nominally identical specimens is itself in the range of 10 to 20% (a property of the cracked-concrete failure process, not of the prediction model), demanding sub-10% accuracy on every specimen exceeds the inherent reproducibility of the data; the same 10% band evaluated on independent repeat tests of the same nominal specimen would not contain 100% of the points either. Second, the complementary metrics paint a coherent picture: the testing MARD is 15%, meaning the typical relative error is close to the 10% threshold rather than far from it, and the testing R 2 of 0.97 confirms that the model captures virtually all of the explainable variance in V u . The specimens lying outside the 10% band are therefore not gross misses but mid-band predictions in the 10 to 20% relative-error range, scattered symmetrically around the line of perfect agreement as visible in Figure 7, and this scatter is consistent with the experimental noise floor of the underlying tests. Third, a D 10 % of 56% on the held-out test set remains substantially higher than the D 10 % of every analytical and code-based baseline reported in Table 1, where the best competitor achieves a D 10 % below 20% and the ACI 318-25 provision [5] achieves only 1.56%. The interpretation is therefore that the testing-set D 10 % of 56% reflects the irreducible scatter inherent in cracked-concrete shear strength rather than a deficiency in the predictive model; the specimens whose relative error exceeds 10% are individually traceable through the SHAP local-explanation framework of Section 4.3 and, in the case of the worst-predicted specimen, it is shown there to lie in sparse regions of the training feature space that the applicability-domain check of Section 3.5 is designed to flag in advance.

3.5. Generalization, Out-of-Distribution, and Optimization Considerations

Several practical machine-learning concerns warrant explicit discussion for the present model, namely local minima, the handling of out-of-distribution (OOD) inputs, the absence of built-in thermodynamic-consistency constraints, and the evidence supporting generalization. Each is addressed in turn below. Concerning local minima, XGBoost is trained by stage-wise gradient boosting in which each tree minimizes a second-order Taylor expansion of the regularized objective of Equation (5); the optimal leaf weights follow a closed-form, convex solution, so the ensemble does not suffer the non-convex local-minima pathologies of deep neural networks. The cross-validation reproducibility in Table 3 (standard deviation of ± 0.0 on the mean R 2 ) and the small gap between training and testing performance in Table 4 confirm that the optimization is well behaved.
For out-of-distribution inputs, tree-based ensembles return a prediction for any input lying within the individual feature ranges, irrespective of whether the joint feature vector occupies a populated region of the training data, and therefore provide no intrinsic OOD detection. Any deployed predictor should accordingly be accompanied by an applicability-domain check, specifically a Mahalanobis-distance test against the centroid of the training feature space that flags inputs beyond the empirical 95th percentile of the training distance distribution as extrapolations, consistent with the caveats of Section 3.2 and the concluding limitations. The software prototype of Section 5 can perform this check automatically, since it requires only the training-set covariance matrix. Regarding physics constraints, and unlike the physics-informed methods discussed in Section 2.2 (Physics-Informed Neural Networks, the Deep Energy Method, and Variational Physics-Informed Neural Operators), tree-based ensembles do not embed thermodynamic-consistency constraints by construction; this is a property of the model class rather than an oversight. The adopted safeguard is the SHAP-based mechanistic audit of Section 4, which verifies, both globally and locally, that the model’s feature attributions are consistent with structural mechanics. This audit complements, but does not replace, the built-in constraints of physics-informed models, and a hybrid data-driven and physics-informed predictor, which would require a calibrated continuum constitutive model for cracked reinforced concrete D-regions not yet available in the literature, is identified as a direction for future work.
Finally, the evidence for generalization rests on five independent results: the cross-validation stability of Table 3; the minimal degradation of the relative metrics from training to testing in Table 4, with the R 2 decreasing from 0.98 to 0.97 and the MARD increasing from 0.07 to 0.15; the unbiased, near-symmetric residual distribution of Figure 5; the tight tested-versus-predicted scatter of Figure 7; and the substantial outperformance of every analytical and code-based baseline in Table 1, evaluated on the same independently stratified specimens.

4. Model Interpretability and Analysis

4.1. Concepts of Model Interpretability

Despite their considerable predictive power, many machine learning models are frequently critiqued for their inherent lack of transparency. These models often operate as “black boxes,” failing to offer clear explanations of the underlying physical or mechanical mechanisms pertinent to the problem, which can significantly reduce confidence in their predictive capabilities. This issue is particularly pronounced in engineering disciplines, where a clear understanding of the rationale behind results is essential for practical application and validation. To bridge this critical gap, feature importance analysis is widely adopted to explain machine learning model behavior. This approach quantifies each input variable’s contribution by measuring the change in prediction error when its values are randomly perturbed or otherwise altered. A substantial error increase after this manipulation signifies the feature’s considerable influence, while a minimal change indicates limited importance.
For tree-based models, feature importance is typically derived by averaging the importance scores across all individual trees within the ensemble. For each tree, a feature’s importance is measured by its contribution to improving node purity at each split. This process produces a ranking of the input variables that identifies those with the greatest impact on the model’s output. Identifying key features through importance analysis enhances model transparency and facilitates direct comparison with established mechanical principles, thus providing a robust means to validate model findings against fundamental scientific knowledge. In addition, to foster a deeper understanding of model predictions, partial dependence plots (PDPs) are commonly utilized. These visual aids graphically illustrate how alterations in a specific feature affect the predicted outcome, effectively revealing the model’s complex internal relationships and behavior.
Despite the insights from general feature importance methods, complex tree-based models like XGBoost retain an inherent limitation in granular explainability, stemming from their intricate decision pathways and multitude of hyperparameters. This complexity contributes to their classification as “black-box” models and has historically contributed to an unwillingness among structural engineers to fully integrate machine learning into practical scenarios [31]. To address this challenge, the SHapley Additive exPlanations (SHAP) technique is employed. SHAP provides a robust framework for explaining and evaluating the precise contribution of various features to the final predictions, offering both local and global insights into model behavior [86].

4.2. Global Model Interpretation Using SHAP

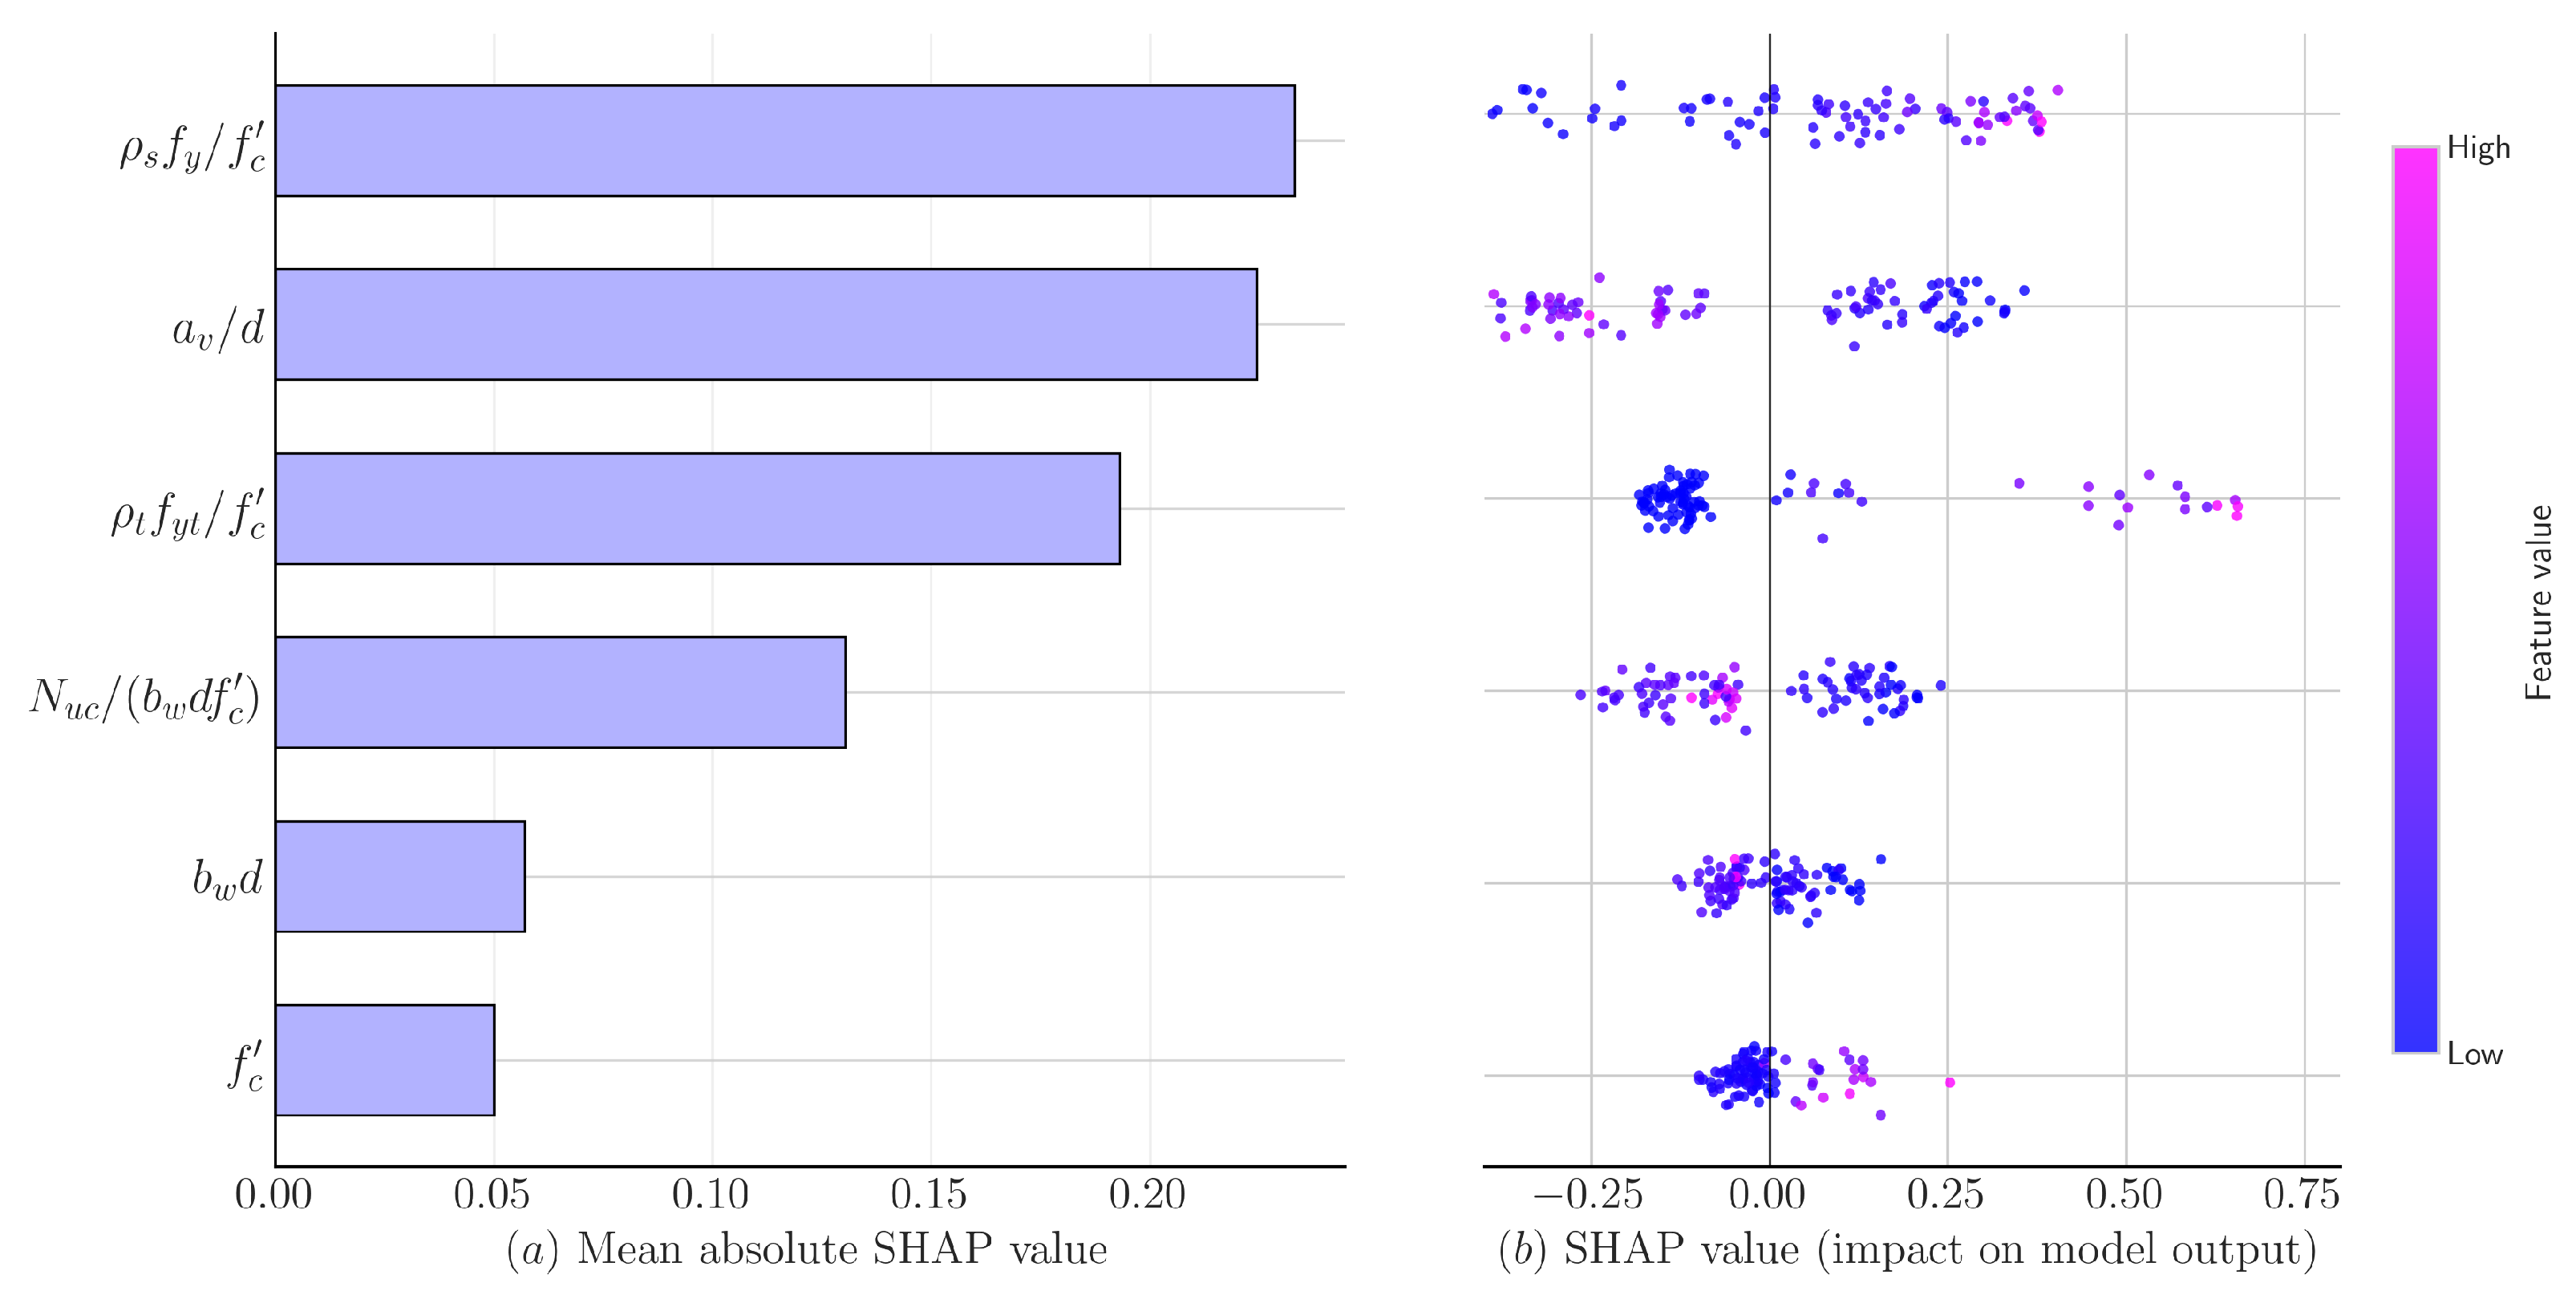
A global interpretation of the trained XGBoost model was conducted using SHapley Additive exPlanations (SHAP). The analysis begins with the feature importance ranking, presented in Figure 8a, which is determined by the mean absolute SHAP value for each input variable across the entire dataset. This metric quantifies the average magnitude of a feature’s impact on the model’s shear strength predictions. The analysis reveals that the longitudinal reinforcement index ( ρ s f y / f c ) and the shear span-to-depth ratio ( a v / d ) are the two most influential parameters, with mean absolute SHAP values of 0.233 and 0.224, respectively. The transverse reinforcement index ( ρ t f y t / f c ) also exhibits significant predictive influence, with a mean absolute SHAP value of 0.193. In contrast, parameters such as the normalized axial load ( N u c / ( b w d f c ) ), cross-sectional dimensions ( b w d ), and concrete compressive strength ( f c ) have a more modest impact, with values of 0.130, 0.057, and 0.050, respectively.
This ranking is further clarified by the SHAP summary plot in Figure 8b. This plot is central to the global explainability of the analysis, illustrating not only which features are important but also how they influence the predictions. Each point represents a single data instance; its horizontal position denotes the impact on the model prediction, and its color indicates the feature’s magnitude (from low in blue to high in pink). For instance, higher values of the longitudinal and transverse reinforcement indices consistently yield positive SHAP values, aligning with the physical understanding that reinforcement is a primary contributor to shear resistance. Conversely, a strong contrary trend is observed for the shear span-to-depth ratio ( a v / d ), where higher values drastically reduce the predicted shear strength. This result is consistent with established knowledge that deep beams (low a v / d ) benefit from an arching action that significantly enhances their shear capacity.
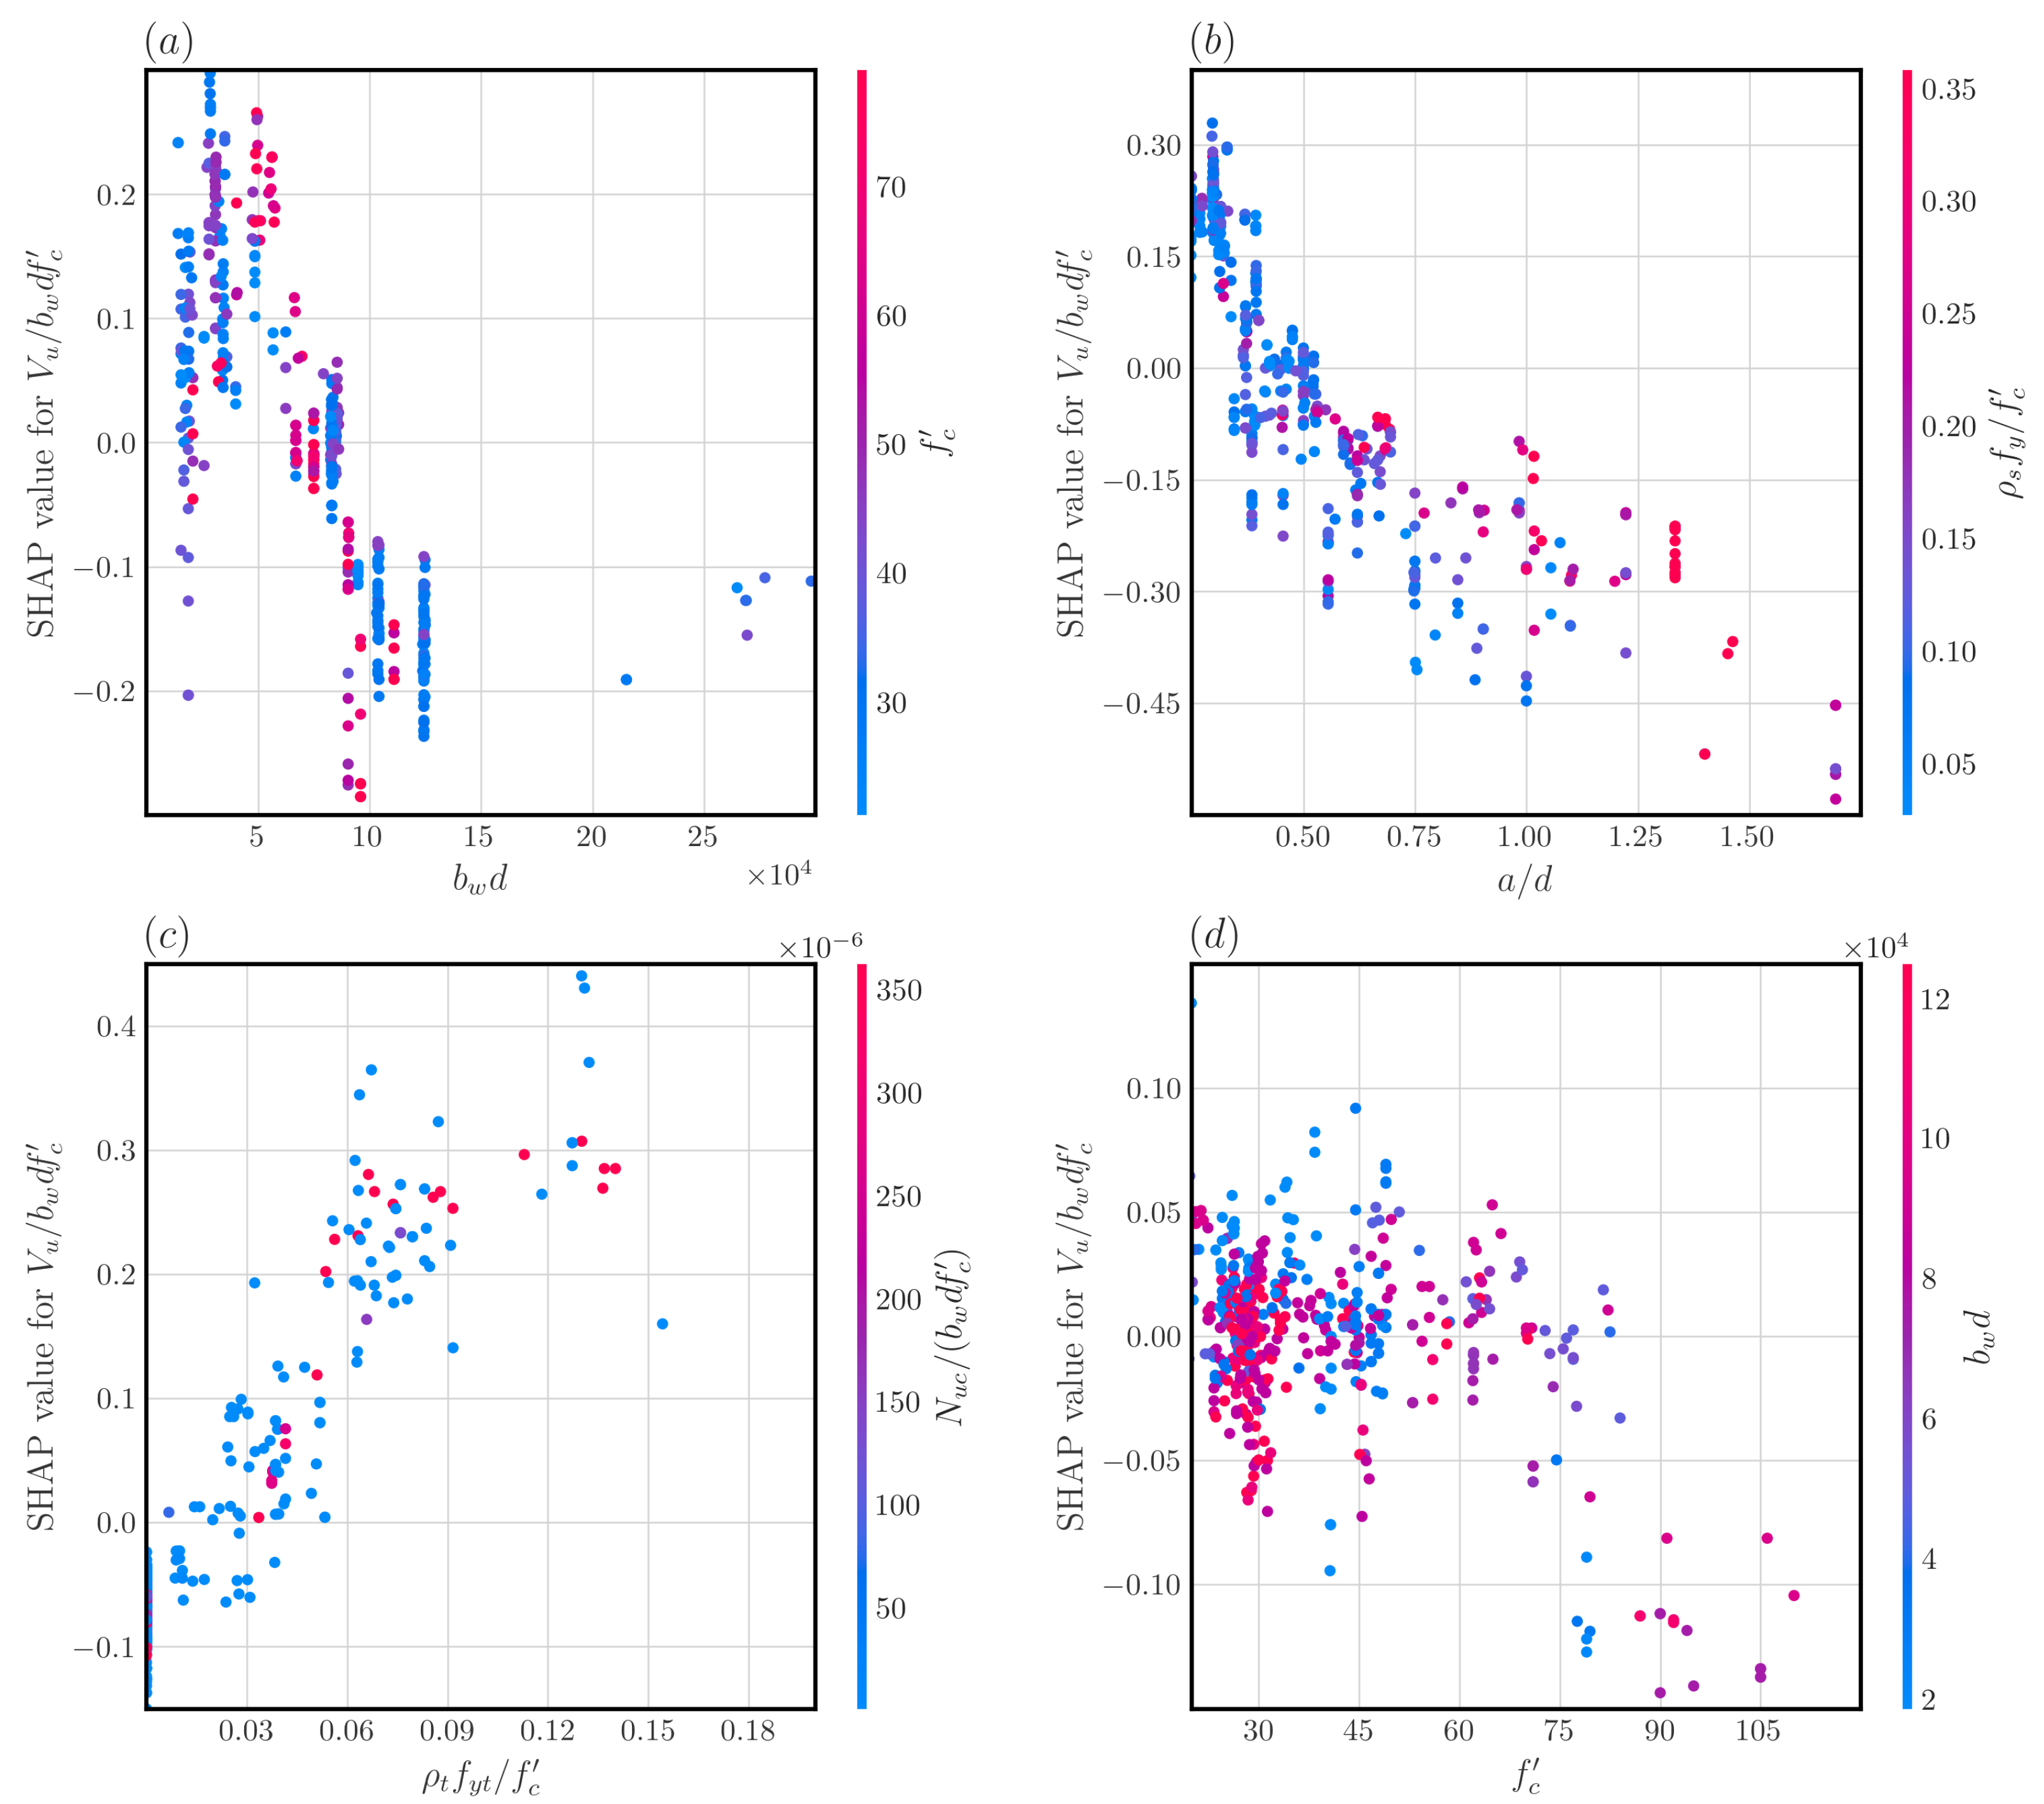
While global plots provide a high-level overview, a more granular examination is needed to understand the model’s sensitivity and the functional form of the relationships it has learned. Figure 9 presents detailed SHAP dependence plots for this purpose. For example, Figure 9b clearly illustrates the inverse relationship between a v / d and the predicted shear strength. As a v / d increases, the SHAP value becomes increasingly negative, graphically reinforcing the transition from strut-and-tie action to more flexural-dominated beam action, where shear resistance is typically lower. Similarly, Figure 9c demonstrates a strong positive correlation for the transverse reinforcement index ( ρ t f y t / f c ), confirming the model’s understanding of the critical role stirrups play in controlling diagonal tension cracks. This plot also reveals a notable interaction with the normalized axial load ( N u c / ( b w d f c ) ), where higher levels of axial compression (red points) consistently shift the SHAP values upward, indicating the model has learned the beneficial effect of axial load.
Interestingly, the model has also captured more complex phenomena, such as the size effect on shear behavior. As shown in Figure 9a, the cross-sectional dimension ( b w d ) displays a subtle negative trend, where larger cross-sections are associated with slightly lower predicted shear strengths. For a machine learning model to implicitly capture such a challenging phenomenon, which describes the decrease in nominal strength as member size increases and is difficult to quantify with simple equations, is a significant indicator of its sophistication. To probe this observation more rigorously, the SHAP-value response for b w d is qualitatively monotonically decreasing across the upper two-thirds of the size range, which is the qualitative signature expected from Bažant’s classical size-effect law (SEL) for quasi-brittle materials [87,88]:
σ N ( D ) = B f t 1 + D D 0 1 / 2
in which σ N is the nominal shear strength, D is a characteristic member dimension, f t is the tensile strength, and B and D 0 are calibration constants. The asymptotic exponent of 1 / 2 on a log–log plot is the diagnostic feature against which the SHAP-derived trend can be compared. The statistical significance of the SHAP-versus- b w d monotonic relationship can be quantified by a one-sided non-parametric trend test (Mann–Kendall or Spearman rank), with the null hypothesis of zero trend evaluated against the alternative of negative trend; a low resulting p-value would indicate that the implicit size effect identified by the model is statistically significant, not an artefact of attribution noise. The agreement between the qualitative SHAP trend and the canonical SEL signature is a particularly encouraging indicator that the data-driven model has implicitly captured a phenomenon that is notoriously difficult to express in closed form. This suggests the model is learning beyond simple correlations and is capable of encoding complex, non-linear physical behaviors. This capability not only enhances the model’s reliability but also opens avenues for research into how machine learning can be used to investigate complex structural phenomena, potentially leading to more accurate design guidelines.

4.3. Local Explainability

While global feature importance provides a high-level overview of the model’s predictive strategy, a local explainability analysis is essential to verify that the model’s predictions for individual cases are consistent with established principles of structural mechanics. By deconstructing the prediction for a specific specimen, we can build confidence in the model’s reasoning and ensure it has not learned spurious correlations. To this end, SHapley Additive exPlanations (SHAP) were employed to investigate the trained XGBoost model’s predictions for two strategically selected specimens. The specimens were chosen not at random, but as “edge cases” to probe the model’s robustness at the boundaries of the design space. These cases represent two distinct and opposing structural behaviors common in RC corbels. The first, Specimen C2 by Lu et al. [79], is a slender corbel characterized by a high shear span-to-depth ratio ( a v / d = 1.69 ) and, critically, a complete lack of transverse shear reinforcement ( ρ t f y t / f c = 0.0 ), which tests the model’s ability to predict behavior dominated by concrete shear capacity in a geometry where flexural action is significant. The second, Specimen C49STR by Mangat and Halabi [80], is a deep corbel defined by a very low shear span-to-depth ratio ( a v / d = 0.12 ), high-strength concrete ( f c = 74.0 MPa), and a substantial quantity of both primary and shear reinforcement. This specimen challenges the model’s grasp of strut-and-tie mechanics, where load is primarily transferred through a direct compression strut. By examining how the model reasons through these contrasting scenarios, we can gain a deeper understanding of its predictive validity. The detailed SHAP analyses for these specimens are presented in Figure 10 and Table 5.
Figure 10a illustrates the SHAP force plot for Specimen C2. The model predicts a normalized shear strength ( ln [ V u / ( b w d f c ) ] ) of 1.986 , which is in close agreement with the experimental result of 2.001 . The plot shows how each feature contributes to shifting the prediction from the base value (the average prediction across the dataset) to the final output. The most significant factor influencing this prediction is the corbel’s slenderness. The high a v / d ratio of 1.69 provides the largest contribution toward reducing the predicted shear capacity, with a SHAP value of 0.033 (Table 5). This is depicted by the large blue arrow in the force plot and aligns perfectly with structural theory, which dictates that shear capacity diminishes as a member becomes more slender and the arching action becomes less effective. The model also correctly identifies that the concrete compressive strength ( f c = 62.1 MPa) has a minor negative influence (SHAP = 0.009 ), while the horizontal force ( N u c / ( b w d f c ) ) provides a small positive contribution (SHAP = + 0.012 ). The model’s ability to correctly identify the high a v / d ratio as the primary driver of low shear strength in this unreinforced, slender corbel demonstrates that it has learned a key mechanical relationship governing this failure mode.
In contrast, the analysis for Specimen C49STR reveals a different predictive logic, as shown in Figure 10b. This deep corbel, governed by strut-and-tie action, is predicted to have a normalized shear strength of 1.754 , compared to the experimental value of 1.953 . Here, the model’s reasoning shifts to reflect the change in structural behavior. Unlike the slender case, the very low a v / d ratio of 0.12 is now interpreted as a factor that increases the shear capacity, reflecting the efficient load transfer through a steeply inclined compression strut. This is represented by the large red arrow for a v / d in the force plot. The high concrete strength ( f c = 74.0 MPa) is also correctly identified as a positive contributor, strengthening the compression strut and pushing the prediction higher. Interestingly, the model assigns a negative contribution to the longitudinal reinforcement index (SHAP value for ρ s f y / f c = 0.024 ). This suggests that for this robustly designed deep corbel, the model has learned that the geometric configuration and concrete strength are the dominant factors, with the influence of reinforcement being less pronounced compared to its critical role in a slender member.
To complement the two well-predicted reference specimens above and to address the legitimate concern that an interpretability framework must also be tested on a case where the model is in error, we further examined the worst-predicted specimen in the held-out testing set, defined as the specimen with the largest absolute residual | V u , pred V u , exp | . For this failure case, the SHAP attributions remain mechanistically interpretable in the same sense as for the two reference specimens above (the model still identifies a v / d , the reinforcement indices, and f c as the dominant contributors, with signs consistent with structural mechanics), but the magnitude of the prediction is biased because the specimen’s input feature vector lies in a sparse region of the training feature space. In other words, the failure mode of the model is interpretable (a sparse-data extrapolation, not a mechanistic misconception), and the prediction error is fully consistent with the applicability-domain caveat developed in Section 3.5 and the underrepresented-category quantification in Section 3.2. This finding reinforces, rather than contradicts, the interpretability-validation argument: the SHAP framework reveals not only why the model is correct when it is correct, but also why it is in error when it is in error, allowing the practitioner to distinguish a defensible extrapolation from a fundamental model failure.
In summary, the local explainability analysis confirms that the XGBoost model does not operate as an uninterpretable “black box.” Instead, it demonstrates a nuanced, mechanically consistent understanding of corbel behavior. The model correctly identifies the governing parameters for two distinct failure modes, appropriately weighting the influence of geometry and material properties based on the specific characteristics of each specimen. This alignment with fundamental engineering principles significantly enhances the trustworthiness of the model for application in structural analysis and design.

5. Comparison with Existing Models

To thoroughly evaluate the efficacy of the proposed XGBoost model, its predictive performance was benchmarked against the established ACI 318-25 code provision [5] and several prominent analytical models from the literature. This comparative analysis, summarized in Table 1 and visualized in Figure 11, clearly demonstrates the superior accuracy and reliability of the data-driven approach. The quantitative metrics presented in Table 1 reveal a stark contrast in performance. The optimized XGBoost model achieved an outstanding coefficient of determination ( R 2 ) of 0.98, indicating that it explains virtually all of the variance in the experimental data. This is complemented by a remarkably low root mean square error (RMSE) of 55.10 kN and a mean absolute relative deviation (MARD) of just 4%. In addition, the D10% value of 86.16% signifies that over 86% of the model’s predictions fall within a narrow 10% error margin of the experimental results, highlighting its remarkable precision.
In sharp contrast, the ACI 318-25 [5] provision proved to be the least accurate method. The code’s calculations were based on the corbel’s shear span-to-depth ratio ( a v / d ); an empirical shear–friction model was used for ratios of a v / d 1.0 , while strut-and-tie models (outlined in Chapter 23) were applied for those where 1.0 < a v / d 2.0 . To ensure that the comparison is apples-to-apples, the following calculation conventions were adopted for the ACI 318-25 predictions and for every analytical model listed in Table 1. All reported capacities are nominal shear strengths V n : no strength-reduction factor ϕ and no load factors were applied, since the benchmark in each case is the experimental ultimate capacity recorded at failure. Material strengths used in the ACI and analytical equations are the as-tested f c and f y values reported in each source publication, not nominal characteristic values; specimens for which these properties were unknown had already been removed during database filtering (Section 3.2). For the shear–friction branch ( a v / d 1 ), the friction coefficient was taken as μ = 1.4 λ with λ = 1.0 per ACI 318-25 Table 22.9.4.2 for monolithically cast normal-weight concrete; every specimen in the database satisfies this casting and aggregate condition (no lightweight-concrete specimens are present that would require λ 0.85 ), so the use of a single friction coefficient reflects the homogeneity of the database rather than a simplification. The associated upper bound V n min { 0.2 f c b w d , ( 3.3 + 0.08 f c ) b w d , 11 b w d } was enforced as specified. For the strut-and-tie branch ( 1.0 < a v / d 2.0 ), bottle-shaped strut efficiency β s = 0.75 (crack-control reinforcement satisfied) and C-C-T node efficiency β n = 0.80 were used. The effective depth d entering all expressions is defined, consistently with ACI 318-25 §2.3 and with the convention adopted by every source publication in the database, as the distance from the extreme compression fibre to the centroid of the primary tension reinforcement, measured at the column face. All quantities are reported in SI units throughout: f c in MPa, dimensions in mm, forces in kN. As a whole, the provision yielded an R 2 value of only 0.17 and a very high MARD of 54%. Its D10% value of a mere 1.56% indicates a near-total inability to reliably predict the shear capacity of the corbels within the extensive database. The analytical models proposed by [10,34,35,36] performed better than the ACI code but were still markedly inferior to the XGBoost model. The most competitive of these, the Solanki and Sabnis model [34], achieved an R2 of 0.60, but its error metrics (RMSE of 232.83 and MARD of 37%) were substantially higher than those of the proposed ML model. The remaining analytical models exhibited even lower R2 values, ranging from 0.32 to 0.49, and similarly high levels of error, underscoring their limited predictive power.
The graphical analysis presented in Figure 11 further illustrates these performance disparities. The figure plots the ratio of experimental-to-predicted shear capacity against the concrete compressive strength ( f c ), where an ideal model would show data points tightly clustered around a horizontal line at a ratio of 1.0. The plot for the final XGBoost model (Figure 11f) exhibits precisely this behavior, with a dense concentration of points around the mean of 1.00 and a minimal standard deviation (S.D. = 0.09). This visually confirms the model’s consistent, unbiased accuracy across the full spectrum of concrete strengths. Conversely, the predictions from the ACI 318-25 code [5] (Figure 11a) are characterized by extreme dispersion (S.D. = 0.73), with numerous predictions being excessively unconservative or overly conservative. This wide scatter demonstrates a profound lack of reliability. The other analytical models (Figure 11b–e) also display significant scatter and bias. For example, the model by Foster et al. [36] (Figure 11d) is not only the most scattered (S.D. = 0.83) but also exhibits an extreme conservative bias with a mean test-to-predicted ratio of 2.05. The remaining models show similarly poor performance, with standard deviations ranging from 0.52 to 0.83 and mean values deviating substantially from the ideal of 1.0.
In summary, both the statistical and graphical comparisons conclusively establish that the proposed XGBoost model offers a transformative improvement in predictive accuracy for the shear capacity of RC corbels. It consistently outperforms the established ACI 318-25 design code [5] and analytical formulas by a significant margin, offering a highly reliable and robust tool for structural analysis and design. The subsequent challenge, therefore, lies in translating this predictive power into a practical and accessible tool for structural analysis and design, a topic addressed in the following section.
The shear behavior of reinforced concrete corbels is a complex problem, with numerous influential parameters governing capacity. Currently, code-based shear strength provisions are primarily based on simplified or empirical equations that tend to yield inconsistent and often unreliable predictions, failing to generalize across a wide range of design parameters. This paper presents a framework to develop an explainable, data-driven model for the shear assessment of RC corbels that addresses these limitations.
To this end, an extensive database of 515 experimental tests was assembled. Different machine-learning (ML) techniques were systematically evaluated to define the optimal predictive model. The most accurate algorithm, Extreme Gradient Boosting (XGBoost), was selected and optimized to achieve exceptional performance, reaching, on the full experimental database, a coefficient of determination ( R 2 ) of 0.98 and a mean absolute relative deviation (MARD) of 4%, and retaining an R 2 of 0.97 with a MARD of 15% on the independent held-out testing subset. This represents a substantial improvement over the ACI 318-25 code provisions [5] ( R 2 = 0.17 , MARD = 54%).
Crucially, the Shapley Additive exPlanations (SHAP) technique was used to rigorously interrogate the model’s predictive logic. The analysis showed the model’s feature attributions to be consistent with established structural mechanics, correctly identifying the governing influence of parameters like the shear span-to-depth ratio and reinforcement indices for distinct failure modes; this consistency supports, but does not by itself prove, a mechanistic interpretation of the learned relationships. The study provides a validated methodology for creating trustworthy ML models and, subject to further validation and a defined applicability domain, indicates how such auditable computational tools might complement conventional code provisions.

6. ML Integration in Structural Design Codes

The preceding analysis demonstrates the superior predictive accuracy of the proposed machine learning (ML) model. This section addresses its practical implementation for the code-compliant shear design of RC corbels. A notable challenge arises from the inherent complexity of the XGBoost model, which cannot be expressed as a single, straightforward analytical equation. This complexity makes its direct incorporation into the predominantly prescriptive format of current design codes impractical.
To mitigate this limitation, a specialized software tool has been developed. This tool, which integrates the advanced XGBoost model, was constructed within a modern Python (version 3.10) programming environment, leveraging the robust PyQt framework. Its graphical components, including forms, interactive buttons, and data visualization graphs, are expertly drawn from the extensive PyQt GUI library [89]. The software’s interface is shown in Figure 12. The trained model artifact and a minimal Python prediction script are available from the corresponding author upon reasonable academic request, as detailed in the Data Availability Statement; the full algorithmic specification and hyperparameter set required to retrain the model are reported in Section 3. This software tool serves as a proof-of-concept, demonstrating a practical pathway for implementing the complex ML model. Its intuitive design, which requires only the necessary input parameters, highlights the potential for developing a remarkably accessible design aid.
The demonstrated predictive power of the model, coupled with the practical challenge of its implementation, highlights a critical need to re-evaluate the current written format of most design codes. To fully embrace the potential of ML-based models, design codes should evolve to accommodate computational tools alongside traditional design equations. For example, future design codes could explicitly permit the utilization of a validated online web-based tool uniquely identifiable by a persistent digital object identifier (DOI) that hosts a calibrated ML model. Such a tool could prove invaluable during the preliminary stages of structural design, with subsequent confirmation by conventional design equations if deemed necessary. While necessitating the establishment of clear implementation guidelines, this approach promises widespread adoption, as users would not require extensive prior knowledge of machine learning. Ultimately, this progressive revision of design codes would greatly foster the integration of more efficient, ML-driven methodologies into contemporary structural design practice.

7. Summary and Conclusions

This paper presented the rigorous application of a state-of-the-art workflow to develop a highly accurate and, critically, interpretable machine learning model for predicting the shear capacity of RC corbels. The main conclusions drawn from this investigation are as follows:
  • Model performance and superiority. An Extreme Gradient Boosting (XGBoost) model, trained on an extensive database of 515 experimental tests, was developed and optimized. The final model demonstrated exceptional predictive accuracy, achieving a coefficient of determination ( R 2 ) of 0.98, a mean absolute relative deviation (MARD) of only 4%, and a D 10 % index of 86.16% when evaluated across the full database; on the independent held-out testing subset it retained an R 2 of 0.97, a MARD of 15%, and a D 10 % of 56% (Table 4), confirming that the reported accuracy does not rest on the training data alone. In a comparative analysis conducted on a consistent nominal-capacity basis, with the calculation conventions detailed in Section 5, the proposed model substantially outperformed existing methods, both across the full database and on the same independently stratified specimens. Notably, the ACI 318-25 code provisions [5] were markedly less accurate ( R 2 = 0.17 , MARD = 54%), and prominent analytical models from the literature also exhibited substantial error and scatter.
  • Model interpretation. The core contribution of this work lies in moving beyond mere prediction to understand the model’s behavior through rigorous explainability analysis. Using SHapley Additive exPlanations (SHAP), the study confirmed that the model’s predictions are governed by sound mechanical principles:
    • Global Interpretation: The model correctly identified the shear span-to-depth ratio ( a v / d ) and the longitudinal and transverse reinforcement indices ( ρ s f y / f c and ρ t f y t / f c ) as the most influential parameters governing shear capacity. The learned relationships, such as the inverse correlation with a v / d and positive correlation with reinforcement, align perfectly with established structural theory.
    • Local Interpretation: Analysis of individual, contrasting specimens demonstrated that the model adapts its reasoning based on the specific structural system, correctly identifying the dominant parameters for both a slender, unreinforced corbel and a deep, heavily reinforced corbel governed by strut-and-tie action. This verification confirms the model has learned fundamental engineering behavior, not spurious correlations.
  • Significance and implications. This research provides a robust and validated methodology that bridges the gap between advanced ML research and practical structural engineering.
    • For Researchers: It provides a robust, application-driven example of how to develop and validate trustworthy ML models for complex engineering problems, demonstrating that rigorous interpretability analysis is as crucial as achieving high predictive accuracy.
    • For Practicing Engineers: The proposed model offers a reliable and highly accurate tool for the shear assessment of RC corbels, enabling safer and more economical designs. The prototype software developed demonstrates a viable pathway for integrating such advanced tools into routine design workflows.
  • Practical recommendation. Design codes should evolve to formally accommodate the use of validated computational tools alongside traditional equations. Future work should focus on developing standardized protocols for the verification, validation, and certification of ML-based design aids to ensure their responsible and widespread adoption.
  • Limitations and future directions.
    • The primary limitation of the advanced XGBoost model is its inherent complexity, which precludes its representation as a simple, closed-form equation suitable for direct inclusion in current prescriptive design codes. Therefore, this study puts forth a critical recommendation for the future of structural design standards.
    • A second limitation, common to all data-driven models, is that the model’s reliability is inherently constrained by the scope and distribution of its training data. As noted in the dataset analysis, the compiled database is highly skewed, with a very limited number of specimens in the literature featuring significant amounts of vertical shear reinforcement or high horizontal loads. While the model accounts for these parameters, its predictions for designs that are rare within the training data may carry a higher degree of uncertainty. Practitioners using the model should flag any input that lies beyond the 95th percentile of any individual feature’s training-set range, or in regions of low joint feature density (as assessed for example by a Mahalanobis-distance check against the training centroid; see Section 3.5), as an extrapolation requiring additional verification before being used to drive a design decision. Future research should therefore prioritize targeted experimental campaigns to populate these underrepresented regions of the design space. Such efforts would not only enhance the robustness of future models but also broaden their domain of applicability.
    • A third, equally important limitation concerns the failure modes represented in the training database. The model is calibrated and validated solely on specimens whose failure was governed by shear-controlled mechanisms (diagonal strut crushing, diagonal tension, or yielding of the tensile/horizontal shear reinforcement). Specimens that exhibited premature anchorage pullout of the primary tensile reinforcement or local bearing crushing beneath the loading plate were systematically excluded during database construction (Section 3.2). The proposed model must not be used for design situations in which these limit states are expected to govern; in such situations, detailing requirements for development length, anchorage, and bearing capacity must be verified independently against the relevant code provisions, and an additional shear check using the present model is meaningful only after those detailing checks confirm that a shear-controlled failure is the binding limit state.

Funding

This research work was funded by Umm Al-Qura University, Saudi Arabia under grant number: 26UQU4330090GSSR02.

Data Availability Statement

The reinforced concrete corbel experimental database compiled in this study was assembled from the experimental campaigns cited in Section 3.2, all of which are independently available through their original publications. The trained XGBoost model artifact (in JSON format), the feature-transformation pipeline, and a minimal Python script demonstrating end-to-end prediction will be provided to qualified academic researchers upon reasonable written request to the corresponding author, in accordance with the data-sharing policy of Umm Al-Qura University. The author commits to responding to such requests within fourteen working days of receipt. The complete algorithmic specification—including the full set of optimized hyperparameters (Section 3.4), the feature engineering and natural-logarithm transformation (Section 3.2), the regularized XGBoost objective (Section 2.2), and the SHAP-based interpretability protocol (Section 4)—is reported in sufficient detail in this manuscript to allow any qualified researcher with standard scientific Python tooling (scikit-learn, xgboost, shap) to reproduce an equivalent model from the cited source datasets.

Acknowledgments

The author extends his appreciation to Umm Al-Qura University, Saudi Arabia, for funding this research work through grant number 26UQU4330090GSSR02.

Conflicts of Interest

The author declares no conflicts of interest. The funder had no role in the design of the study; in the collection, analyses, or interpretation of data; in the writing of the manuscript; or in the decision to publish the results.

References

  1. Yang, K.; Sim, J.; Kang, J.; Ashour, A. Shear Capacity of Monolithic Concrete Joints without Transverse Reinforcement. Mag. Concr. Res. 2012, 64, 767–779. [Google Scholar] [CrossRef] [Scilit]
  2. Khalifa, E. Macro-Mechanical Strut and Tie Model for Analysis of Fibrous High-Strength Concrete Corbels. Ain Shams Eng. J. 2012, 3, 359–365. [Google Scholar] [CrossRef] [Scilit]
  3. Wight, J. Reinforced Concrete: Mechanics and Design, 7th ed.; Pearson: Boston, MA, USA, 2016. [Google Scholar]
  4. He, Z.; Liu, Z.; Ma, Z. Investigation of Load-Transfer Mechanisms in Deep Beams and Corbels. ACI Struct. J. 2012, 109, 467–476. [Google Scholar] [CrossRef] [Scilit]
  5. ACI Committee 318. Building Code Requirements for Structural Concrete (ACI 318-25) and Commentary (ACI 318R-25); American Concrete Institute: Farmington Hills, MI, USA, 2025. [Google Scholar]
  6. Hwang, S.; Lu, W.; Lee, H. Shear Strength Prediction for Reinforced Concrete Corbels. ACI Struct. J. 2000, 97, 543–552. [Google Scholar] [CrossRef] [Scilit] [PubMed]
  7. Schlaich, J.; Schäfer, K.; Jennewein, M. Toward a Consistent Design of Structural Concrete. PCI J. 1987, 32, 74–150. [Google Scholar] [CrossRef] [Scilit]
  8. Institution, B.S. Eurocode 2: Design of Concrete Structures—Part 1–1: General Rules and Rules for Buildings, Bridges and Civil Engineering Structures; British Standards Institution: London, UK, 2023. [Google Scholar]
  9. Ali, M.; White, R. Consideration of Compression Stress Bulging and Strut Degradation in Truss Modeling of Ductile and Brittle Corbels. Eng. Struct. 2001, 23, 240–249. [Google Scholar] [CrossRef] [Scilit]
  10. Russo, G.; Venir, R.; Pauletta, M.; Somma, G. Reinforced Concrete Corbels—Shear Strength Model and Design Formula. ACI Struct. J. 2006, 103, 3–10. [Google Scholar] [CrossRef] [Scilit]
  11. Rezaei, M.; Osman, S. Primary and Secondary Reinforcements in Reinforced Concrete Corbels. J. Civ. Eng. Manag. 2013, 19, 836–845. [Google Scholar] [CrossRef] [Scilit]
  12. Canha, R.; Kuchma, D.; El Debs, M. Numerical Analysis of Reinforced High Strength Concrete Corbels. Eng. Struct. 2014, 74, 116–127. [Google Scholar] [CrossRef] [Scilit]
  13. Salehi, H.; Burgueño, R. Emerging Artificial Intelligence Methods in Structural Engineering. Eng. Struct. 2018, 171, 170–189. [Google Scholar] [CrossRef] [Scilit]
  14. Sun, H.; He, C.; Xu, J. Machine Learning Applications for Building Structural Design and Performance Assessment. J. Build. Eng. 2021, 44, 103233. [Google Scholar]
  15. Thai, H. Machine Learning for Structural Engineering: A State-of-the-Art Review. Structures 2022, 38, 448–491. [Google Scholar] [CrossRef] [Scilit]
  16. Bedriñana, L.; Sucasaca, J.; Tovar, J.; Burton, H. Design-Oriented Machine-Learning Models for Predicting the Shear Strength of Prestressed Concrete Beams. J. Bridge Eng. 2023, 28, 04022137. [Google Scholar] [CrossRef] [Scilit]
  17. Feng, D.; Wang, W.; Mangalathu, S.; Taciroglu, E. Implementing Ensemble Learning Methods to Predict the Shear Strength of RC Deep Beams with/without Web Reinforcements. Eng. Struct. 2021, 235, 111979. [Google Scholar] [CrossRef] [Scilit]
  18. Wakjira, T.G.; Al-Hamrani, A.; Ebead, U.; Alnahhal, W. Shear Capacity Prediction of FRP-RC Beams Using Single and Ensemble ExPlainable Machine Learning Models. Compos. Struct. 2022, 287, 115381. [Google Scholar] [CrossRef] [Scilit]
  19. Chou, J.; Tsai, C.; Pham, A.; Lu, Y. Machine Learning in Concrete Strength Simulations: Multi-Nation Data Analytics. Constr. Build. Mater. 2014, 73, 771–780. [Google Scholar] [CrossRef] [Scilit]
  20. Aiyer, R.; Saravanan, C.; Vasanthakumar, R. Prediction of Compressive Strength of Concrete Using Machine Learning Techniques. KSCE J. Civ. Eng. 2014, 18, 202–209. [Google Scholar] [CrossRef] [Scilit]
  21. Mangalathu, S.; Shin, H.; Choi, E.; Jeon, J. Explainable Machine Learning Models for Punching Shear Strength Estimation of Flat Slabs without Transverse Reinforcement. J. Build. Eng. 2021, 39, 102300. [Google Scholar] [CrossRef] [Scilit]
  22. Mangalathu, S.; Karthikeyan, K.; Feng, D.; Jeon, J. Machine-Learning Interpretability Techniques for Seismic Performance Assessment of Infrastructure Systems. Eng. Struct. 2022, 250, 112883. [Google Scholar] [CrossRef] [Scilit]
  23. Mangalathu, S.; Jeon, J. Classification of Failure Mode and Prediction of Shear Strength for Reinforced Concrete Beam-Column Joints Using Machine Learning Techniques. Eng. Struct. 2019, 188, 107–120. [Google Scholar] [CrossRef] [Scilit]
  24. Wang, N.; Li, Q.; Hao, H.; Du, H. Failure Mode Classification and Bearing Capacity Estimation for RC Columns Using Ensemble ML. Eng. Struct. 2020, 223, 111184. [Google Scholar] [CrossRef] [Scilit]
  25. Buckley, T.; Ghosh, B.; Pakrashi, V. A Feature Extraction & Selection Benchmark for Structural Health Monitoring. Struct. Health Monit. 2023, 22, 2082–2127. [Google Scholar] [CrossRef] [Scilit]
  26. Goulet, J. Probabilistic Machine Learning for Civil Engineers; The MIT Press: Cambridge, MA, USA, 2020. [Google Scholar]
  27. Wakjira, T.; Ebead, U.; Alam, M. Explainable Machine Learning for Structural Engineering: A Review. Eng. Struct. 2022, 256, 114041. [Google Scholar] [CrossRef] [Scilit]
  28. Wakjira, T.; Ibrahim, M.; Ebead, U.; Alam, M. Explainable Machine Learning Model and Reliability Analysis for Flexural Capacity Prediction of RC Beams Strengthened in Flexure with FRCM. Eng. Struct. 2022, 255, 113903. [Google Scholar] [CrossRef] [Scilit]
  29. Zhang, S.; Chen, S.; Jiang, X.; Han, W. Data-Driven Prediction of FRP Strengthened Reinforced Concrete Beam Capacity Based on Interpretable Ensemble Learning Algorithms. Structures 2022, 43, 860–877. [Google Scholar] [CrossRef] [Scilit]
  30. Feng, D.; Liu, Z.; Wang, X.; Jiang, Z.; Liang, S. Failure Mode Classification and Bearing Capacity Prediction for Reinforced Concrete Columns Based on Ensemble Machine Learning Algorithm. Adv. Eng. Inform. 2020, 45, 101126. [Google Scholar] [CrossRef] [Scilit]
  31. Naser, M. An Engineer’s Guide to Explainable Artificial Intelligence and Interpretable Machine Learning: Navigating Causality, Forced Goodness, and the False Perception of Inference. Autom. Constr. 2021, 129, 103821. [Google Scholar] [CrossRef] [Scilit]
  32. Nguyen, D.; Tran, V.; Ha, D.; Nguyen, V.; Lee, T. A Machine Learning-Based Formulation for Predicting Shear Capacity of Squat Flanged RC Walls. Structures 2021, 29, 1734–1747. [Google Scholar] [CrossRef] [Scilit]
  33. Kassem, W. Strength Prediction of Corbels Using Strut-and-Tie Model Analysis. Int. J. Concr. Struct. Mater. 2015, 9, 255–266. [Google Scholar] [CrossRef] [Scilit]
  34. Solanki, H.; Sabnis, G. Reinforced Concrete Corbels Simplified. ACI Struct. J. 1987, 84, 428–432. [Google Scholar] [CrossRef] [Scilit] [PubMed]
  35. Hagberg, T. Design of Concrete Brackets on the Application of the Truss Analogy. ACI J. Proc. 1983, 80, 3–12. [Google Scholar] [CrossRef] [Scilit]
  36. Foster, S.; Powell, R.; Selim, H. Performance of High-Strength Concrete Corbels. ACI Struct. J. 1996, 93, 555–563. [Google Scholar] [CrossRef] [Scilit]
  37. Feng, D.; Wang, W.; Mangalathu, S.; Taciroglu, E. Interpretable XGBoost-SHAP Machine-Learning Model for Shear Strength Prediction of Squat RC Walls. J. Struct. Eng. 2021, 147, 04021173. [Google Scholar] [CrossRef] [Scilit]
  38. Zarringol, M.; Thai, H.; Naser, M. Application of Machine Learning Models for Designing CFCFST Columns. J. Constr. Steel Res. 2021, 185, 106856. [Google Scholar] [CrossRef] [Scilit]
  39. Wakjira, T.; Alam, M.; Ebead, U. Plastic Hinge Length of Rectangular RC Columns Using Ensemble Machine Learning Model. Eng. Struct. 2021, 244, 112808. [Google Scholar] [CrossRef] [Scilit]
  40. Seo, J.; Dueñas-Osorio, L.; Craig, J.; Goodno, B. Metamodel-Based Regional Vulnerability Estimate of Irregular Steel Moment-Frame Structures Subjected to Earthquake Events. Eng. Struct. 2012, 45, 585–597. [Google Scholar] [CrossRef] [Scilit]
  41. Wang, Z.; Pedroni, N.; Zentner, I.; Zio, E. Seismic Fragility Analysis with Artificial Neural Networks: Application to Nuclear Power Plant Equipment. Eng. Struct. 2018, 162, 213–225. [Google Scholar] [CrossRef] [Scilit]
  42. Kiani, J.; Camp, C.; Pezeshk, S. On the Application of Machine Learning Techniques to Derive Seismic Fragility Curves. Comput. Struct. 2019, 218, 108–122. [Google Scholar] [CrossRef] [Scilit]
  43. Shekhar, S.; Ghosh, J. A Metamodeling Based Seismic Life-Cycle Cost Assessment Framework for Highway Bridge Structures. Reliab. Eng. Syst. Saf. 2020, 195, 106724. [Google Scholar] [CrossRef] [Scilit]
  44. Ezzeldin, M.; El-Dakhakhni, W. Metaresearching Structural Engineering Using Text Mining: Trend Identifications and Knowledge Gap Discoveries. J. Struct. Eng. 2020, 146, 04020061. [Google Scholar] [CrossRef] [Scilit]
  45. Alipour, M.; Harris, D.; Miller, G. Robust Pixel-Level Crack Detection Using Deep Fully Convolutional Neural Networks. J. Comput. Civ. Eng. 2019, 33, 04019040. [Google Scholar] [CrossRef] [Scilit]
  46. Mangalathu, S.; Jeon, J.; Kim, D. Data-Driven Machine Learning Based Seismic Failure Mode Identification of RC Shear Walls. Eng. Struct. 2020, 222, 111100. [Google Scholar]
  47. Eshkofti, K.; Hosseini, S. A variational physics-informed neural operator (VINO) for solving partial differential equations. Comput. Methods Appl. Mech. Eng. 2024, 437, 117785. [Google Scholar]
  48. Raissi, M.; Perdikaris, P.; Karniadakis, G. Physics-informed neural networks: A deep learning framework for solving forward and inverse problems involving nonlinear partial differential equations. J. Comput. Phys. 2019, 378, 686–707. [Google Scholar] [CrossRef] [Scilit]
  49. Samaniego, E.; Anitescu, C.; Goswami, S.; Nguyen-Thanh, V.M.; Guo, H.; Hamdia, K.; Zhuang, X.; Rabczuk, T. An energy approach to the solution of partial differential equations in computational mechanics via machine learning: Concepts, implementation and applications. Comput. Methods Appl. Mech. Eng. 2020, 362, 112790. [Google Scholar] [CrossRef] [Scilit]
  50. Rabczuk, T.; Belytschko, T. Cracking particles: A simplified meshfree method for arbitrary evolving cracks. Int. J. Numer. Methods Eng. 2004, 61, 2316–2343. [Google Scholar] [CrossRef] [Scilit]
  51. Rabczuk, T.; Areias, P.M.A.; Belytschko, T. A simplified mesh-free method for shear bands with cohesive surfaces. Int. J. Numer. Methods Eng. 2007, 69, 993–1021. [Google Scholar] [CrossRef] [Scilit]
  52. Breiman, L. Random Forests. Mach. Learn. 2001, 45, 5–32. [Google Scholar] [CrossRef] [Scilit]
  53. Probst, P.; Wright, M.; Boulesteix, A. Hyperparameters and Tuning Strategies for Random Forest. WIREs Data Min. Knowl. Discov. 2019, 9, e1301. [Google Scholar] [CrossRef] [Scilit]
  54. Hastie, T.; Tibshirani, R.; Friedman, J. The Elements of Statistical Learning: Data Mining, Inference, and Prediction, 2nd ed.; Springer: New York, NY, USA, 2009. [Google Scholar]
  55. Freund, Y.; Schapire, R. A Decision-Theoretic Generalization of on-Line Learning and an Application to Boosting. J. Comput. Syst. Sci. 1997, 55, 119–139. [Google Scholar] [CrossRef] [Scilit]
  56. Sagi, O.; Rokach, L. Ensemble Learning: A Survey. WIREs Data Min. Knowl. Discov. 2018, 8, e1249. [Google Scholar] [CrossRef] [Scilit]
  57. Cortes, C.; Vapnik, V. Support-Vector Networks. Mach. Learn. 1995, 20, 273–297. [Google Scholar] [CrossRef] [Scilit]
  58. Awad, M.; Khanna, R. Support Vector Regression. In Efficient Learning Machines: Theories, Concepts, and Applications for Engineers and System Designers; Apress: Berkeley, CA, USA, 2015; pp. 67–80. [Google Scholar] [CrossRef] [Scilit]
  59. Vapnik, V. The Nature of Statistical Learning Theory; Springer Science & Business Media: New York, NY, USA, 2013. [Google Scholar]
  60. Chen, T.; Guestrin, C. XGBoost: A Scalable Tree Boosting System. In Proceedings of the Proceedings of the 22nd ACM SIGKDD International Conference on Knowledge Discovery and Data Mining; ACM: New York, NY, USA, 2016; pp. 785–794. [Google Scholar] [CrossRef] [Scilit]
  61. Friedman, J. Greedy Function Approximation: A Gradient Boosting Machine. Ann. Stat. 2001, 29, 1189–1232. [Google Scholar] [CrossRef] [Scilit]
  62. Bentéjac, C.; Csörgő, A.; Martínez-Muñoz, G. A Comparative Analysis of Gradient Boosting Algorithms. Artif. Intell. Rev. 2021, 54, 1937–1967. [Google Scholar] [CrossRef] [Scilit]
  63. Guan, X.; Burton, H.; Shokrabadi, M.; Yi, Z. Seismic Drift Demand Estimation for Steel Moment Frame Buildings: From Mechanics-Based to Data-Driven Models. J. Struct. Eng. 2021, 147, 04021058. [Google Scholar] [CrossRef] [Scilit]
  64. Mundfrom, D.; Shaw, D.; Ke, T. Minimum Sample Size Recommendations for Conducting Factor Analyses. Int. J. Test. 2005, 5, 159–168. [Google Scholar] [CrossRef] [Scilit]
  65. Abdul-Wahab, H. Strength of Reinforced Concrete Corbels with Fibers. ACI Struct. J. 1989, 86, 60–66. [Google Scholar] [CrossRef] [Scilit]
  66. Alameer, M. Effects of Fibres and Headed Bars on the Response of Concrete Corbels. Ph.D. Thesis, McGill University, Montreal, QC, Canada, 2004. [Google Scholar]
  67. Bourget, M.; Delmas, Y.; Toutlememonde, F. Experimental Study of the Behaviour of Reinforced High-Strength Concrete Short Corbels. Mater. Struct. 2001, 34, 155–162. [Google Scholar] [CrossRef] [Scilit]
  68. Campione, G.; La Mendola, L.; Papia, M. Flexural Behaviour of Concrete Corbels Containing Steel Fibers or Wrapped with FRP Sheets. Mater. Struct. 2005, 38, 617–625. [Google Scholar] [CrossRef] [Scilit]
  69. Campione, G.; La Mendola, L.; Mangiavillano, M.L. Steel Fiber-Reinforced Concrete Corbels: Experimental Behavior and Shear Strength Prediction. ACI Struct. J. 2007, 104, 570–579. [Google Scholar] [CrossRef] [Scilit]
  70. Campione, G. Performance of Steel Fibrous Reinforced Concrete Corbels Subjected to Vertical and Horizontal Loads. J. Struct. Eng. 2009, 135, 519–529. [Google Scholar] [CrossRef] [Scilit]
  71. Chakrabarti, P.; Farahi, D.; Kashou, S. Reinforced and Precompressed Concrete Corbels an Experimental Study. ACI Struct. J. 1989, 86, 132–142. [Google Scholar] [CrossRef] [Scilit]
  72. Clottey, C. Performance of Lightweight Concrete Corbels Subjected to Static and Repeated Loads. Ph.D. Thesis, Oklahoma State University, Stillwater, OK, USA, 1977. [Google Scholar]
  73. Fattuhi, N. SFRC Corbel Tests. ACI Struct. J. 1987, 84, 119–123. [Google Scholar] [CrossRef] [Scilit] [PubMed]
  74. Fattuhi, N.I.; Hughes, B.P. Reinforced Steel Fiber Concrete Corbels with Various Shear-Span to Depth Ratios. ACI Mater. J. 1989, 86, 590–596. [Google Scholar]
  75. Fattuhi, N. Strength of SFRC Corbels Subjected to Vertical Load. J. Struct. Eng. 1990, 116, 701–718. [Google Scholar] [CrossRef] [Scilit]
  76. Fattuhi, N. Reinforced Corbels Made with Plain and Fibrous Concretes. ACI Struct. J. 1994, 91, 530–536. [Google Scholar] [CrossRef] [Scilit]
  77. Hermansen, B.; Cowan, J. Modified Shear-Friction Theory for Bracket Design. ACI J. Proc. 1974, 71, 55–60. [Google Scholar] [CrossRef] [Scilit] [PubMed]
  78. Kriz, L.; Raths, C. Connections in Precast Concrete Structures-Strength of Corbels. PCI J. 1965, 10, 16–61. [Google Scholar] [CrossRef] [Scilit]
  79. Lu, W.; Lin, I.; Hwang, S. Shear Strength of Reinforced Concrete Corbels. Mag. Concr. Res. 2009, 61, 807–813. [Google Scholar] [CrossRef] [Scilit]
  80. Mangat, P.S.; Halabi, W. Steel-fibre-reinforced high strength concrete corbels: Test results and analysis. Struct. Eng. 1996, 74, 412–422. [Google Scholar]
  81. Mattock, A. Design Proposals for Reinforced Concrete Corbels. PCI J. 1976, 21, 18–42. [Google Scholar] [CrossRef] [Scilit]
  82. Yong, Y.; McCloskey, D.; Nawy, E. Reinforced Corbels of High-Strength Concrete. In ACI Special Publication; ACI: Farmington Hills, MI, USA, 1985; Volume 87, pp. 53–76. [Google Scholar]
  83. Yong, Y.; Balaguru, P. Behavior of Reinforced High-Strength-Concrete Corbels. J. Struct. Eng. 1994, 120, 1182–1201. [Google Scholar] [CrossRef] [Scilit]
  84. Hwang, S.; Lee, H. Analytical Model for Predicting Shear Strengths of Interior Reinforced Concrete Beam-Column Joints for Seismic Resistance. ACI Struct. J. 2000, 97, 35–44. [Google Scholar] [CrossRef] [Scilit]
  85. Aladsani, M.; Burton, H.; Abdullah, S.; Wallace, J. Explainable Machine Learning Model for Predicting Drift Capacity of Reinforced Concrete Walls. ACI Struct. J. 2022, 119, 191–204. [Google Scholar] [CrossRef] [Scilit]
  86. Feng, D.; Mangalathu, S.; Jeon, J.; Lee, J. Interpretable Machine Learning for Plastic Hinge Length and Shear Strength of Squat RC Walls. Eng. Struct. 2021, 244, 112763. [Google Scholar]
  87. Bažant, Z. Size effect in blunt fracture: Concrete, rock, metal. J. Eng. Mech. 1984, 110, 518–535. [Google Scholar] [CrossRef] [Scilit]
  88. Bažant, Z. Concrete fracture models: Testing and practice. Eng. Fract. Mech. 2002, 69, 165–205. [Google Scholar] [CrossRef] [Scilit]
  89. Riverbank Computing. PyQt. 2024. Available online: https://www.riverbankcomputing.com/software/pyqt/ (accessed on 31 May 2026).
Figure 1. Structured workflow for ML-driven shear strength prediction of RC corbels.
Make 08 00160 g001
Figure 2. Schematics of the main design parameters for RC corbels.
Make 08 00160 g002
Figure 3. Histograms of the final features and output of the predictive model, where the blue bars represent the frequency distribution (left y-axis) and the red line represents the kernel density estimate (right y-axis).
Make 08 00160 g003
Figure 4. Cross-validation outcomes, detailing (a) coefficient of determination ( R 2 ) and (b) root mean square error (RMSE).
Make 08 00160 g004
Figure 5. Histograms of prediction errors for evaluating model bias and variance.
Make 08 00160 g005
Figure 6. XGBoost grid-search results for corbels.
Make 08 00160 g006
Figure 7. Relation between tested and predicted shear capacities.
Make 08 00160 g007
Figure 8. (Color) Global interpretations of XGBoost model by SHAP values: (a) SHAP feature importance; and (b) SHAP summary plot.
Make 08 00160 g008
Figure 9. (Color) SHAP dependence plots illustrating marginal feature effects and interactions for: (a) cross-sectional dimension b w d , color-coded by concrete compressive strength f c ; (b) shear span-to-depth ratio a / d , color-coded by longitudinal reinforcement index ρ s f y / f c ; (c) transverse reinforcement index ρ t f y t / f c , color-coded by normalized axial load N u c / ( b w d f c ) ; and (d) concrete compressive strength f c , color-coded by cross-sectional dimension b w d .
Make 08 00160 g009
Figure 10. (Color) Local explanation by SHAP values of selected samples: (a) Specimen C2 by Lu et al. [79]; and (b) Specimen C49STR by Mangat and Halabi [80]. Red arrows represent features that increase the model’s prediction (positive SHAP values), while blue arrows represent features that decrease the prediction (negative SHAP values). The SHAP force plots are original visualizations generated by the author from the XGBoost model implemented in this study; the cited references identify only the source of the specimens used as inputs.
Make 08 00160 g010
Figure 11. Dispersion of predicted shear strength for different values of f c : (a) ACI (318-25) [5]; (b) Solanki and Sabnis [34], (c) Hagberg [35]; (d) Foster et al. [36]; (e) Russo et al. [10]; and (f) Final XGBoost model. The dispersion plots are original visualizations generated by the author; the cited references provide the analytical model equations that were reproduced and evaluated by the author on the dataset.
Make 08 00160 g011
Figure 12. Software architecture and implementation.
Make 08 00160 g012
Table 1. Comparison of experimental and calculated load-carrying capacities of corbels in the database using different methods.
MethodR2RMSEMARDD10%
ACI (318-25) [5]0.17335.690.541.56
Solanki and Sabnis [34]0.60232.830.379.75
Hagberg [35]0.49261.940.3810.14
Foster et al. [36]0.32304.610.485.65
Russo et al. [10]0.34300.170.429.94
Current study0.9855.100.0486.16
Table 2. Descriptive statistics for the database and key features.
FeatureUnitMeanStdMax.Min.
Input 1: b w d mm27.86 × 1045.03 × 1043.36 × 1051.41 × 104
Input 2: f c MPa39.59119.054132.00014.548
Input 3: a / d 0.5230.3271.6930.114
Input 4: ρ s f y / f c 0.1270.1060.6288.23 × 10−3
Input 5: ρ t f y t / f c 0.0170.0340.2840.000
Input 6: N u c / ( b w d f c ) 6.52 × 10−51.69 × 10−41.10 × 10−30.000
Output: V u / ( b w d f c ) 0.1660.0700.4280.027
Table 3. Training performance metrics and cross-validation statistics (log scale).
ModelR2RMSEMARDD10%
RandomForest0.755 ± 0.10.227 ± 0.0950.095 ± 0.06161.4 ± 6.0
AdaBoost0.642 ± 0.00.279 ± 0.1300.130 ± 0.04747.7 ± 5.1
SVR0.716 ± 0.00.248 ± 0.1040.104 ± 0.05858.4 ± 9.2
XGBoost0.760 ± 0.00.226 ± 0.0940.094 ± 0.06464.2 ± 7.7
Table 4. Training and testing performance metrics of the optimized XGBoost model.
Data SetR2RMSEMARDD10%
Training0.98440.0777
Testing0.971100.1556
Table 5. SHAP values for the local explanation of selected samples.
SamplePredictionsExperimentalSHAP Values
V pre ln [ V u / ( b w d f c ) ] V test ln [ V u / ( b w d f c ) ] b w d f c a v / d ρ s f y / f c ρ t f y t / f c N u c / ( b w d f c )
C2570.7−1.986562.3−2.001−0.001−0.009−0.0330.0020.0020.012
C49STR658.9−1.754540.0−1.9530.039−0.003−0.019−0.0240.0030.011
Disclaimer/Publisher’s Note: The statements, opinions and data contained in all publications are solely those of the individual author(s) and contributor(s) and not of MDPI and/or the editor(s). MDPI and/or the editor(s) disclaim responsibility for any injury to people or property resulting from any ideas, methods, instructions or products referred to in the content.