
Article

Lack of Evidence for Well-Separated Clinical Phenotypes in Surgically Treated Infective Endocarditis Using Routine Clinical Variables: A Machine Learning Approach

1
Cardiovascular Department, Maria Cecilia Hospital, GVM Care & Research, 48033 Cotignola, RA, Italy
2
Division of Cardiac Surgery, Department of Advanced Biomedical Sciences, University of Naples “Federico II”, 80138 Naples, NA, Italy
3
Department of Experimental Diagnostic and Surgical Medicine (DIMEC), University of Bologna, 40126 Bologna, BO, Italy
*
Author to whom correspondence should be addressed.
Mach. Learn. Knowl. Extr. 2026, 8(6), 154; https://doi.org/10.3390/make8060154
Submission received: 12 May 2026 / Revised: 21 May 2026 / Accepted: 31 May 2026 / Published: 4 June 2026
(This article belongs to the Section Learning)

Abstract

Background: Infective endocarditis (IE) is characterized by marked heterogeneity in microbiological etiology, clinical presentation, valvular involvement, and patient complexity, which complicates risk stratification. Unsupervised machine learning has been proposed to identify latent clinical phenotypes in complex diseases; however, whether IE exhibits a natural cluster structure remains unclear. Methods: In a cohort of 739 patients undergoing surgery for IE, unsupervised clustering was performed using K-medoids based on Gower distance to account for mixed-type variables, which is a common scenario in clinical settings. The optimal number of clusters was selected by maximizing the average silhouette width and the gap statistic. Density and semi-parametric algorithms (K-prototypes, KAMILA, hierarchical clustering, and HDBSCAN) were applied as a sensitivity analysis. Differences in postoperative outcomes across clusters were explored using logistic regression. Results: K-medoids clustering identified three patient groups; however, the average silhouette width was low (0.129), indicating very weak separation between clusters. Sensitivity analysis confirmed the absence of a natural cluster structure. Despite this, a descriptive comparison of forced clusters revealed a gradient of clinical severity, with one group characterized by older age, higher comorbidity burden, complex infection features, and worse postoperative outcomes. Conclusions: Unsupervised clustering did not identify natural clinical phenotypes in surgically treated IE, likely reflecting the extreme intrinsic heterogeneity of the disease. Although forced clustering highlighted clinically interpretable gradients of risk, these groups should not be considered true latent phenotypes. Alternative approaches, such as continuous risk modeling, may be more appropriate for patient stratification in IE.

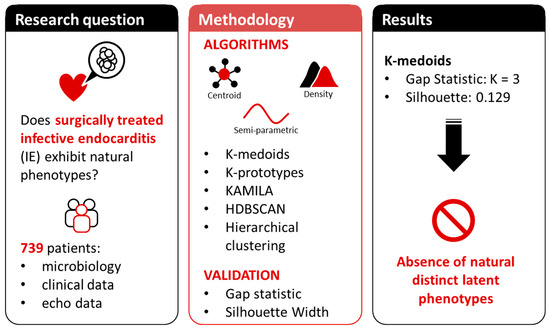
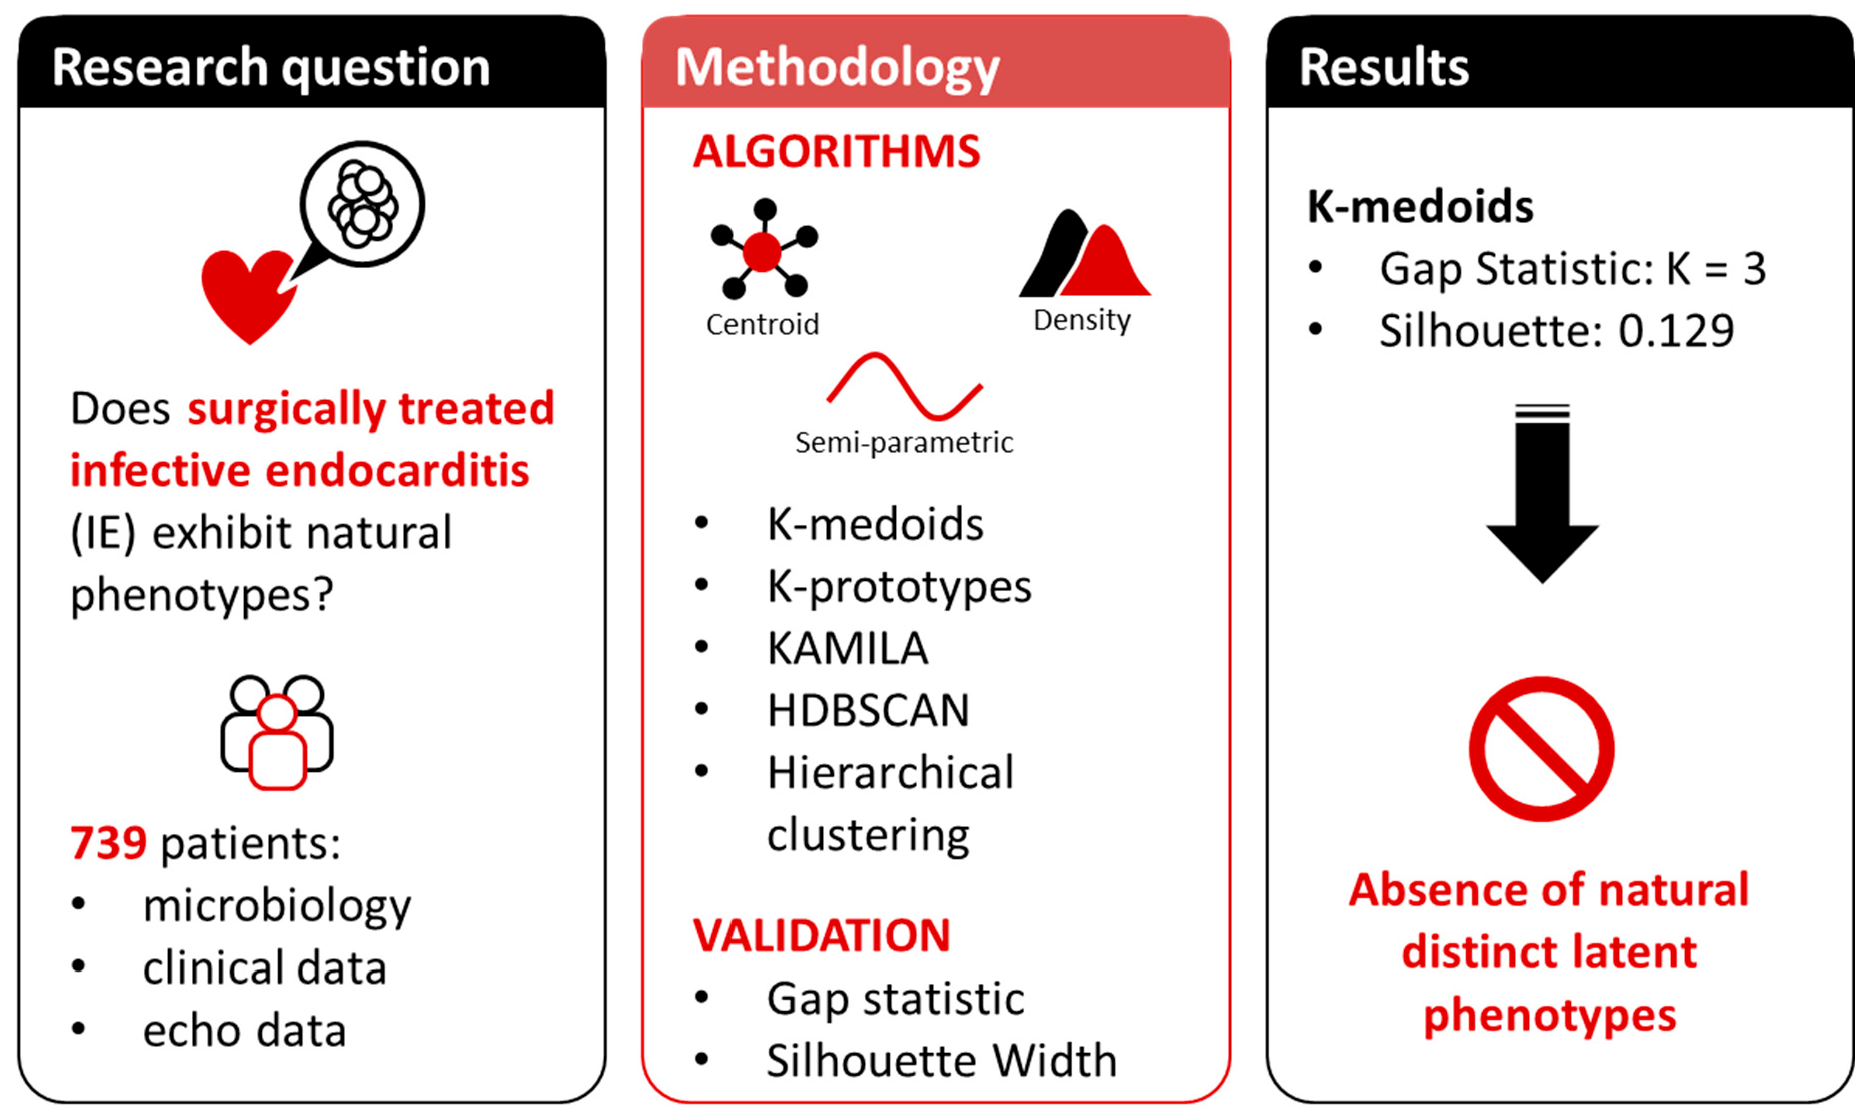
Graphical Abstract

1. Introduction

Infective endocarditis (IE) is a complex inflammatory disease of the endocardium that primarily affects native or prosthetic heart valves and intracardiac devices [1]. The infectious process may extend beyond valvular leaflets to involve adjacent cardiac structures, including the interventricular septum, chordae tendineae, mural endocardium, and the sinuses of Valsalva [2]. Despite advances in antimicrobial therapy and perioperative management, IE continues to be associated with substantial morbidity and mortality [3]. A major surgical challenge is infection of the cardiac fibrous skeleton, which provides structural support to the heart valves. Abscess formation with destruction of the intervalvular fibrosa disrupts mitro-aortic continuity, rendering isolated valve replacement insufficient and necessitating radical debridement and complex reconstruction [4]. Consequently, surgical strategies range from isolated valve replacement to highly complex procedures reconstructing the mitro-aortic continuity [5]. In addition to anatomical variability, clinical presentation ranges from stable conditions to critically ill patients with septic or cardiogenic shock. This marked heterogeneity complicates risk stratification in surgically treated IE. Machine learning techniques are increasingly applied in medicine and cardiac surgery to improve risk assessment [6], yet their use in IE—particularly for identifying latent clinical phenotypes—remains limited [7,8,9].
Previous research has increasingly explored the application of unsupervised machine learning in complex cardiovascular diseases, aiming to identify latent patient phenotypes and uncover patterns not captured by traditional risk scores. In the context of IE, Donal et al. [7] performed data-driven analyses to support surgical decision-making during the acute phase, highlighting the potential of machine learning to reveal hidden risk profiles. Kang et al. [8] applied machine learning and deep learning–based causal inference models to assess the impact of blood culture positivity at ICU admission on mortality, demonstrating that multidimensional data integration can enhance prognostic insights. Ten Hove et al. [9] utilized unsupervised learning to improve diagnostic accuracy for prosthetic valve endocarditis, emphasizing the capacity of these methods to identify subtle clinical patterns from imaging and laboratory data. Further contributions include Zi-Yang et al. [10], who integrated four machine learning-based models (LASSO logistic regression, random forest, support vector machine, and k-nearest neighbors) to predict in-hospital and six-month mortality in IE patients. Random forest was ultimately identified as the model with the highest predictive accuracy, offering valuable insights into the variables most critical for risk assessment. More broadly, as highlighted in the recent review by Odat et al. [11], artificial intelligence and machine learning are increasingly applied in IE management, improving postsurgical mortality prediction, diagnostic accuracy for prosthetic valve infections, and biomarker-based risk assessment. Collectively, these studies suggest that unsupervised learning can complement traditional risk scores and offer a nuanced understanding of patient heterogeneity.
Accordingly, we applied an unsupervised clustering approach integrating demographic, laboratory, and echocardiographic data to investigate whether natural clinical phenotypes exist among surgically treated IE patients and to explore associations with preoperative risk profiles and subsequent postoperative mortality. In the setting of marked clinical, anatomical, and surgical heterogeneity, this study aimed to critically assess whether surgically treated infective endocarditis exhibits a natural cluster structure. Furthermore, we evaluated the clinical relevance, interpretability, and outcome associations of any identified groups using routinely collected information.

2. Materials and Methods

The study population consisted exclusively of patients who underwent cardiac surgery for infective endocarditis at our institution between 2010 and 2025, representing a selected subgroup of IE patients, typically with more severe disease or specific surgical indications. Although this may limit the generalizability of the findings to the broader IE population, this relative clinical homogeneity reduces variability unrelated to disease phenotype, allowing a more precise assessment of potential clustering patterns. Diagnosis of IE was established according to the Modified Duke Criteria, and only patients with ‘definite’ IE were included in the current analysis. As this is a surgical cohort, patients who were deemed too clinically unstable to undergo surgery or who died prior to transfer to the operating room were excluded. No EuroSCORE cutoff was used to deny surgery. Importantly, the clinical variables included in the clustering analysis were derived from routinely available data, encompassing demographic characteristics (age and sex); comorbidities (hypertension, diabetes, obesity, chronic obstructive pulmonary disease, peripheral artery disease, neurological disorders, chronic kidney disease, dialysis, and permanent pacemaker); preoperative clinical status (left ventricular ejection fraction, cardiogenic or septic shock, heart failure, previous myocardial infarction, active endocarditis, need for mechanical ventilation, intra-aortic balloon pump, number of days from symptom onset to surgery, logistic EuroSCORE, and redo surgery); and microbiological and echocardiography data (negative blood cultures, pathogen type, presence of abscess, vegetations, leaflet perforation, prosthetic detachment, and the type of valve involved). Variables potentially relevant for phenotypic characterization—such as prior antibiotic exposure or antibiotic resistance—were not available. After checking for normal distribution using the Shapiro–Wilk test, continuous variables were reported as median and interquartile range (IQR) and compared using the Kruskal–Wallis test; categorical variables were reported as absolute numbers and percentages and compared using the chi-squared test or Fisher’s exact test, as appropriate. Clustering of mixed-type data (i.e., including both continuous and categorical variables, which is a common scenario in clinical settings) poses methodological challenges. Many classical algorithms—such as k-means and fuzzy clustering—are inherently limited to continuous variables and require arbitrary transformations of categorical data. To identify clinically meaningful latent phenotypes without introducing artificial distortions, we therefore used k-medoids clustering (cluster package version 2.1.8.1) based on Gower distance (via the daisy package), which allows the direct integration of heterogeneous variables; importantly, this metric internally performs range scaling [0, 1] for all continuous variables, ensuring that no feature dominates the clustering due to its measurement scale [12]. The optimal number of clusters was defined by the maximum average silhouette width [13] and the maximum gap statistic (computed via 50 bootstrap iterations) [14] (factoextra package version 1.0.7). As a sensitivity analysis, density and semiparametric algorithms were also considered: HDBSCAN [15] (dbscan package version 1.2.3), k-prototypes [16] (clustMixType package version 0.4.2), KAMILA (KAymeans for MIxted LArge data) [17] (kamila package version 0.1.2), and hierarchical clustering with Ward’s method were also performed; unlike other linkage methods, Ward’s approach explicitly aims to minimize intra-cluster variance, providing the most favorable conditions for identifying compact spherical groups. For HDBSCAN, the minimum cluster size was set at 5 (dbscan package with minPts = 5) to identify even small, dense clinical subgroups while accounting for the significant noise expected in such a heterogeneous cohort. For visualization of the HDBSCAN results, a three-dimensional embedding of the dissimilarity matrix was obtained using t-distributed stochastic neighbor embedding (t-SNE) (Rtsne package version 0.17). Logistic regression analyses were performed to assess differences in in-hospital complications between clusters. Cluster membership was included as the only independent variable, as clusters were intended to represent composite clinical phenotypes rather than individual risk factors. As the purpose of the analysis was not prediction but the estimation of between-cluster differences in outcome risk, discrimination and calibration metrics, which are relevant for predictive modeling, were not considered appropriate in this context. Missing data were imputed prior to clustering and outcome analyses using a single random forest imputation for categorical variables and predictive mean matching for continuous variables. The imputation was performed with 100 trees and 5 iterations, using predictive mean matching with k = 4 to ensure realistic values for continuous variables (missRanger package version 2.6.1) [18]; in particular, missingness was 8.0% for days from symptom onset to surgery, 7.2% for pathogen, 0.7% for LVEF, and 0.5% for EuroSCORE. All analyses were performed using R version 4.5.0 (R Foundation for Statistical Computing, Vienna, Austria); a two-sided p-value < 0.05 was considered statistically significant.

3. Results

3.1. Cluster Identification

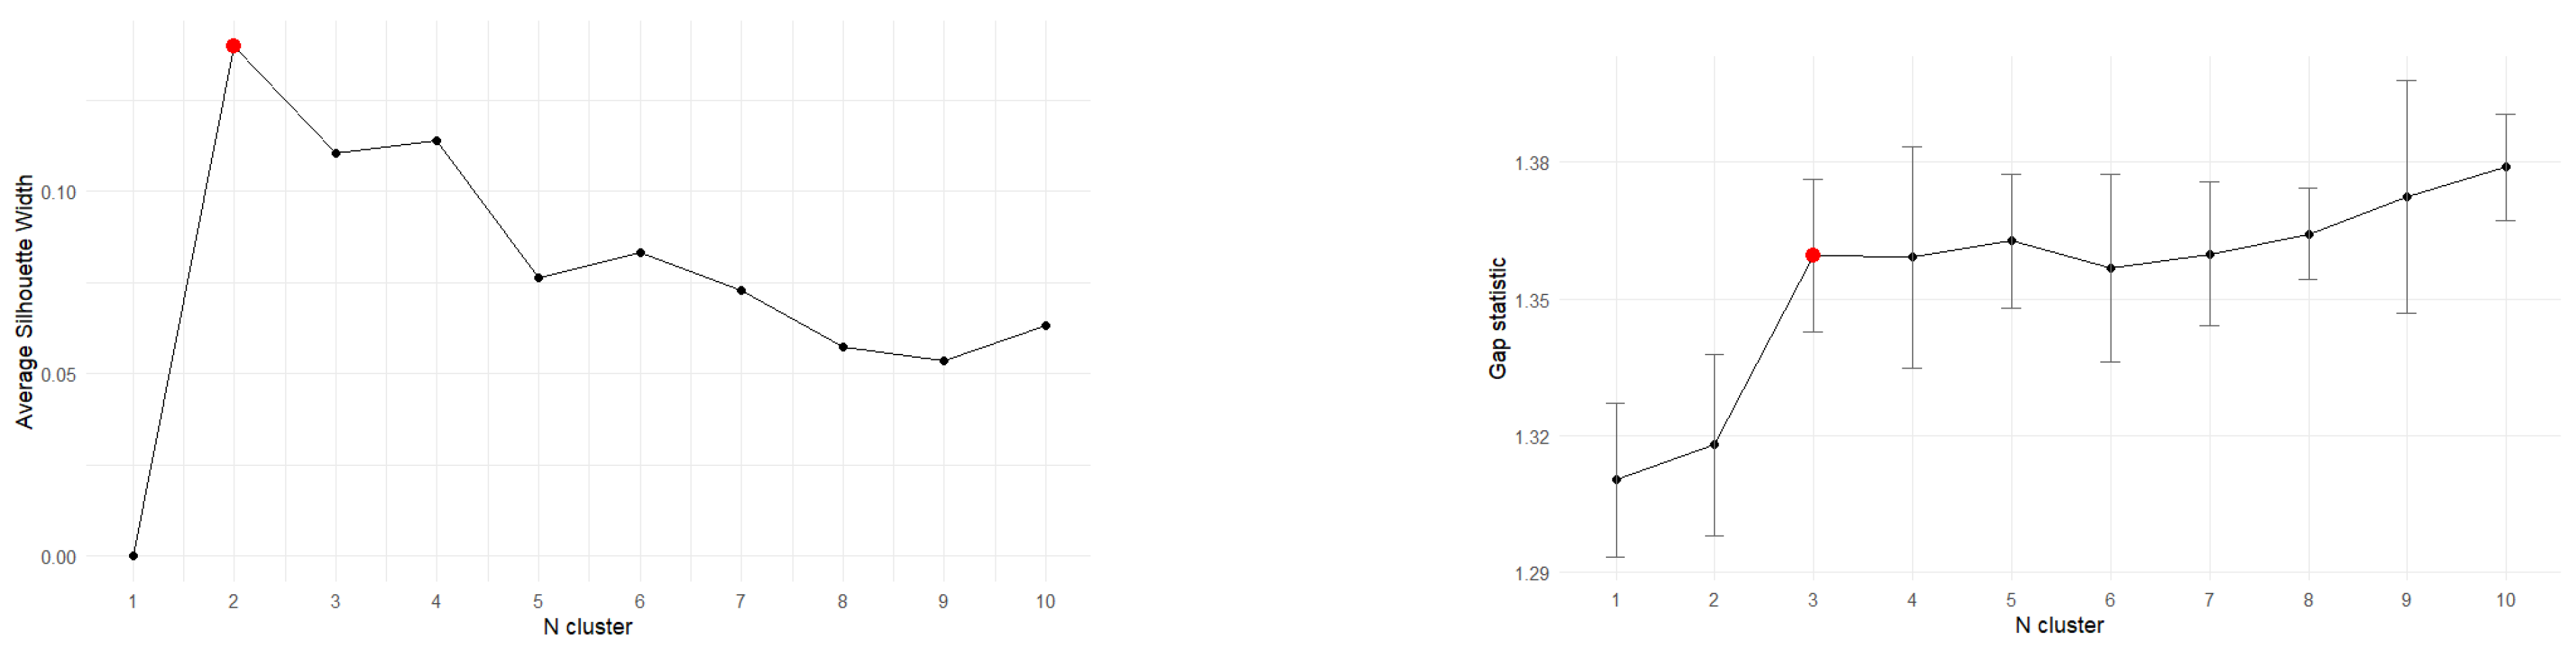
Unsupervised clustering using K-medoids based on Gower distance was applied to a cohort of 739 patients with infective endocarditis. K-medoids was chosen due to its robustness to outliers and suitability for mixed-type data. The optimal number of clusters was determined by maximizing the average silhouette width, which suggested a solution with three clusters. However, the corresponding silhouette value was low (0.129), indicating very weak separation and poor internal cohesion among clusters. While a silhouette width above 0.50 is traditionally considered an indicator of stable partitioning, clinical datasets are highly context-dependent. Nevertheless, the extremely low values observed here strongly suggest the absence of a distinct structural separation. In the clustering literature, it is widely recognized that K-Medoids often yields lower Silhouette coefficients compared to other algorithms. This is primarily due to the medoid constraint, which requires cluster centers to be actual data points rather than geometric centroids. While this may result in slightly less compact clusters, it ensures greater robustness to outliers. Consequently, K-Medoids often produces more realistic partitions in noisy datasets, even if these are technically penalized by distance-based metrics like the Silhouette coefficient. Excluding the k = 1 solution (which corresponds to no cluster separation), the gap statistic consistently identified 3 clusters as the optimal number (Figure 1).
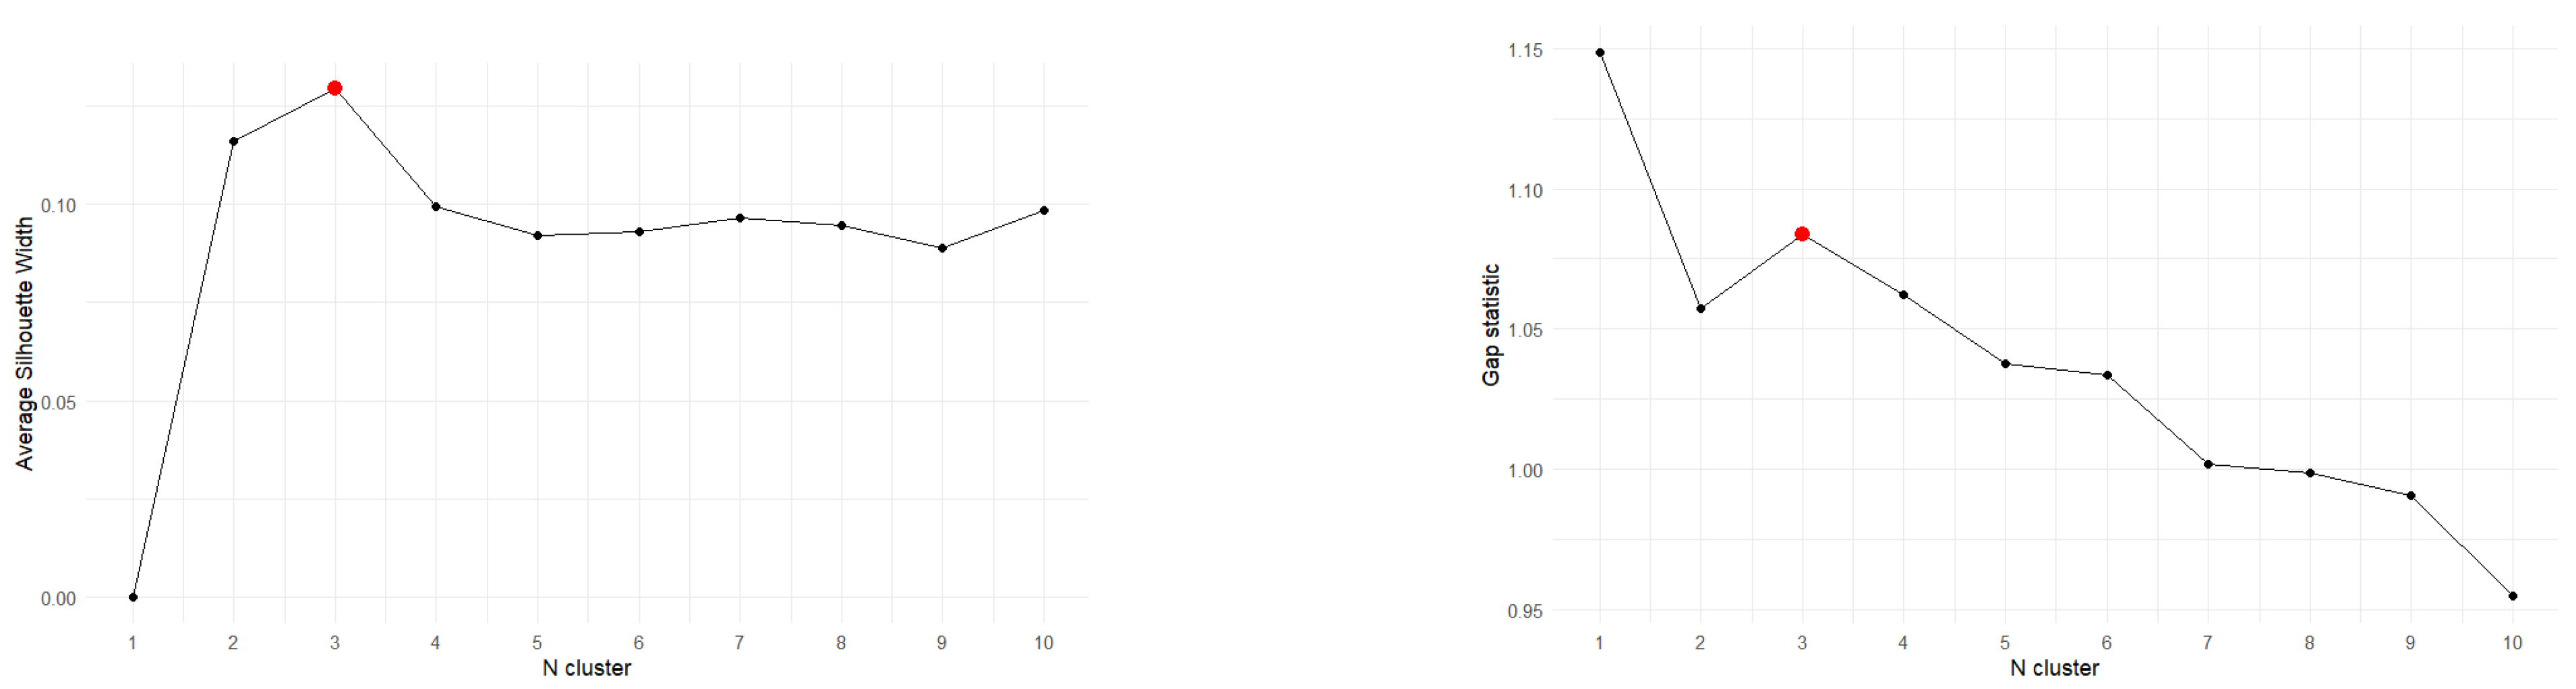
Using the k-prototypes algorithm and maximizing the average silhouette width as the selection criterion, two clusters were identified as the optimal solution. However, the corresponding silhouette value was similarly low (0.133), indicating weak separation and limited internal cohesion among clusters. The gap statistic showed a continuous increase, suggesting high heterogeneity with many small, distinct subgroups of patients. Rather than a natural number of well-defined clusters, these results indicate a continuous gradient of clinical severity. Following the “First Non-Significant Increase” rule [14] and clinical interpretability, the optimal partition seemed to select 3 clusters, in agreement with PAM (Figure 2).
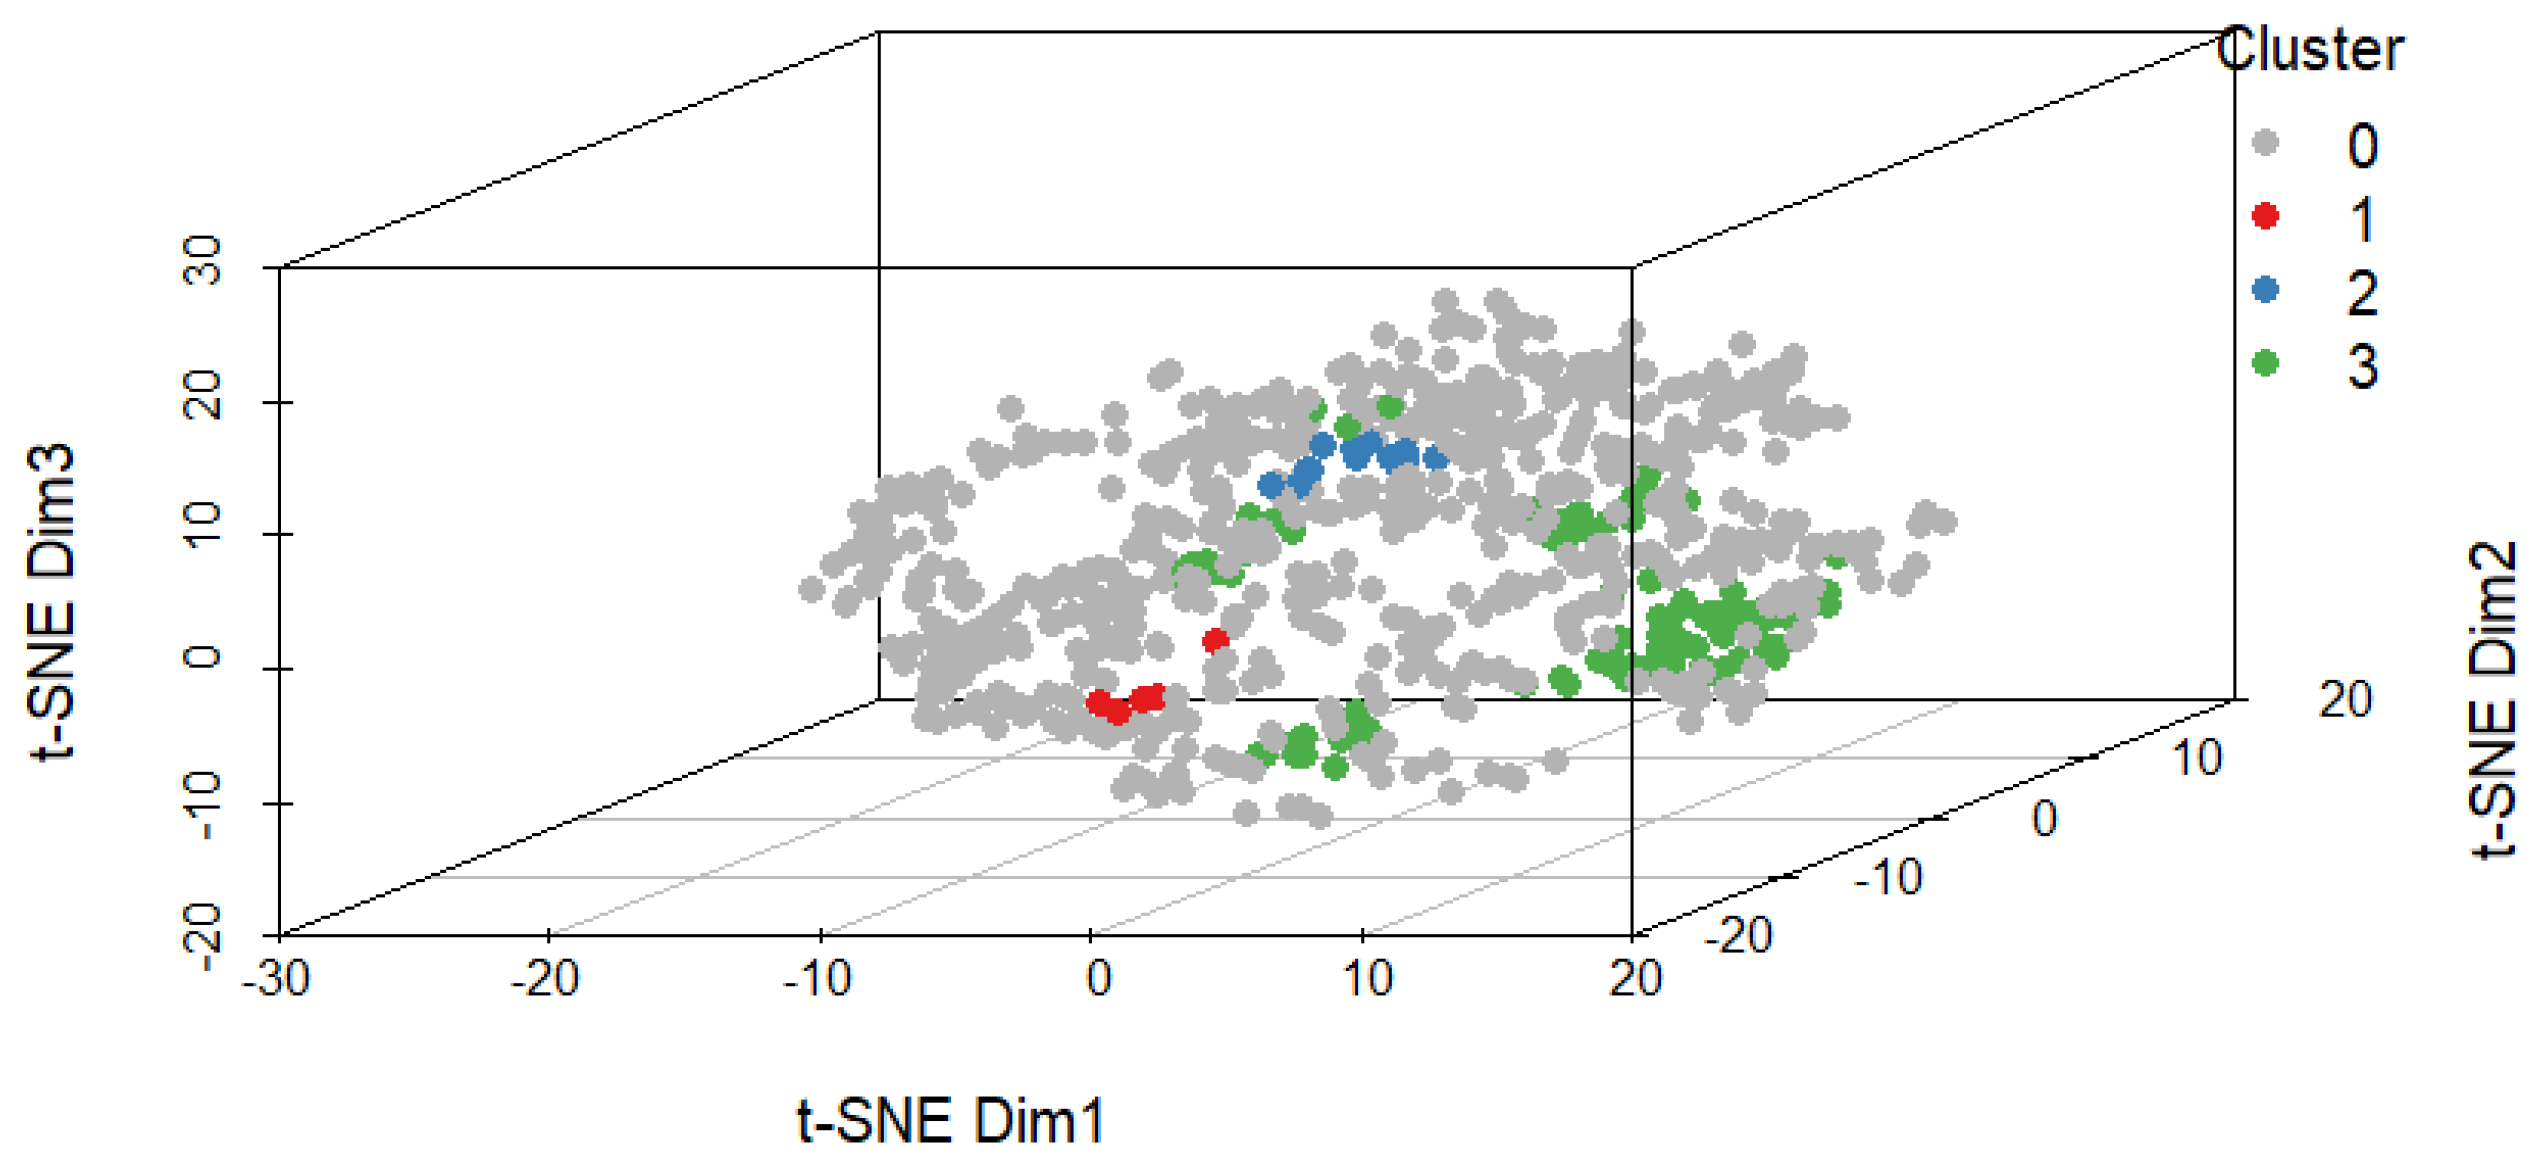
The application of the KAMILA algorithm yielded a maximum average silhouette width of 0.165, indicating a negligible cluster structure. Furthermore, the Gap Statistic analysis failed to converge for k > 1, demonstrating that the within-cluster dispersion in our dataset does not significantly differ from a null uniform distribution. These findings collectively suggest that patients exist along a phenotypic continuum rather than within discrete, separable categories. To assess the robustness of these findings, a sensitivity analysis using the density-based HDBSCAN algorithm was performed. HDBSCAN identified four groups, including a large proportion of points classified as noise (cluster 0, 507/739, 68.8%) (Figure 3). This modest improvement nonetheless confirmed the lack of a well-defined cluster structure.
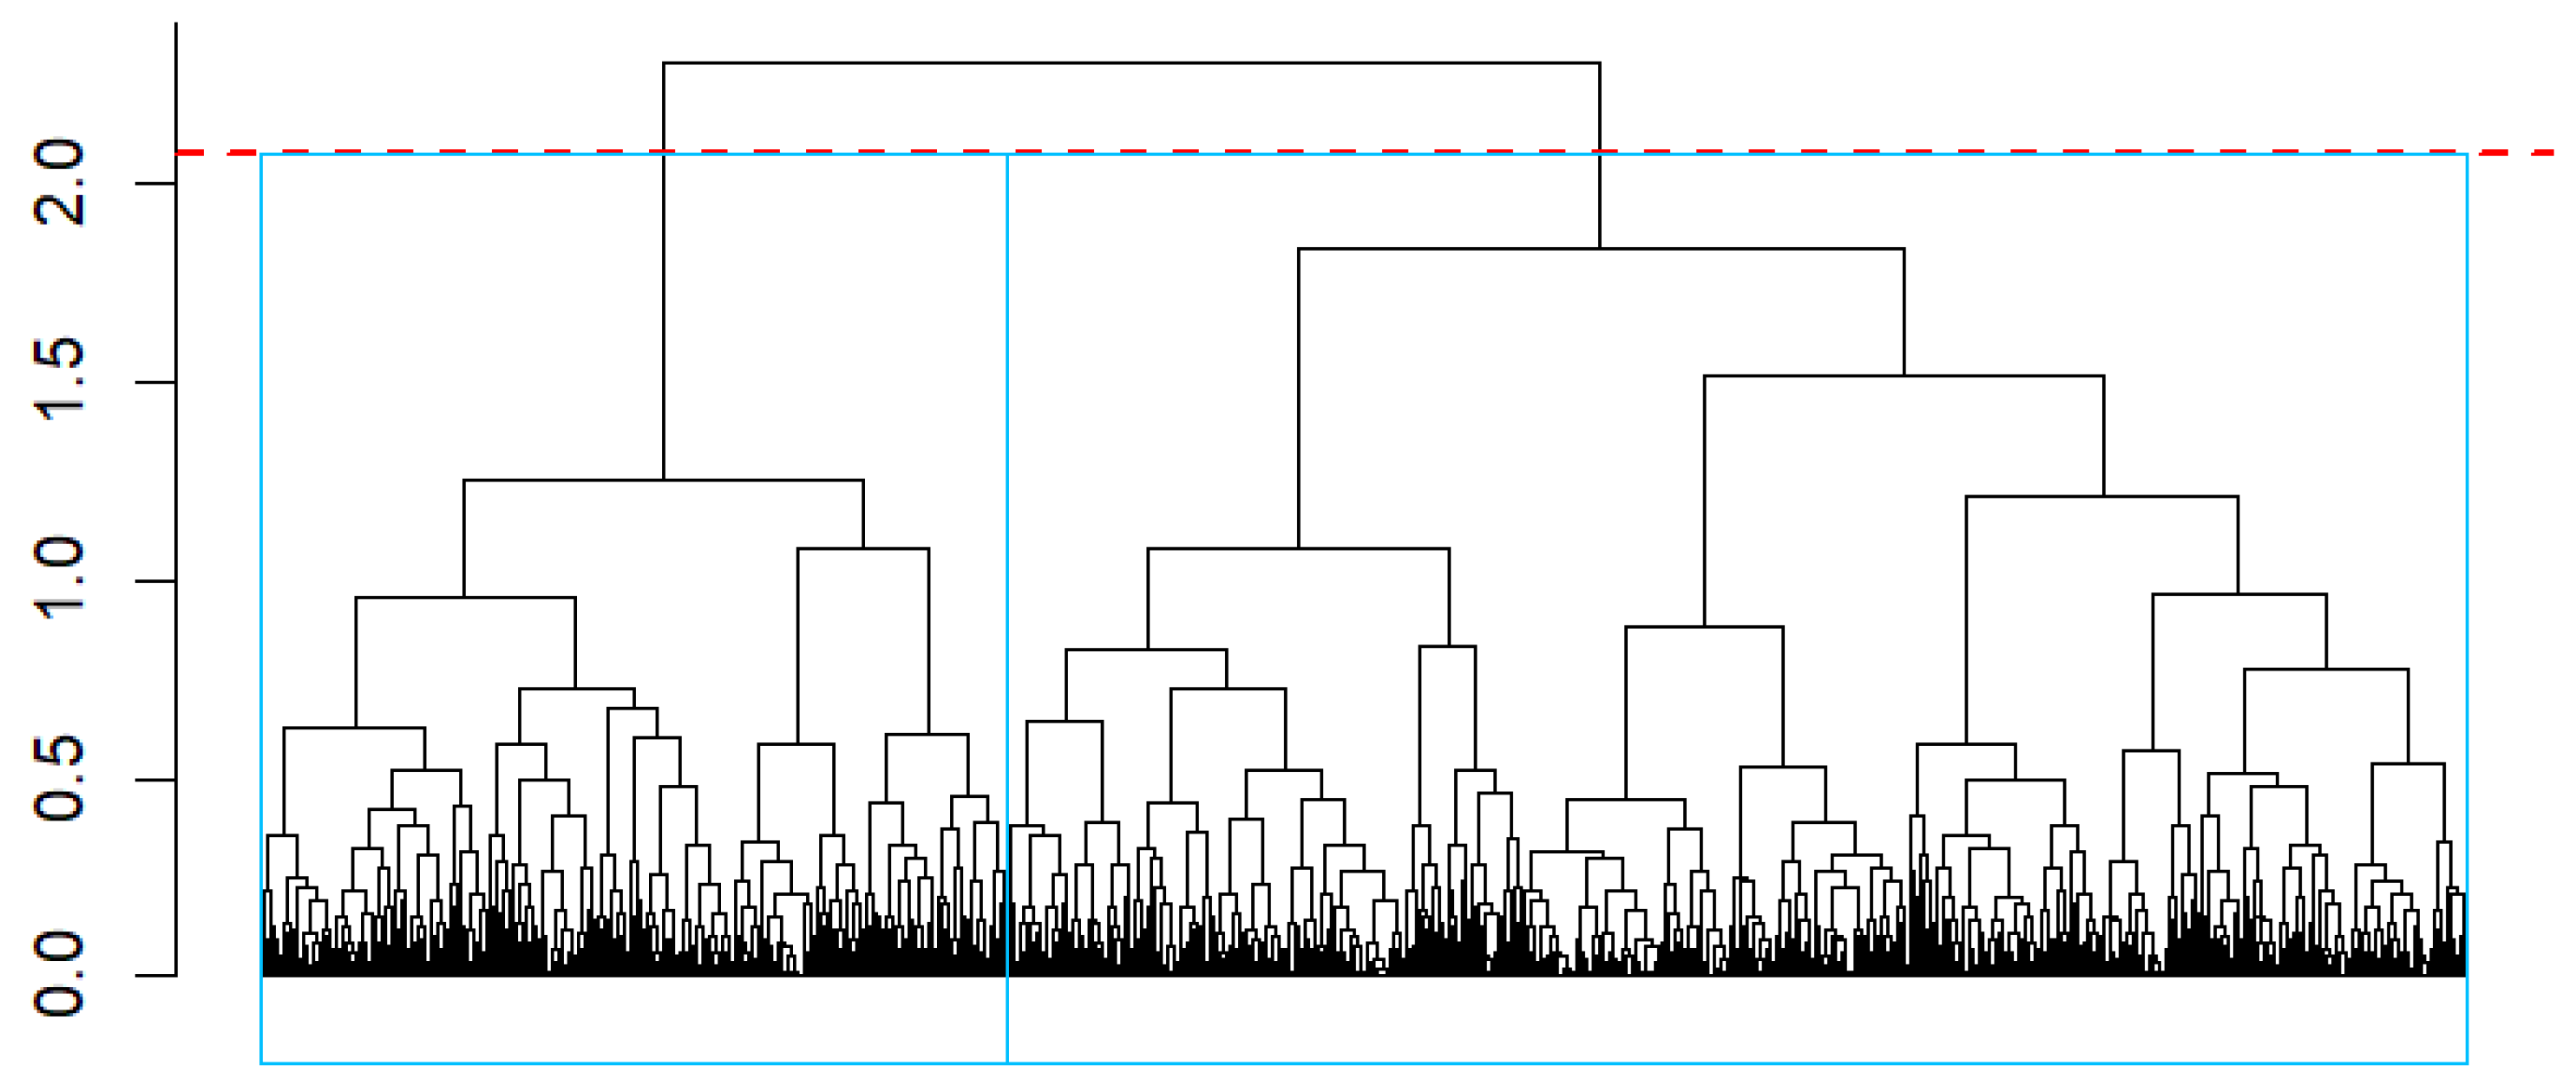
To further investigate the cluster structure, we performed hierarchical agglomerative clustering. The resulting dendrogram (Figure 4) was analyzed to identify the partition by locating the maximum vertical distance between successive nodes. The criterion identified two primary clusters as the most stable solution. While a binary division of the population is mathematically possible, the internal cohesion of these groups is weak, reflecting a clinical continuum rather than a set of discrete, high-confidence latent phenotypes.
Taken together, these results indicate that no natural or well-separated clustering structure is present in this dataset, suggesting that IE patients do not segregate into distinct latent phenotypes based on the available demographic, clinical, and microbiological features.
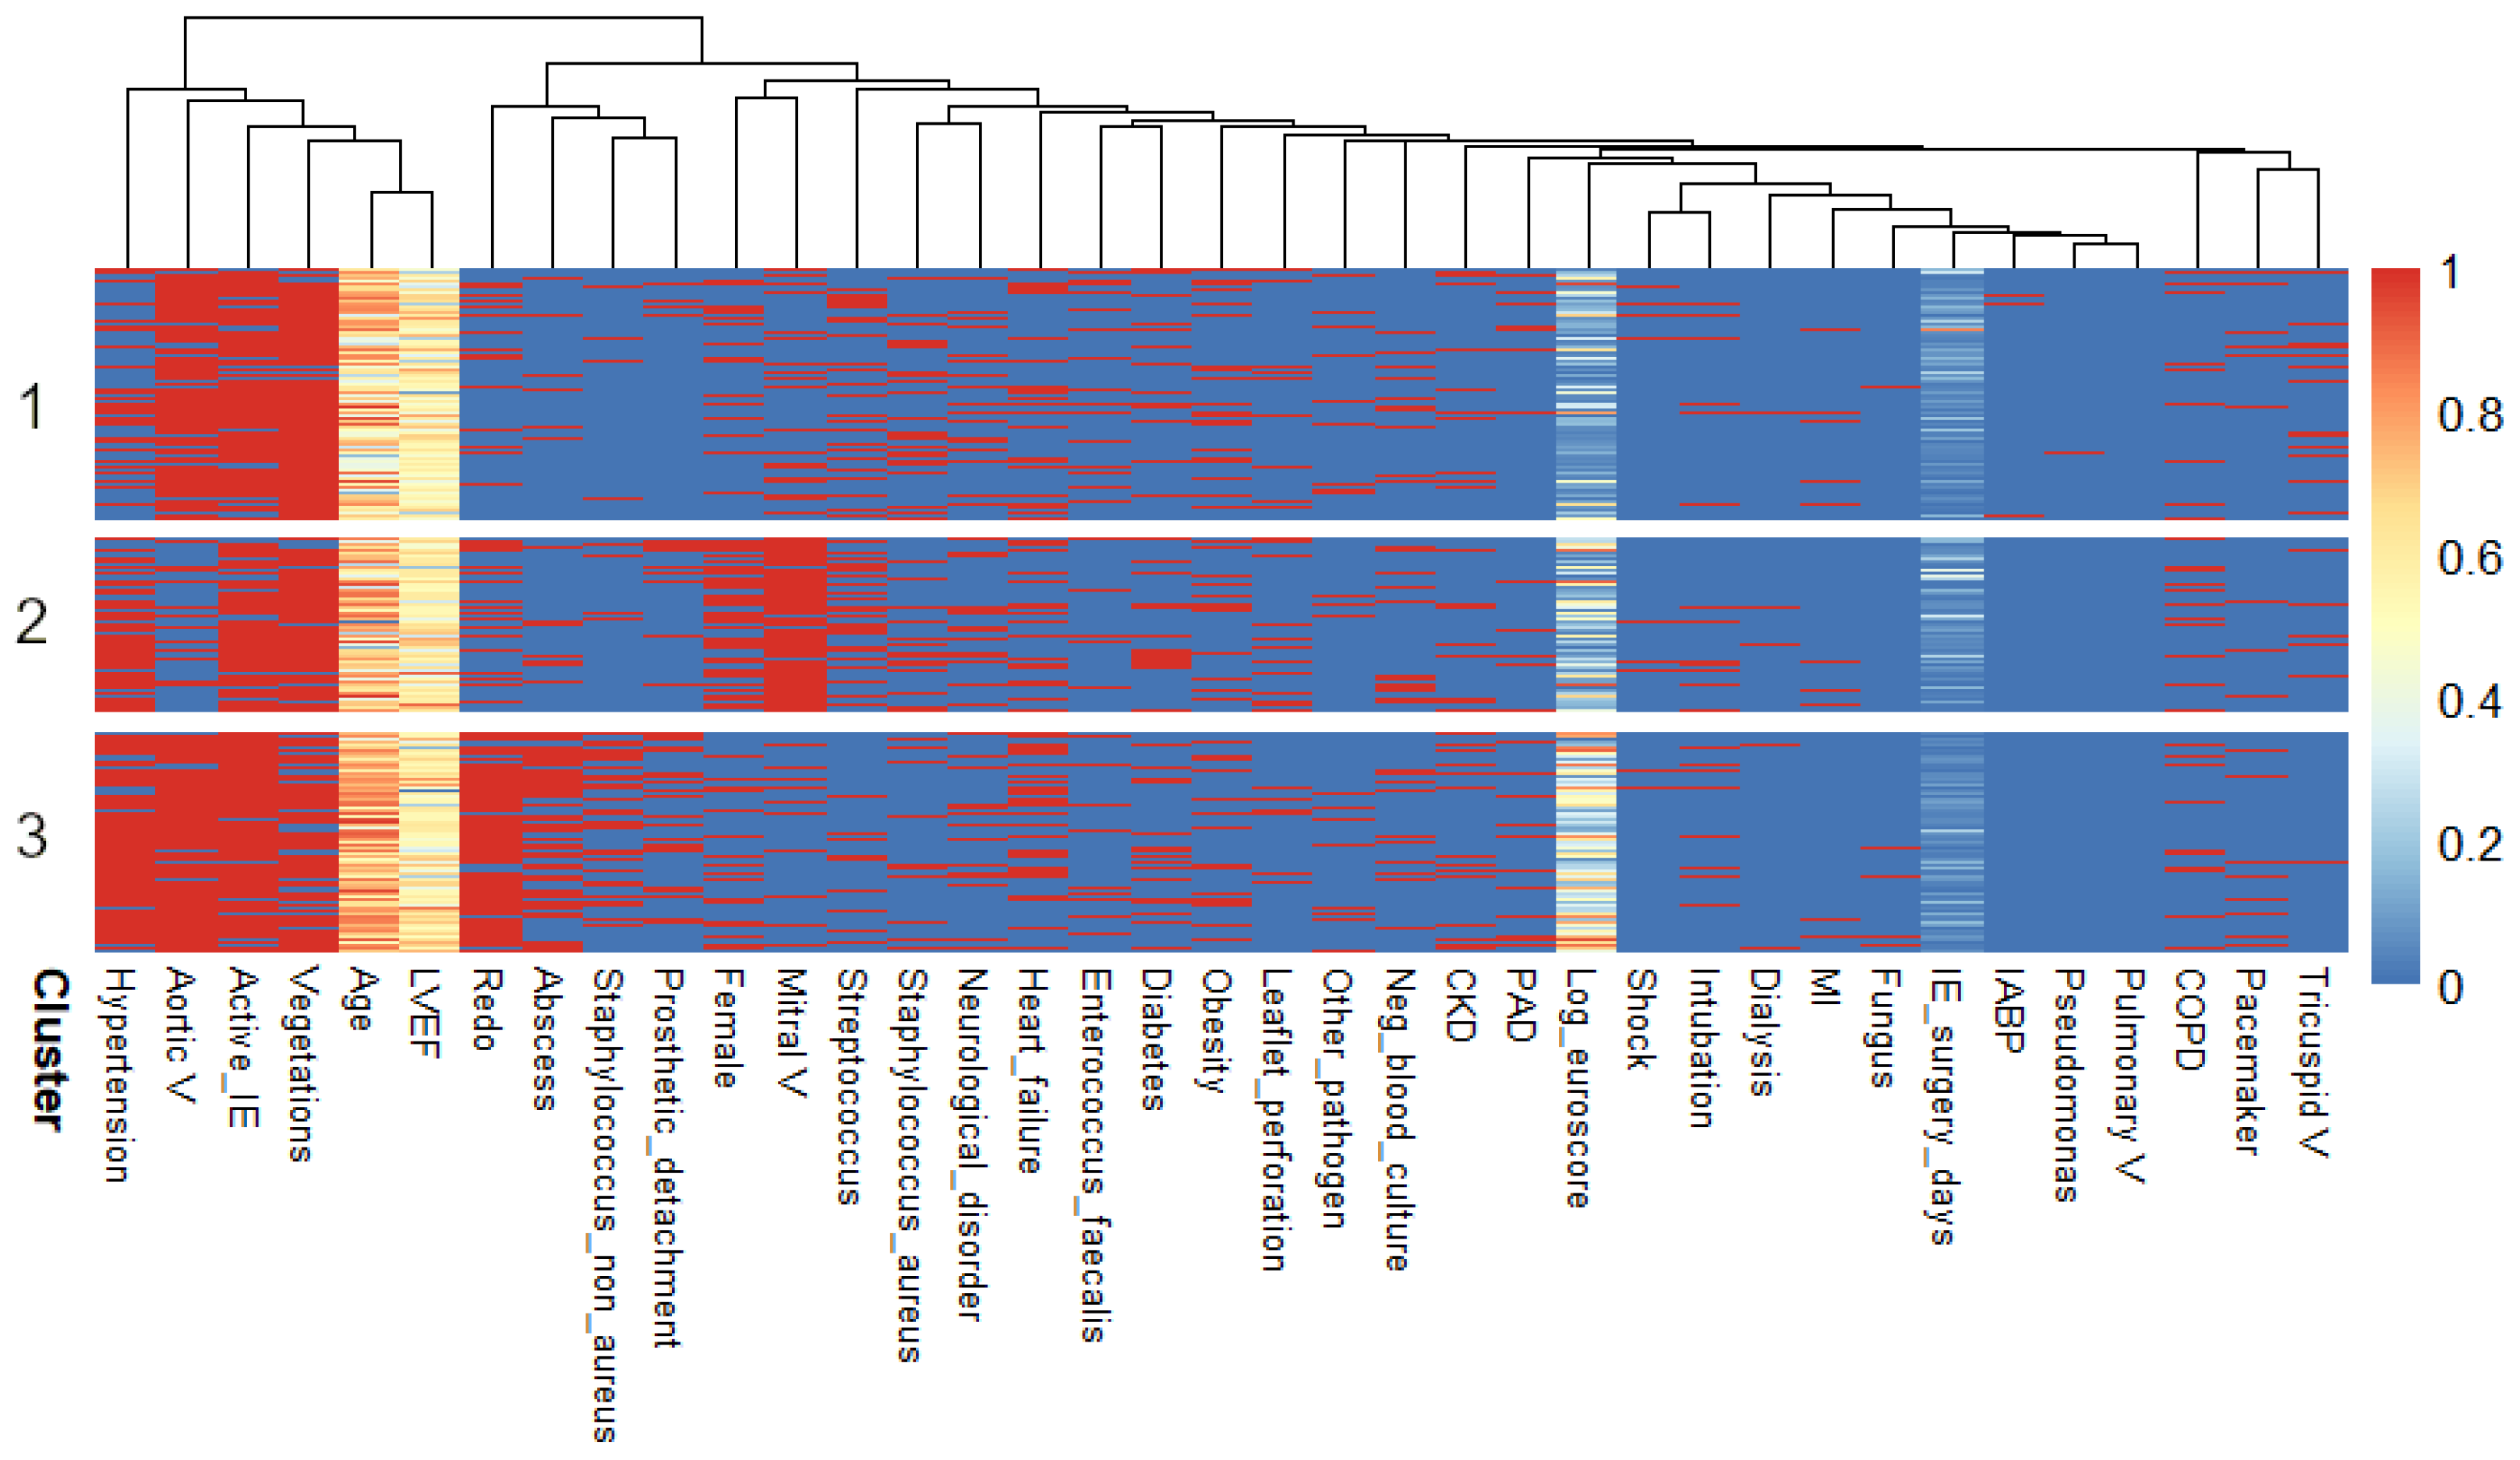
Despite the absence of a natural clustering structure, the forced three-cluster solution was descriptively examined to explore whether clinically interpretable patterns could nonetheless be observed. Cluster sizes were 287, 196, and 256 patients, respectively. Cluster 1 included younger patients with lower comorbidity burden and preserved cardiac function. Cluster 2 was characterized by a higher proportion of female patients and predominant mitral or tricuspid valve involvement. Cluster 3 comprised older patients with greater comorbidity burden, more complex infection features (including abscesses and prosthetic detachment), and more demanding operative profiles (redo surgery, pacemaker presence) (Figure 5). These groups should be interpreted as analytical constructs rather than true latent phenotypes, reflecting gradients of disease severity rather than distinct biological subtypes.

3.2. Baseline Characteristics

Baseline demographics and clinical variables differed significantly across clusters (Table 1). Cluster 1 patients were younger (median age 61 years) and consequently had a low prevalence of hypertension (34.1%) and diabetes (14.3%). Conversely, Cluster 3 patients were older (median age 73 years) with a high burden of comorbidities, including hypertension (87.1%) and redo surgery (91.0%). Cluster 2 displayed intermediate characteristics, with a moderate prevalence of hypertension (75.5%) and diabetes (21.4%) and a high prevalence of female gender (59.7%). Additional differences were observed for chronic kidney disease, pacemaker implantation, and active endocarditis.

3.3. Microbiological Profiles and Infection Characteristics

The clusters exhibited distinct infection patterns (Table 2). Cluster 1 was characterized by a high prevalence of vegetations (92.3%) and infections due to Staphylococcus aureus (23.2%) and Streptococcus species (25.5%), with low rates of abscesses (7.7%) and prosthetic detachment (5.6%). Cluster 2 had increased leaflet perforation (20.4%) and Streptococcus infections (34.4%). Cluster 3 displayed a severe phenotype, with frequent abscesses (64.1%), prosthetic detachment (31.6%), and infections caused by non-aureus Staphylococcus (35.9%).

3.4. Operative Characteristics

Operative variables differed significantly across clusters (Table 3). Cluster 1 patients underwent minimally invasive cardiac surgery (MICS) more frequently (34.1%) and had lower log EuroSCORE values (median 10.46). Cluster 3 patients had the highest surgical risk (median log EuroSCORE 40.19) and longer cardiopulmonary bypass and aortic cross-clamp times (median 131 and 106 min, respectively). Valve involvement reflected the infection phenotype. Specifically, Cluster 2 patients predominantly underwent mitral valve surgery (95.4%), whereas patients in Clusters 1 and 3 mostly underwent aortic valve procedures.

3.5. Postoperative Outcomes

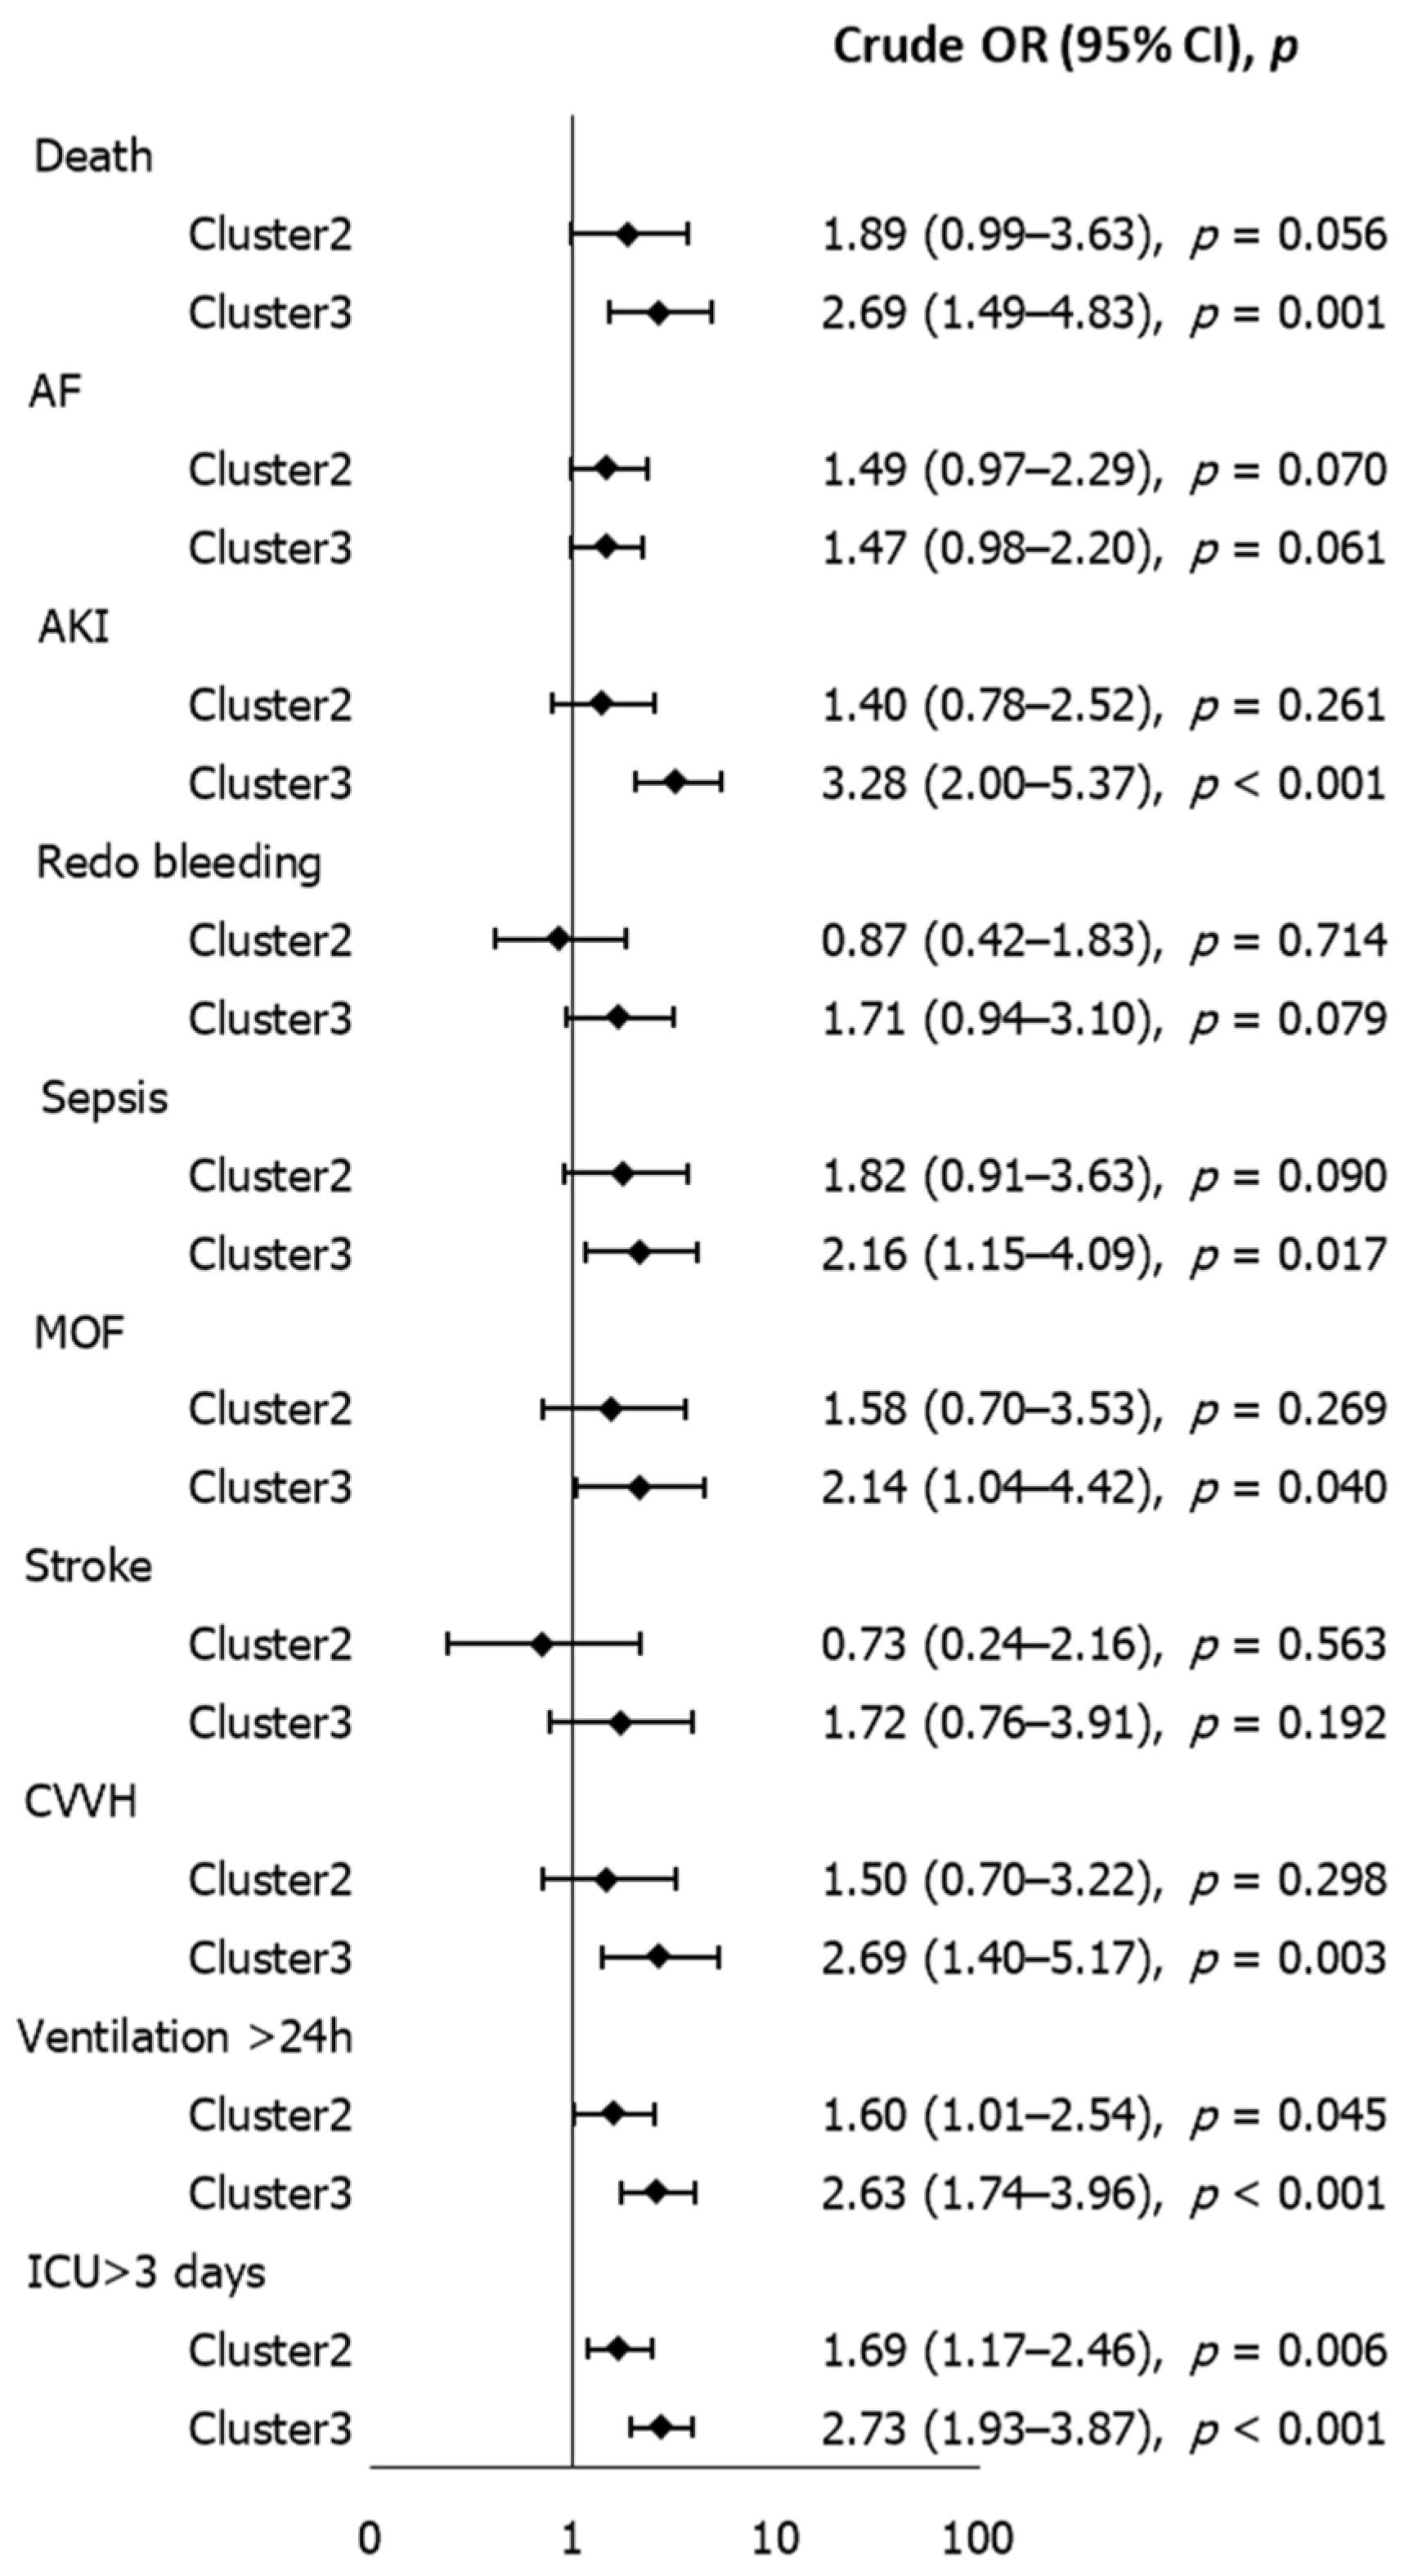
Postoperative complications varied markedly across clusters (Figure 6). In this unadjusted descriptive analysis, Cluster 3 patients exhibited a higher frequency of adverse events compared with Cluster 1. This included higher unadjusted odds of in-hospital death (OR 2.69, 95% CI 1.49–4.83, p = 0.001), acute kidney injury (OR 3.28, 95% CI 2.00–5.37, p < 0.001), sepsis (OR 2.16, 95% CI 1.15–4.09, p = 0.017), need for continuous venovenous hemofiltration (OR 2.69, 95% CI 1.40–5.17, p = 0.003), prolonged ventilation >24 h (OR 2.63, 95% CI 1.74–3.96, p < 0.001), and ICU stay >3 days (OR 2.73, 95% CI 1.93–3.87, p < 0.001). Cluster 2 showed an intermediate profile, with increased unadjusted odds for prolonged ventilation (OR 1.60, 95% CI 1.01–2.54, p = 0.045) and ICU stay >3 days (OR 1.69, 95% CI 1.17–2.46, p = 0.006). Other complications, including atrial fibrillation, redo bleeding, multi-organ failure, and stroke, did not reach statistical significance. These associations reflect the baseline severity gradient of the groups rather than independent prognostic effects.

4. Discussion

The management of surgically treated infective endocarditis (IE) remains highly challenging due to the extreme heterogeneity of the disease, encompassing variations in microbiological etiology, anatomical involvement, host comorbidities, and operative complexity. In this study, we applied various unsupervised clustering techniques to explore whether natural patient phenotypes could be identified in a population undergoing surgical treatment for IE.
Our findings demonstrate that, unlike other cardiovascular conditions, surgically treated IE does not form naturally well-separated clusters. Both partition-based algorithms (K-medoids, K-prototypes, and KAMILA) and density-based approaches (HDBSCAN) yielded very low silhouette values (ranging from 0.13 to 0.17). This should not be viewed as a methodological failure, but rather as a primary finding: it indicates a lack of internal cohesion and weak separation between potential subgroups. This likely reflects the extreme intrinsic heterogeneity of IE, where multiple independent clinical dimensions do not align into discrete, well-separated latent phenotypes.
To ensure the robustness of these results, we utilized the Gower distance, which internally performs range scaling [0, 1] for all continuous variables. This addressed potential biases arising from different measurement scales (e.g., age vs. laboratory values), a point of critical importance in mixed-type data clustering. A methodological concern could be raised regarding the inclusion of our comprehensive set of 31 clinical variables, which might introduce ‘nuisance’ variables or noise that dilutes the clustering signal when using an unweighted Gower distance. However, restricting the feature space a priori to a small subset of heavily weighted, established risk factors would have inevitably ‘forced’ the algorithms to partition patients based solely on those pre-selected predictors. Since our primary objective was to test whether the global, multidimensional profile routinely used by clinicians contains an intrinsic, hidden sub-phenotypic structure, the inclusion of all routine variables without subjective weighting was a deliberate choice. This allowed us to prove that standard electronic health record data—as currently collected—exists on a seamless clinical continuum rather than in discrete latent categories. Furthermore, the application of HDBSCAN revealed that approximately 69% of the cohort was classified as “noise.” This objectively confirms that the majority of IE patients exist within a high-dimensional clinical continuum rather than belonging to dense, recurring phenotypic kernels. Consequently, while the forced 3-cluster solution revealed gradients in operative complexity and disease severity, these should be interpreted as imposed descriptive divisions (a “severity gradient”) rather than true biological or clinical “discoveries.”
These findings suggest that unsupervised clustering based solely on routine clinical variables may have limited utility for de novo patient stratification in IE. Our results emphasize the need for continuous risk modeling or clinically informed predictive approaches to capture the complex interplay of factors determining outcomes. Furthermore, it is important to clarify that our overall approach did not aim to cluster patients with the intent of discovering a novel, high-performing prognostic tool for mortality. If maximizing predictive power or identifying the strongest statistical relationship with outcomes were the primary goal, a supervised, feature-selected risk model would be far superior. Instead, our post hoc association analysis with mortality served merely as a descriptive framework to characterize the clinical burden across the forced severity spectrum. Our final conclusion underscores that for highly heterogeneous diseases like IE, unsupervised clustering is suboptimal for outcome prediction, and clinical research should prioritize continuous risk modeling.
From a broader perspective, our work complements previous machine learning studies in the field. While seminal works by Donal et al., Kang et al., and Ten Hove et al. [7,8,9,10,11] illustrate the significant predictive and diagnostic potential of AI, our study underscores that unsupervised segmentation may not always reveal actionable subgroups in high-variability, acute conditions. This distinction is critical for future research: predictive modeling likely offers more actionable insights than clustering when disease heterogeneity is extreme. Finally, while routinely available clinical variables failed to yield distinct biological subgroups in our cohort, this does not preclude the existence of latent endocarditis phenotypes structured along other axes. Future multicenter studies integrating alternative high-dimensional feature sets—such as advanced imaging-derived parameters, systemic biomarkers, molecular or transcriptomic profiling, and dynamic treatment-response variables—might uncover critical biological subtypes that remain invisible to routine clinical data alone.
Finally, our study highlights the importance of reporting negative or null findings. Despite applying rigorous, multi-algorithmic approaches to a well-characterized cohort of 739 patients, no distinct phenotypic clusters emerged. Reporting such results is essential to mitigate publication bias, which often distorts scientific literature by overrepresenting positive findings. Transparent communication of these results provides a more balanced evidence base, guiding future research away from futile segmentation efforts and toward more integrated, multidimensional predictive tools.

5. Limitations

This study is retrospective and single-center, which may limit the generalizability of our findings. Patient management, surgical indications, and data collection practices at our institution may not fully reflect those of other centers or healthcare systems. Although the cohort was sizable, some subgroups were small, potentially reducing statistical power for rare outcomes. In addition, clustering analyses were limited to demographic, laboratory, and echocardiographic features. The inclusion of additional variables, such as more detailed microbiological data, timing of diagnosis, prior antibiotic exposure, or embolic complications, might influence the clustering results. Furthermore, as in many exploratory studies, no external validation cohort was available, underscoring the need for replication in independent populations. Finally, while alternative sample-based stability validation metrics exist, our methodological architecture evaluated cluster stability using a multi-algorithmic consensus alongside the bootstrap-based Gap Statistic. Because these methods consistently demonstrated a total absence of structural partition, further resampling indicators were rendered redundant.

6. Conclusions

In surgically treated IE, unsupervised clustering failed to identify natural clinical phenotypes, reflecting the extreme heterogeneity of the disease. Forced clusters highlight gradients of operative complexity and postoperative risk, but these do not represent distinct latent subtypes. Future research should prioritize continuous risk modeling and integrative predictive frameworks rather than unsupervised patient segmentation to better capture the clinical spectrum of IE and guide individualized management strategies.

Author Contributions

Conceptualization, E.M. and D.S.; methodology, D.S.; validation, E.T., A.C., M.F. and C.S.; formal analysis, D.S.; data curation, S.C. and A.M.; writing—original draft preparation, E.M. and D.S.; writing—review and editing, M.F., A.C., E.T. and C.S.; visualization, M.F., A.C., E.T. and C.S. All authors have read and agreed to the published version of the manuscript.

Funding

This research received no external funding.

Institutional Review Board Statement

The study was conducted in compliance with the principles of the Declaration of Helsinki. Ethical approval was obtained from the Romagna Ethics Committee on 30 June 2023 (Prot.4497/2023 I.5/95).

Informed Consent Statement

Informed consent was obtained from all subjects involved in the study.

Data Availability Statement

The data that support the findings of this study are not publicly available due to privacy and ethical restrictions.

Acknowledgments

During the preparation of this manuscript, the authors used ChatGPT-5 to debug R code and for English editing. The authors have reviewed and edited the output and take full responsibility for the content of this publication.

Conflicts of Interest

The authors declare no conflicts of interest.

Abbreviations

The following abbreviations are used in this manuscript:
AFAtrial Fibrillation
AKIAcute Kidney Injury
CKDChronic Kidney Disease
COPDChronic Obstructive Pulmonary Disease
CPBCardiopulmonary Bypass Time
CVVHContinuous Venovenous Hemofiltration
IABPIntra-Aortic Balloon Pump
ICUIntensive Care Unit
IEInfective Endocarditis
IQRInterquartile Range
LVEFLeft Ventricular Ejection Fraction
MIMyocardial Infarction
MOFMulti-Organ Failure
PADPeripheral Artery Disease

References

  1. Nappi, F.; Spadaccio, C.; Mihos, C. Infective endocarditis in the 21st century. Ann. Transl. Med. 2020, 8, 1620. [Google Scholar] [CrossRef] [Scilit] [PubMed]
  2. El-Dalati, S.; Cronin, D.; Shea, M.; Weinberg, R.; Riddell, J.; Washer, L.; Shuman, E.; Burke, J.; Murali, S.; Fagan, C.; et al. Clinical practice update on infectious endocarditis. Am. J. Med. 2020, 133, 44–49. [Google Scholar] [CrossRef] [Scilit] [PubMed]
  3. Baddour, L.M.; Wilson, W.R.; Bayer, A.S.; Fowler, V.G.; Tleyjeh, I.M.; Rybak, M.J.; Barsic, B.; Lockhart, P.B.; Gewitz, M.H.; Levison, M.E.; et al. Infective Endocarditis in Adults: Diagnosis, Antimicrobial Therapy, and Management of Complications: A Scientific Statement for Healthcare Professionals from the American Heart Association. Circulation 2015, 132, 1435–1486. [Google Scholar] [PubMed]
  4. Davierwala, P.M.; Marin-Cuartas, M.; Misfeld, M.; Deo, S.V.; Lehmann, S.; Garbade, J.; Holzhey, D.M.; ABorger, M.; Bakhtiary, F. Five-year outcomes following complex reconstructive surgery for infective endocarditis involving the intervalvular fibrous body. Eur. J. Cardiothorac. Surg. 2020, 58, 1080–1087. [Google Scholar] [CrossRef] [Scilit] [PubMed]
  5. Forteza-Gil, A.; Sandoval, E.; Martínez-López, D.; Pereda, D.; De Villarreal-Soto, J.E.; Castellá, M.; Centeno-Rodríguez, J.; Alcocer, J.; Martin-López, C.E.; Rubio, B.; et al. Mid-term outcomes of intervalvular fibrosa body reconstruction with Commando variants for active infective endocarditis. Eur. J. Cardiothorac. Surg. 2025, 67, ezaf047. [Google Scholar] [CrossRef] [Scilit] [PubMed]
  6. Chorney, W.; Hinchion, J. Risk assessment in cardiac surgery: Exploring machine learning and laboratory indices as adjunctive tools. PLoS ONE 2026, 21, e0335289. [Google Scholar] [CrossRef] [Scilit] [PubMed]
  7. Donal, E.; Flecher, E.; Tattevin, P. Machine learning to support decision-making for cardiac surgery during the acute phase of infective endocarditis. Heart 2017, 103, 1396–1397. [Google Scholar] [CrossRef] [Scilit] [PubMed]
  8. Kang, M.W.; Ahn, S.Y.; Kang, Y. Impact of blood culture positivity at intensive care unit admission on mortality in infective endocarditis: Machine learning and deep learning-based causal inference models. PLoS ONE 2025, 20, e0333351. [Google Scholar] [CrossRef] [Scilit] [PubMed] [PubMed Central]
  9. Ten Hove, D.; Slart, R.H.J.A.; Glaudemans, A.W.J.M.; Postma, D.F.; Gomes, A.; Swart, L.E.; Tanis, W.; Geel, P.P.V.; Mecozzi, G.; Budde, R.P.J.; et al. Using machine learning to improve the diagnostic accuracy of the modified Duke/ESC 2015 criteria in patients with suspected prosthetic valve endocarditis—A proof of concept study. Eur. J. Nucl. Med. Mol. Imaging 2024, 51, 3924–3933. [Google Scholar] [CrossRef] [Scilit] [PubMed] [PubMed Central]
  10. Zi-yang, Y.; Qi, W.; Liu, X.; Li, H.; Wang, S.; Yu, D.; Wei, X. Mortality predicting models for patients with infective endocarditis: A machine learning approach. BMC Med. Inform. Decis. Mak. 2025, 25, 229. [Google Scholar] [CrossRef] [Scilit]
  11. Odat, R.M.; Marsool Marsool, M.D.; Nguyen, D.; Idrees, M.; Hussein, A.M.; Ghabally, M.; Yasin, J.A.; Hanifa, H.; Sabet, C.J.; Dinh, N.H.; et al. Presurgery and postsurgery: Advancements in artificial intelligence and machine learning models for enhancing patient management in infective endocarditis. Int. J. Surg. 2024, 110, 7202–7214. [Google Scholar] [CrossRef] [Scilit]
  12. Gower, J.C. A General Coefficient of Similarity and Some of Its Properties. Biometrics 1971, 27, 857–871. [Google Scholar] [CrossRef] [Scilit]
  13. Rousseeuw, P.J. Silhouettes: A graphical aid to the interpretation and validation of cluster analysis. J. Comput. Appl. Math. 1987, 20, 53–65. [Google Scholar] [CrossRef] [Scilit]
  14. Tibshirani, R.; Walther, G.; Hastie, T. Estimating the Number of Clusters in a Data Set Via the Gap Statistic. J. R. Stat. Soc. Ser. B Stat. Methodol. 2001, 63, 411–423. [Google Scholar] [CrossRef] [Scilit]
  15. McInnes, L.; Healy, J.; Astels, S. hdbscan: Hierarchical density based clustering. J. Open Source Softw. 2017, 2, 205. [Google Scholar] [CrossRef] [Scilit]
  16. Huang, Z. Extensions to the k-Means Algorithm for Clustering Large Data Sets with Categorical Values. Data Min. Knowl. Discov. 1998, 2, 283–304. [Google Scholar] [CrossRef] [Scilit]
  17. Foss, A.; Markatou, M.; Ray, B.; Heching, A. A semiparametric method for clustering mixed data. Mach. Learn. 2016, 105, 419–458. [Google Scholar] [CrossRef] [Scilit]
  18. Stekhoven, D.J.; Bühlmann, P. MissForest—Non-parametric missing value imputation for mixed-type data. Bioinformatics 2012, 28, 112–118. [Google Scholar] [CrossRef] [Scilit] [PubMed]
Figure 1. Silhouette analysis and gap statistic for selecting the optimal number of clusters in k-medoids clustering; the red dots represent the otpimal number of clusters.
Make 08 00154 g001
Figure 2. Silhouette analysis and gap statistic for selecting the optimal number of clusters in k-prototypes clustering; the red dots represent the otpimal number of clusters.
Make 08 00154 g002
Figure 3. Multidimensional scaling representation of HDBSCAN clustering based on Gower distance.
Make 08 00154 g003
Figure 4. Hierarchical agglomerative clustering, red cut based on maximum linkage distance identified the two blue clusters.
Make 08 00154 g004
Figure 5. Heatmap of clinical and microbiological features stratified by patient clusters.
Make 08 00154 g005
Figure 6. Forest plot for postoperative outcomes and complications. Abbreviations: AF = atrial fibrillation; AKI = acute kidney injury; CVVH = continuous venovenous hemofiltration; ICU = intensive care unit; MOF = multi-organ failure.
Make 08 00154 g006
Table 1. Baseline demographic and clinical characteristics.
OverallCluster 1Cluster 2Cluster 3p
n739287196256
Age, median (IQR)69 (58, 76)61 (48, 73)68 (60, 76)73 (68, 78)<0.001
Female, n (%)215 (29.1)41 (14.3)117 (59.7)57 (22.3)<0.001
Hypertension, n (%)469 (63.5)98 (34.1)148 (75.5)223 (87.1)<0.001
Diabetes, n (%)151 (20.4)41 (14.3)42 (21.4)68 (26.6)0.002
Obesity, n (%)137 (18.5)57 (19.9)35 (17.9)45 (17.6)0.769
COPD, n (%)84 (11.4)25 (8.7)23 (11.7)36 (14.1)0.143
LVEF, median (IQR)58 (52, 63)59 (50, 64)60 (55, 65)55 (50, 61)0.001
Redo, n (%)336 (45.5)42 (14.6)61 (31.1)233 (91.0)<0.001
IABP, n (%)6 (0.8)4 (1.4)0 (0.0)2 (0.8)0.251
PAD, n (%)86 (11.6)28 (9.8)16 (8.2)42 (16.4)0.014
Neurological disorder, n (%)142 (19.2)51 (17.8)39 (19.9)52 (20.3)0.714
Shock, n (%)38 (5.1)13 (4.5)9 (4.6)16 (6.2)0.644
Heart failure, n (%)198 (26.8)73 (25.4)47 (24.0)78 (30.5)0.250
MI, n (%)27 (3.7)11 (3.8)6 (3.1)10 (3.9)0.909
Active endocarditis, n (%)627 (84.8)236 (82.2)158 (80.6)233 (91.0)0.002
Intubation, n (%)51 (6.9)16 (5.6)16 (8.2)19 (7.4)0.479
CKD, n (%)101 (13.7)28 (9.8)31 (15.8)42 (16.4)0.042
Dialysis, n (%)29 (3.9)9 (3.1)12 (6.1)8 (3.1)0.203
Pacemaker, n (%)60 (8.1)16 (5.6)11 (5.6)33 (12.9)0.004
Abbreviations: CKD = chronic kidney disease; COPD = chronic obstructive pulmonary disease; IABP = intra-aortic balloon pump; IQR = interquartile range; LVEF = left ventricular ejection fraction; MI = myocardial infarction; PAD = peripheral artery disease.
Table 2. Microbiological characteristics and infection profile.
OverallCluster 1Cluster 2Cluster 3p
n739287196256
Negative blood culture, n (%)84 (11.9)32 (11.9)25 (13.4)27 (10.9)0.729
Staphylococcus aureus, n (%)130 (19.0)61 (23.2)44 (23.7)25 (10.5)<0.001
Staphylococcus non-aureus, n (%)111 (16.2)13 (4.9)13 (7.0)85 (35.9)<0.001
Streptococcus, n (%)169 (24.6)67 (25.5)64 (34.4)38 (16.0)<0.001
Pseudomonas, n (%)4 (0.6)4 (1.5)0 (0.0)0 (0.0)0.041
Enterococcus faecalis, n (%)113 (16.5)51 (19.4)24 (12.9)38 (16.0)0.185
Fungus, n (%)10 (1.5)4 (1.5)1 (0.5)5 (2.1)0.444
Other pathogens, n (%)76 (11.1)30 (11.4)18 (9.7)28 (11.8)0.782
Abscess, n (%)208 (28.1)22 (7.7)22 (11.2)164 (64.1)<0.001
Vegetations, n (%)612 (82.8)265 (92.3)170 (86.7)177 (69.1)<0.001
Leaflet perforation, n (%)110 (14.9)45 (15.7)40 (20.4)25 (9.8)0.006
Prosthetic detachment, n (%)120 (16.2)16 (5.6)23 (11.7)81 (31.6)<0.001
Days from onset to surgery,
median (IQR)
20 (11, 34)21 (13, 40)20 (11, 35)18 (10, 30)0.091
Table 3. Operative details and intraoperative management.
OverallCluster 1Cluster 2Cluster 3p
n739287196256
Minimally invasive, n (%)164 (22.2)98 (34.1)49 (25.0)17 (6.6)<0.001
Log euroSCORE, median (IQR)20.2 (8.8, 40.9)10.5 (5.7, 18.9)18.1 (7.1, 34.1)40.19 (25.5, 60.2)<0.001
Aortic valve, n (%)517 (70.0)240 (83.6)37 (18.9)240 (93.8)<0.001
Mitral valve, n (%)325 (44.0)79 (27.5)187 (95.4)59 (23.0)<0.001
Tricuspid valve, n (%)64 (8.7)34 (11.8)20 (10.2)10 (3.9)0.002
Pulmonary valve, n (%)1 (0.1)1 (0.3)0 (0.0)0 (0.0)1.000
N operated valves, n (%) 0.384
        07 (0.9)2 (0.7)0 (0.0)5 (2.0)
        1568 (76.9)222 (77.4)150 (76.5)196 (76.6)
        2153 (20.7)57 (19.9)44 (22.4)52 (20.3)
        311 (1.5)6 (2.1)2 (1.0)3 (1.2)
CPB, median (IQR)105 (76, 145)84 (62, 118)106 (81, 128)131 (97, 183)<0.001
Cross-clamp time (min), median (IQR)85 (61, 117)69 (52, 98)87 (67, 110)106 (76, 145)<0.001
Abbreviations: CPB = cardiopulmonary bypass time; IQR = interquartile range.
Disclaimer/Publisher’s Note: The statements, opinions and data contained in all publications are solely those of the individual author(s) and contributor(s) and not of MDPI and/or the editor(s). MDPI and/or the editor(s) disclaim responsibility for any injury to people or property resulting from any ideas, methods, instructions or products referred to in the content.