1. Introduction
The worldwide population structure is experiencing a significant shift, characterized by a rapid increase in the proportion of older adults. As a result, intelligent monitoring technologies have attracted growing interest as practical solutions for continuous observation of elderly individuals in both residential environments and institutional care facilities [
1,
2].
In this context, activity recognition has emerged as a fundamental element in elderly care systems. It facilitates essential capabilities, including fall detection and prevention, monitoring of activities of daily living (ADL), recognition of atypical behavioral patterns that may indicate deteriorating health conditions, and prompt support or intervention when required [
3,
4]. Compared with camera-based surveillance solutions, which frequently raise privacy issues and are limited to specific environments, wearable sensing technologies offer a more appropriate alternative. Inertial measurement units, including accelerometers, gyroscopes, and magnetometers, support unobtrusive, privacy-preserving, and environment-independent monitoring [
5]. These sensors continuously capture fine-grained motion data, enabling comprehensive analysis of physical activities and mobility patterns over extended periods [
6,
7].
Despite these advantages, recognizing activities performed by elderly individuals remains considerably more challenging than general human activity recognition (HAR). Aging-related conditions often lead to slower movements, reduced motion intensity, greater variability in the execution of activities, and subtle differences between similar actions. These characteristics arise from physical limitations and mobility impairments common in older adults. Conventional machine learning methods based on handcrafted features struggle to model such complexities. They typically require substantial domain knowledge and often fail to generalize across users, sensor placements, and data-collection settings [
8]. Although deep learning techniques have achieved notable success in HAR tasks, most existing approaches have been developed and validated using datasets dominated by young or middle-aged participants. This raises concerns regarding their applicability and robustness in elderly-focused scenarios [
9].
Contemporary deep learning approaches, particularly convolutional neural networks (CNNs) and recurrent neural networks (RNNs), have significantly improved HAR performance by automatically extracting informative patterns from unprocessed sensor streams. CNNs are highly capable of identifying localized and spatial structures within multivariate temporal signals. Conversely, RNN-based architectures, such as long short-term memory (LSTM) and gated recurrent unit (GRU) networks, are especially effective for capturing temporal correlations that characterize human motion sequences [
10]. However, conventional CNN and RNN frameworks typically assign uniform importance to all learned features. This constraint may lead to the neglect of subtle yet crucial discriminative information—particularly in distinguishing between closely related activities performed by older adults. Furthermore, the training of deep architectures is often affected by the vanishing gradient problem, which restricts the network’s capacity to learn intricate long-term dependencies.
To address these limitations, attention-based techniques have been incorporated as powerful enhancements to deep neural architectures. Such mechanisms enable the model to emphasize salient features or critical temporal intervals dynamically, thereby enhancing the expressiveness of learned representations [
11]. The convolutional block attention module (CBAM), which integrates channel-level and spatial attention operations, has achieved notable success in computer vision tasks by adaptively recalibrating feature responses [
12]. However, attention-oriented architectures tailored specifically for elderly activity recognition have not been extensively investigated. In parallel, residual learning methods—achieved through skip connections—promote stable gradient flow and enable effective training of deeper networks, leading to improved convergence behavior and generalization.
Motivated by these observations, this study presents a new hybrid deep residual framework that combines a CNN, CBAM, and a bidirectional GRU (BiGRU) for elderly activity recognition. The proposed CNN-CBAM-BiGRU architecture unifies convolutional representation learning, attention-driven feature refinement, and bidirectional temporal analysis within a single model. The CNN layers automatically extract hierarchical spatial patterns from raw sensor data. The CBAM component enhances salient information while attenuating less relevant signals via both channel- and spatial-attention mechanisms. Subsequently, the BiGRU module models extended temporal relationships by leveraging information from preceding and succeeding time steps, which is crucial for interpreting complex activity sequences. Residual connections are incorporated throughout the network to maintain stable gradient flow and facilitate the learning of deeper, more discriminative representations.
To thoroughly assess the proposed model, extensive experiments are conducted using three widely adopted elderly-centered benchmark datasets: HAR70+, HARTH, and SisFall. These datasets include a broad range of activities, including daily routines, transitional movements, and fall-related events. They provide a comprehensive evaluation environment across varying scenarios and sensor configurations. Comparative analyses with state-of-the-art approaches, along with ablation experiments and attention-weight investigations, demonstrate that the CNN–CBAM–BiGRU model achieves superior performance and improved interpretability.
The main contributions of this work are summarized as follows. First, we introduce a new hybrid deep residual framework that integrates CNN, CBAM, and BiGRU components better to capture the distinctive movement characteristics of older adults. Second, an attention-driven feature enhancement mechanism is embedded to highlight subtle but highly informative patterns that are essential for accurately recognizing elderly activities. Third, comprehensive experiments conducted on three benchmark datasets specifically collected from elderly populations demonstrate notable gains in classification accuracy, F1-score, and overall generalization compared with existing approaches. Finally, thorough ablation studies, together with visual analyses of the attention modules, are presented to interpret the model’s behavior and to quantify the contribution of each architectural element.
The rest of the paper is structured as follows.
Section 2 surveys prior research on human activity recognition and deep learning methods for elderly monitoring.
Section 3 details the proposed CNN–CBAM–BiGRU model.
Section 4 describes the experimental setup, datasets, and evaluation criteria.
Section 5 reports and analyzes the results, including comparisons with baseline techniques.
Section 6 summarizes the findings and outlines potential directions for future work.
3. Methodology
This section presents the comprehensive methodological approach employed in this research. It includes the elderly-oriented benchmark HAR datasets, the data preparation and preprocessing procedures, and the architecture of the proposed CNN–CBAM–BiGRU model.
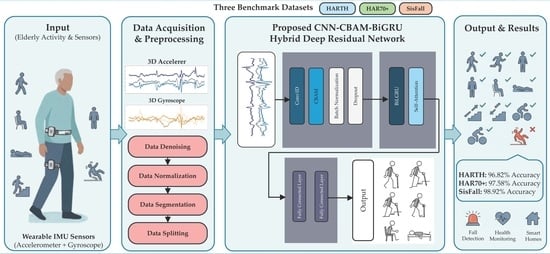
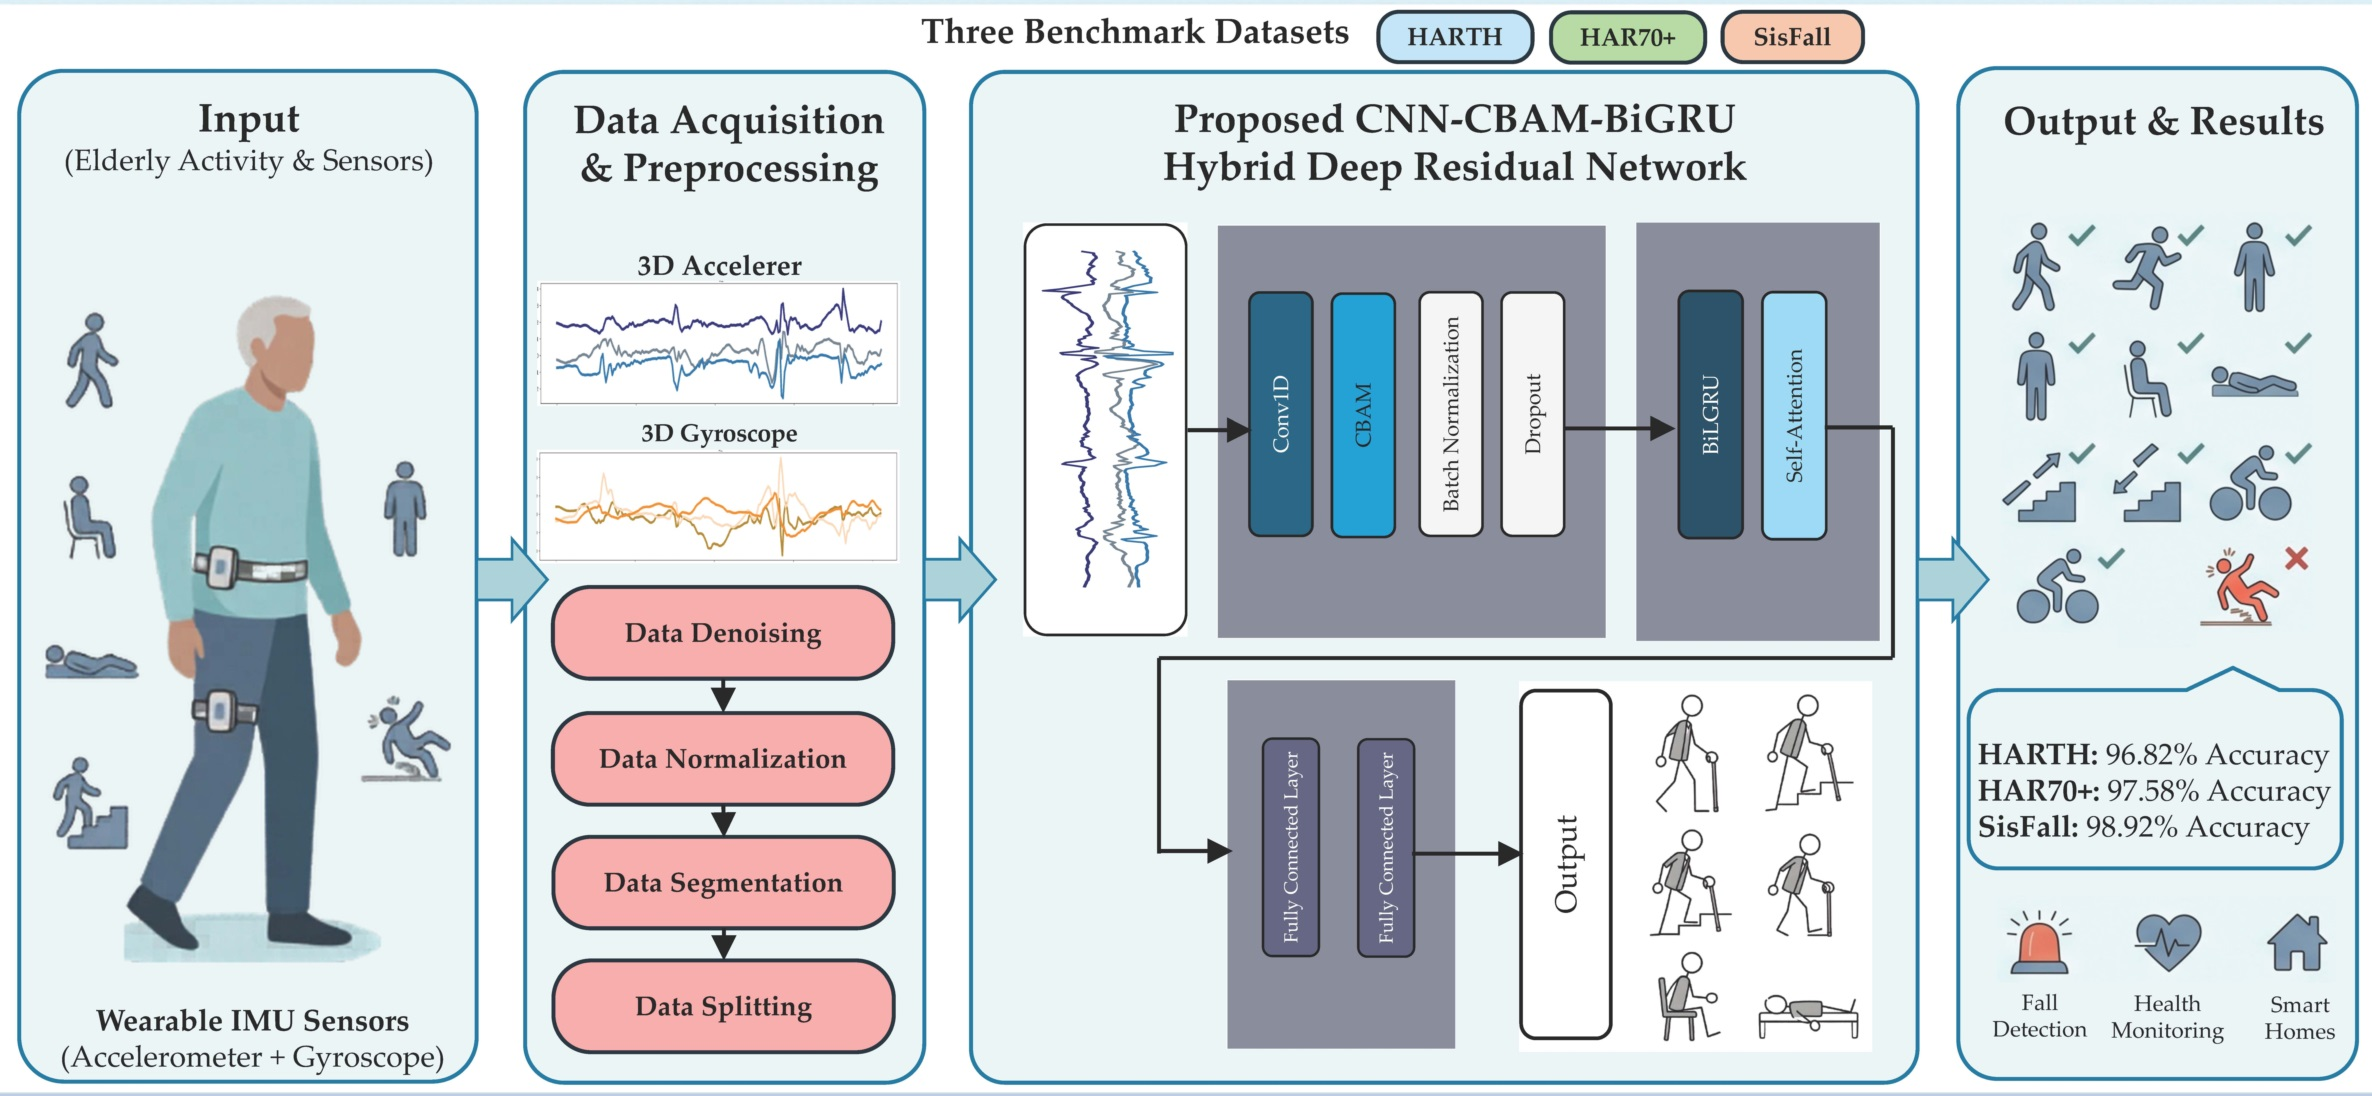
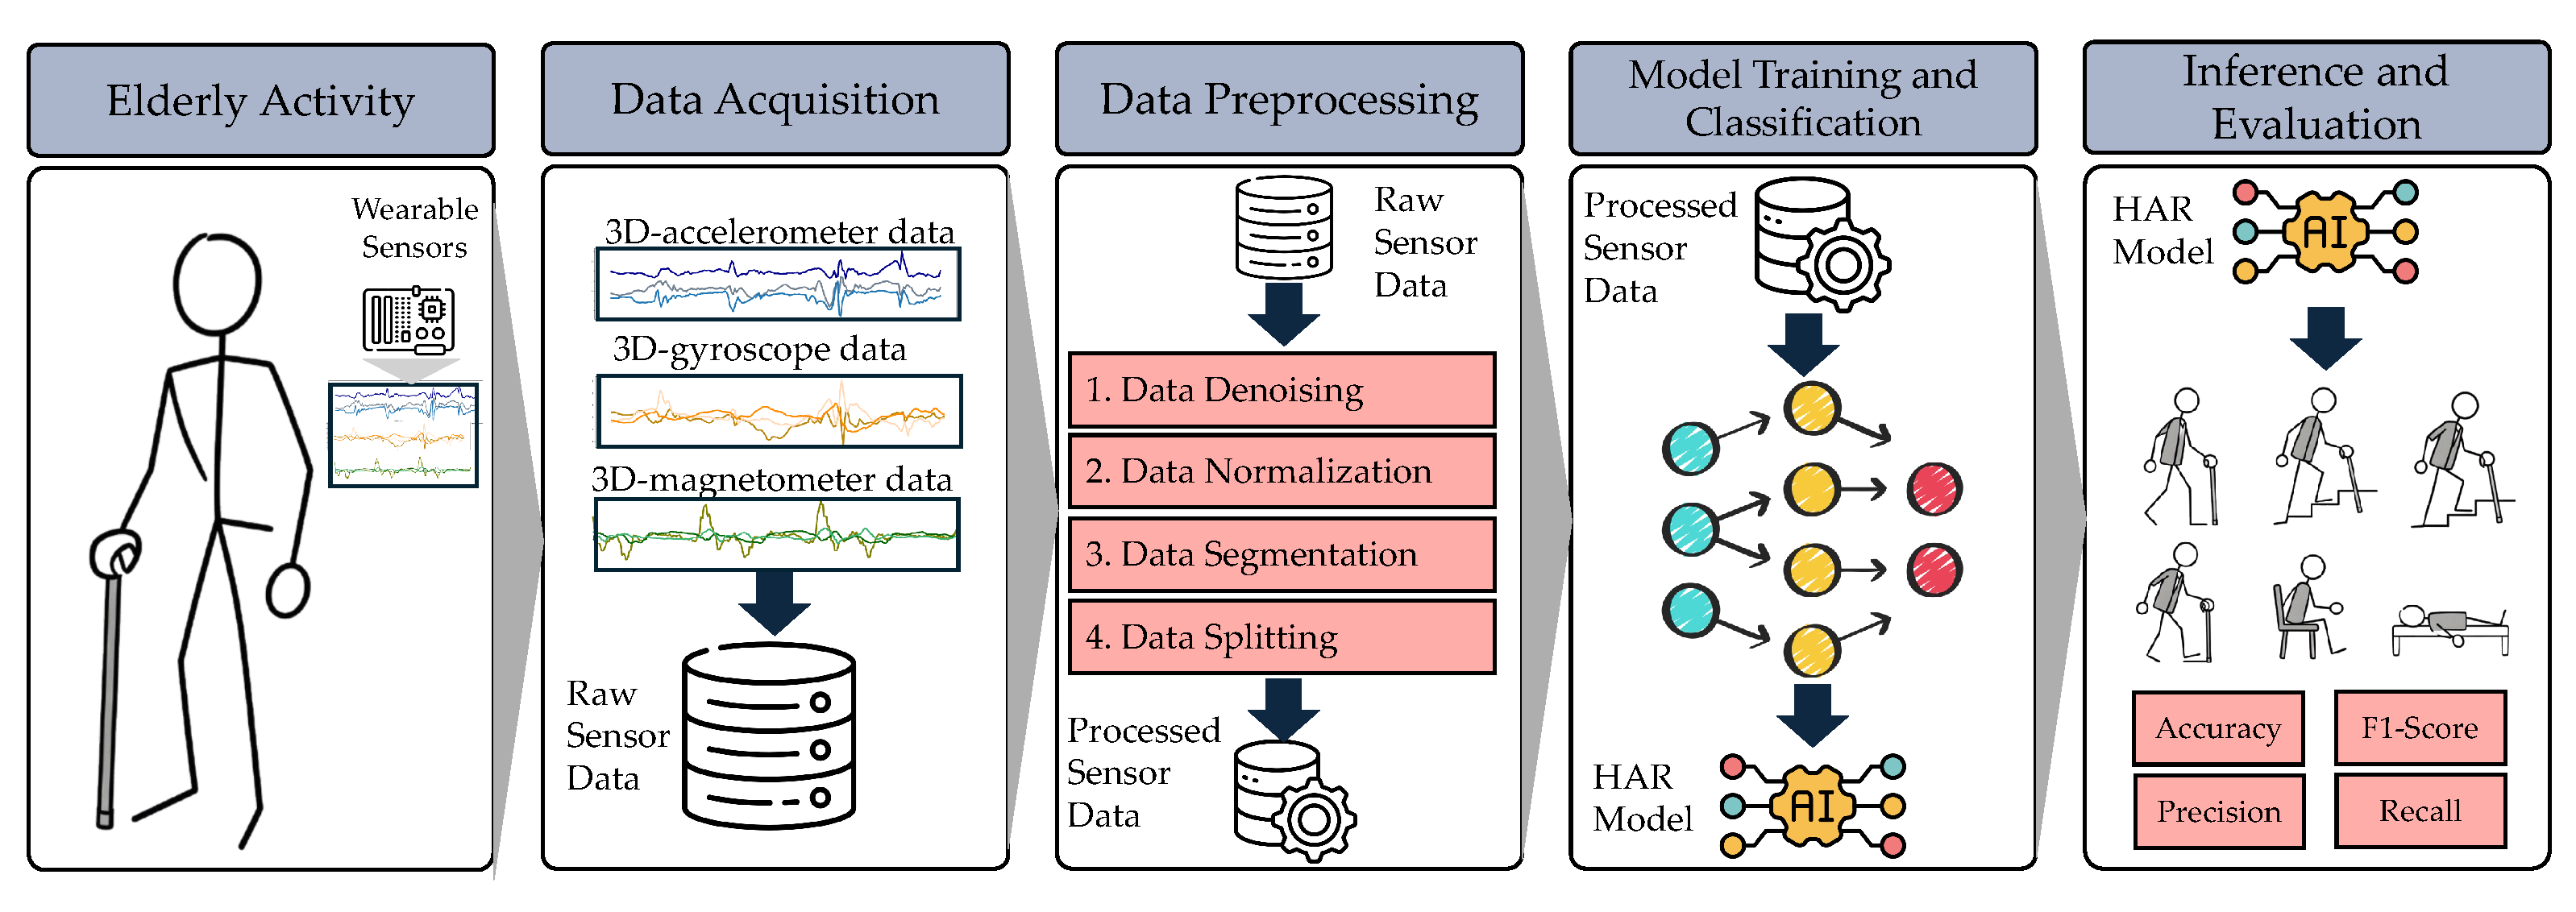
Figure 1 illustrates the overall structure of the developed elderly activity recognition system. The framework is arranged into four consecutive phases: acquisition of sensor data from elderly activities, preprocessing and transformation of the raw signals, model training and activity classification, and the ultimate identification of human activities.
The proposed pipeline consists of five successive stages. These begin with collecting motion data from wearable devices attached to elderly participants, followed by preparing the raw sensor signals through noise removal, normalization, and windowing. The next stages involve partitioning data at the subject level for training and validation purposes, training the CNN–CBAM–BiGRU architecture to classify physical activities, and finally performing real-time activity recognition during inference.
Section 3.1 covers the benchmark datasets and their corresponding data collection procedures.
Section 3.2 outlines the signal preparation and data partitioning strategies.
Section 3.3 introduces the architecture of the proposed model along with its training configuration.
3.1. Benchmark Elderly HAR Datasets
To rigorously assess the effectiveness of the proposed CNN–CBAM–BiGRU framework, this study employs three widely used benchmark datasets specifically designed for elderly HAR: HARTH, HAR70+, and SisFall. These datasets were chosen because they primarily target older adults and include a broad range of activity categories, including daily living activities and fall-related events.
Table 1 summarizes the main properties of each dataset, including participant characteristics, sensor setups, and the types of activities recorded.
3.1.1. HARTH Dataset
The Human Activity Recognition Trondheim (HARTH) dataset [
29] is a professionally annotated and class-imbalanced dataset created by the Department of Public Health and Nursing, Faculty of Medicine and Health Sciences, NTNU, Trondheim, Norway. It includes recordings from 22 participants, each wearing two tri-axial accelerometer sensors. Data were collected for around 2 h per individual in a free-living setting, enabling the capture of natural, everyday movements.
The sensing devices were mounted at predefined anatomical positions to ensure consistency across participants. One accelerometer was placed on the lower back, corresponding approximately to the third lumbar vertebra (L3). At the same time, the second sensor was attached to the right distal thigh, positioned about 10 cm above the patella.
Due to its high-quality data acquisition process and expert-generated annotations, the HARTH dataset serves as a valuable benchmark for the research community. It supports the development and evaluation of machine learning models aimed at accurate activity recognition under realistic, unconstrained conditions. The dataset includes seven primary activities of daily living: walking, running, stair ascent, stair descent, standing, sitting, and lying.
3.1.2. HAR70+ Dataset
The HAR70+ dataset [
30] comprises activity recordings that were professionally annotated by researchers from the same laboratory responsible for the HARTH dataset. This dataset comprises 18 older adults aged 70–95 years, including both healthy and frail individuals. Each participant was equipped with two tri-axial accelerometers and monitored for approximately 40 min under a semi-structured, free-living experimental protocol.
The placement of the sensing devices followed the same configuration adopted in the HARTH dataset. Specifically, the accelerometers were mounted on the right thigh and the lower back, and data were captured at 50 Hz. Detailed demographic and participant-related information for the HAR70+ dataset is summarized in
Table 1.
3.1.3. SisFall Dataset
The SisFall dataset [
31] consists of motion recordings collected from 38 participants, including 23 younger adults and 15 older individuals. Each volunteer carried out 34 distinct actions under controlled experimental conditions. These actions comprise 19 ADLs and 15 simulated fall events. Multiple repetitions were performed, resulting in a total of 4510 complete activity sequences.
Data acquisition was conducted using a dedicated sensing platform equipped with two three-axis accelerometers and one three-axis gyroscope, all operating at a sampling frequency of 200 Hz. The sensing unit was worn around the waist and maintained a fixed alignment relative to the participant’s body throughout data collection. Within the SisFall dataset, annotations label each full sequence as either a fall or an ADL.
Nevertheless, the dataset does not specify the precise temporal location of a fall within a signal sequence, nor does it indicate the exact onset and offset of individual ADLs. This limitation limits its direct applicability to training RNN models for real-time fall detection. To address this issue, the annotation scheme was treated at the sequence level: each complete temporal window was assigned to one of two classes—a fall event or a normal ADL. This binary classification formulation is consistent with the primary safety-monitoring objective of the SisFall dataset: reliable discrimination between fall incidents and routine daily activities. Pre-fall or transitional sequences that could not be unambiguously assigned were treated as ADL instances, reflecting their closer proximity to normal daily movement in terms of sensor signature. Accordingly, all experimental results reported for SisFall in this study correspond to a binary classification task.
3.2. Data Preprocessing
Data preprocessing represents an essential phase in which unprocessed sensor signals are transformed into a structured representation appropriate for computational modeling and evaluation. This stage involves a sequence of systematic operations to improve signal reliability, suppress unwanted disturbances, and ensure compatibility with deep learning architectures. The series of preprocessing steps applied to the original sensor measurements is depicted in
Figure 1, which summarizes the complete data preparation workflow.
3.2.1. Data Denoising
Wearable sensing signals collected in real-world conditions are naturally affected by multiple noise sources, including gradual sensor drift, electromagnetic disturbances, and motion-induced artifacts. To mitigate these effects, a Butterworth low-pass filter with a cutoff frequency of 20 Hz was employed. This filtering strategy suppresses unwanted high-frequency components while retaining the dominant motion patterns associated with human activities. The choice of cutoff frequency was guided by spectral analysis of common movements, indicating that the primary frequency content of actions such as walking, lifting, and carrying generally lies below 15 Hz.
In addition to signal filtering, abnormal values were identified and removed using the interquartile range (IQR) criterion. Specifically, samples exceeding 1.5 times the IQR beyond the first or third quartile were discarded. This procedure prevents extreme observations caused by sensor faults or external interference from degrading the model’s learning performance.
3.2.2. Data Normalization
To achieve uniform scaling across heterogeneous sensor channels and to reduce the impact of differing measurement magnitudes, min–max normalization was applied. As a result of this transformation, all sensor values were mapped to the common interval [0, 1]. The normalization operation is mathematically defined:
where
denotes the normalized data,
n denotes the number of channels, and
and
represent the maximum and minimum values of the
i-th channel, respectively.
This scaling strategy promotes balanced participation of all sensor channels during model optimization. By constraining values to a common range, it avoids bias toward features with larger magnitudes and ensures that no single channel disproportionately influences the model’s training.
3.2.3. Data Segmentation
Following the temporal segmentation scheme, four alternative window lengths—0.5, 1.0, 1.5, and 2.0 s—were selected after a thorough assessment of several candidate durations. Each time window was segmented and annotated according to the activity that occupied the majority of that interval. To preserve temporal independence between adjacent samples, a non-overlapping segmentation strategy was adopted, corresponding to an overlap ratio of 0%.
A non-overlapping windowing approach was adopted for two principal reasons. First, it eliminates the risk of temporal information leakage between the training and test partitions during subject-level cross-validation. Since all recordings from a given participant are assigned exclusively to either the training or test fold, this approach ensures that no single activity instance appears in both partitions simultaneously. Second, non-overlapping windows prevent the artificial overestimation of training sample counts that results from high-overlap segmentation, thereby avoiding distortions in performance measurements. Although overlapping windows are widely employed in online activity recognition systems to increase data volume and reduce prediction delay, the non-overlapping strategy used here establishes a conservative and replicable benchmark for offline evaluation. The influence of the overlap ratio on recognition performance—particularly for activities of short duration—remains an open question and is identified as a direction for future work.
3.2.4. Data Splitting for Model Training and Evaluation
The prepared dataset was divided into two separate portions: a training set used to learn model parameters and a test set reserved for evaluating performance. Given the substantial amount of collected data, an 80%/20% ratio was adopted for training and testing, respectively. Notably, the split was conducted at the subject level rather than the individual sample level.
During evaluation, data from a randomly selected subset of participants were held out exclusively for testing, while recordings from the remaining individuals were used to train the deep learning model. This subject-independent validation protocol assesses performance on motion patterns from previously unseen users. Such a strategy is essential for estimating real-world deployment capability, especially in elderly monitoring applications. By separating subjects into training and test sets, the evaluation emphasizes the model’s ability to learn generalized activity representations rather than memorize person-specific movement patterns.
3.3. The Proposed Hybrid Deep Residual Network
3.3.1. The CNN–CBAM Architecture
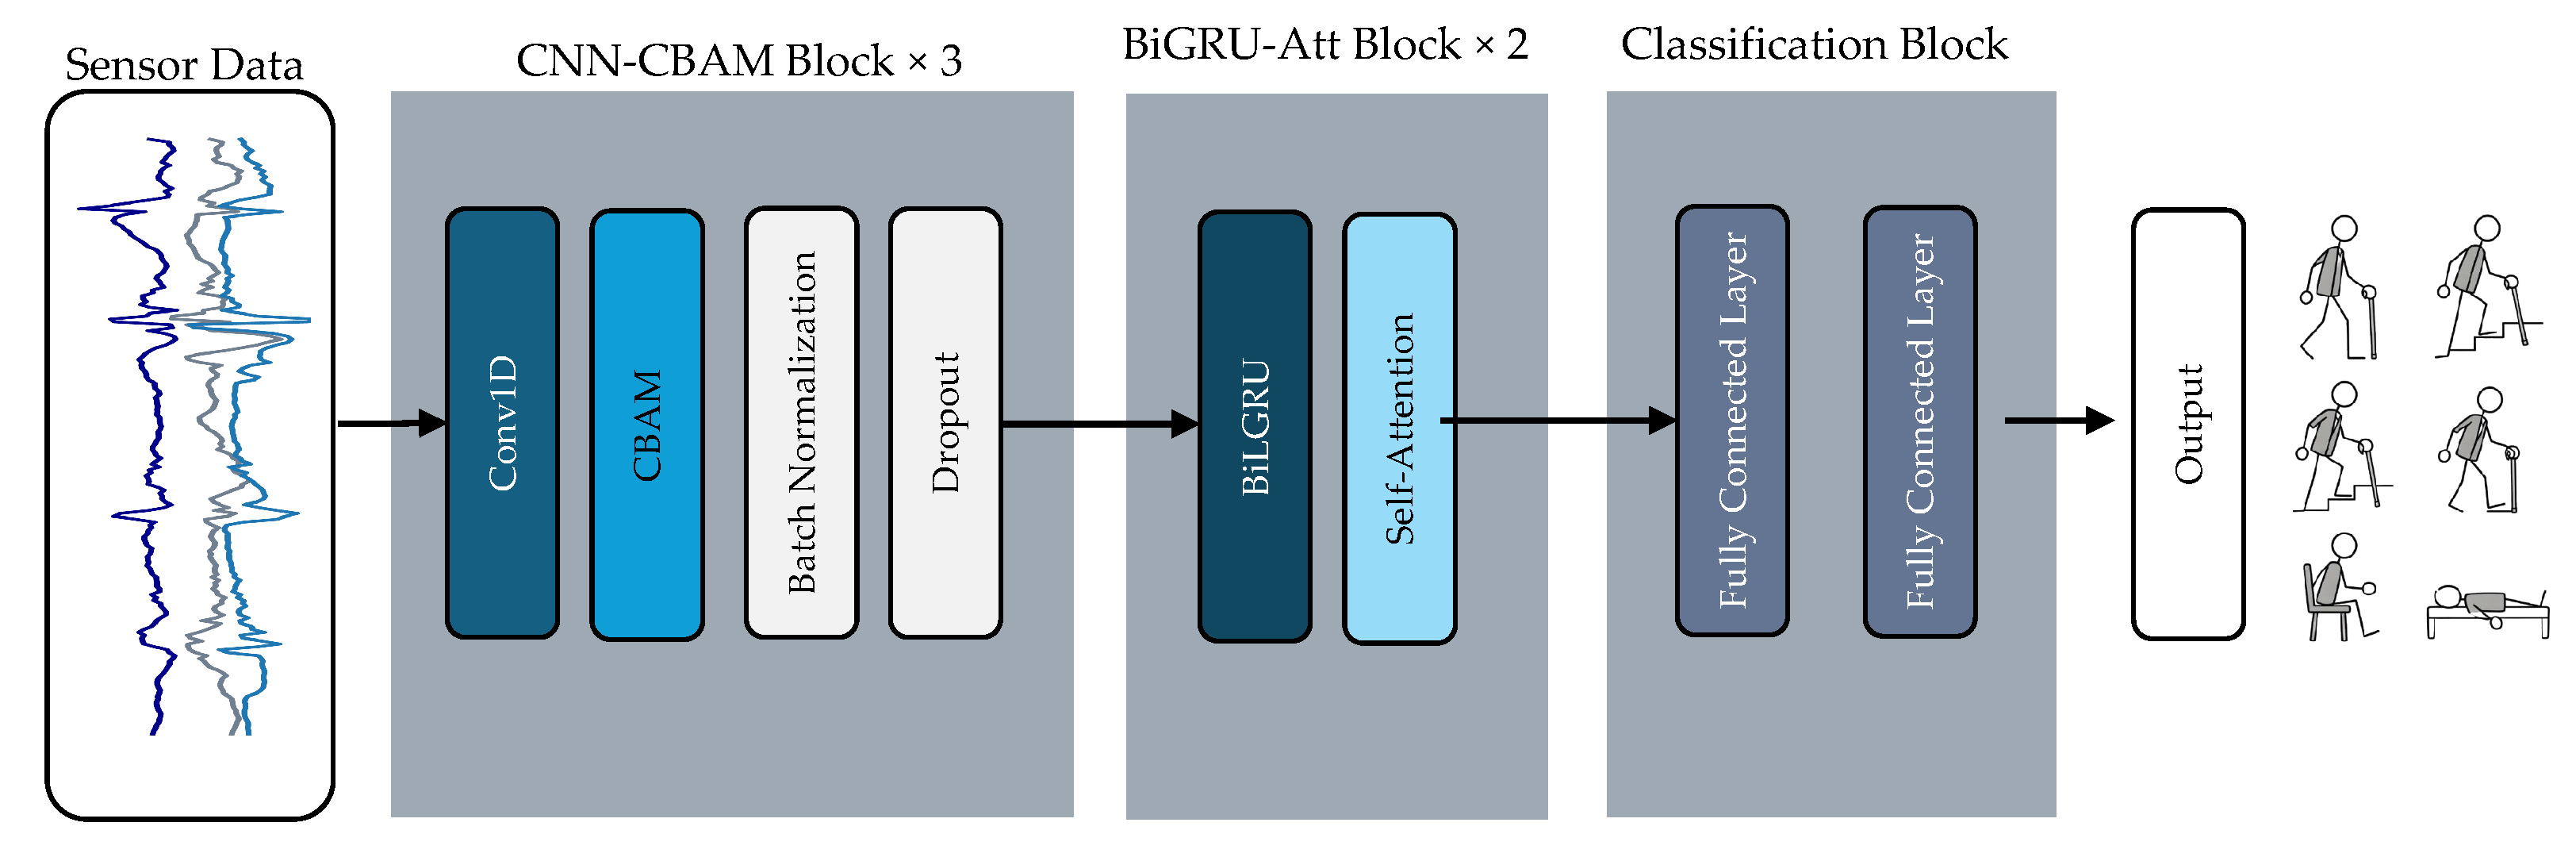
The developed framework integrates convolutional spatial feature extractors with CBAM attention modules and BiGRUs augmented by a self-attention mechanism. This combination is designed to capture both spatial representations and temporal dependencies embedded in multi-channel time-series data. Although CNN–RNN hybrid architectures constitute an established approach in HAR, the distinctive contribution of CNN–CBAM–BiGRU stems from three specific architectural decisions that collectively address the unique properties of activity data collected from older adults.
First, CBAM attention is embedded after every convolutional block rather than applied as a single terminal module. This placement allows the network to iteratively refine feature maps at successive levels of abstraction, selectively suppressing irrelevant sensor channels and temporal regions at each processing scale.
Second, BiGRU is employed instead of a unidirectional GRU or LSTM, enabling the model to explicitly capture temporal context in both the forward and backward directions within each activity window. This characteristic is especially valuable for distinguishing activities that exhibit gradual onset and offset dynamics, which are frequently observed in the movement patterns of elderly individuals.
Third, residual skip connections are incorporated throughout both the CNN–CBAM and BiGRU–Attention components. These connections stabilize gradient propagation and support effective optimization of a deeper combined architecture—a limitation that reduces the effectiveness of many shallower hybrid models. The overall network structure is illustrated in
Figure 2.
- (1).
CNN-CBAM Block
The proposed framework begins with a sequence of one-dimensional convolutional layers, which are particularly effective for modeling temporal signals, including data from wearable sensors. By applying sliding convolutional windows, these layers learn local temporal relationships. Early layers focus on fine-scale motion variations, whereas deeper layers extract more abstract, semantically rich representations.
The convolutional stage employs kernels of sizes 3, 5, and 7, with corresponding numbers of filters set to 16, 32, and 64, respectively. This filter configuration was determined through a combination of guidance from the HAR literature and preliminary validation experiments. The successive doubling of filter counts across layers follows a widely recognized design principle: increasing representational capacity with network depth while keeping computational overhead manageable [
32]. Smaller kernels in the earlier layers are responsible for detecting fine-grained temporal transients, such as impact peaks occurring during stair descent. In contrast, larger kernels in the deeper layers integrate extended temporal patterns, such as the rhythmic periodicity characteristic of walking. This configuration was confirmed through preliminary assessment on the validation fold to offer the most favourable trade-off between model expressiveness and generalisation ability across all three datasets.
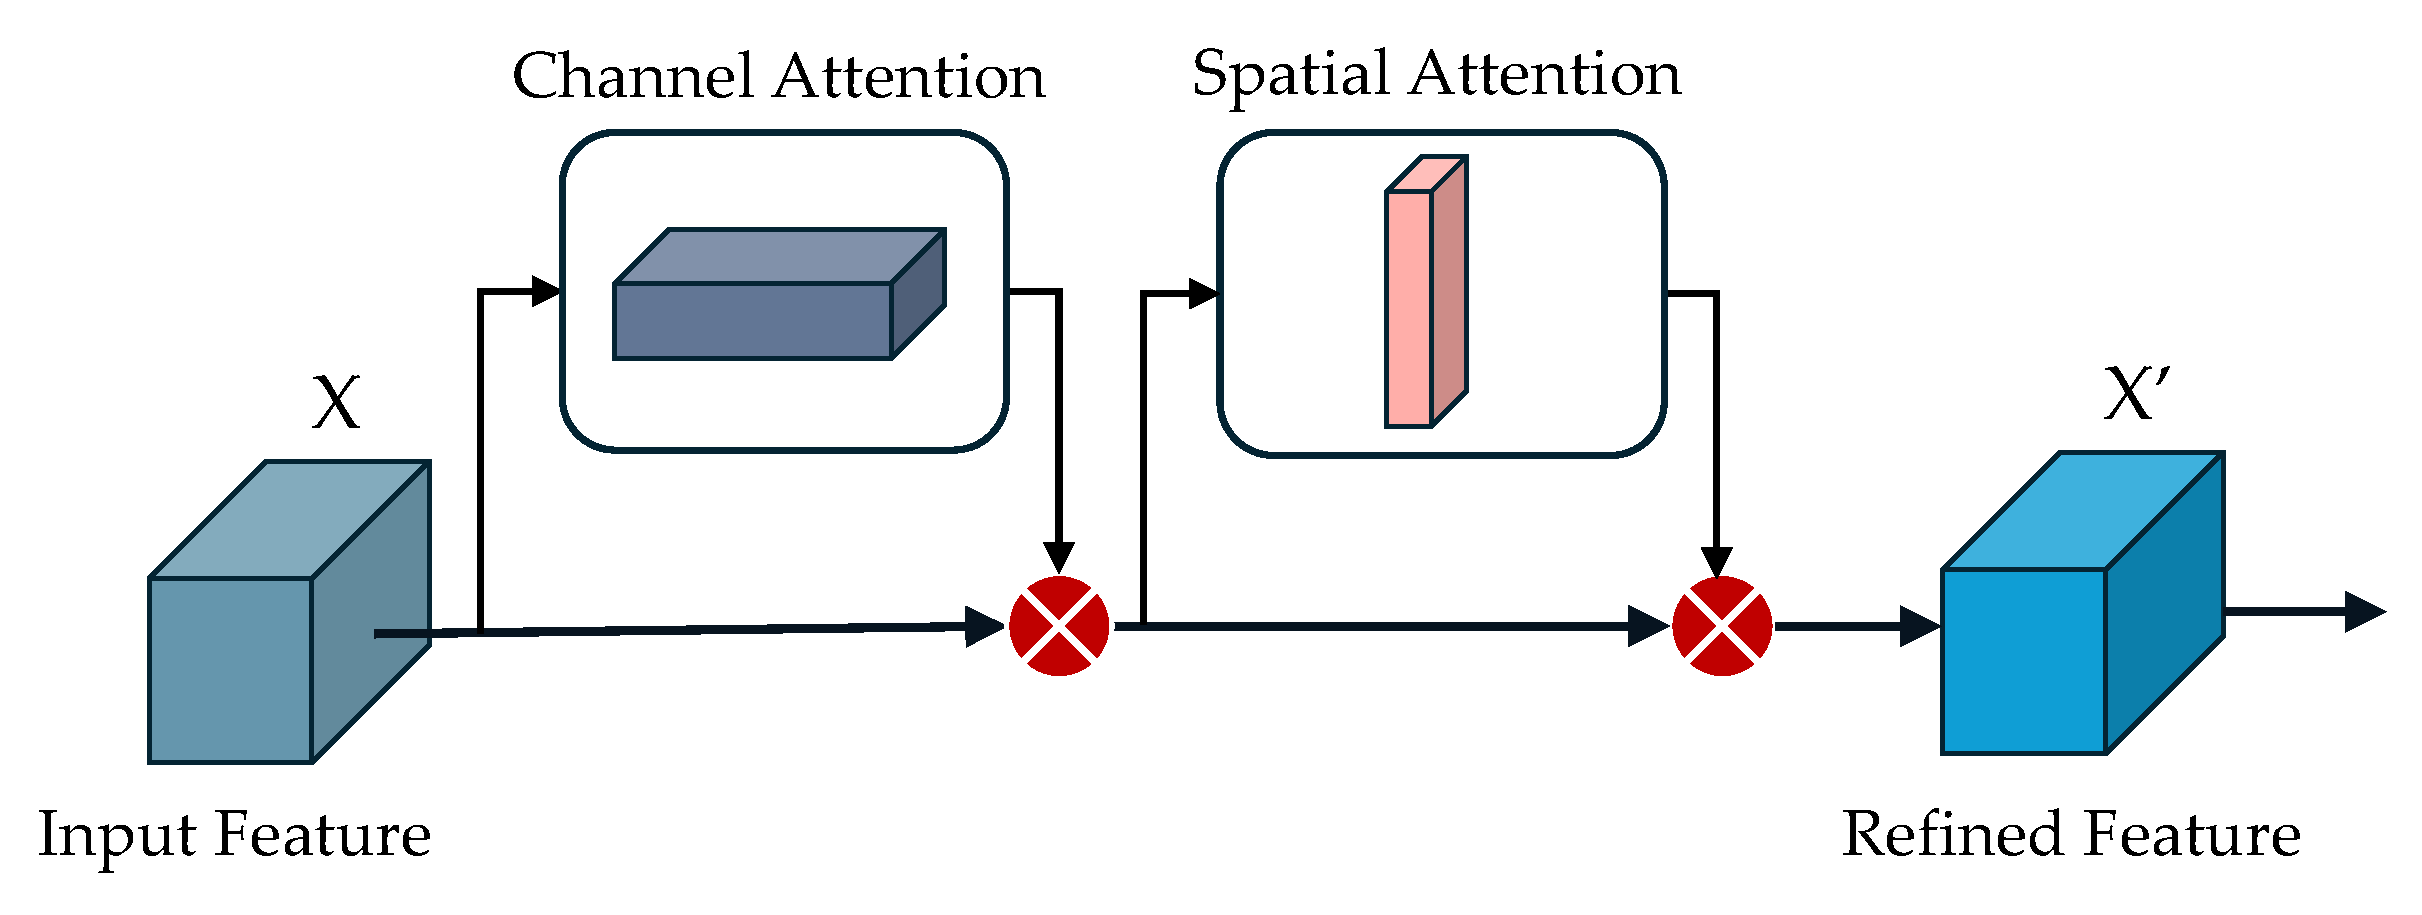
To further improve the discriminative capability of the learned features, each convolutional layer is followed by a CBAM, as illustrated in
Figure 3. This attention mechanism operates sequentially across channel-wise and temporal dimensions, allowing the network to emphasize informative components while reducing the influence of irrelevant or noisy features.
The channel attention sub-module determines the relative importance of individual feature channels by applying global average pooling and global max pooling over the temporal dimension. The resulting descriptors are processed by a shared multilayer perceptron (MLP), which first compresses the feature dimensionality using a ReLU-activated dense layer and then restores it through a sigmoid-activated dense layer. The generated attention weights are subsequently applied to the input feature map via element-wise scaling.
After channel refinement, the spatial attention component aims to locate the most informative temporal regions. It applies both average pooling and max pooling along the channel axis, concatenates the resulting maps, and processes them through a convolutional layer with a 3 × 1 kernel followed by a sigmoid activation. The resulting spatial attention map highlights and strengthens the significant temporal segments within the feature representation.
- (2).
BiGRU–Att Block
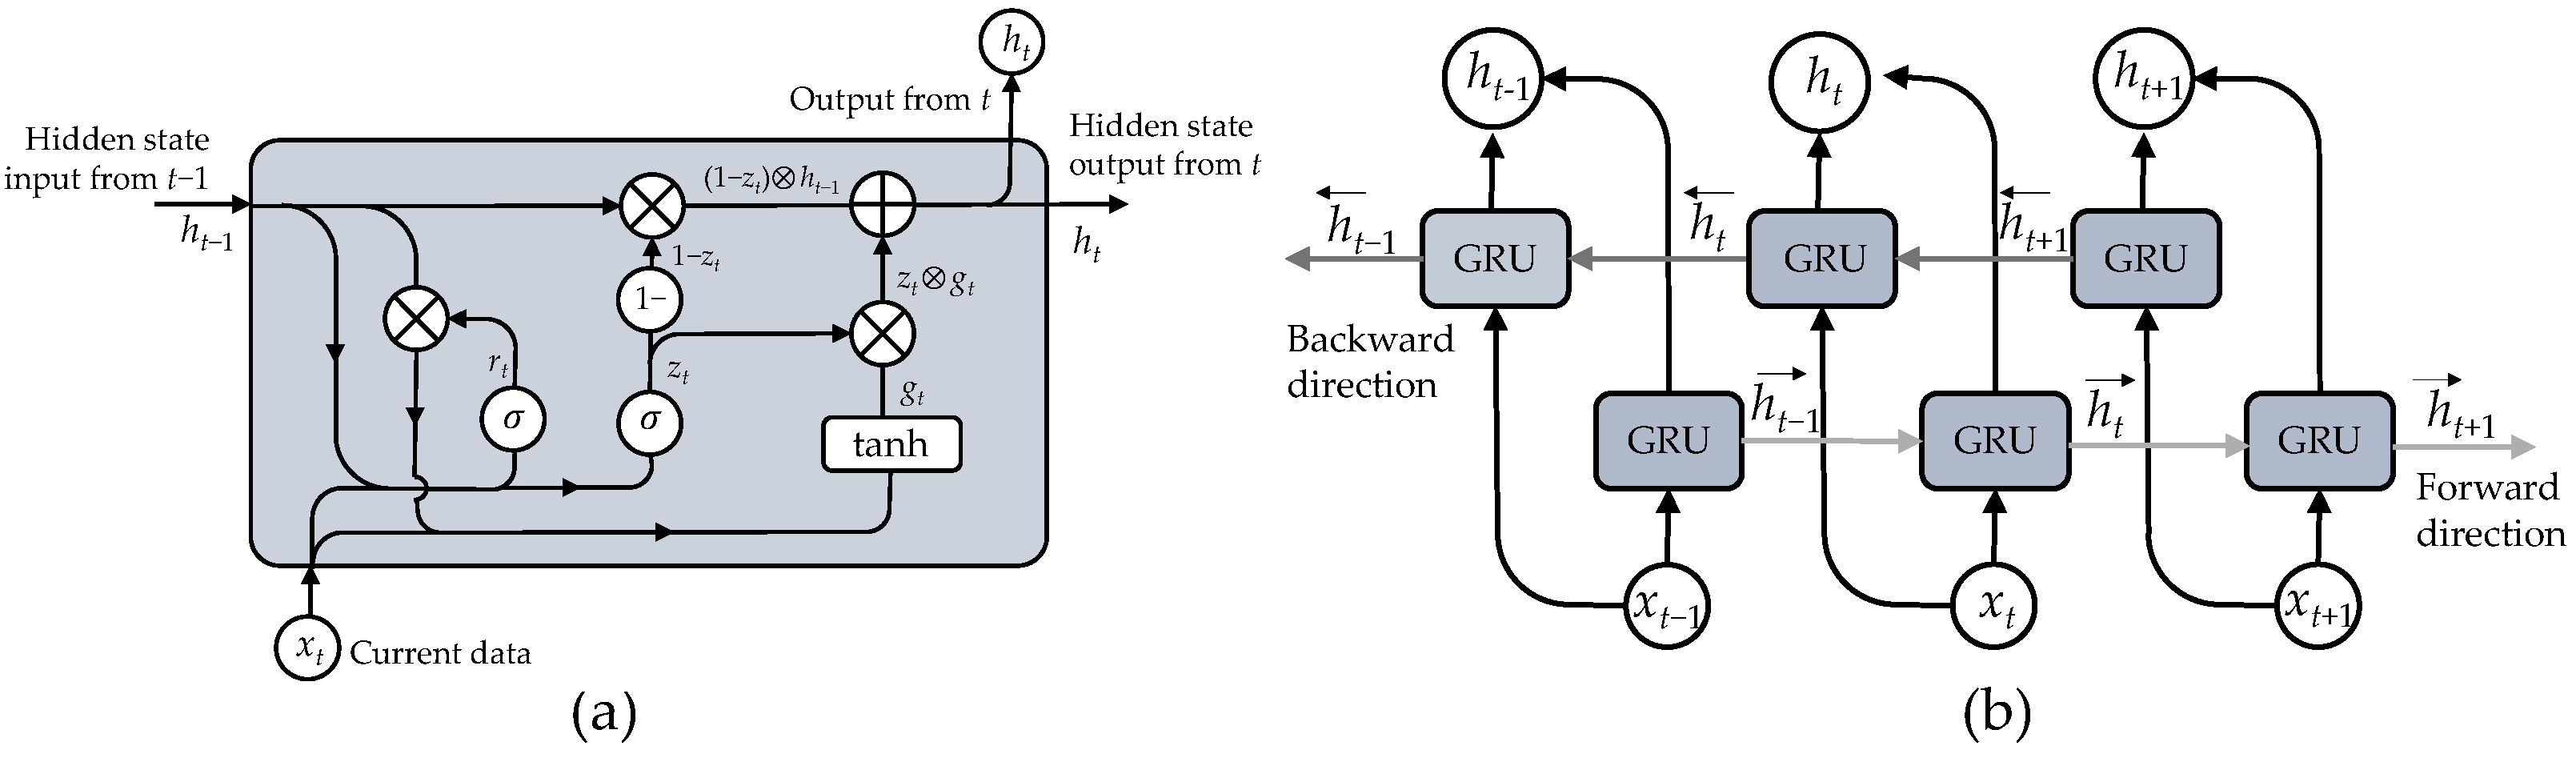
Figure 4a presents the internal structure of a GRU cell, which was designed to overcome several shortcomings of conventional RNNs. Unlike standard RNNs, the GRU introduces gating mechanisms that explicitly control how information is retained, updated, and propagated across time steps. The architecture of a GRU cell is defined by three core gates, namely the forget gate, the input gate, and the output gate, each of which plays a distinct role in managing temporal information flow within the network.
Following the stacked BiGRU layers, a self-attention module is incorporated to strengthen temporal modeling beyond short-range or local dependencies. Although BiGRUs are effective at learning sequential representations in both forward and backward temporal directions, they often place greater emphasis on more recent observations. This tendency can hinder their ability to represent long-term dependencies, particularly in scenarios involving complex, repetitive, or cyclic activity patterns. The self-attention mechanism alleviates this limitation by adaptively assigning importance weights to each time step based on its contextual significance across the entire sequence. As a result, the model can selectively emphasize temporally distant yet informative segments, regardless of their absolute position in the sequence, thereby enabling more comprehensive and balanced temporal reasoning.
3.3.2. Model Training
- (1).
Optimizer
The Adam optimization algorithm is employed as the parameter update strategy in this study. Adam performs iterative optimization over stochastic objective functions and is grounded in the adaptive estimation of low-order statistical moments. Owing to its design, the method achieves high computational efficiency while requiring only modest memory resources, making it well-suited for large-scale learning tasks.
A key characteristic of Adam is its ability to adjust the learning rate for each model parameter automatically. This adjustment is obtained by estimating the first- and second-order gradients, enabling more stable, reliable convergence. Furthermore, Adam applies a gradient normalization that is invariant to diagonal rescaling, thereby enhancing robustness when handling high-dimensional parameters or extensive datasets.
The optimizer offers several practical benefits, including straightforward implementation, fast convergence, reduced memory consumption, scale-invariant gradient updates, and minimal need for hyperparameter tuning. The specific Adam optimizer configuration used in this work is summarized in
Table 2.
In this context, denotes the learning rate, which determines the update step size during each gradient descent iteration. The decay parameter represents the weight decay coefficient and serves as a regularization mechanism by introducing an additional penalty term into the loss function, thereby mitigating overfitting.
- (2).
Loss function and performance metrics
The training objective employs a cross-entropy loss augmented with L2 regularization to discourage excessively large weights and enhance generalization. The cross-entropy component quantifies the discrepancy between the model’s predicted class probabilities and the ground-truth labels. Meanwhile, the L2 term limits parameter magnitudes by penalizing large values. The following equation expresses the cross-entropy formulation.
where
denotes the ground-truth label of the
i-th sample, and
represents the corresponding predicted probability. To mitigate overfitting, a regularization attenuation term is further introduced into the loss function. The resulting formulation is given as follows.
where
represents the primary loss term, specifically the cross-entropy objective. The second term corresponds to the regularization component, where
is the regularization factor,
n denotes the number of training samples, and
indicates the model parameters. Incorporating weight decay through L2 regularization helps reduce overfitting by discouraging excessively large parameter values.
3.4. Inference Procedure and Evaluation Protocol
To support reproducibility, this section provides a complete description of the inference pipeline used during model evaluation. The pipeline comprises four components: time-based windowing, label prediction, output post-processing, and the protocol for computing performance metrics.
3.4.1. Time-Based Windowing at Inference
During inference, the continuous sensor stream from each test subject was divided into segments using the same sliding window configuration applied in the training phase. The window duration was selected from the set seconds based on validation performance, and a non-overlapping stride was applied with zero percent overlap. Each segment was passed independently through the trained CNN–CBAM–BiGRU model, with no contextual information from neighbouring windows incorporated into the prediction process. The windowing parameters and feature scaling bounds—specifically, the minimum and maximum values derived from the training set—were saved during training and applied consistently to the test data to prevent information leakage.
3.4.2. Label Prediction
The output layer of the CNN–CBAM–BiGRU model comprises two fully connected layers succeeded by a softmax activation. For each input segment
, the model generates a probability distribution
across
C target classes. The number of classes is dataset-dependent:
for HARTH,
for HAR70+, and
for SisFall, where the two classes correspond to falls and activities of daily living. The activity label assigned to each segment is determined by selecting the class with the highest predicted probability:
where
represents the predicted probability assigned to class
c.
3.4.3. Evaluation Protocol
Model performance was measured using a five-fold cross-validation strategy, with data partitioning at the subject level rather than the window level. Each participant was randomly allocated to one of five groups of roughly equal size. In every fold, one group was reserved as the held-out test set while the remaining four groups served as the training data. This subject-independent design guarantees that motion patterns from any test participant are absent from the training set, thereby providing a realistic estimate of how well the model generalises to previously unseen individuals.
Within each fold, the training portion was further split into an
training subset and a
validation subset, also at the subject level. This inner split was used for early stopping and for selecting model checkpoints. The model parameters that yielded the highest validation accuracy were retained for testing. Predictions from each held-out fold were then aggregated across all five folds to derive the final recognition metrics: accuracy, macro-averaged precision, macro-averaged recall, and macro-averaged F1-score. The mean and standard deviation of each metric over the five folds are reported in
Table 3,
Table 4 and
Table 5 while per-class metrics are presented in
Table 6.
5. Discussion
5.1. Model Performance Analysis
5.1.1. Confusion Matrices
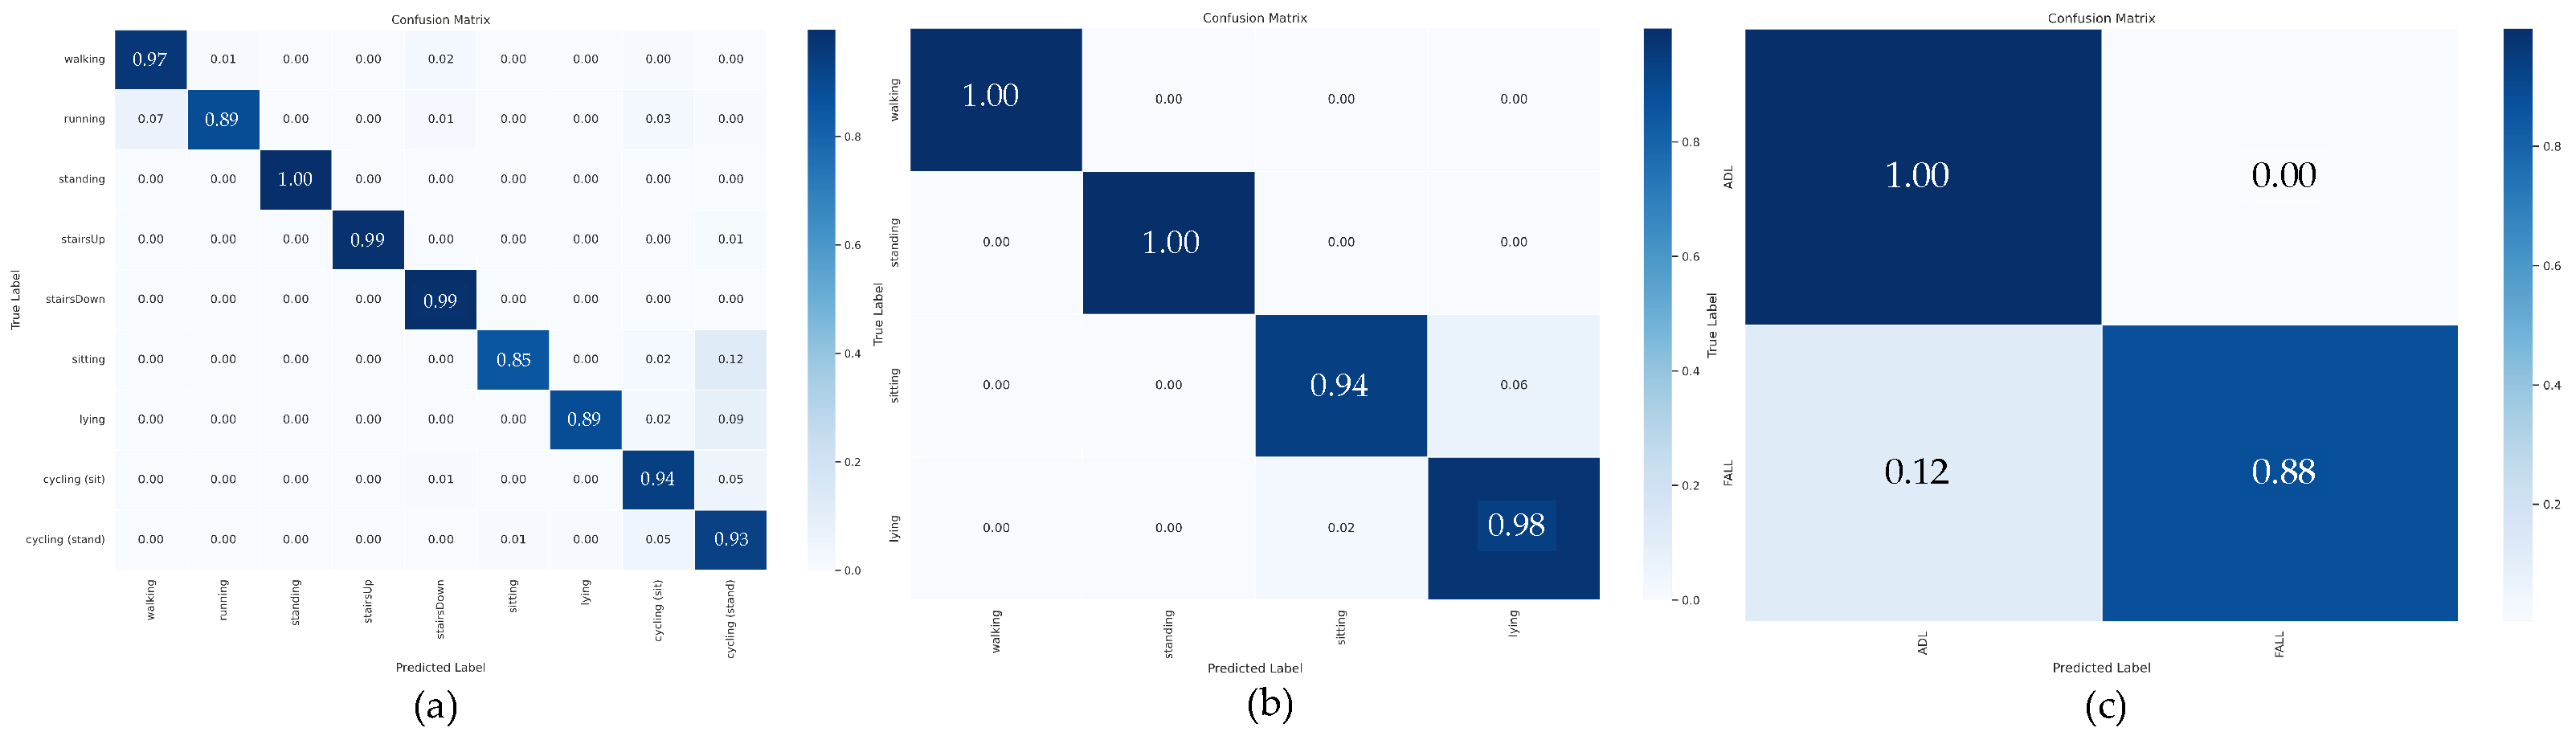
To obtain a more detailed understanding of the classification behavior of the proposed CNN–CBAM–BiGRU architecture, confusion matrices were examined for all three benchmark datasets.
Figure 5 illustrates the matrices corresponding to HARTH, HAR70+, and SisFall, highlighting class-wise prediction distributions and identifying potential sources of misclassification.
For the HARTH dataset, the confusion matrix shows pronounced diagonal elements, reflecting strong recognition performance across activity categories. Static postures such as lying (>98%), standing (>96%), and sitting (>95%) were classified with high reliability. Nevertheless, certain ambiguities appeared among activities with comparable motion dynamics. In particular, walking was occasionally misidentified as running, and stair ascending showed overlap with stair descending. Such confusion is reasonable due to their similar biomechanical patterns. A small degree of overlap was also observed between inactive sitting and regular sitting, likely caused by subtle differences in posture and movement intensity. Overall, the matrix indicates that integrating attention mechanisms with temporal sequence modeling enables clear separation of most activities, while errors mainly occur among actions with similar kinematic profiles.
The confusion matrix derived from the HAR70+ dataset shows even stronger diagonal dominance than that of HARTH, which corresponds to the higher overall accuracy achieved. Recognition of static behaviors—including lying (>99%), standing (>98%), and sitting (>98%)—was particularly robust, which is essential for monitoring daily routines in elderly individuals. Dynamic activities such as walking and shuffling were also classified with high accuracy (>97%). Minor confusion between these two classes was observed, likely due to the tendency for elderly walking patterns to resemble shuffling movements. Stair-related actions, both ascending and descending, were distinguished with minimal cross-class interference. These findings suggest that the proposed framework is especially effective for activity recognition within older populations, confirming its suitability for the intended demographic.
In the SisFall dataset, the confusion matrix demonstrates the model’s strong discriminative ability between fall events and ADLs, a critical requirement for safety-monitoring systems. The classification structure (fall vs. ADL vs. alert) exhibits clear separation, with fall incidents correctly detected in the majority of instances (>93%). Compared with intra-class ambiguities observed in other datasets, confusion between falls and ADLs was relatively limited. This indicates that the joint spatial feature extraction and bidirectional temporal modeling effectively capture distinctive fall characteristics. Some overlap occurred between alert states (e.g., pre-fall or near-fall conditions) and both fall and ADL classes, as expected given their transitional nature. Notably, the high recall for fall detection (93.74%) underscores the model’s ability to identify most true fall events, thereby reducing critical false negatives that could jeopardize elderly safety.
5.1.2. Model Convergence Analysis
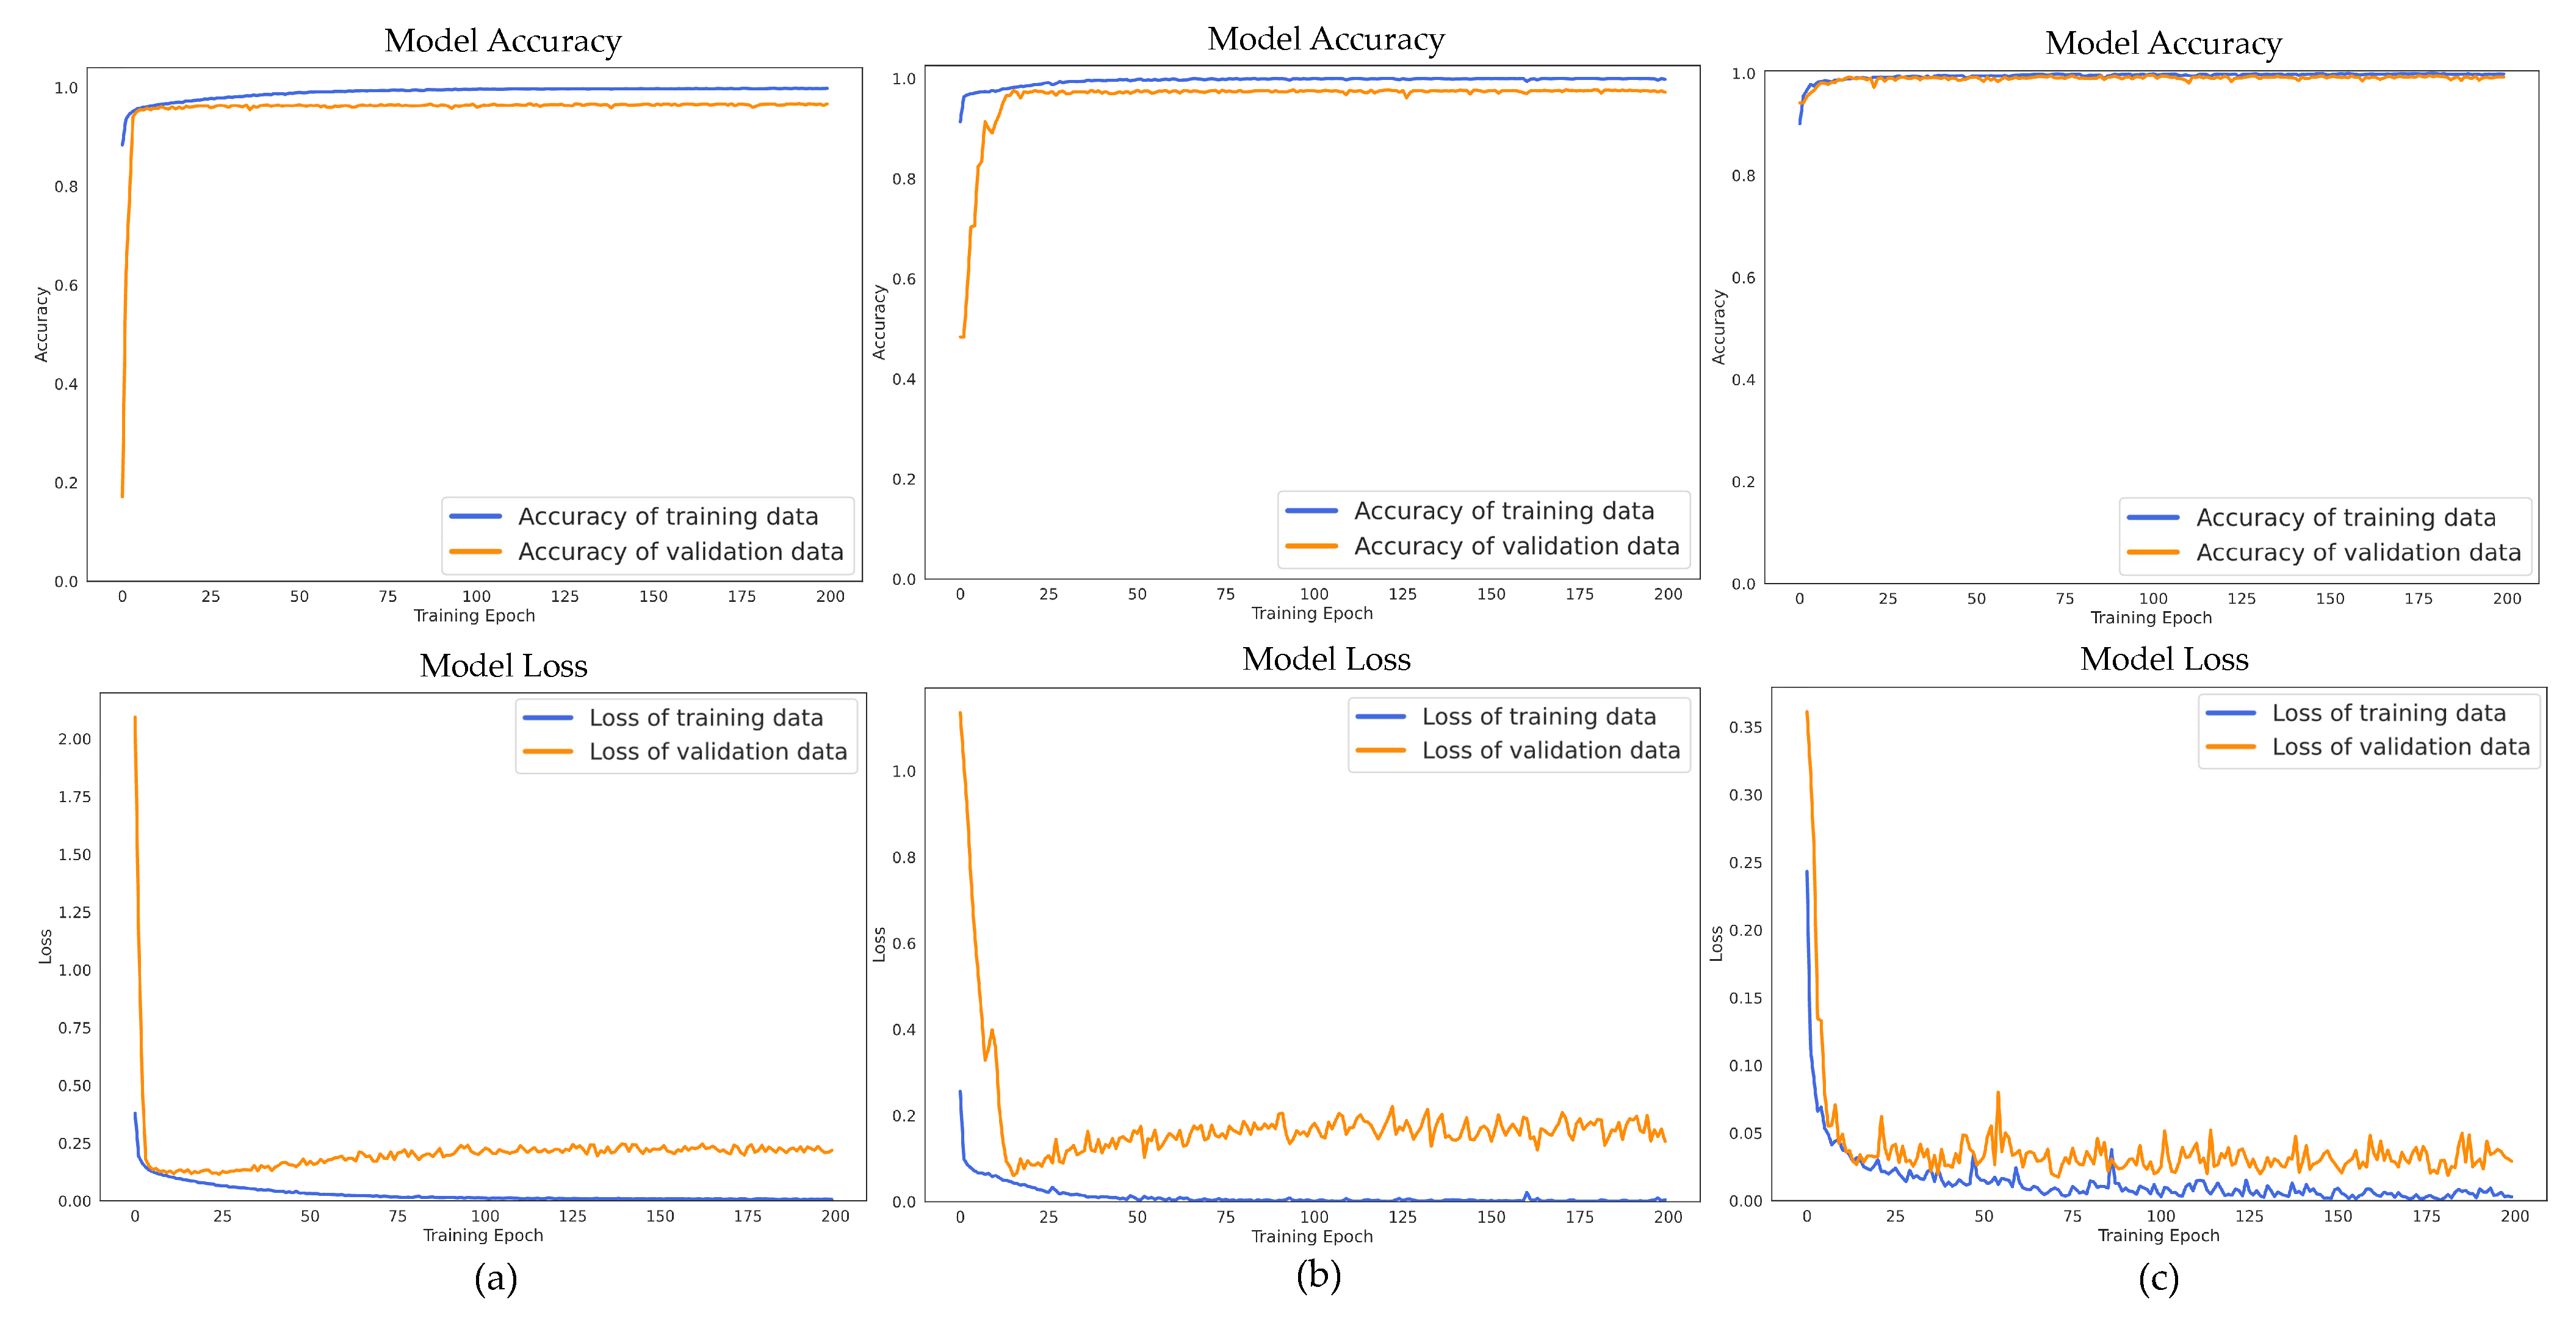
Figure 6 illustrates the training and validation accuracies, as well as the loss trajectories, of the CNN–CBAM–BiGRU model across all three benchmark datasets. These curves provide a detailed view of the learning progression, optimization stability, and convergence characteristics of the proposed framework.
For the HARTH dataset, the accuracy plots indicate a sharp improvement during the early training phase, particularly within the first 20–30 epochs, where both training and validation accuracy increased to nearly 90%. Performance then continued to rise gradually, reaching convergence between epochs 80 and 100. The final training accuracy was approximately 97.5%, whereas validation accuracy stabilized around 96.8%. The small discrepancy between these values suggests only minor overfitting. The corresponding loss curves display a similar trend, with a rapid decrease during the initial epochs followed by stabilization at low magnitudes (training loss ≈ 0.20; validation loss ≈ 0.22) near epoch 100. The consistent proximity between the training and validation curves throughout the optimization process indicates that L2 regularization and dropout effectively controlled model complexity while preserving generalization.
In the case of the HAR70+ dataset, convergence occurred even more rapidly than with HARTH. Accuracy exceeded 95% within approximately 15–20 epochs. This accelerated learning can be associated with the more homogeneous elderly cohort (aged 70+) and the semi-structured data-acquisition procedure, which yielded relatively consistent motion patterns. The model attained a final training accuracy of about 98.2% and a validation accuracy of 97.6% around epochs 60–70, demonstrating high training efficiency. The loss curves reveal a steep initial decline, followed by smooth stabilization, with negligible oscillations in the later stages. The minimal gap between training and validation metrics (accuracy difference < 0.6%; loss difference < 0.05) indicates strong generalization, suggesting that the model captures underlying patterns rather than memorizing the training data.
The learning dynamics observed in the SisFall dataset differ from those in the previous two datasets. During the initial phase, accuracy increased extremely quickly, surpassing 96% within 10–15 epochs. This behavior is likely due to the pronounced distinction between fall events and regular ADLs. Nevertheless, achieving full convergence required a longer training duration (approximately 120–150 epochs), highlighting the complexity involved in differentiating diverse fall types and transitional alert states. The final training accuracy reached roughly 99.2%, while the validation accuracy stabilized at 98.9%, resulting in the smallest performance gap among the three datasets. After epoch 100, the loss curves showed steady convergence with limited fluctuation. Although the validation curves exhibited slightly greater variability—particularly in loss—this effect can be attributed to class imbalance and the heterogeneity of fall scenarios. Despite these challenges, the persistent downward trend and eventual stabilization confirm stable optimization and effective regularization.
5.2. Per-Class Performance Analysis
To further examine the discriminative capability of the proposed framework across individual activity categories, a detailed class-wise evaluation was performed.
Table 7 reports the precision, recall, and F1-score for each activity class within the three benchmark datasets. This analysis highlights the model’s strengths and identifies specific classes that remain comparatively challenging.
On the HARTH dataset, the CNN–CBAM–BiGRU model achieved particularly strong results for static and posture-oriented activities. The standing class obtained the highest performance, reaching 99.6% precision, 99.7% recall, and 99.6% F1-score. Similarly, stairs down recorded approximately 99.4% across all evaluation metrics, while stairs up achieved 98.6% precision, 97.4% recall, and 98.0% F1-score. These outcomes suggest that the model effectively learns distinctive sensor signatures associated with stationary postures and structured locomotion patterns such as stair traversal. The walking category also demonstrated robust recognition, with 95.5% precision and 97.3% recall, confirming reliable detection of fundamental ambulatory movement. In contrast, certain dynamic activities posed greater difficulty. Running reached 92.6% precision and 89.2% recall, likely due to overlap with brisk walking patterns and inter-subject variability in running style. The sitting class had the lowest precision (81.6%) and recall (87.5%), reflecting confusion between inactive sitting and subtle differences among sitting postures. The lying class achieved 90.2% precision and 89.9% recall. Both cycling activities (seated and standing) exhibited balanced results within the 92–93% range across all metrics.
Results from the HAR70+ dataset demonstrate consistently high per-class performance, indicating that the model is well-optimized for elderly-specific motion recognition. The walking class achieved near-perfect values, with 99.9% precision and 99.6% recall, showing that characteristic movement patterns of older adults were successfully captured despite reduced gait speed and intensity. The standing posture also maintained excellent performance, with 99.7% precision and 99.8% recall. For lying, the model obtained 97.5% precision and 97.9% recall. Although still strong, sitting yielded comparatively lower values (95.2% precision and 94.4% recall), consistent with the challenges observed in HARTH. This recurring pattern indicates that sitting may present classification difficulty across populations, possibly due to variability in posture configuration and transitional movements between seated and non-seated states.
In the SisFall dataset, which involves a binary classification structure, performance characteristics differed from those in multi-class scenarios. ADLs were recognized with exceptionally high accuracy, achieving 99.6% precision, recall, and F1-score. This strong discrimination between normal activities and fall-related events is crucial for minimizing false alarms in practical monitoring systems. The fall class achieved 94.0% across precision, recall, and F1-score. Although slightly lower than ADL performance, these results remain robust. The balanced precision and recall values for falls indicate stable detection performance without systematic bias toward over-detection or missed events. Such an equilibrium is essential in elderly care environments, where both false negatives and false positives can have serious implications for safety and system reliability.
Across all classes, the per-class results demonstrate that the performance advantages of CNN–CBAM–BiGRU over the baseline models are distributed broadly across activity categories. These gains cannot be attributed to improvements in any single dominant class. The steady increases in precision and recall observed across both stationary postures and movement-based activities suggest that the architectural modifications—in particular, multi-scale CBAM attention and bidirectional temporal modelling—make a meaningful contribution to classification performance throughout the entire activity space.
6. Conclusions and Future Works
This study proposed a hybrid deep residual architecture integrating CNN, CBAM, and BiGRU for wearable-based elderly activity recognition. Extensive evaluation on three elderly-focused benchmark datasets (HARTH, HAR70+, and SisFall) demonstrated consistent superiority over state-of-the-art baseline models. The proposed CNN–CBAM–BiGRU achieved 96.82% accuracy on HARTH, 97.58% on HAR70+, and 98.92% on SisFall, with 93.74% recall for fall detection. These results confirm the robustness and suitability of the framework for real-world elderly monitoring and safety-critical applications.
The strong performance can be attributed to the complementary architectural design. CNN layers effectively extracted multi-scale spatial representations from raw sensor signals, CBAM enhanced discriminative feature selection through adaptive attention, and BiGRU captured bidirectional temporal dependencies within activity sequences. Residual connections facilitated stable training and mitigated gradient degradation. Class-wise analysis indicated near-perfect recognition of static activities, while most misclassifications occurred between kinematically similar actions, reflecting expected behavioral overlap. Convergence analysis further confirmed stable optimization and minimal overfitting.
Despite these promising results, several limitations remain. The datasets were collected in controlled or semi-structured environments and may not fully represent real-world variability. Computational complexity may constrain deployment on highly resource-limited wearable devices. Real-time latency, personalization mechanisms, and robustness to sensor placement variation were not extensively investigated.
Cross-dataset generalisation was not examined in this study. Specifically, no experiments were conducted in which a model trained on one dataset was tested on a separate dataset without additional fine-tuning. The subject-independent 5-fold cross-validation protocol provides a robust measure of how well a model generalizes to new individuals within the same dataset. However, it does not capture how well the model generalizes to datasets with different sensor positioning, acquisition frequency, or activity label schemes. The three datasets employed here vary considerably in their configurations. HARTH and HAR70+ both use thigh and back sensors sampled at 50 Hz, whereas SisFall uses a waist-mounted sensor at 200 Hz. Given these differences, it remains unclear whether the CNN–CBAM–BiGRU architecture can maintain its performance across such distributional divergences without dataset-specific retraining. This constitutes an open research question.
Future research will focus on evaluation using naturalistic home-based datasets and longitudinal monitoring to assess adaptability to mobility changes. Model compression techniques, including pruning, quantization, and knowledge distillation, will be explored to support deployment on low-power devices. Personalized adaptation strategies and multimodal sensor fusion may further enhance recognition accuracy. In addition, explainable AI approaches will be investigated to improve transparency and trust. Methodological extensions, such as transformer-based architectures, graph neural networks, and semi-supervised learning, could further improve performance. Addressing class imbalance, particularly for rare fall events, remains a critical direction for improving the reliability of safety monitoring.