Article

Automated Single-Slice Lumbar QCT HU Value Measurement with Clinical Workflow

Faculty of Health Sciences, Hokkaido University, Sapporo 060-0812, Japan
*
Author to whom correspondence should be addressed.
Mach. Learn. Knowl. Extr. 2026, 8(3), 77; https://doi.org/10.3390/make8030077
Submission received: 10 January 2026 / Revised: 9 March 2026 / Accepted: 15 March 2026 / Published: 19 March 2026

Abstract

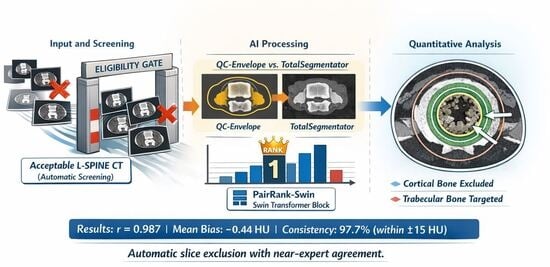
Manual single-slice lumbar quantitative computed tomography (QCT) depends on operator-driven slice selection and trabecular region-of-interest (ROI) placement. We developed a fully automated single-slice workflow for vertebral trabecular Hounsfield unit (HU) measurement that combines unsuitable-slice prescreening, dual-purpose segmentation, intra-patient slice-quality ranking, and a deterministic inner ROI rule. The pipeline includes an Eligibility Gate, QC-Envelope segmentation for broad, vertebral- and usability-preserving delineation, PairRank-Swin for best-slice selection, and dedicated trabecular segmentation for final quantitative analysis. In the independent external cohort, 4 cases were considered non-evaluable by both manual review and the pipeline, and 2 additional borderline-quality cases were manually measured but rejected by the pipeline; therefore, paired HU agreement analysis included 44 evaluable cases. Agreement remained high, with Pearson’s r = 0.987, Lin’s CCC = 0.985, mean bias −0.44 HU, and limits of agreement from −14.88 to +13.99 HU. Coverage was 84.1% within ±10 HU and 97.7% within ±15 HU. Ablation analysis showed that slice ranking and ROI erosion were the most critical components. In an open module-level baseline comparison, QC-Envelope segmentation substantially outperformed TotalSegmentator. This workflow provides high agreement with expert HU measurement while preserving reviewable intermediate outputs.

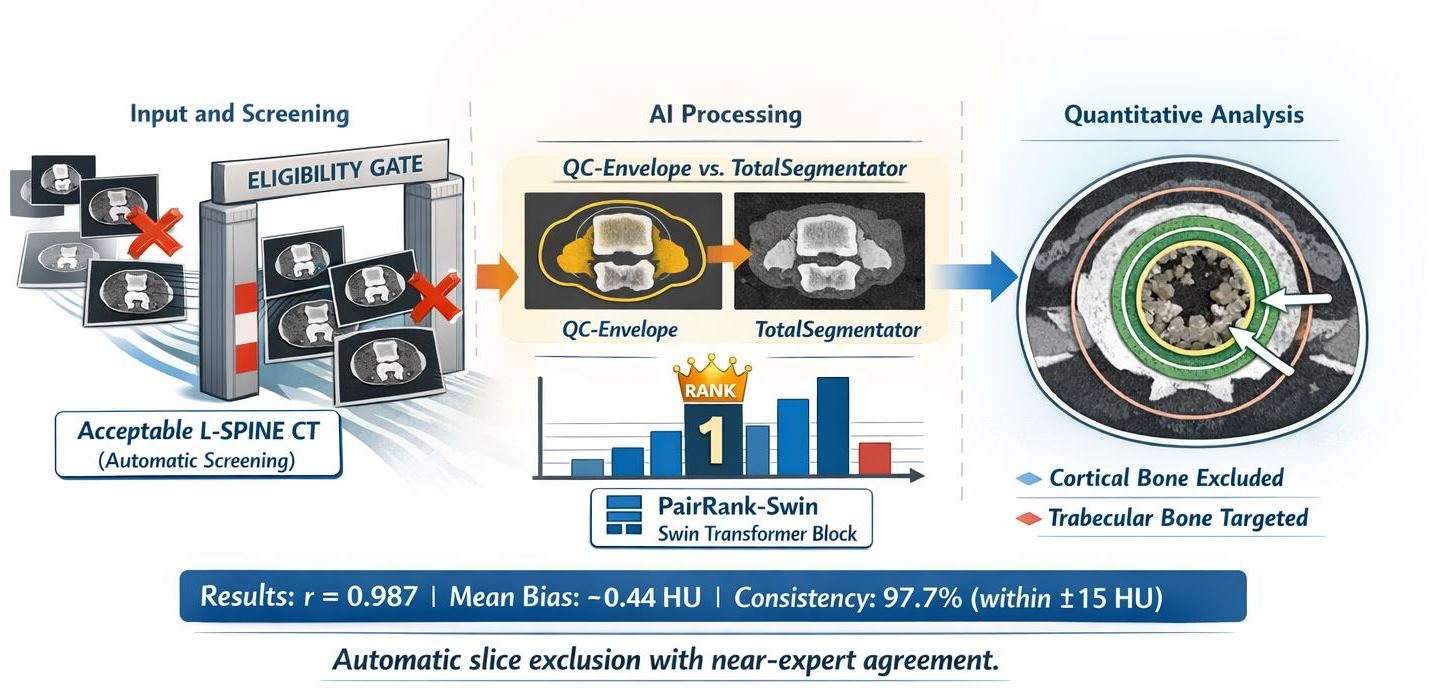
Graphical Abstract

1. Introduction

Osteoporosis is a major health concern, affecting approximately 200 million people worldwide and resulting in 8.9 million fractures annually [1]. Bone mineral density (BMD) is a key biomarker for assessing skeletal health and stratifying fracture risk. The lumbar spine is clinically important because of its high trabecular content and sensitivity to metabolic bone loss, although degenerative change may confound density-related measurements in older populations [2].
Dual-energy X-ray absorptiometry (DXA) remains the most widely used tool for BMD measurement. However, its two-dimensional projection nature makes areal BMD (aBMD) susceptible to degenerative change, vascular calcification, and positioning-related bias [3,4]. In adults over 60 years, spinal osteophytosis can spuriously elevate AP lumbar spine DXA BMD by approximately 16% in women and 21% in men [5]. Quantitative computed tomography (QCT), by contrast, provides true volumetric BMD (vBMD) and three-dimensional structural information that can improve skeletal assessment and fracture-risk estimation [6,7,8]. In parallel, opportunistic CT approaches have used vertebral attenuation, such as trabecular HU on routine CT, as a practical surrogate for bone density and fracture risk stratification without dedicated QCT acquisition [9,10,11,12]. Nevertheless, contrast enhancement, scanner differences, and protocol heterogeneity can systematically shift attenuation values, motivating protocol-aware correction and harmonization for robust real-world use [13,14].
It is important to distinguish the present task from full volumetric QCT and from broader opportunistic osteoporosis-screening systems. Although volumetric QCT yields true vBMD, the primary validated endpoint in the present study is expert-level agreement in vertebral trabecular HU measurement on a clinically selected single slice. Any HU-to-vBMD conversion in this work is therefore exploratory and institution-specific, rather than the primary validated output. The single-slice design was a deliberate, workflow-oriented choice, motivated by compatibility with established operator-driven lumbar QCT practice, lower annotation burden, and preservation of reviewable slice selection and ROI definition steps, rather than by a claim of universal superiority over volumetric approaches.
Despite these practical advantages, conventional lumbar QCT remains time-consuming and operator-dependent because it requires manual slice selection and ROI delineation, limiting reproducibility and scalability. In addition, metallic implants, severe degenerative change, and endplate-related sclerosis may affect quantitative reliability. Prior automated vertebral-analysis studies have demonstrated the feasibility of deep-learning-based segmentation [15,16], and broader opportunistic CT pipelines have reported large-scale screening-oriented workflows [17,18]. However, these approaches do not generally target the specific workflow addressed here: operator-style single-slice trabecular HU measurement with explicit slice-level eligibility control, intra-patient best-slice selection, and reviewable intermediate outputs for stepwise verification. Accordingly, we developed a fully automated quality-control-first pipeline for single-slice lumbar QCT HU measurement that integrates slice eligibility screening, broad vertebral segmentation to ensure usability, slice-quality ranking, dedicated trabecular segmentation, and a deterministic inner ROI rule.

2. Materials and Methods

2.1. Study Population

We retrospectively included 141 adults who underwent lumbar quantitative computed tomography (QCT). At study start, we prespecified a split into a development set (n = 91) and an independent external validation set (n = 50) to avoid training information leakage. The CT examinations used in this retrospective analysis were acquired during routine clinical care between 2023 and 2025 and were de-identified prior to analysis. Development cases were acquired on a Canon/Toshiba Aquilion ONE scanner (Canon Medical Systems Corporation, Otawara, Tochigi, Japan) between August 2023 and June 2025 (mean age 64.6 ± 14.4 years; 56 females). In total, 2625 axial L1–L3 slices were retrieved; 737 (28.1%) exhibited severe vertebral deformity or metal artifacts and were retained to preserve distributional diversity and to avoid over-cleaning the developmental distribution. Patient demographics and slice statistics of the development and external validation cohorts are summarized in Table 1. For training different components, the development set was partitioned into functional subsets as in Table 2 (Eligibility Gate subset: 27 patients, 736 slices; segmentation subset (QC-Envelope + trabecular): 38 patients, 922 manually labeled slices; Intra-patient Quality Ranking subset: all 91 patients, with a coarse bone-mask prefilter removing 265 low-quality slices and keeping 2360 for training).
The external validation cohort (n = 50) was independent of the development cohort and served as an independent single-center validation cohort with protocol and device variation relative to model development, including Aquilion PRIME and Aquilion PRECISION scanners (Canon Medical Systems Corporation, Otawara, Tochigi, Japan) (n = 12 and n = 5, respectively), a Philips iCT 256 scanner (Philips Healthcare, Best, The Netherlands) (n = 1), and an Aquilion ONE scanner with differing parameters (Canon Medical Systems Corporation, Otawara, Tochigi, Japan) (n = 32), yielding 1482 slices in total. This cohort was primarily used for independent evaluation of the finalized pipeline and for locked-threshold validation of the models developed on the development cohort, without any involvement in model training or threshold tuning. Details of the external validation cohort are presented in Table 1.

2.2. CT Acquisition Protocols

All examinations were performed with routine QCT acquisition at our institution. Patients were scanned in the supine position with standard lumbar coverage (L1–L3). In the development set, most examinations were performed at 120 kVp (n = 60), with the remainder at 135 kVp (n = 31); the tube current averaged 310 ± 163 mA (range, 80–638 mA). Slice thickness was 3.0 mm (n = 64) or 5.0 mm (n = 23). The in-plane matrix varied across examinations; however, all visual-learning modules operated on standardized, resized inputs during training and inference, whereas the native DICOM geometry was retained for final ROI back-mapping and HU calculation. The field of view was 161.1 ± 29.2 mm. Detailed data for the development set are provided in Table 3. For the external validation cohort, scanner-specific parameters varied across devices and protocols.

2.3. Automated Pipeline

The proposed pipeline (Figure 1) comprises four sequential modules—from raw DICOM slices to HU computation—with intermediate outputs retained for review and traceability.

2.3.1. Pre-Processing

Axial L1–L3 volumes were exported from PACS and clipped to −1000 to 1000 HU, linearly normalized, and resampled in-plane to 1 × 1 mm. This clipping range was chosen to stabilize downstream visual-learning modules by suppressing extreme air and metal values while preserving the anatomical contrast relevant to vertebral morphology and ROI localization. A coarse vertebral bone mask was generated via Otsu thresholding followed by elliptical-kernel morphological closing (×3) and largest-component selection. This coarse vertebral bone mask was used as the sole input to the Eligibility Gate (Section 2.3.2) and as an auxiliary mask for subsequent shape-related processing; no slice was excluded at this step.

2.3.2. Eligibility Gate: ViT-B/16 Slice Prescreening

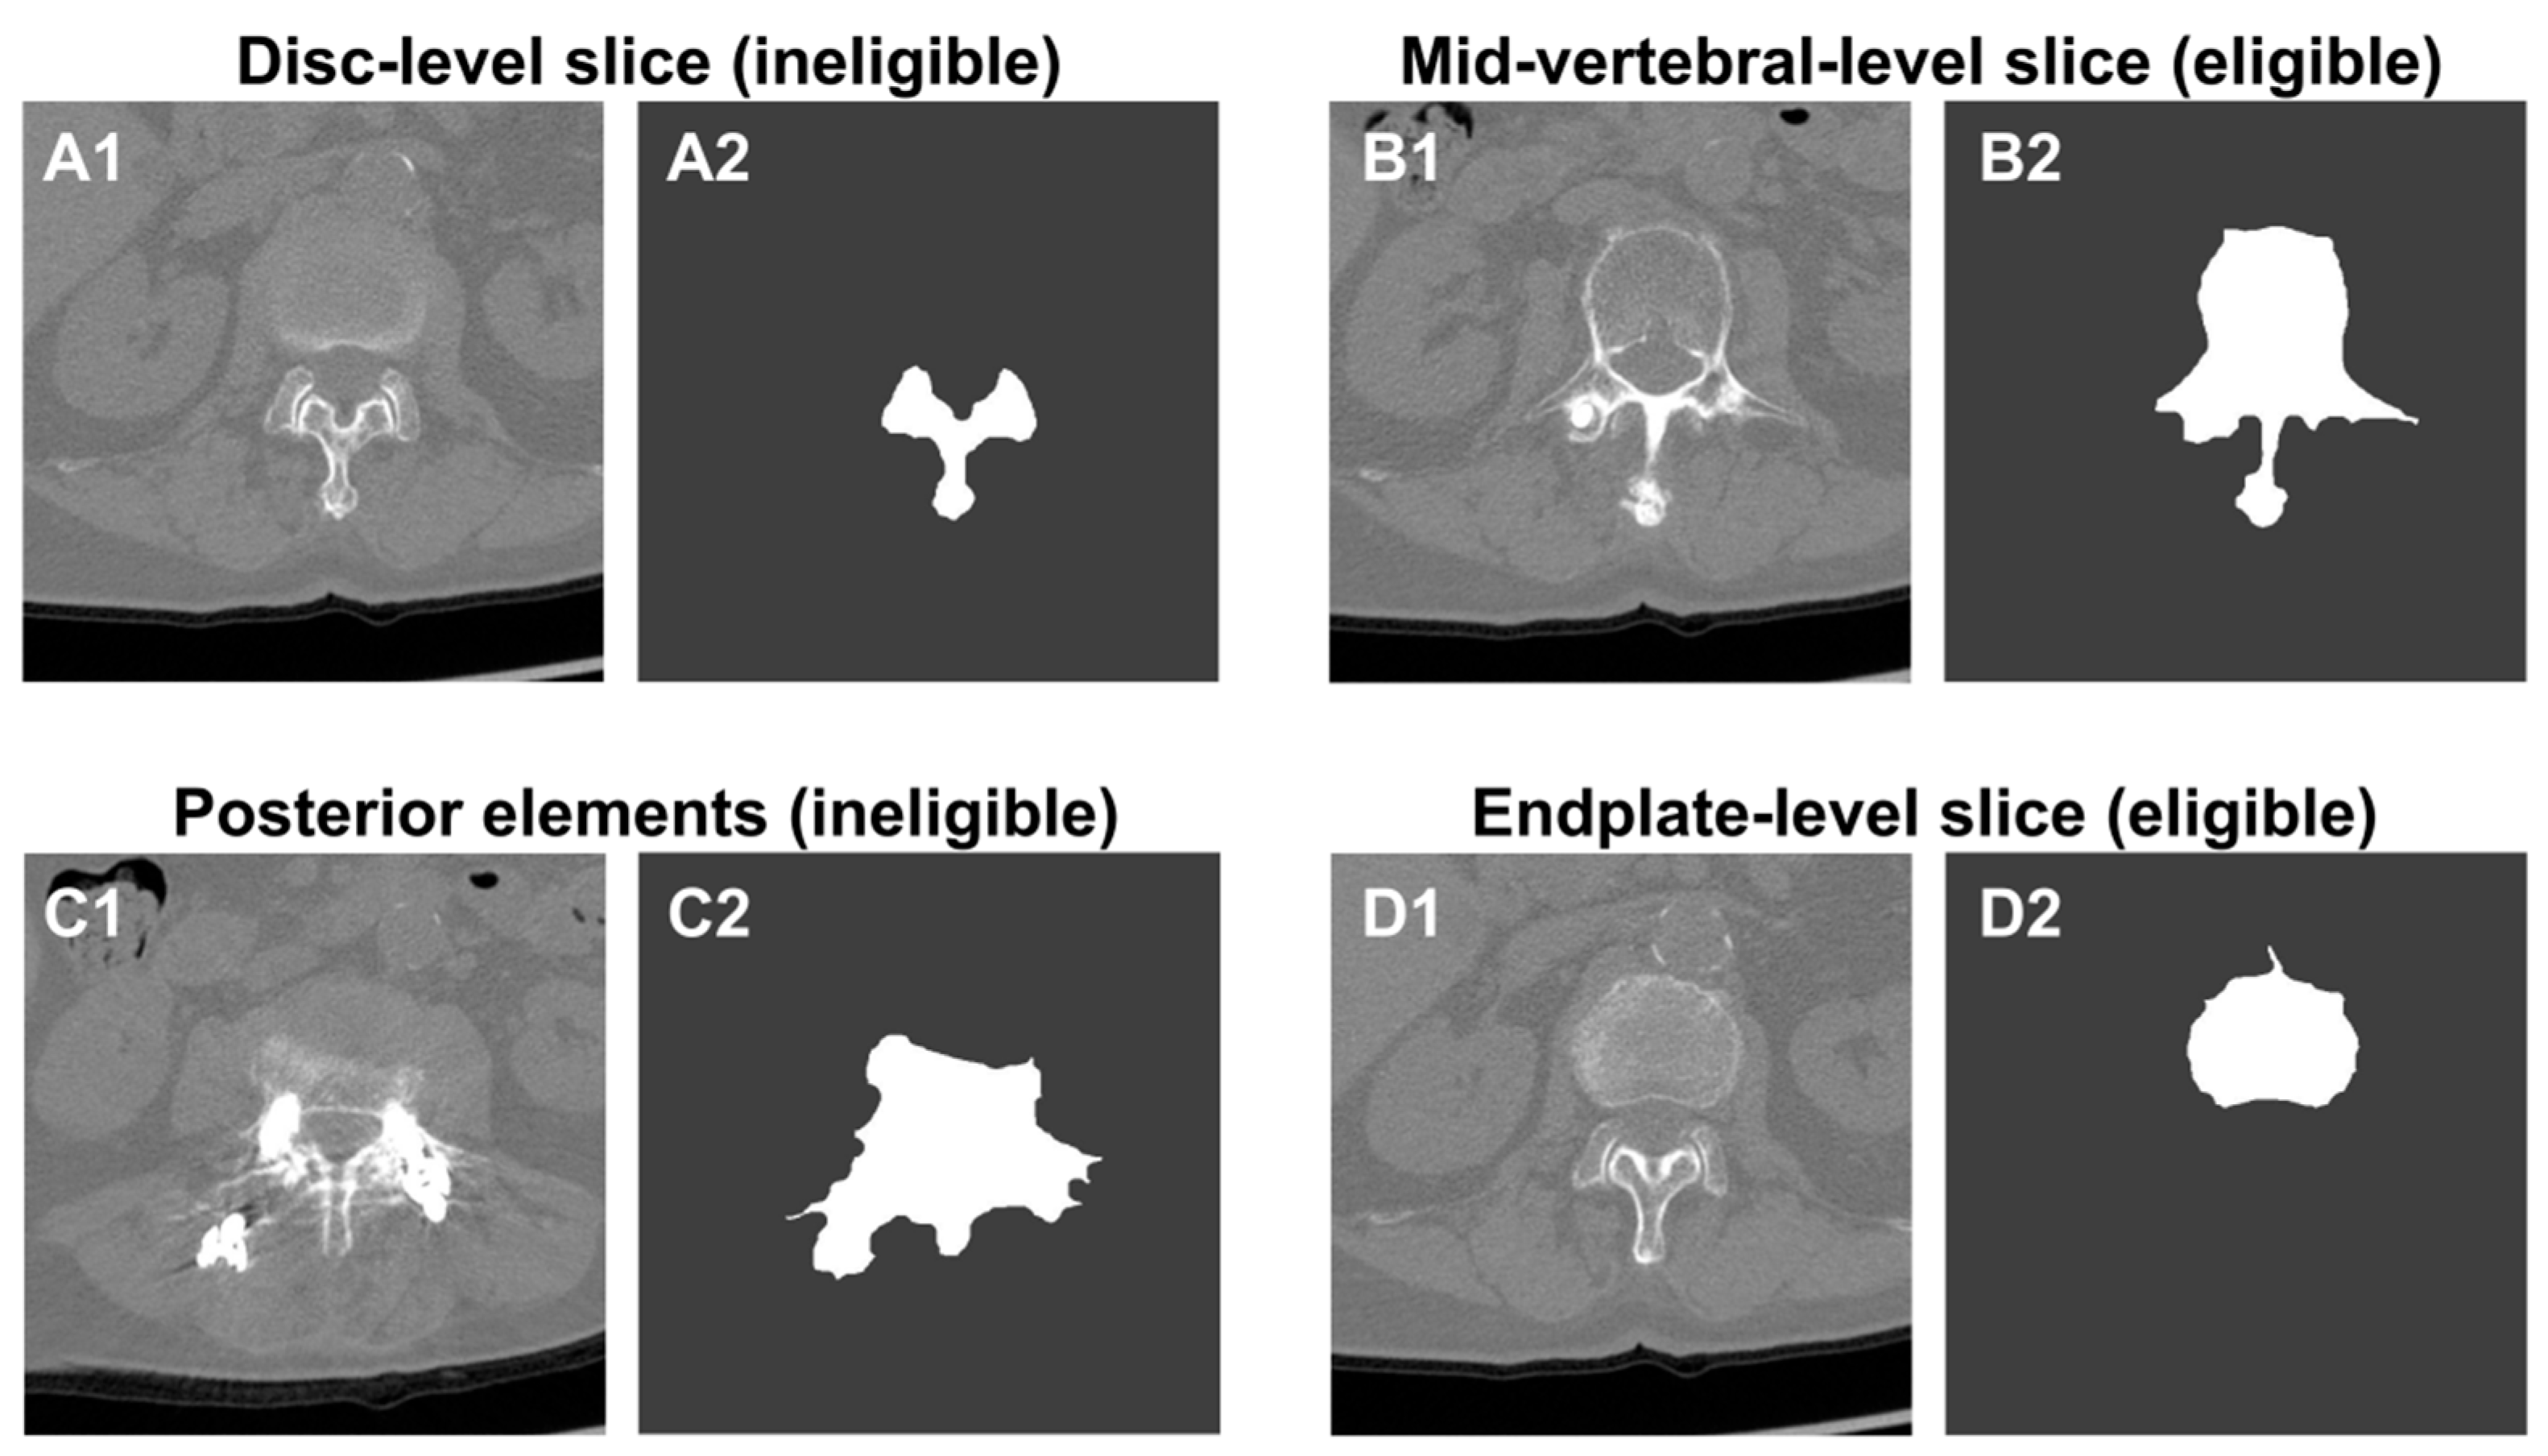
The first stage of the quality-control layer is the Eligibility Gate, which performs slice-level prescreening to remove clearly ineligible slices before any segmentation or quantitative analysis. Each axial L1–L3 slice was first converted into a coarse vertebral bone mask during preprocessing (Section 2.3.1). The Eligibility Gate performs slice-level prescreening using only this coarse mask, i.e., the ViT-B/16 classifier takes the coarse mask as input and outputs a binary decision indicating whether the slice is eligible to proceed. Using a shape-based mask input reduces dependence on scanner intensity variations and focuses the model on vertebral visibility and truncation patterns.
Training labels for the Eligibility Gate were created by an imaging engineer and reviewed by a radiologist experienced in lumbar QCT. Slices with a fully visible vertebral body and sufficient in-body coverage were labeled as eligible, whereas disc-level slices, severely truncated slices, and slices dominated by posterior elements or metal artifacts were labeled as ineligible. Disagreements were infrequent and were resolved by consensus. Formal inter-rater reliability statistics were not prospectively collected. To avoid patient-level information leakage, we used five-fold GroupKFold cross-validation on the development set, grouping all slices from the same patient.
Input masks were resized to 224 × 224 pixels and replicated to three channels. Data augmentation included small rotations, flips, and minor translations. As the input is binary, masks were scaled to [0, 1] and normalized by a fixed min–max rule (no intensity jittering). The classification head was trained with a focal-type loss based on BCEWithLogitsLoss to emphasize rare ineligible slices, and the backbone was fine-tuned with a lower learning rate. Optimization used Adam with differential learning rates (1 × 10⁻⁴ for the classification head and 1 × 10⁻⁵ for the last two transformer blocks), a batch size of 16, and up to 30 epochs, with ReduceLROnPlateau scheduled on the validation accuracy and early stopping after 15 epochs without improvement. The operating threshold for the Eligibility Gate was fixed on the development set and then kept unchanged for evaluation on the external cohort.
Representative eligible and ineligible examples, together with the corresponding coarse masks used as actual model input, are shown in Figure 2.

2.3.3. QC-Envelope Segmentation: Whole-Vertebra U-Net–ResNet34

Slices that passed the Eligibility Gate were further processed by the QC-Envelope Segmentation module, which uses a 2D U-Net with an ImageNet-pretrained ResNet-34 encoder to obtain whole-vertebra envelopes for quality assessment. We manually annotated 38 patients (922 slices) covering a broad spectrum of appearances, including osteophytes, focal lesions, and pedicle screws. Voxel-wise labels were created by an imaging engineer and reviewed by a spine surgeon with extensive lumbar QCT experience; any residual disagreements were resolved during review by consensus. Formal inter-rater reliability statistics for segmentation labeling were not prospectively collected. In an empirical learning-curve inspection, validation Dice gains became minimal (<0.003) beyond 38 patients; this subset was therefore fixed as the segmentation training cohort for the present study, while acknowledging that rare anatomical variants may remain underrepresented.
From the QC-Envelope masks, we computed a set of morphological descriptors, including vertebral area, aspect ratio, truncation ratio, endplate tilt, cortical continuity, pedicle visibility, and convexity, to support QC summarization, reporting, and error analysis. These descriptors were used for reporting and human-readable QC evidence rather than as direct inputs for HU quantification. For the downstream Intra-patient Quality Ranking/Best-Slice Selection module (Section 2.3.4), the QC-Envelope prediction was used only to define a vertebral bounding box for ROI cropping; the PairRank-Swin network was trained and inferred directly on cropped CT image patches. QC-Envelope masks themselves were not used for HU measurement.
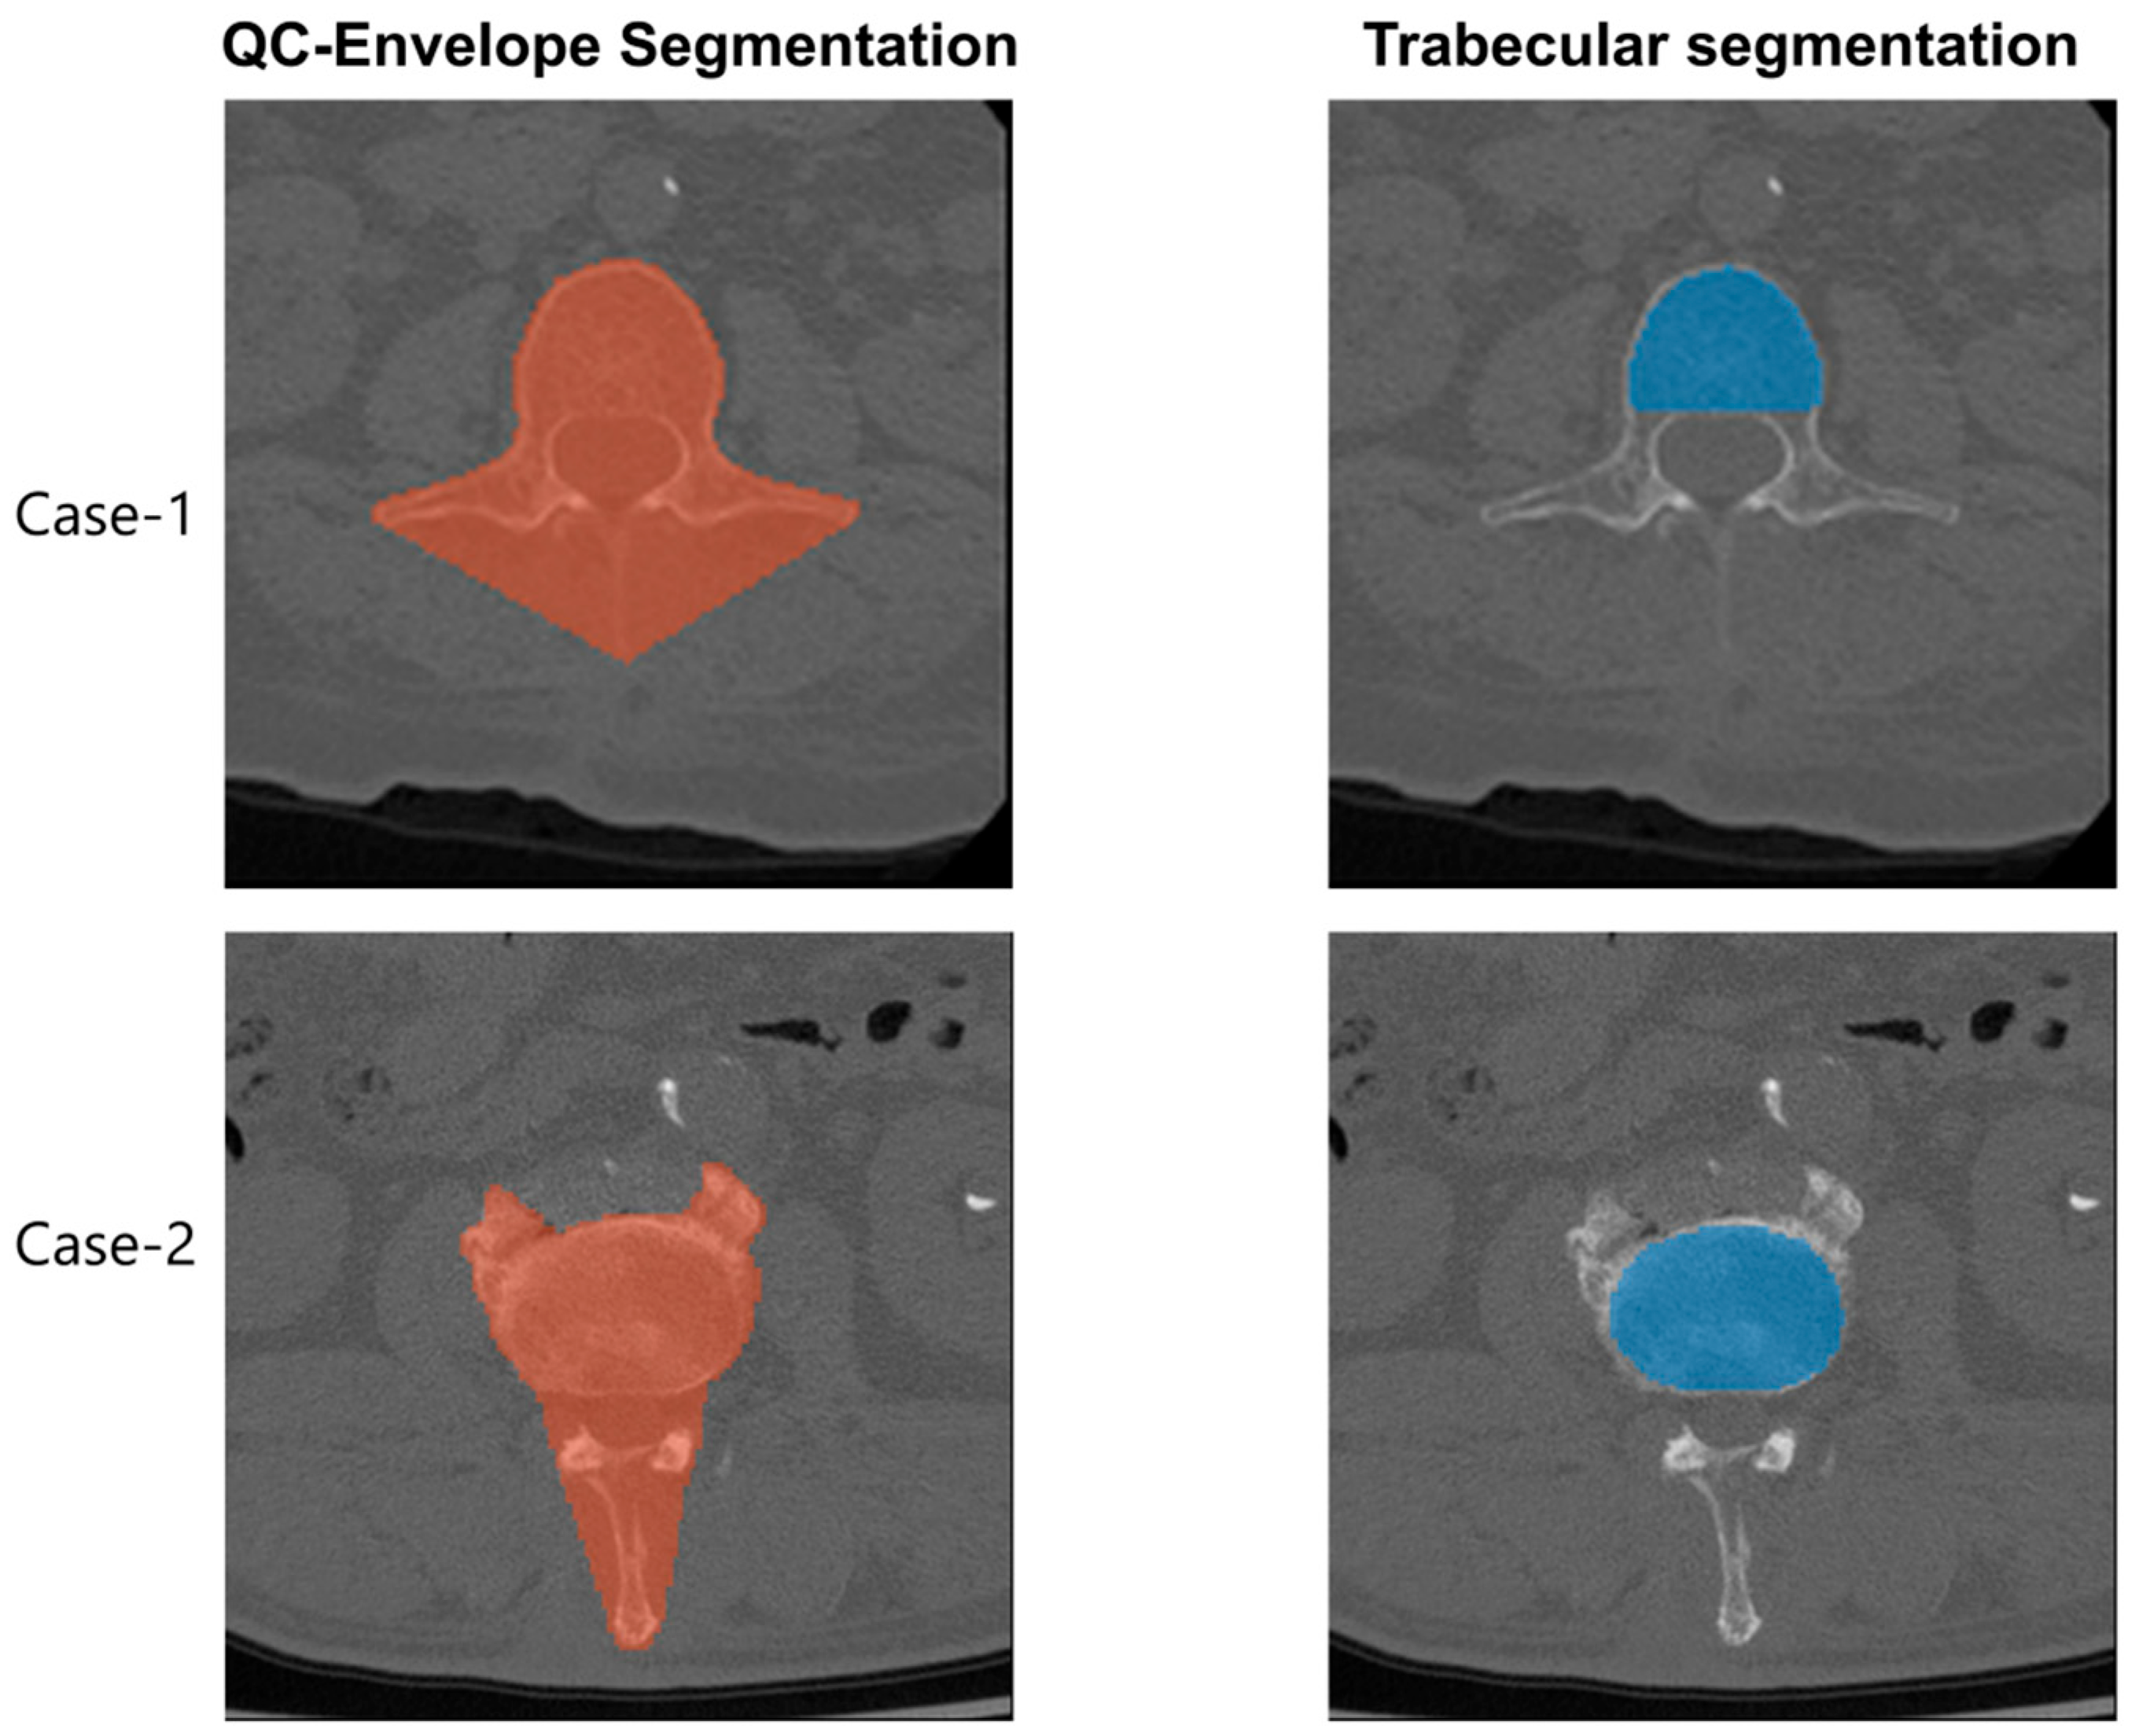
Figure 3 contrasts the two segmentation targets and clarifies their distinct roles in usability assurance and HU calculation. QC-Envelope segmentation deliberately preserves cortex, endplates, pedicles, osteophytes, and even metal implants, providing rich anatomical cues for slice usability assessment, vertebral localization, and ROI cropping. The trabecular segmentation network, in contrast, isolates the cancellous compartment, after which a deterministic safety-margin ROI definition is applied for HU quantification. Thus, the two segmentation targets serve different purposes: the first is intentionally broad and QC-oriented, whereas the second is measurement-oriented and task-specific.
Implementation details for segmentation networks. Both the QC-Envelope (whole-vertebra) and trabecular segmentation networks used the same U-Net architecture and training protocol, differing only in the ground-truth mask (whole-vertebra versus trabecular). We adopted a 2D U-Net with a ResNet-34 encoder implemented using segmentation_models_pytorch (version 0.5.0; ImageNet-pretrained weights), configured with three input channels and a single output logit channel. For each DICOM slice, the CT image was clipped to the range −1000 to 1000 HU, linearly mapped to 0 to 1, and replicated across three channels. Slices and masks were then resized to 512 × 512 pixels, and training patches were sampled using a non-empty-mask crop strategy to keep the vertebral body within the field of view.
Data augmentation was applied on-the-fly using Albumentations (version 2.0.8), including small in-plane rotations (up to ±15 degrees), horizontal and vertical flips, and random brightness and contrast perturbations, followed by per-channel normalization with ImageNet mean and standard deviation. This normalization was used as a standard transfer-learning adaptation for the ImageNet-pretrained encoder and was not intended to preserve an absolute physical HU scale within the network input. The loss function combined binary cross-entropy with logits and a soft Dice loss (BCEWithLogitsLoss plus DiceLoss, mode set to binary). Optimization was performed with the Adam optimizer (initial learning rate 1 × 10⁻⁴, no explicit weight decay), a batch size of 2, and up to 50 training epochs. A cosine-annealing learning-rate scheduler was used, with T_max set to the total number of epochs. A patient-level five-fold GroupKFold was used to avoid leakage, ensuring that slices from the same patient never appeared in both the training and validation sets; for each fold, we trained a separate model and retained the checkpoint with the highest validation Dice score. After cross-validation, we aggregated the out-of-fold validation predictions and performed a threshold scan (0.05–0.95, step 0.05) to select the fixed binarization threshold that maximized Dice on validation data; this threshold was then locked for subsequent development summaries and external evaluation.

2.3.4. Intra-Patient Quality Ranking and Best-Slice Selection: PairRank-Swin

To further refine slice selection in the Usability Assurance stage, we trained a pairwise ranking network (PairRank-Swin) to compare slices from the same patient and determine which one has higher quantitative quality. Conceptually, the model learns a continuous unsuitability score for each slice: higher scores indicate a greater likelihood that the slice is unsuitable for quantitative trabecular measurement, for example, due to severe metal artifacts, beam hardening, or marked endplate sclerosis. Although the network is trained on unsuitable–suitable pairs, its outputs can be thresholded to obtain binary pass-fail decisions and aggregated into patient-level ranking scores, enabling best-slice selection.
For slice-quality supervision, candidate slices were manually reviewed after vertebral ROIs were extracted. A slice was labeled as “suitable” if it showed a well-formed vertebral body suitable for quantitative HU measurement, with adequate trabecular visibility and without dominant confounders such as severe metal artifacts, marked truncation, posterior-element dominance, or obvious endplate/disc-transition contamination. In total, 851 slices were labeled as suitable for supervision. Because PairRank-Swin supervision was implemented at the slice level, patients were not excluded simply because they lacked both “suitable” and “unsuitable” slices. Given 2360 post-Eligibility Gate slices in the development ranking subset, the remaining 1509 slices were treated as unsuitable for slice-quality supervision.
The backbone of PairRank-Swin was a Swin-Small transformer (swin_small_patch4_window7_224, timm library version 1.0.15) initialized with ImageNet-pretrained weights and configured to output a single logit per slice. This logit represents the predicted probability that a slice is unsuitable. To reduce computational cost and improve stability, the first two Swin stages were frozen, and only the later stages and the classification head were fine-tuned. Training was performed with patient-level five-fold GroupKFold cross-validation: DICOM files were grouped by patient ID, and in each fold, patients were partitioned into training and validation sets so that slices from the same patient never appeared in both sets.
For each batch, the network processed unsuitable and suitable images separately to obtain scores s_unsuitable and s_suitable. We combined two complementary objectives: a class-balanced binary classification loss and a margin-based ranking loss. The classification component used BCEWithLogitsLoss, with the positive class corresponding to unsuitable slices and a class weight (pos_weight = 2.5) to emphasize correct detection of unacceptable slices. The ranking component used a MarginRankingLoss with a margin of 0.15 to enforce that, within each pair, the score of the unsuitable slice is at least this margin higher than the score of the suitable slice. The final loss was a weighted sum of the two terms, with lambda = 0.5 for the classification loss and 1 − lambda = 0.5 for the ranking loss. We trained the model with the Adam optimizer (learning rate 4 × 10⁻⁵, batch size 4, up to 20 epochs per fold). We used early stopping based on the validation F1-score of the unsuitable-versus-suitable classification: if the validation F1-score did not improve for 5 consecutive epochs, training for that fold was terminated, and the checkpoint with the highest F1-score was retained.
At the end of each fold, we reloaded the best checkpoint and recomputed the predicted probabilities for all validation slices, treating each slice individually, assigning label 1 to unsuitable and 0 to suitable. To select an operating threshold, we scanned decision thresholds from 0.05 to 0.95 in increments of 0.05 and chose the threshold that maximized the F1-score on the validation data. Per-fold optimal thresholds for F1, precision, and recall were saved for analysis, and the per-fold predictions were concatenated to form an overall development-set prediction file, which was used to summarize the PR-AUC and guide threshold selection on the development folds. Based on these cross-validation results, we selected a unified threshold of approximately 0.55 by maximizing the aggregated validation F1-score across development folds, and we fixed this threshold for all subsequent evaluations. In the deployed pipeline, this fixed threshold was applied to all candidate slices: slices with predicted unsuitability below the threshold were labeled as pass, and for each vertebral level, the accepted slices were converted into pseudo-ranking scores so that the top-ranked pass slice could be selected for HU quantification and optional exploratory vBMD proxy estimation.

2.3.5. HU Calculation and Optional Exploratory vBMD Proxy Conversion

Only slices that passed the Usability Assurance stage and were selected as top-ranked for each vertebral level entered the quantitative analysis stage. Trabecular segmentation was then applied to isolate cancellous bone. In line with common QCT practice, we defined the trabecular ROI on the selected quantitative slice, typically centered within the vertebral body, to maximize in-body coverage while explicitly excluding the cortical shell, endplates, and the basivertebral foramen (Hahn’s canal). To make ROI placement operational and reproducible across scanners and patient sizes, we applied a morphology-based inner shrinkage: the trabecular mask was eroded until 40% of its area remained, yielding an effective inner margin of approximately 2–4 mm from the cortical rim in our development cohort. We additionally enforced a deterministic 2–3 mm posterior safety margin to reduce interference from the low-attenuation canal, which may bias HU downward, and from pericanal sclerotic changes that can extend ventrally into the vertebral body and increase measurement noise. This ROI strategy is consistent with prior automated opportunistic CT osteoporosis-screening workflows that define a trabecular sampling region reproducibly across scanners and protocols while avoiding confounding posterior vertebral structures. The present implementation was intended to approximate cautious expert ROI placement while reducing contamination from cortical, endplate, and posterior pericanal structures [13,19]. A minimum-area ellipse was then fitted to the final eroded mask, and the mean HU within the ROI was computed.
The HU value was optionally converted to an approximate vBMD proxy using an institutional scanner/protocol-specific scaling factor:
vBMD   ( mg / cm 3 ) = HU ¯ ROI × k scanner
Here, kscanner is a scanner/protocol-specific scaling factor derived from our institutional calibration settings (phantom-based routine QCT calibration) and is used only to provide an approximate vBMD proxy for workflow guidance; diagnostic thresholds were not evaluated in this study.

2.4. Model Training and Validation

During training, we applied module-specific data augmentation on the fly. For the mask-only Eligibility Gate, augmentations were limited to geometric transforms (small rotations, flips, and minor translations) without intensity perturbations. For CT-based modules (segmentation and PairRank-Swin), augmentations also included mild intensity perturbations (e.g., brightness/contrast adjustments or small HU jitter), as described in Section 2.3.3 and Section 2.3.4. These augmentations were designed to improve robustness without altering anatomical plausibility. All pipeline modules were trained using patient-level five-fold cross-validation on the development set, ensuring that slices from the same patient did not appear in both the training and validation folds. Generalization performance was assessed on the independent external cohort, which included protocol and scanner variation relative to the development set.

2.5. Evaluation Metrics and Statistical Analysis

We evaluated the pipeline at three levels: (1) slice-level eligibility prescreening; (2) usability assurance, including QC-Envelope segmentation and intra-patient quality ranking/best-slice selection; and (3) HU quantification as the primary outcome, with optional exploratory vBMD proxy conversion. Agreement analyses for HU were performed against manual measurements on the independent external cohort.

2.5.1. Eligibility Gate (ViT-B/16)

For the Eligibility Gate, we reported accuracy, precision, recall (sensitivity), specificity, F1-score, Macro-F1, and, for the aggregated development predictions, ROC-AUC and PR-AUC.

2.5.2. Intra-Patient Quality Ranking and Best-Slice Selection (PairRank-Swin)

For the Intra-patient Quality Ranking and Best-Slice Selection module, we treated the PairRank-Swin output as a slice-level unsuitability probability and, at a fixed operating threshold of 0.55, converted it into a binary pass-fail decision. The threshold was selected based on the development data, as described in Section 2.3.4, and then kept fixed for all subsequent evaluations. We reported precision, recall, F1-score, and the area under the precision–recall curve (PR-AUC), with the unsuitable-slice class treated as the positive class.

2.5.3. Segmentation Metrics

For segmentation, we quantified QC-Envelope and trabecular segmentation accuracy primarily with the Dice similarity coefficient. In the added open-baseline comparison, we additionally used boundary-aware metrics, including the 95th-percentile Hausdorff distance (HD95) and the average symmetric surface distance (ASSD), because Dice alone is insufficient to characterize boundary suitability for downstream quantitative analysis. Dice scores were summarized as mean ± standard deviation (SD), and slice-level bootstrap 95% CIs (B = 2000 resamples). Development performance was estimated using patient-level GroupKFold cross-validation, whereas external validation was performed in a single pass without any threshold selection.

2.5.4. HU Agreement (Primary Outcome)

For the independent external cohort, the primary paired HU agreement analysis was performed on the evaluable machine–manual pairs only (n = 44), after excluding 4 non-evaluable cases rejected by both manual review and the pipeline and 2 additional borderline-quality cases rejected by the automated pipeline. Agreement was assessed using Pearson’s correlation coefficient, Spearman’s rank correlation coefficient, Lin’s concordance correlation coefficient (CCC), and Bland–Altman analysis. Mean bias and limits of agreement (LoA, defined as bias ± 1.96 × standard deviation of the paired differences) were reported with bootstrap 95% confidence intervals (CIs). Absolute-error coverage within ±10 HU and ±15 HU was estimated with two-sided 95% Wilson CIs.
For calibration diagnostics, we additionally fitted an ordinary least-squares regression of the form Machine = a + b × Manual, reporting parameter estimates with 95% CIs and hypothesis tests for proportional bias (null hypothesis: b = 1), intercept offset (null hypothesis: a = 0), and mean bias (null hypothesis: bias = 0).

2.5.5. Assessment of Intra-Rater Repeatability of Manual HU Measurement

To contextualize the primary machine–manual HU agreement results, we quantified intra-rater repeatability of manual HU measurement using all cases for which three repeated manual measurements were available at the time of analysis (n = 88). These repeated measurements were performed by the same reader at approximately two-week intervals. Intra-rater repeatability was assessed using a two-way mixed-effects intraclass correlation coefficient for single measurements, ICC(A,1), with 95% confidence intervals. The within-reader standard deviation (Sw) was estimated from the repeated measurements, and the repeatability coefficient (RC) was calculated as RC = 1.96 × sqrt(2) × Sw. To provide clinically interpretable benchmarks aligned with the main HU agreement analysis, we also summarized the proportion of cases in which the three-measurement range remained within 10 HU and 15 HU.

2.5.6. General Settings

All statistical tests were two-sided with alpha = 0.05. Unless stated otherwise, uncertainty intervals are 95% CIs. Analyses were performed in Python 3.11 using SciPy 1.15.3, NumPy 1.26.4, and statsmodels 0.14.4, with patient-level grouping to avoid leakage in development. The external cohort was never used for model selection or threshold tuning at any stage of the pipeline.

2.5.7. Open Module-Level Baseline Comparison

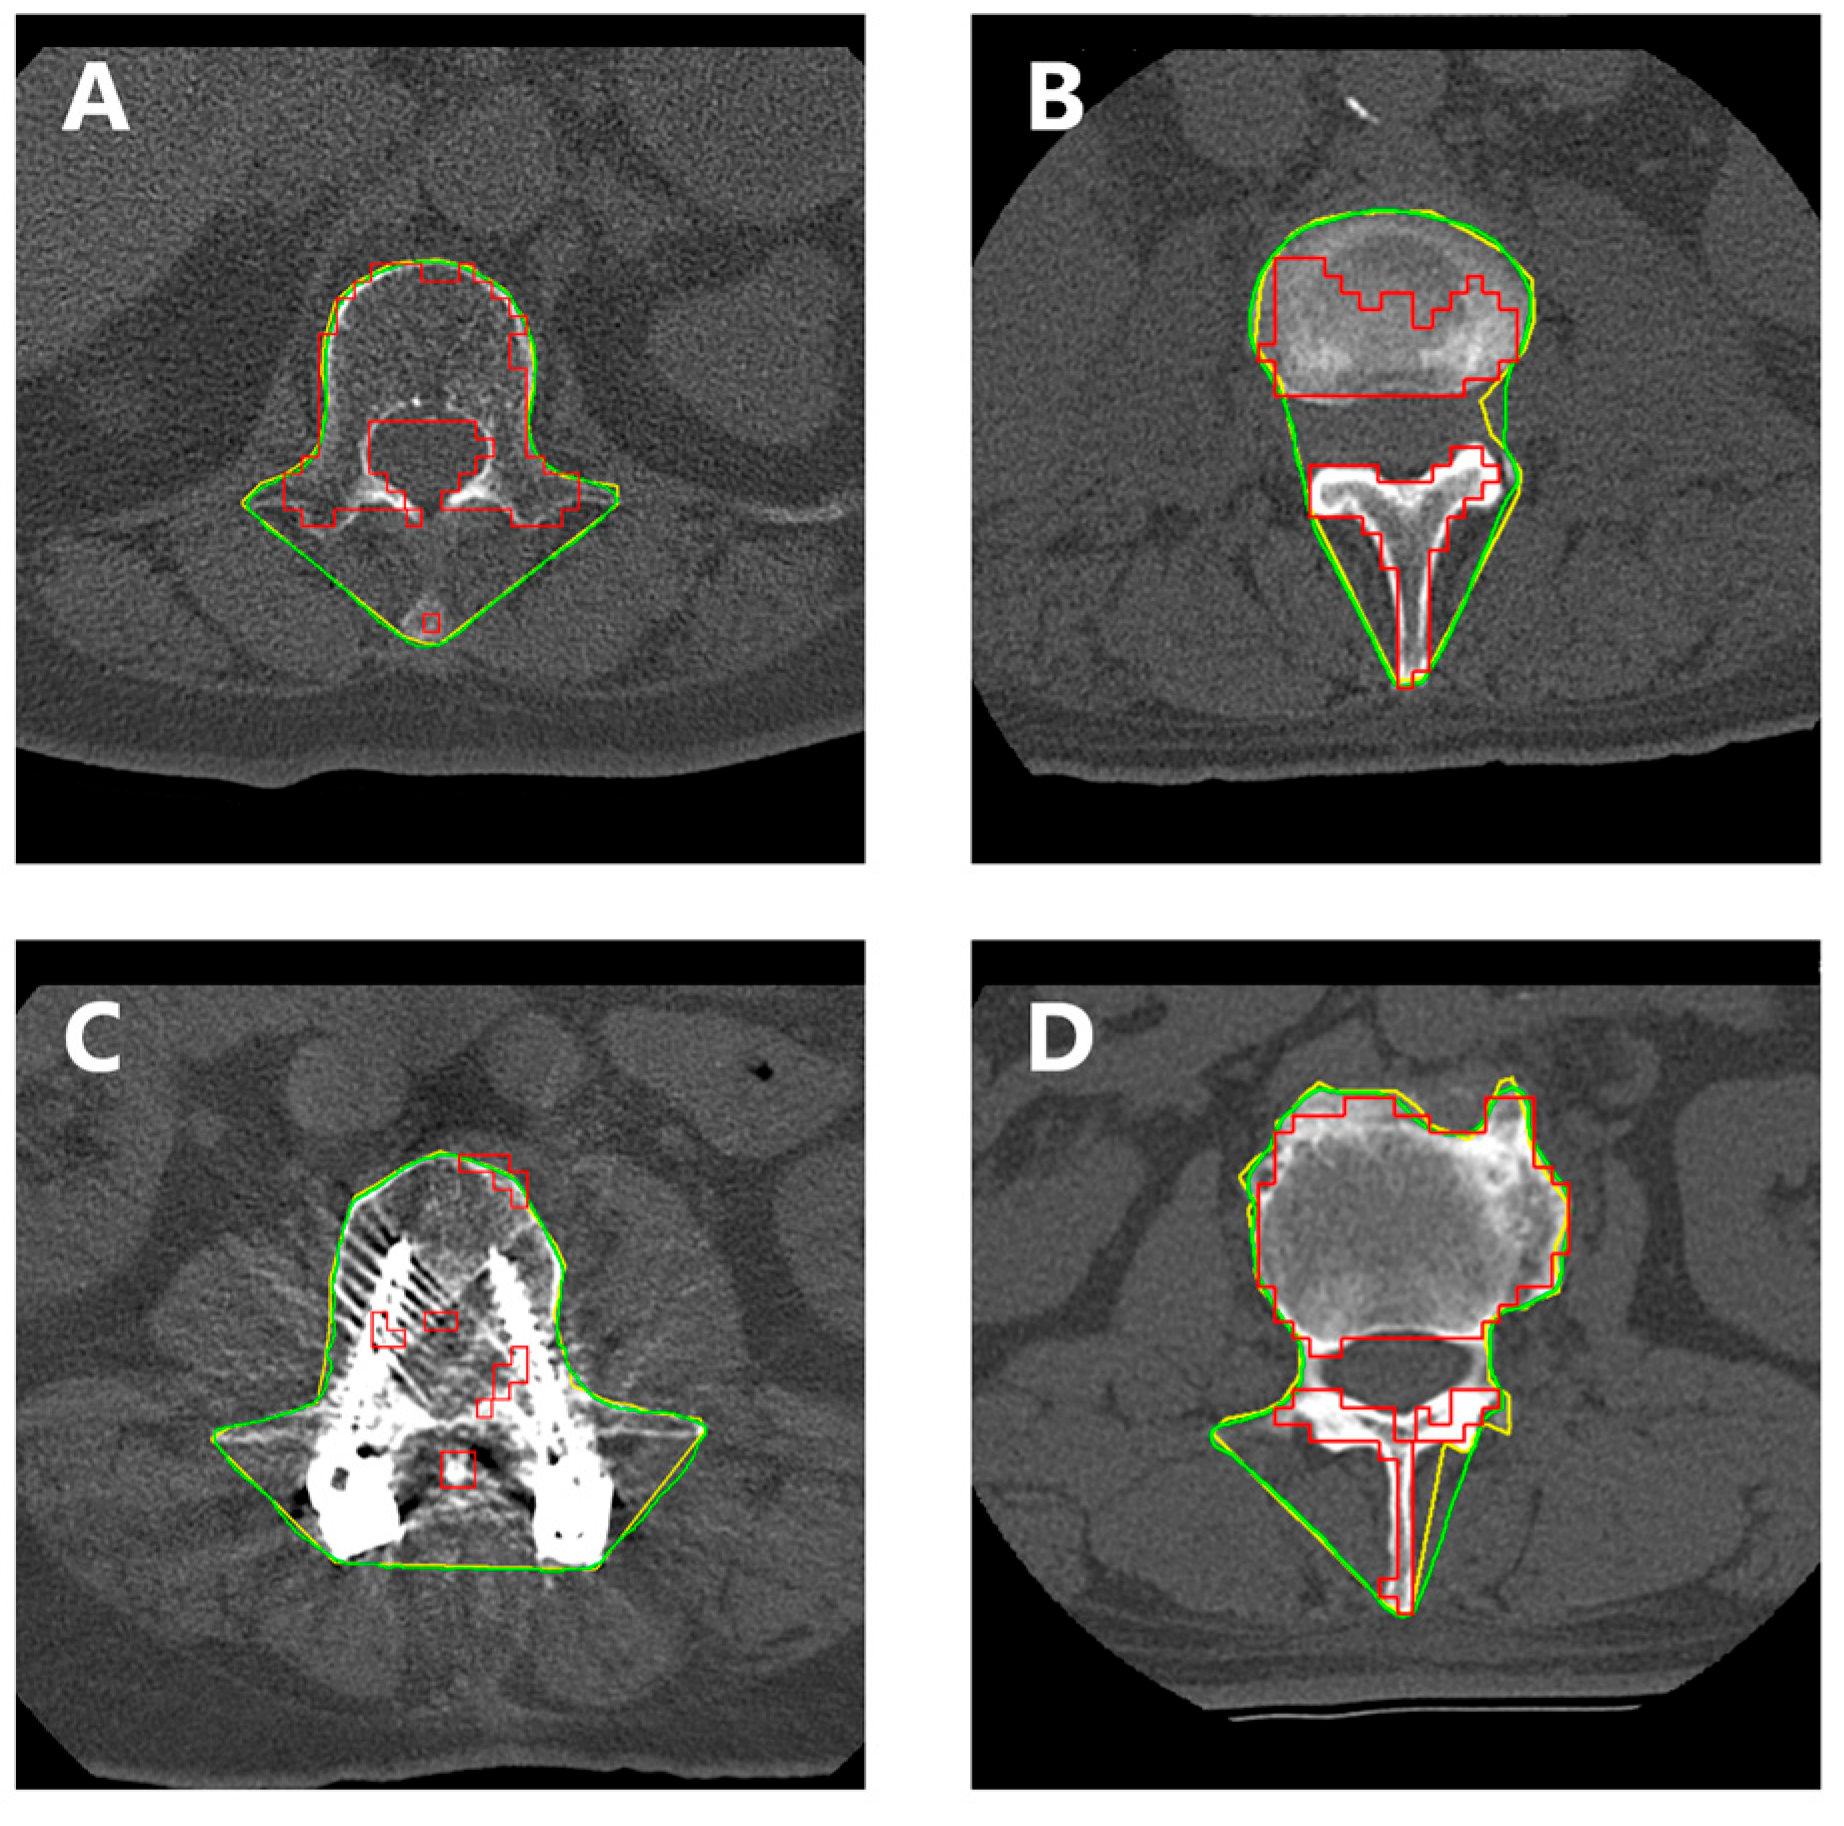
To provide an open and reproducible reference, we compared our QC-Envelope segmentation with TotalSegmentator, a publicly available baseline for vertebral segmentation. Because TotalSegmentator is a generic whole-vertebra segmentation tool and does not implement our eligibility gating, intra-patient slice ranking, or dedicated trabecular-target design, we used it as a module-level baseline for the broad segmentation stage rather than as a full end-to-end replacement. For this comparison, TotalSegmentator masks from T12–L5 were merged into a lumbar union mask, and evaluation was restricted to the lumbar-only slice range in which the open baseline produced non-empty vertebral masks. Agreement with manual broad segmentation was evaluated slice-wise using Dice, the 95th-percentile Hausdorff distance (HD95), and average symmetric surface distance (ASSD). The open-baseline comparison was performed on the subset of manually annotated broad-segmentation slices for which aligned TotalSegmentator lumbar-range masks could be generated and evaluated, yielding 342 evaluable slices from 21 cases.

3. Results

3.1. Performance of the Eligibility Gate

The Eligibility Gate addressed a predefined binary eligibility task based on vertebral visibility and gross quantitative suitability (Figure 2). In five-fold cross-validation on the development subset (n = 736 slices), it achieved the following: accuracy 99.05%, precision 99.40%, recall 99.55%, specificity 94.67%, F1-score 99.47%, Macro-F1 97.41%, ROC-AUC 0.993, and PR-AUC 0.999. Performance on the independent external cohort remained comparably high (Table 4), without any threshold adjustment.

3.2. QC-Envelope and Trabecular Segmentation

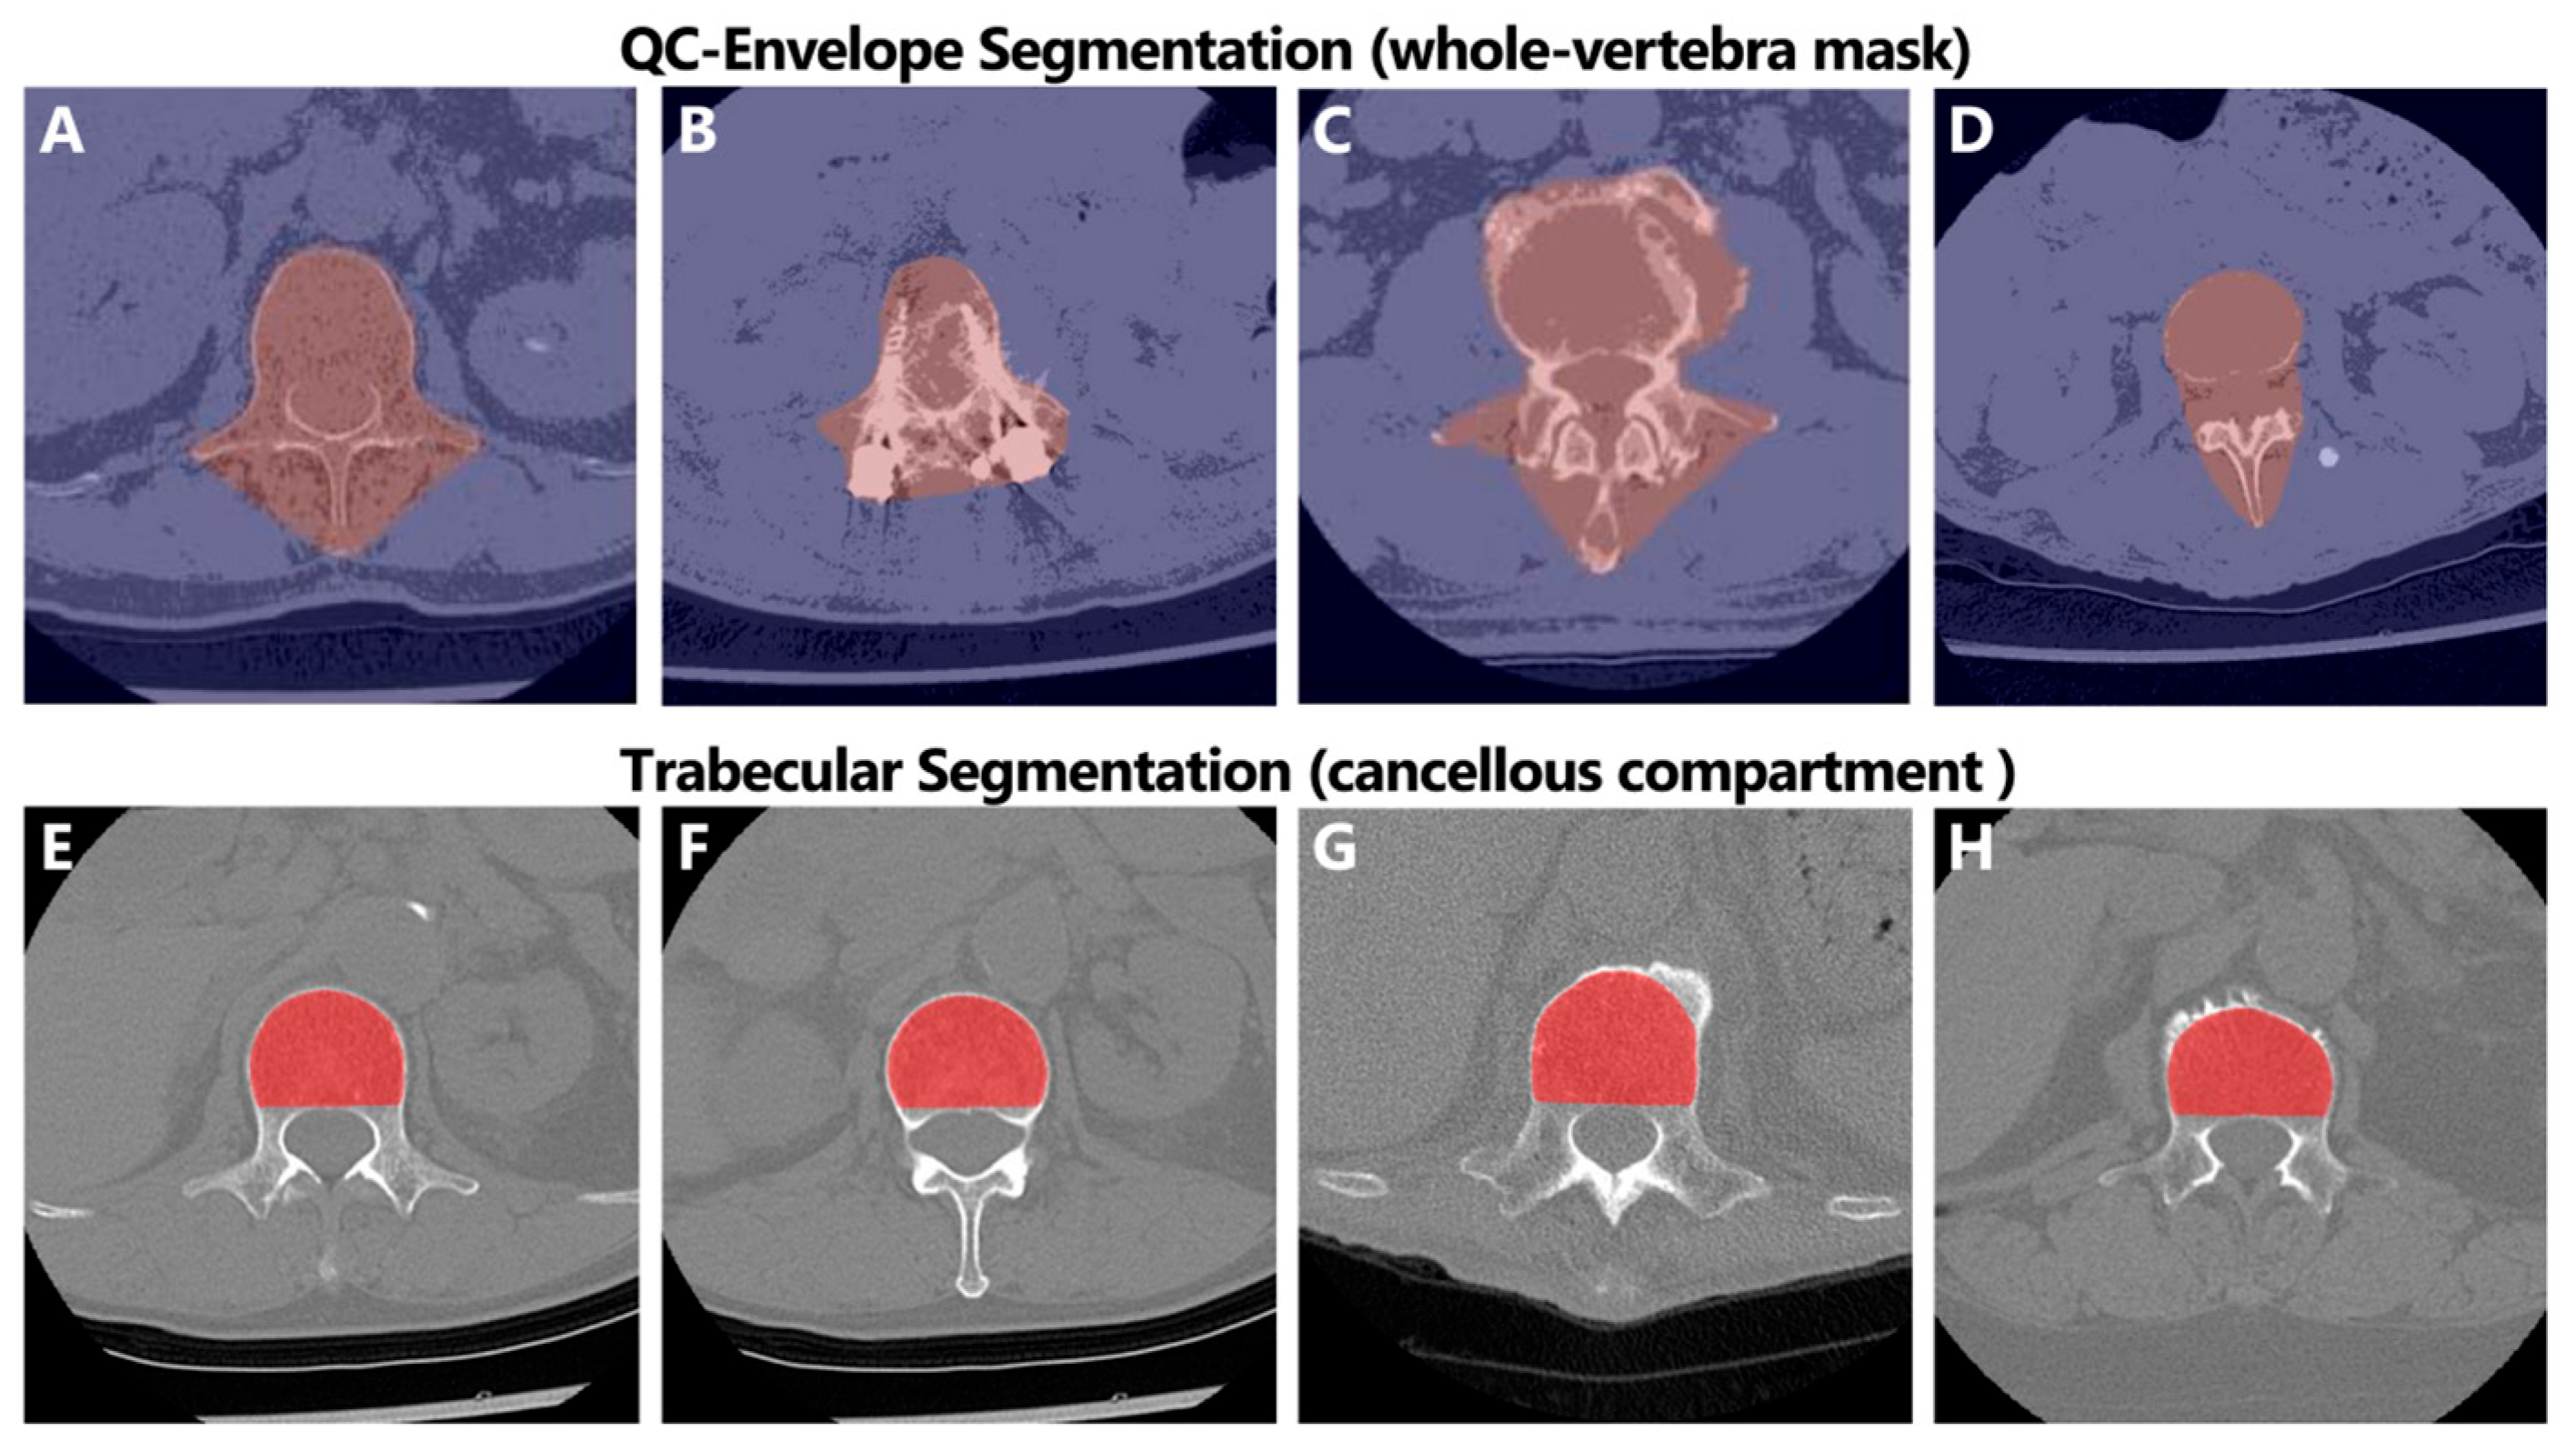
On the development set (922 manually labeled slices), the Dice similarity coefficient was 0.9596 ± 0.0042 for QC-Envelope Segmentation (whole-vertebra mask) and 0.9668 ± 0.0082 for trabecular segmentation (cancellous compartment). The independent external cohort showed comparable performance post-Eligibility Gate (n = 1302 slices), with slightly higher trabecular Dice (≈0.9710 ± 0.0075) while QC-Envelope Dice remained similar (≈0.9572 ± 0.0060); see Table 5. Representative examples of QC-Envelope and trabecular segmentation outputs, including metal-affected and boundary-challenging cases, are shown in Figure 4.
An open module-level baseline comparison further highlighted the task-specificity of QC-Envelope segmentation. On a lumbar-only slice-level subset comprising 342 evaluable slices from 21 cases, our QC-Envelope segmentation substantially outperformed the open TotalSegmentator baseline, achieving Dice 0.977 ± 0.016 versus 0.430 ± 0.256, HD95 6.42 ± 7.45 versus 86.76 ± 47.89 pixels, and ASSD 2.16 ± 1.61 versus 34.45 ± 26.65 pixels. Our method showed higher Dice scores in all 342 slices, lower HD95 scores in 339/342 slices, and lower ASSD scores in 341/342 slices. No publicly available open model directly matched our dedicated trabecular target; therefore, the open-baseline comparison was restricted to the broad QC-Envelope stage, for which TotalSegmentator provided the closest publicly available task-relevant reference. Detailed quantitative results are summarized in Table 6, and representative comparisons are shown in Figure 5.

3.3. Intra-Patient Quality Ranking (PairRank-Swin)

On the development set (five-fold CV), PairRank-Swin achieved F1 0.84 ± 0.02, Precision 0.84 ± 0.06, Recall 0.83 ± 0.05, and PR-AUC 0.87 ± 0.04. Precision, recall, and F1-score were computed for the unsuitable-slice class at the fixed operating threshold. The independent external cohort showed slightly lower recall but comparable overall performance at the fixed operating threshold of 0.55 (Table 7).
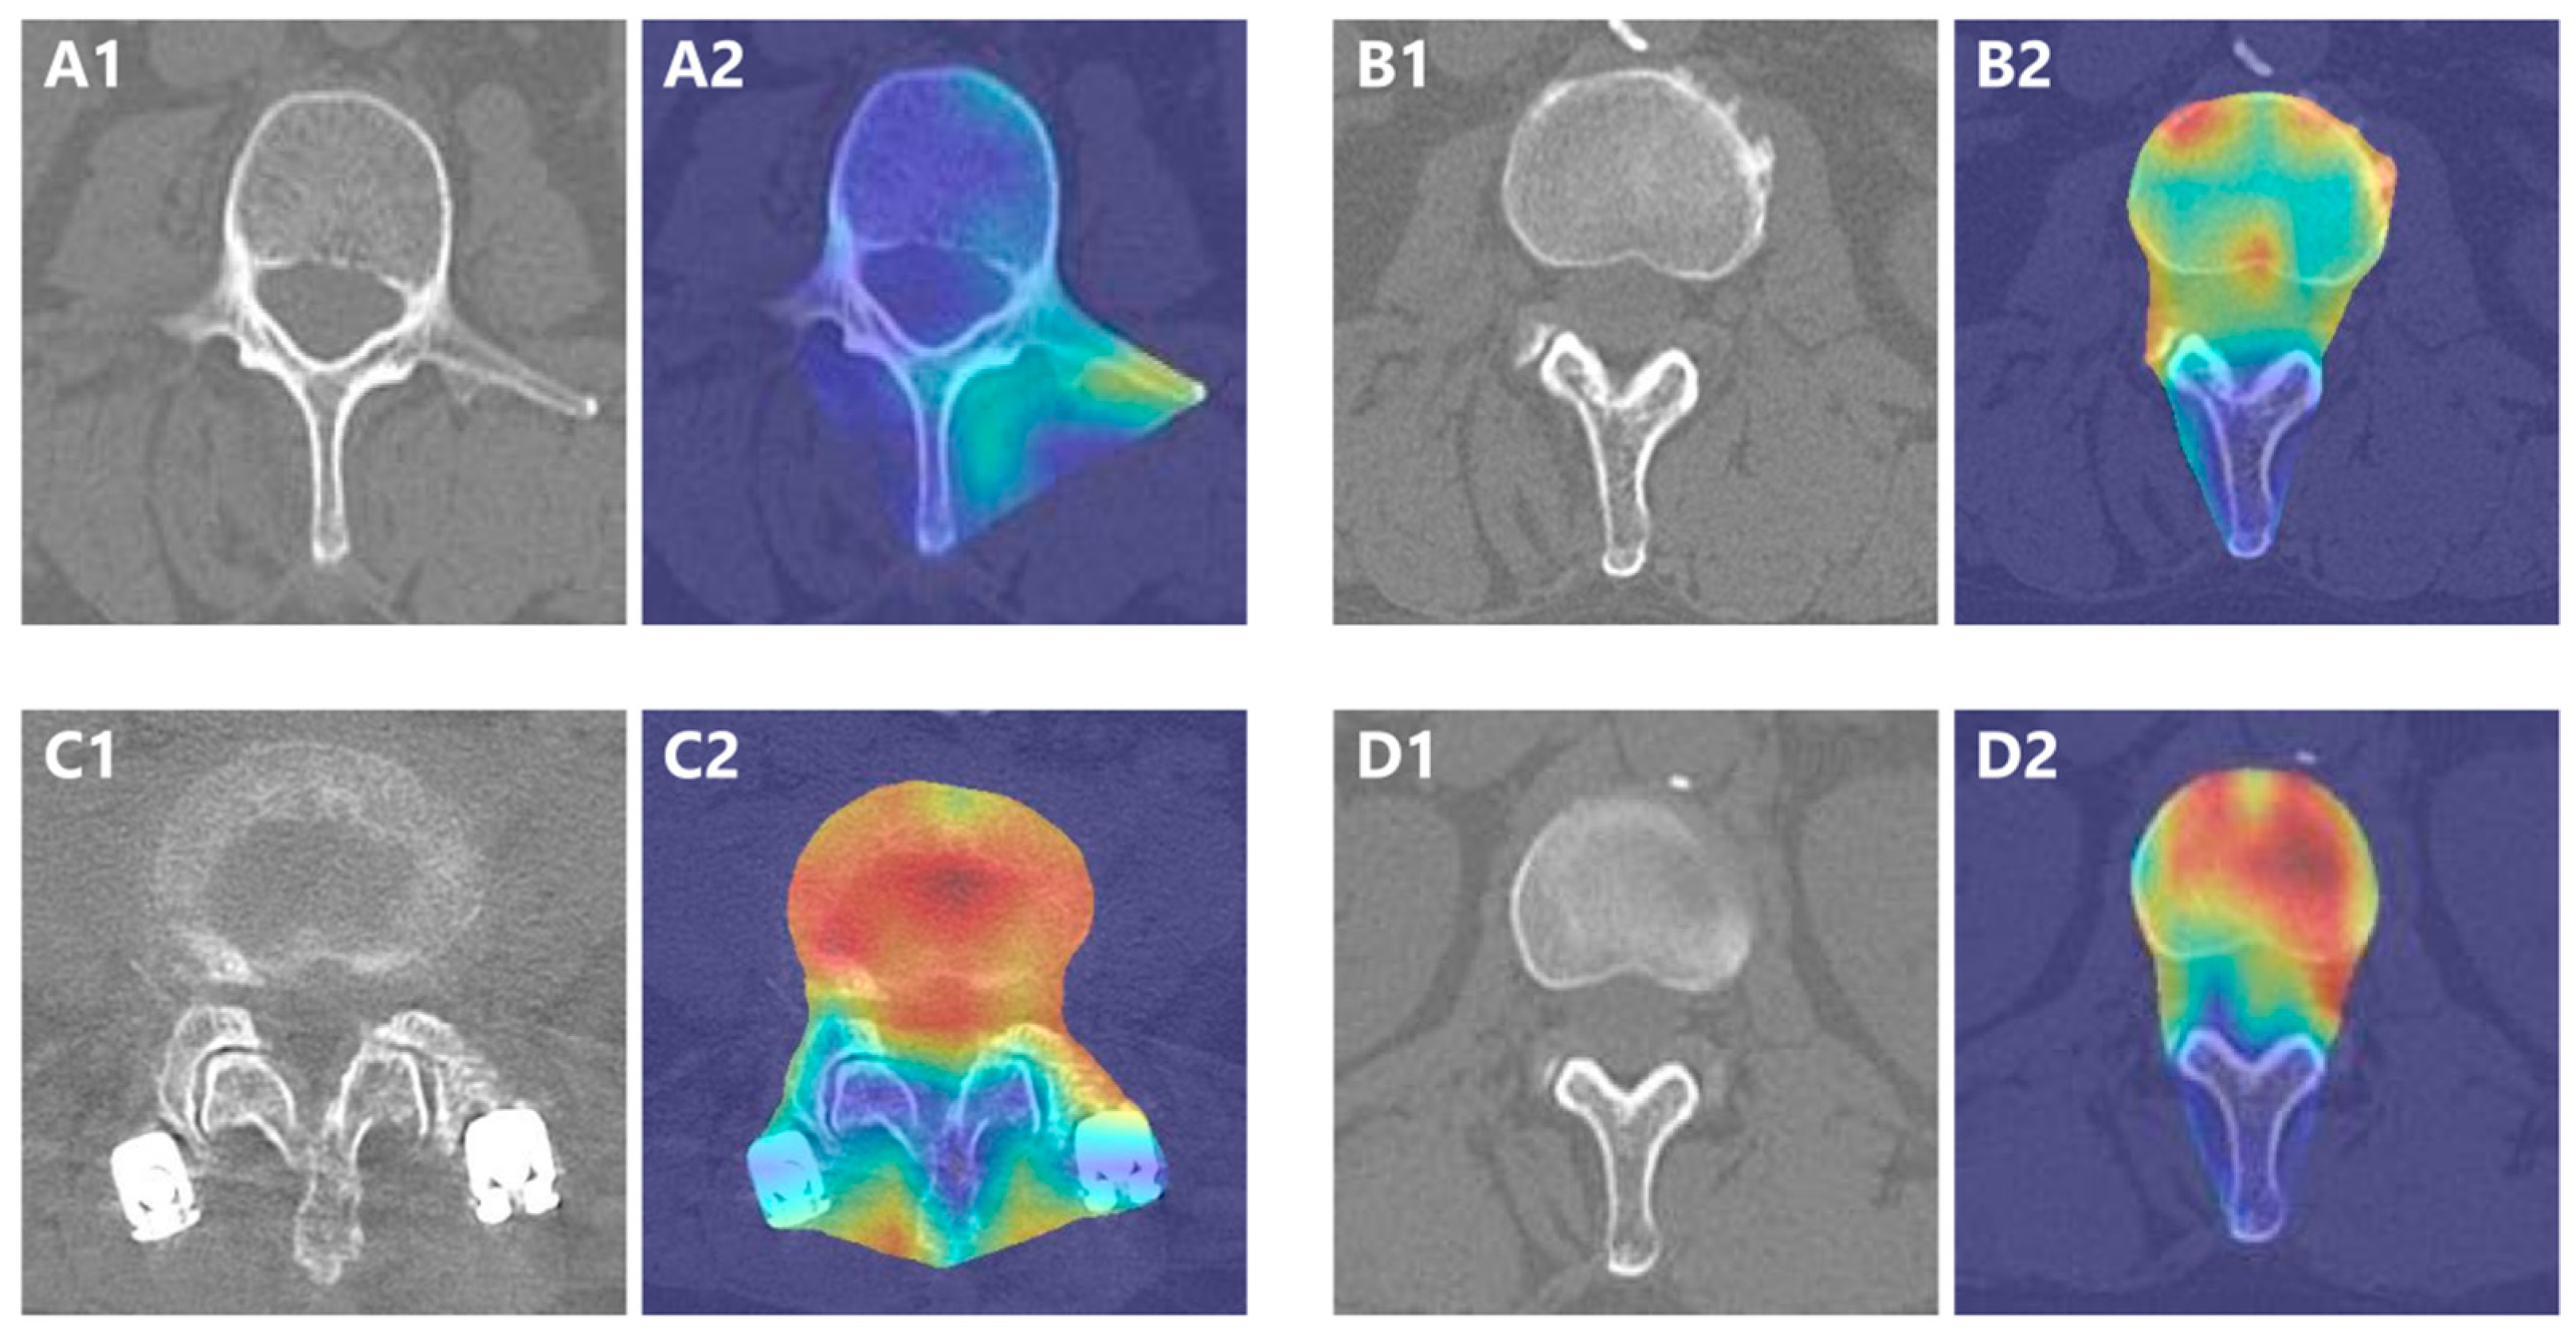
At the fixed operating threshold of 0.55, the development cross-validation results showed a miss rate of approximately 17% and a false-alarm rate of approximately 16%. Qualitative class-activation heatmaps are shown in Figure 6 to illustrate the regions contributing to the ranking decision. In these examples, the model often emphasized the vertebral body/trabecular region and regions affected by high-density interference, truncation, or endplate–disc transition.

3.4. Intra-Rater Repeatability of Manual HU Measurement

Repeated manual HU measurements were available for 88 cases, each with three repeated measurements performed by the same reader at approximately two-week intervals. Intra-rater repeatability was high, with an ICC(A,1) of 0.98 (95% CI, 0.97–0.99). The within-reader standard deviation was 3.77 HU, corresponding to a repeatability coefficient of 10.45 HU. Across the three repeated manual measurements, the case-level measurement range was within 10 HU in 80/88 cases (90.91%) and within 15 HU in 86/88 cases (97.73%), supporting the use of these margins as clinically interpretable repeatability benchmarks for contextualizing machine–manual agreement.

3.5. Agreement Between Automated and Expert HU Values

To avoid information leakage, the primary HU agreement analysis was restricted to the independent external cohort. Of the 50 external cases, 4 were considered non-evaluable by both manual review and the pipeline due to image quality that was too poor for reliable quantitative assessment. In 2 additional borderline-quality cases, manual HU values were recorded, but the automated pipeline rejected the slices as unsuitable. The paired machine–manual HU agreement analysis, therefore, included 44 evaluable cases.
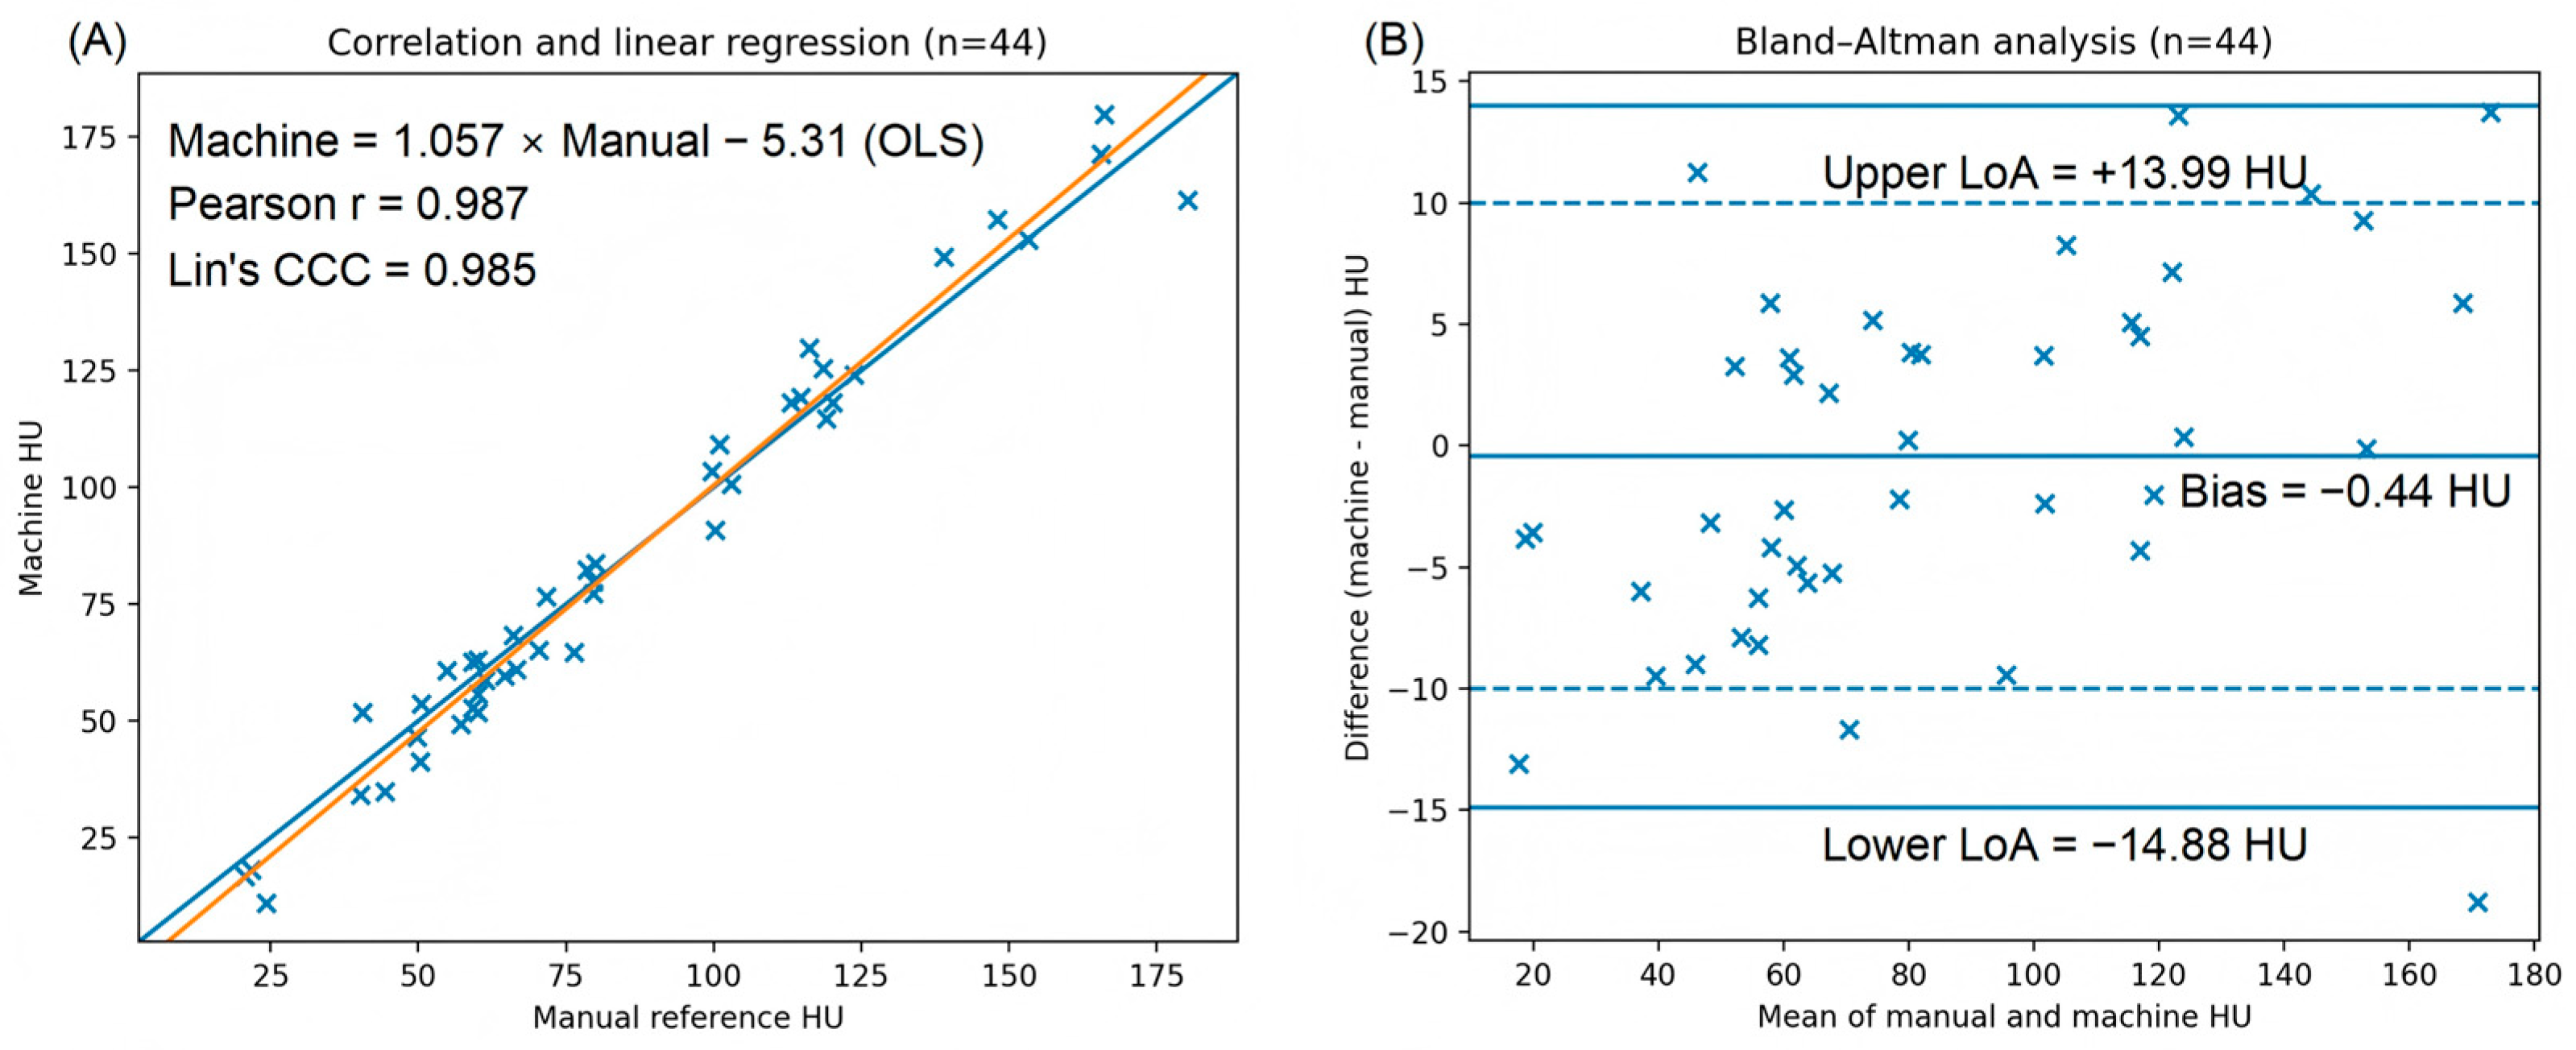
The agreement remained high in these 44 paired cases. Pearson’s r was 0.987 (95% CI, 0.976–0.993), Spearman’s ρ was 0.980, and Lin’s CCC was 0.985 (bootstrap 95% CI, 0.978–0.989). Bland–Altman analysis showed a mean bias of −0.44 HU (95% CI, −2.62 to +1.71), with limits of agreement from −14.88 to +13.99 HU. Absolute-error coverage was 84.1% (37/44; 95% Wilson CI, 70.6–92.1%) within ±10 HU and 97.7% (43/44; 95% Wilson CI, 88.2–99.6%) within ±15 HU.
When interpreted against the manual intra-rater repeatability benchmark (Section 3.4), the automated pipeline showed agreement approaching the range of repeated manual HU measurements. In the repeatability analysis, the within-reader standard deviation was 3.77 HU and the repeatability coefficient was 10.45 HU, with 90.91% of cases remaining within a 10-HU three-measurement range and 97.73% within a 15-HU range. Relative to these manual repeatability benchmarks, machine–manual agreement was slightly wider at the tighter ±10 HU level but was highly comparable at the ±15 HU level. These findings suggest that a substantial portion of the residual machine–manual discrepancy may reflect inherent variability in manual slice/ROI-based HU measurements rather than solely model error. HU agreement statistics are summarized in Table 8, and scatter and Bland–Altman plots are shown in Figure 7.

3.6. Ablation Analysis of the End-to-End Workflow

Ablation analysis was performed on the same 44 evaluable paired external cases used for the primary HU agreement analysis. Detailed ablation results are summarized in Table 9. The FULL pipeline achieved Pearson’s r = 0.987, Lin’s CCC = 0.985, mean absolute error (MAE) 6.10 HU, mean bias −0.44 HU, 84.1% coverage within ±10 HU, and 97.7% within ±15 HU.
Removing Eligibility Gate had little effect on paired-case quantitative performance (NO_GATE: Pearson’s r = 0.987, CCC = 0.985, MAE 5.92 HU, bias −0.27 HU, 86.4% within ±10 HU), suggesting that, in this evaluable paired subset, the main contribution of Eligibility Gate was conservative rejection of clearly unsuitable inputs rather than large shifts in agreement among already analyzable cases. This finding should therefore not be interpreted as evidence that prescreening is unnecessary at the full pipeline level.
In contrast, removing intra-patient slice ranking caused marked degradation (NO_RANK: Pearson’s r = 0.491, CCC = 0.250, MAE 70.04 HU, bias +65.36 HU, 15.9% within ±10 HU), demonstrating that best-slice selection was a critical determinant of reliable single-slice HU measurement.
ROI simplification also degraded performance. Removing ellipse fitting caused a moderate decline (ROI_NO_ELLIPSE: Pearson’s r = 0.968, CCC = 0.967, MAE 7.98 HU, bias +1.77 HU, 72.7% within ±10 HU), whereas removing the erosion step caused severe overestimation and broad loss of agreement (ROI_NO_EROSION: Pearson’s r = 0.902, CCC = 0.713, MAE 32.05 HU, bias +31.25 HU, 6.8% within ±10 HU). These findings indicate that slice ranking and inner-ROI erosion were the most critical components of the workflow, while ellipse fitting provided a secondary but still beneficial refinement.

4. Discussion

This study presents a fully automated single-slice lumbar QCT workflow designed as a QC-first, traceable HU-measurement system rather than a replacement for volumetric QCT or a deployment-ready clinical product. The workflow integrates slice prescreening, dual-purpose segmentation, intra-patient best-slice ranking, and a deterministic inner ROI definition for HU quantification. On an independent single-center external cohort, the pipeline achieved high agreement with expert HU measurements on evaluable cases while explicitly rejecting non-evaluable or borderline-quality inputs.
The dual-segmentation design is central to the present work. QC-Envelope segmentation is intentionally broad and preserves structures relevant to slice usability assessment and vertebral localization, whereas the dedicated trabecular segmentation stage is measurement-oriented and prepares the inner cancellous target for deterministic ROI refinement. This task separation helps explain why an open generic whole-vertebra baseline, such as TotalSegmentator, is informative as a module-level reference but does not directly replace the full workflow. In the added open-baseline comparison, our task-specific QC-Envelope segmentation markedly outperformed TotalSegmentator in a lumbar-only slice-level evaluation, supporting the need for a dedicated broad segmentation stage in this QC-first pipeline [13,19].
A further design choice of this work was to avoid direct end-to-end regression from CT to a final HU value. Because manual reference generation in lumbar QCT inherently introduces variability in slice selection and ROI placement, an end-to-end model would combine label variability with imaging variability, making failures harder to localize. By decomposing the workflow into clinically interpretable steps, including eligibility gating, broad segmentation, intra-patient ranking, and deterministic ROI definition, the present system preserves reviewable intermediate outputs and ROI provenance. In this study, this modular structure should be interpreted primarily as a choice for traceability and workflow clarity rather than as evidence of superior reader trust, deployment readiness, or data efficiency. Whether such a stepwise design improves reader confidence, usability, or downstream workflow compared with alternative approaches remains to be tested in future reader studies, usability studies, and prospective deployment evaluations.
In the context of prior research, recent deep-learning-based pipelines for QCT or opportunistic CT analysis have reported encouraging performance. However, many were developed for different task definitions, such as volumetric assessment, multi-slice input, or broader screening-oriented workflows [17,19]. The present study addresses a narrower and more specific target: operator-style single-slice lumbar trabecular HU measurement with explicit slice-level eligibility control, intra-patient best-slice selection, and reviewable intermediate outputs. Rather than claiming superiority over volumetric QCT systems or broader opportunistic screening pipelines, our contribution is to show that a stepwise QC-first workflow can achieve high agreement with expert single-slice HU measurement while preserving interpretable intermediate stages.
Several limitations should be emphasized. First, this was a single-center retrospective study with a modest external cohort. Although the validation cohort was independent and included protocol and device variation relative to the development cohort, broader multicenter generalizability remains unproven. Second, the primary validated endpoint was expert-level agreement in single-slice trabecular HU measurement rather than volumetric vBMD estimation or diagnostic screening performance. Third, the open-baseline comparison was module-level rather than end-to-end, because no publicly available tool matched the full task definition of our workflow, particularly slice usability filtering, intra-patient ranking, and dedicated trabecular-target preparation. Fourth, the current system operates on 2D axial slices without through-plane context. Finally, case-level predictive uncertainty, reader studies, and prospective workflow impact were not evaluated in the present study. Future work should therefore focus on broader multicenter validation, protocol harmonization, and prospective assessment of workflow utility.

5. Conclusions

In conclusion, we developed and externally evaluated a fully automated single-slice lumbar QCT workflow for vertebral trabecular HU measurement that combines slice prescreening, dual-purpose segmentation, intra-patient best-slice ranking, and deterministic ROI definition. In the evaluable external cohort (44 paired cases), the pipeline achieved high agreement with expert HU measurements, explicitly rejecting non-evaluable or borderline-quality inputs rather than forcing output generation. Ablation analysis showed that best-slice ranking and inner-ROI erosion were the most influential contributors to end-to-end performance, whereas ellipse fitting provided a secondary refinement. Importantly, the observed machine–manual agreement should be interpreted relative to the repeatability of manual HU measurement itself. In our repeatability analysis, repeated manual measurements yielded an RC of 10.45 HU, indicating that the automated pipeline approached manual repeatability at ±15 HU, although a residual gap persisted at the stricter ±10 HU level. In an additional open module-level baseline comparison, our task-specific QC-Envelope segmentation substantially outperformed TotalSegmentator in a lumbar-only slice-level evaluation, supporting the value of a dedicated broad segmentation stage in this QC-first workflow. These findings support the technical validity of the proposed framework as a traceable single-slice HU-measurement system, while further multicenter and prospective validation remains necessary before broader clinical deployment. Representative comparisons with related work, with emphasis on QC strategy and intermediate-output traceability, are summarized in Table 10.

Author Contributions

Conceptualization, Z.-Y.Y. and T.K.; Methodology, Z.-Y.Y.; Software, Z.-Y.Y.; Validation, T.K., J.-M.P. and B.-Q.L.; Formal Analysis, Z.-Y.Y.; Investigation, Z.-Y.Y.; Resources, T.K.; Data Curation, Z.-Y.Y.; Annotation, T.K. and J.-M.P.; Writing—Original Draft Preparation, Z.-Y.Y.; Writing—Review and Editing, Z.-Y.Y., T.K., J.-M.P. and B.-Q.L.; Visualization, Z.-Y.Y.; Supervision, T.K.; Project Administration, T.K. All authors have read and agreed to the published version of the manuscript.

Funding

This research received no external funding.

Institutional Review Board Statement

The study was conducted in accordance with the Declaration of Helsinki and was approved by the Institutional Review Board of Hokkaido University Hospital (protocol code 017-0483, approved 1 September 2017). This approval permitted retrospective analysis of CT images acquired for clinical purposes. An amendment to the protocol entitled “Opportunistic osteoporosis screening using CT acquired for other indications” was approved by the ethics committee on 19 February 2026, which administratively extended the study period and updated the investigator list.

Informed Consent Statement

Patient consent was waived due to the retrospective nature of the study, the potentially large study population, and the inclusion of historical patient data, for which obtaining individual informed consent was impracticable.

Data Availability Statement

The source code, inference pipeline, example artifacts, and usage instructions are publicly available at the project GitHub repository: https://github.com/WEISHANGAZHE/automated-single-slice-lumbar-qct-hu (version v0.1; accessed on 7 March 2026). Pretrained model weights are provided through the repository and mirrored in an external archive referenced in the README for access convenience. Due to institutional and ethical restrictions, the raw clinical imaging data cannot be publicly released; however, de-identified evaluation artifacts, code, and instructions necessary to reproduce the reported inference workflow are provided.

Acknowledgments

Generative AI-assisted tools, including ChatGPT (OpenAI, web version, https://chatgpt.com/; accessed on 7 January 2026) and grammar-checking software (web version; accessed on 7 January 2026), were used for language translation and proofreading, improving grammar and readability, and providing minor debugging support for code (e.g., identifying syntax issues and suggesting possible fixes). No AI tools were used for algorithm design, data analysis, result generation, figure creation, or scientific interpretation. All experimental design, data processing, analyses, and conclusions were performed entirely by the authors.

Conflicts of Interest

The authors declare no conflicts of interest.

References

  1. Pisani, P.; Renna, M.D.; Conversano, F.; Casciaro, E.; Di Paola, M.; Quarta, E.; Muratore, M.; Casciaro, S. Major osteoporotic fragility fractures: Risk factor updates and societal impact. World J. Orthop. 2016, 7, 171–181. [Google Scholar] [CrossRef] [Scilit] [PubMed]
  2. El Maghraoui, A.; Roux, C. DXA scanning in clinical practice. QJM 2008, 101, 605–617. [Google Scholar] [CrossRef] [Scilit] [PubMed]
  3. Gruenewald, L.D.; Koch, V.; Martin, S.S.; Yel, I.; Eichler, K.; Gruber-Rouh, T.; Lenga, L.; Wichmann, J.L.; Alizadeh, L.S.; Albrecht, M.H.; et al. Diagnostic accuracy of quantitative dual-energy CT-based volumetric bone mineral density assessment for the prediction of osteoporosis-associated fractures. Eur. Radiol. 2022, 32, 3076–3084. [Google Scholar] [CrossRef] [Scilit] [PubMed]
  4. Yoon, H.; Kim, J.-H.; Ryu, D.-S.; Yoon, S.-H. What Causes the Discrepancy between Quantitative Computed Tomography and Dual Energy X-Ray Absorptiometry? Nerve 2021, 7, 64–70. [Google Scholar] [CrossRef] [Scilit]
  5. Jones, G.; Nguyen, T.; Sambrook, P.N.; Kelly, P.J.; Eisman, J.A. A longitudinal study of the effect of spinal degenerative disease on bone density in the elderly. J. Rheumatol. 1995, 22, 932–936. [Google Scholar] [PubMed]
  6. Park, H.; Kang, W.Y.; Woo, O.H.; Lee, J.; Yang, Z.; Oh, S. Automated deep learning-based bone mineral density assessment for opportunistic osteoporosis screening using various CT protocols with multi-vendor scanners. Sci. Rep. 2024, 14, 25014. [Google Scholar] [CrossRef] [Scilit] [PubMed]
  7. Fusco, S.; Spadafora, P.; Gallazzi, E.; Ghiara, C.; Albano, D.; Sconfienza, L.M.; Messina, C. Comparison Between Quantitative Computed Tomography-Based Bone Mineral Density Values and Dual-Energy X-Ray Absorptiometry-Based Parameters of Bone Density and Microarchitecture: A Lumbar Spine Study. Appl. Sci. 2025, 15, 3248. [Google Scholar] [CrossRef] [Scilit]
  8. Oliveira, M.A.; Moraes, R.; Castanha, E.B.; Prevedello, A.S.; Vieira Filho, J.; Bussolaro, F.A.; García Cava, D. Osteoporosis Screening: Applied Methods and Technological Trends. Med. Eng. Phys. 2022, 108, 103887. [Google Scholar] [CrossRef] [Scilit] [PubMed]
  9. Yang, J.; Zeng, Y.; Yu, W. Criteria for osteoporosis diagnosis: A systematic review and meta-analysis of osteoporosis diagnostic studies with DXA and QCT. EClinicalMedicine 2025, 83, 103244. [Google Scholar] [CrossRef] [Scilit] [PubMed]
  10. Pickhardt, P.J.; Pooler, B.D.; Lauder, T.; del Rio, A.M.; Bruce, R.J.; Binkley, N. Opportunistic screening for osteoporosis using abdominal computed tomography scans obtained for other indications. Ann. Intern. Med. 2013, 158, 588–595. [Google Scholar] [CrossRef] [Scilit] [PubMed]
  11. Jang, S.; Graffy, P.M.; Ziemlewicz, T.J.; Lee, S.J.; Summers, R.M.; Pickhardt, P.J. Opportunistic Osteoporosis Screening at Routine Abdominal and Thoracic CT: Normative L1 Trabecular Attenuation Values in More than 20 000 Adults. Radiology 2019, 291, 360–367. [Google Scholar] [CrossRef] [Scilit] [PubMed]
  12. Vadera, S.; Osborne, T.; Shah, V.; Stephenson, J.A. Opportunistic screening for osteoporosis by abdominal CT in a British population. Insights Imaging 2023, 14, 57. [Google Scholar] [CrossRef] [Scilit] [PubMed]
  13. Westerhoff, M.; Gyftopoulos, S.; Dane, B.; Vega, E.; Murdock, D.; Lindow, N.; Herter, F.; Bousabarah, K.; Recht, M.P.; Bredella, M.A. Deep Learning-based Opportunistic CT Osteoporosis Screening and the Establishment of Normative Values. Radiology 2025, 317, e250917. [Google Scholar] [CrossRef] [Scilit] [PubMed]
  14. Hamouda, A.M.; Pennington, Z.; Astudillo Potes, M.; Shafi, M.; Mikula, A.L.; Lakomkin, N.; Martini, M.L.; Bydon, M.; Kennel, K.A.; Drake, M.T.; et al. Impact of contrast administration and CT reconstruction plane on Hounsfield units for assessing underlying bone quality in the lumbar spine. J. Neurosurg. Spine 2025, 42, 331–339. [Google Scholar] [CrossRef] [Scilit] [PubMed]
  15. Liebl, H.; Schinz, D.; Sekuboyina, A.; Malagutti, L.; Löffler, M.T.; Bayat, A.; El Husseini, M.; Tetteh, G.; Grau, K.; Niederreiter, E.; et al. A computed tomography vertebral segmentation dataset with anatomical variations and multi-vendor scanner data. Sci. Data 2021, 8, 284. [Google Scholar] [CrossRef] [Scilit] [PubMed]
  16. Guo, M.; Zhang, Y.; Gu, X.; Liu, X.; Peng, F.; Zhang, Z.; Jing, M.; Fu, Y. A comparative study of bone density in elderly people measured with AI and QCT. Front. Artif. Intell. 2025, 8, 1582960. [Google Scholar] [CrossRef] [Scilit] [PubMed]
  17. Wang, S.; Tong, X.; Cheng, Q.; Xiao, Q.; Cui, J.; Li, J.; Liu, Y.; Fang, X. Fully automated deep learning system for osteoporosis screening using chest computed tomography images. Quant. Imaging Med. Surg. 2024, 14, 2816–2827. [Google Scholar] [CrossRef] [Scilit] [PubMed]
  18. Pan, J.; Lin, P.C.; Gong, S.C.; Wang, Z.; Cao, R.; Lv, Y.; Zhang, K.; Wang, L. Effectiveness of opportunistic osteoporosis screening on chest CT using the DCNN model. BMC Musculoskelet. Disord. 2024, 25, 176. [Google Scholar] [CrossRef] [Scilit] [PubMed]
  19. Niu, X.; Huang, Y.; Li, X.; Yan, W.; Lu, X.; Jia, X.; Li, J.; Hu, J.; Sun, T.; Jing, W.; et al. Development and validation of a fully automated system using deep learning for opportunistic osteoporosis screening using low-dose computed tomography scans. Quant. Imaging Med. Surg. 2023, 13, 5294–5305. [Google Scholar] [CrossRef] [Scilit] [PubMed]
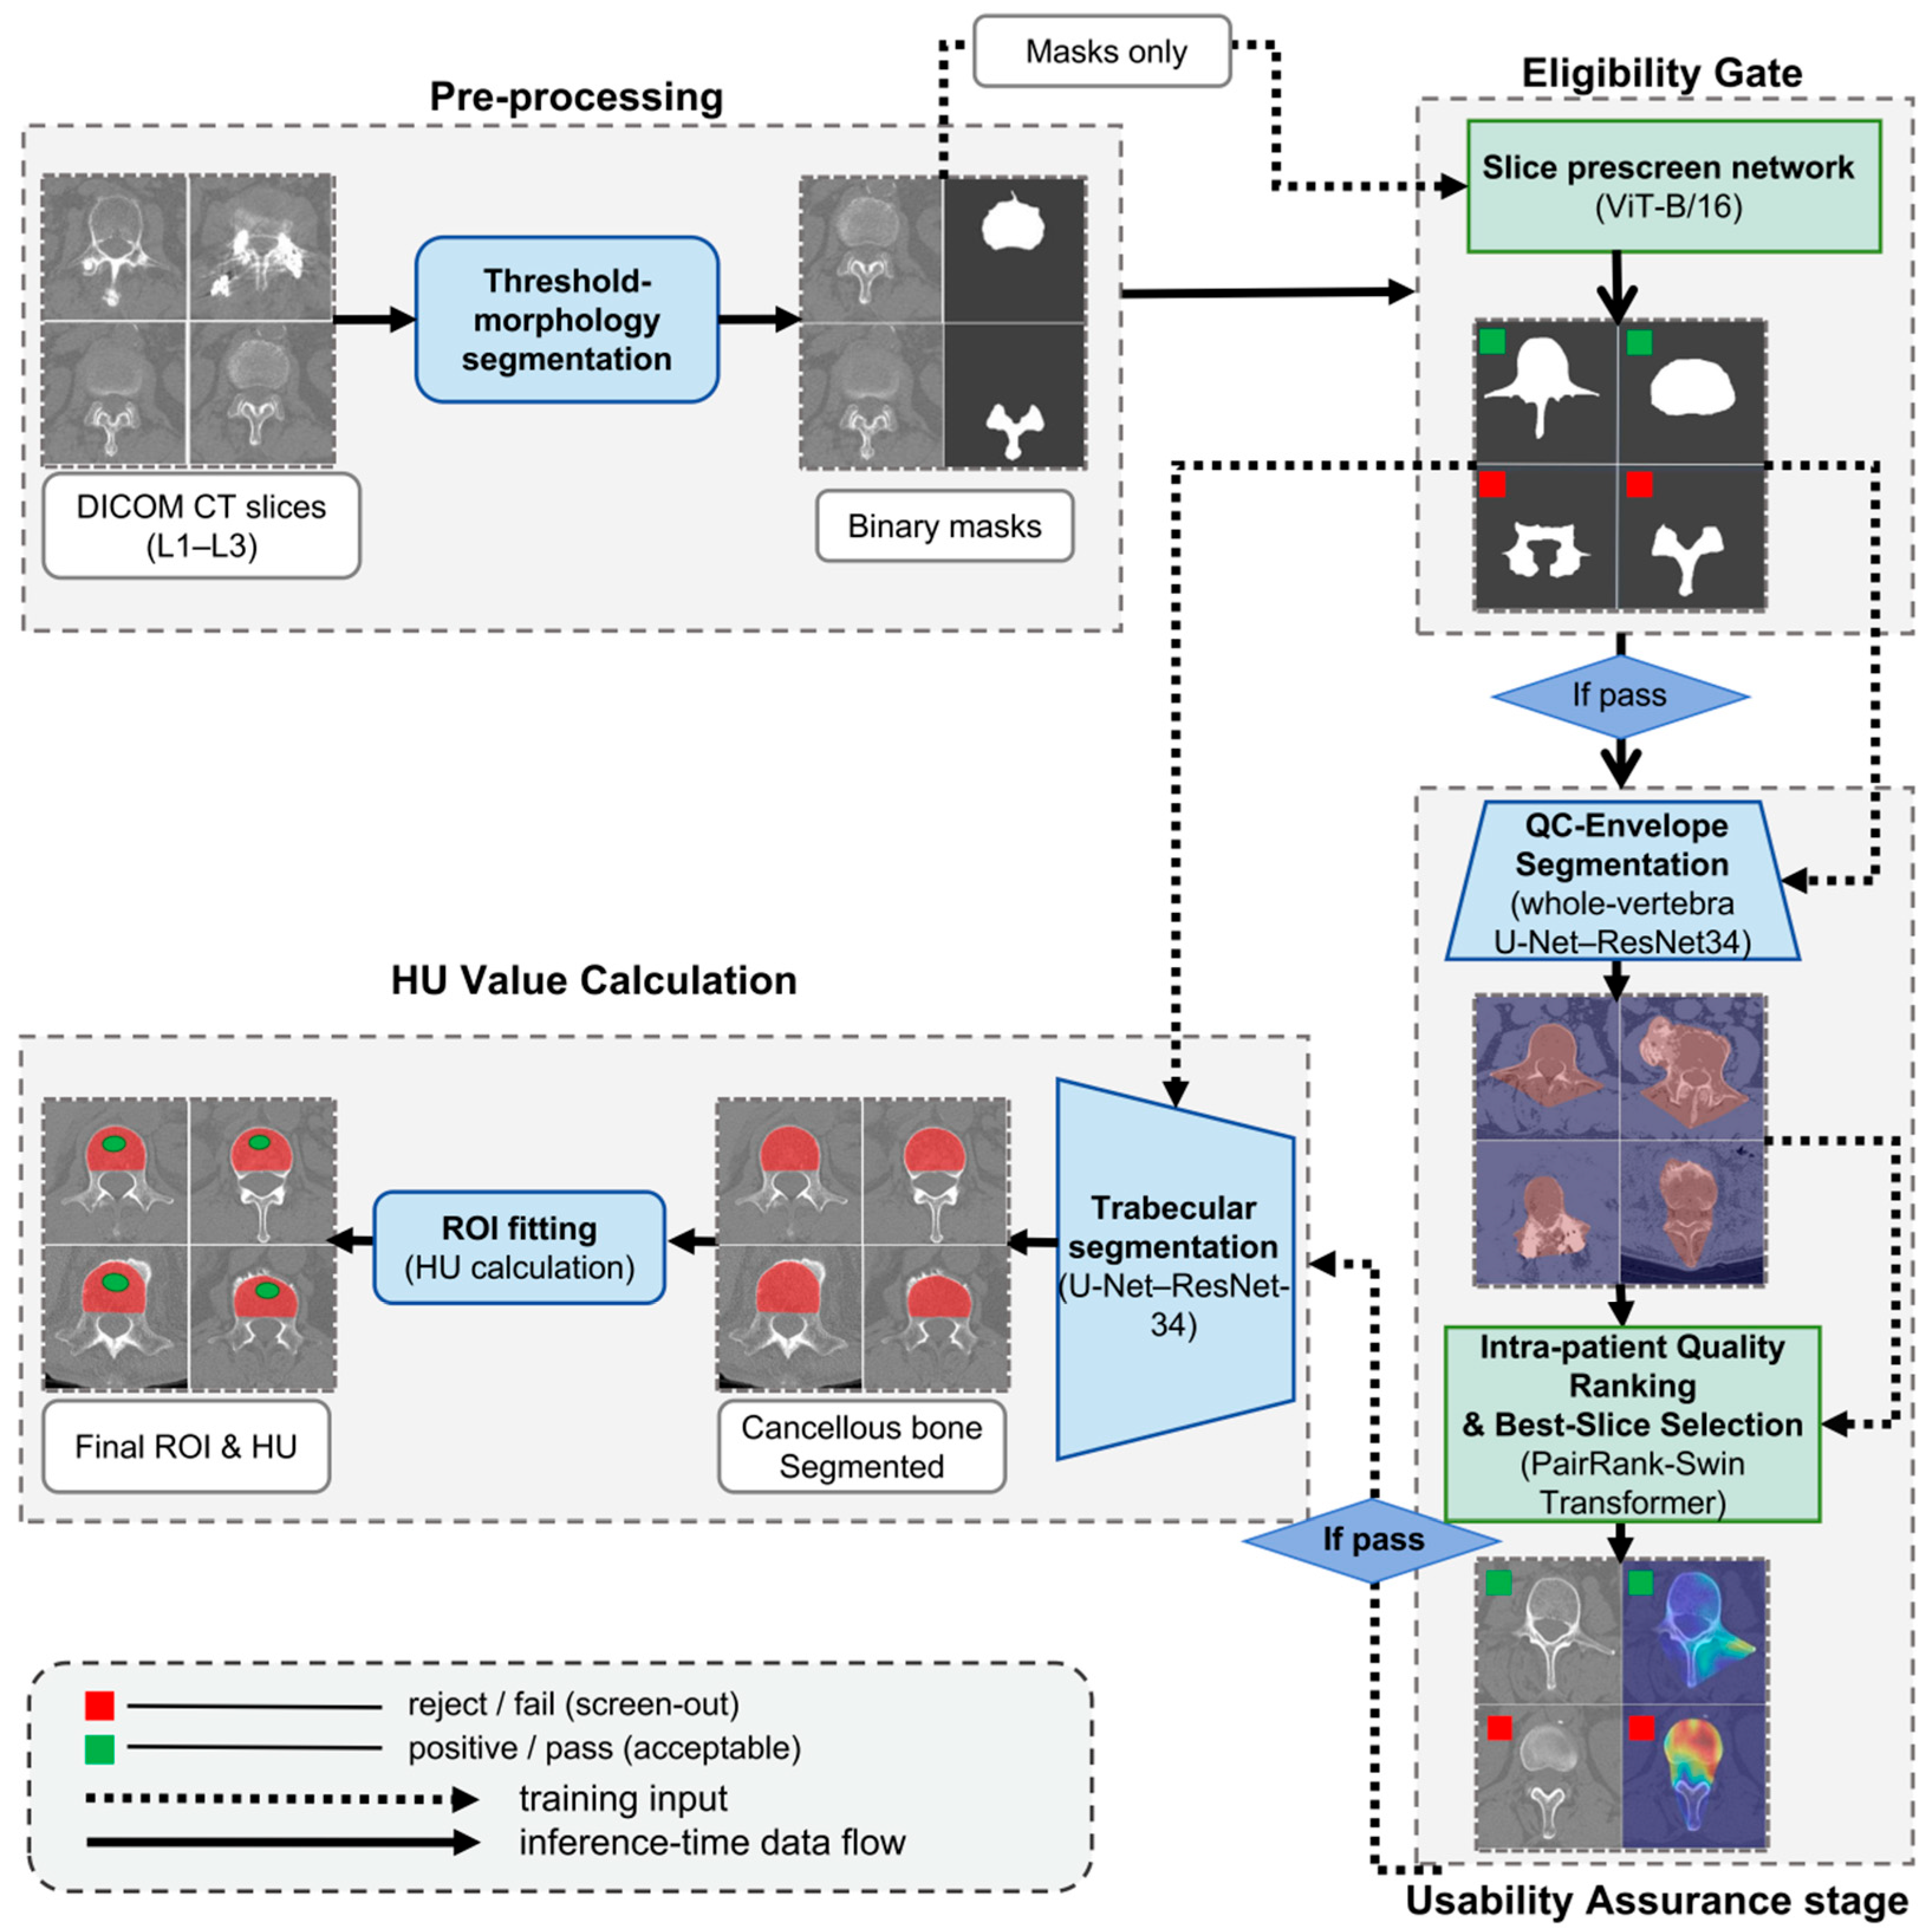
Figure 1. Preprocessing generates coarse binary vertebral masks from L1–L3 DICOM slices. The Eligibility Gate uses a ViT-B/16 classifier to label each slice as eligible or ineligible based on the coarse mask. Eligible slices are then processed by QC-Envelope segmentation to obtain broad vertebral envelopes for usability assurance and localization. In parallel, an intra-patient quality-ranking network (PairRank-Swin) assigns an unsuitability score to candidate slices, and the Best-Slice Selector retains the top-ranked passing slice for each vertebral level. Trabecular segmentation is then applied to the selected slice, followed by deterministic inner-ROI definition for HU quantification and optional exploratory vBMD proxy estimation. Solid arrows denote inference steps, whereas dashed arrows denote training/feedback connections. Green and red boxes indicate pass/reject screening decisions at the Eligibility Gate and Usability Assurance stages.
Make 08 00077 g001
Figure 2. Examples of slices used to train the Eligibility Gate. Each pair (A1D2) shows an axial CT slice and its corresponding coarse binary mask used as actual model input. In each pair, panels labeled “1” denote the original CT slice (left, displayed for visual reference), and panels labeled “2” denote the corresponding coarse binary mask (right, used as the actual input to the Eligibility Gate). Disc-level slices (A) and slices dominated by posterior elements and metallic implants (C) are labeled as ineligible, whereas mid-vertebral-level (B) and end-plate-level (D) slices with fully visible vertebral bodies are labeled as eligible.
Make 08 00077 g002
Figure 3. Dual-target segmentation used for usability assurance and HU calculation. Case-1 and Case-2 are shown in the upper and lower rows, respectively. The left column shows QC-Envelope segmentation (whole-vertebra mask), which deliberately preserves the cortex, endplates, pedicles, osteophytes, and even metal implants, providing rich anatomical cues for assessing slice usability. The right column shows trabecular segmentation (cancellous compartment), which isolates trabecular bone with safety margins while suppressing cortical and other high-density structures, thereby providing a quantitative region of interest for HU/vBMD measurement. Orange overlays indicate QC-Envelope masks, and blue overlays indicate trabecular masks.
Make 08 00077 g003
Figure 4. Representative segmentation outputs used for usability assurance and HU calculation. Panels (AD) show QC-Envelope segmentation (whole-vertebra mask), in which pale orange overlays indicate the broad QC-oriented mask that intentionally retains cortex, endplates, pedicles/osteophytes, and metallic implants to preserve anatomical cues for slice usability assessment. Panels (EH) show trabecular segmentation, in which red overlays indicate the cancellous-compartment mask/safety-margin ROI used for HU/vBMD quantification while suppressing cortical and other high-density structures. (A) typical mid-vertebral slice; (B) intravertebral implant; (C) osteophytes/posterior-element overgrowth; (D) endplate-level slice; (EH) representative trabecular ROI examples including deformity/high-density interference.
Make 08 00077 g004
Figure 5. Representative module-level comparison between the task-specific QC-Envelope segmentation and the open TotalSegmentator baseline on lumbar-only slices. Yellow contours indicate the manual broad segmentation target, green contours indicate the proposed QC-Envelope prediction, and red contours indicate the TotalSegmentator lumbar-union baseline. Panels (A,B) show representative typical and boundary-mismatch cases, Panel (C) shows a metal-affected difficult case, and Panel (D) shows a severe baseline-mismatch case. Across these representative examples, the proposed QC-Envelope more closely matched the intended broad QC target, whereas the open baseline frequently showed marked mismatch in posterior-element, lateral-outline, and broad-envelope regions.
Make 08 00077 g005
Figure 6. Class-activation heatmaps for the intra-patient quality ranking network (PairRank-Swin). For each case, the left image (A1D1) is the original cropped vertebral ROI, and the right image (A2D2) overlays model attention (warmer colors indicate regions contributing more to an ‘unsuitability’ prediction). Examples include slices with posterior-element cues, marginal osteophyte/endplate sclerosis, truncation, and endplate–disc transitions.
Make 08 00077 g006
Figure 7. Agreement between automated and manual HU measurements on the evaluable external cohort (n = 44 paired cases). (A) Correlation and linear regression between machine-predicted and manual-reference HU values. Each × symbol represents one paired case. The solid diagonal line indicates the identity line (y = x). (B) Bland–Altman plot showing the difference (Machine − Manual) against the mean of the two measurements. Each × symbol represents one paired case. The solid horizontal lines indicate the mean bias and the 95% limits of agreement. The dashed horizontal lines indicate the prespecified tolerance bands of ±10 HU.
Make 08 00077 g007
Table 1. Patient demographics/slice statistics for the development and external validation cohorts.
VariableDevelopment SetExternal Validation Cohort
Age (years), mean ± SD64.6 ± 14.462.1 ± 12.4
Sex (female/male), n (%)56 (61.5%)/35 (38.5%)31 (62.0%)/19 (38.0%)
Total number of slices, n (L1–L3, DICOM)26251482
“Problematic slices” (severe deformity/metal artifact), n (%)737 (28.1%)297 (20.0%)
Table 2. Functional subsets of the development cohort for training different pipeline modules.
Cohort/SubsetPatients (n)Slices (n)PurposeNotes
Development (overall)912625Source poolPatient-level 5-fold CV
Segmentation subset (QC-Envelope + trabecular)38922Dual-target U-Net training (QC-Envelope + trabecular)Learning curve plateaued
Eligibility Gate27736ViT-B/16 classifierratio ≈ 9:1
Intra-patient Quality Ranking subset912360 PairRank-Swin trainingIntra-patient positive-negative pairing
Table 3. CT Scanning Parameters for the development set.
ParameterValue
Tube voltage (kVp)120 (n = 60), 135 (n = 31)
Tube current (mA)310 ± 163 (range, 80–638)
Slice thickness (mm)3.0 (n = 64), 5.0 (n = 23), other/irregular settings (n = 4)
Matrix810 × 810 (n = 33), 512 × 512 (n = 55), 512 × 518 (n = 3)
Field of view (mm)161.1 ± 29.2
Table 4. Eligibility Gate performance on the development and external cohorts (no external threshold tuning).
Cohort (Evaluation)SlicesAccuracy (%)Precision (%)Recall (Sensitivity) (%)Specificity
(%)
F1
(%)
Development
(5-fold, aggregated)
73699.05 (95% CI, 98.05–99.54)99.40 (95% CI, 98.46–99.76)99.55 (95% CI, 98.67–99.85)94.67 (95% CI, 87.07–97.91)99.47
External (independent)148299.26 (95% CI, 98.68–99.59)99.62 (95% CI, 99.10–99.84)99.54 (95% CI, 99.00–99.79)97.22 (95% CI, 93.66–98.81)99.58
Notes: Accuracy, precision, recall, and specificity are accompanied by two-sided 95% Wilson confidence intervals. F1-score is reported as a point estimate.
Table 5. Dice (mean ± SD) and 95% confidence intervals for QC-Envelope and trabecular segmentation. Dice 95% CIs were obtained by slice-level bootstrap (B = 2000).
CohortSegmentation TargetDice (Mean ± SD)95% CI (Dice)Slices Used
Development (CV)QC-Envelope (whole-vertebra)0.9596 ± 0.00420.9593–0.9599922 labeled slices
Development (CV)Trabecular (cancellous compartment)0.9668 ± 0.00820.9663–0.9673922 labeled slices
External (independent)QC-Envelope (whole-vertebra)0.9572 ± 0.00600.9460–0.9670post-Eligibility Gate n = 1302
External (independent)Trabecular (cancellous compartment)0.9710 ± 0.00750.9600–0.9830post-Eligibility Gate n = 1302
Table 6. Open module-level baseline comparison for broad segmentation on the lumbar-only slice-level evaluation subset.
ModelN SlicesDiceHD95ASSD
QC-Envelope (ours)3420.977 ± 0.0166.42 ± 7.452.16 ± 1.61
TotalSegmentator (lumbar union)3420.430 ± 0.25686.76 ± 47.8934.45 ± 26.65
Table 7. PairRank-Swin performance at the fixed threshold selected on the development set (0.55).
CohortPost-Eligibility Gate SlicesThresholdPrecision%Recall%F1%PR-AUC
Development (5-fold CV)23600.55 (fixed)84 ± 683 ± 584 ± 20.87 ± 0.04
External (independent)13020.55 (fixed)91.9980.0285.590.88 ± 0.05
Table 8. HU agreement statistics on the evaluable external cohort (n = 44 paired cases).
MetricEstimate95% CIp-ValueNotes
Pearson’s r0.9870.976 to 0.993Correlation between automated and manual HU
Spearman’s ρ0.9800.946 to 0.989Rank correlation between automated and manual HU
Lin’s CCC0.9850.978 to 0.989Bootstrap CI
Mean bias (HU)−0.44−2.62 to +1.710.691Bland–Altman bias; H0: bias = 0
Limits of agreement (HU)−14.88 to +13.99Lower LoA CI: −18.20 to −11.10; Upper LoA CI: +10.36 to +17.00
Within ±10 HU37/44 (84.1%)70.6% to 92.1%Wilson CI
Within ±15 HU43/44 (97.7%)88.2% to 99.6%Wilson CI
OLS slope, b1.0571.004 to 1.1110.036Regression: Machine = a + b × Manual; H0: b = 1
OLS intercept, a−5.31−10.34 to −0.280.039Regression: Machine = a + b × Manual; H0: a = 0
Notes: Paired agreement analysis was performed on the 44 evaluable external cases after excluding 4 non-evaluable cases rejected by both manual review and the pipeline, and 2 additional borderline-quality cases rejected by the automated pipeline. Pearson’s r and Spearman’s ρ are reported with two-sided 95% confidence intervals. Lin’s concordance correlation coefficient (CCC), mean bias, and limits of agreement were estimated with bootstrap 95% confidence intervals. Coverage within ±10 HU and ±15 HU was reported with Wilson 95% confidence intervals. Ordinary least-squares regression was fitted as Machine = a + b × Manual.
Table 9. Ablation analysis of the end-to-end workflow on the evaluable external cohort (n = 44 paired cases).
SettingN Paired CasesPearson rLin’s CCCMAE
(HU)
Bias
(HU)
Within ±10 HUWithin ±15 HU
FULL440.9870.9856.10−0.4484.1%97.7%
NO_GATE440.9870.9855.92−0.2786.4%97.7%
NO_RANK440.4910.25070.04+65.3615.9%20.5%
ROI_NO_ELLIPSE440.9680.9677.98+1.7772.7%86.4%
ROI_NO_EROSION440.9020.71332.05+31.256.8%15.9%
Table 10. Comparison with representative related work, with emphasis on QC strategy and intermediate-output traceability.
StudyInput GranularityQC Mechanism
(Slice-Level)
Intermediate-Output TraceabilityExternal EvaluationNotes
Niu et al. [19]Low-dose chest CT (multi-slice)No explicit slice-level QC reportedIntermediate artifacts not emphasized as stored reviewable outputsLarge, multi-slice, single-centerStrong automated screening performance, but not specialized for lumbar QCT or operator-style single-slice measurement
Wang et al. [17]Chest CT (multi-slice)No explicit slice-level QC reportedMulti-task outputs reported, but not framed as preserved stepwise review artifactsLarge, multi-slice, single-centerLocalization/segmentation/classification framework using multi-slice inputs
Westerhoff et al. [13]Multi-slice/volumetric CTNot emphasized as an explicit slice-level gate (focus on automated volumetric ROI placement and protocol-aware harmonization)ROI logic described, but not designed as a stepwise review-preserving workflowmulti-scanner/multi-protocol cohortAutomated 3D trabecular ROI, harmonization across scanner models and tube voltages, and establishment of normative values/screening thresholds
This studyLumbar QCT (single-slice)Eligibility Gate + intra-patient quality ranking (PairRank-Swin) + best-slice selectionReviewable intermediate outputs preserved, including QC-Envelope overlays, trabecular masks/ROI, QC decisions, and attention mapsSmall, single-center, cross-device testStepwise QC-first workflow with locked thresholds and explicit rejection of non-evaluable or borderline-quality inputs
Note: “Intermediate-output traceability” indicates that artifacts from individual workflow stages are stored and reviewable, such as segmentation overlays, QC decisions, and attention maps, rather than only final scalar outputs.
Disclaimer/Publisher’s Note: The statements, opinions and data contained in all publications are solely those of the individual author(s) and contributor(s) and not of MDPI and/or the editor(s). MDPI and/or the editor(s) disclaim responsibility for any injury to people or property resulting from any ideas, methods, instructions or products referred to in the content.