Abstract
This paper examines the integration of machine learning (ML) techniques in professional football, focusing on two key areas: (i) player and team performance, and (ii) match outcome prediction. Using a systematic methodology, this study reviews 172 papers from a five-year observation period (2019–2024) to identify relevant applications, focusing on the analysis of game actions (free kicks, passes, and penalties), individual and collective performance, and player position. A predominance of supervised learning, deep learning, and hybrid models (which integrate several ML techniques) is observed in the ML categories. Among the most widely used algorithms are decision trees, extreme gradient boosting, and artificial neural networks, which focus on optimizing sports performance and predicting outcomes. This paper discusses challenges such as the limited availability of public datasets due to access and cost restrictions, the restricted use of advanced visualization tools, and the poor integration of data acquisition devices, such as sensors. However, it also highlights the role of ML in addressing these challenges, thereby representing future research opportunities. Furthermore, this paper includes two illustrative case studies: (i) predicting the date Cristiano Ronaldo will reach 1000 goals, and (ii) an example of predicting penalty shoots; these examples demonstrate the practical potential of ML for performance monitoring and tactical decision-making in real-world football environments.
1. Introduction and Motivation
Machine learning (ML) is a branch of science that enables computers to learn from data they previously did not have. This ability can be leveraged in any area, and sport has not been the exception [1]. In the case of professional football, although it is a probabilistic and chaotic world, there is evidence that indicates that the application of specific ML tools combined with the use of big data and its analysis can mean improvements in player performance, as well as the prediction of matches [2]. Therefore, the coaching staff would have knowledge that can favor the player(s) and the team.
To understand the applicability of ML in professional football, this paper presents a systematic review of the literature, focusing on player and team performance, as well as match outcome prediction, over five years (2019–2024). It begins by discussing the motivation for using ML in sports, especially professional football, and provides an overview of the most commonly used ML techniques. Subsequently, it details the methodology for searching and selecting papers, research questions, and the classification scheme for scientific contributions. Finally, the results addressing the research questions are analyzed. The following sections further explore the motivation behind ML applications in professional football.
Motivation for the Application of Machine Learning in Sports and Football
In recent years, sports have undergone a significant transformation due to technological advancements, with ML emerging as a key tool to optimize performance, decision-making, and the experience of athletes and coaches [1]. Traditionally, sports preparation and strategies were based on experience and manual data analysis. However, the availability of large volumes of data and the development of advanced techniques have allowed ML to improve these processes more efficiently [3]. Its main advantage lies in the ability to process large volumes of information in real time, extracting insights that are difficult to obtain manually. This allows coaches and analysts to make more informed decisions about strategies, lineups, and training, predict injuries, optimize performance, and improve skill development.
The use of statistics in sports began in 1912 with Hugh Fullerton, who applied methods to evaluate performance in baseball. Since then, various disciplines have integrated real-time analysis but with technological limitations [4]. The technological advances of the 1960s and 1970s enabled the automation of statistical analysis. In the 1990s, the incorporation of cameras and sensors improved data collection on player performance [5]. In 1992, the American Statistical Association established a section dedicated to sports statistics, and in 2002, Billy Beane utilized quantitative analysis with the Oakland Athletics to enhance the team’s competitiveness [6]. In the 21st century, technologies such as high-speed cameras and GPS have refined sports analytics; however, the real turning point was the rise of big data and ML in the 2010s.
ML has become a key tool for analyzing large volumes of data in sports, integrating information from cameras, sensors, and wearable devices to optimize athlete performance in real time. Wearable devices that allow monitoring of variables such as heart rate and energy expenditure have experienced exponential growth, with a market valued at USD 92.71 billion in 2023 and projected to be USD 225.66 billion in 2029 [7]. The combination of ML and technological devices provides immediate feedback to coaches and players, allowing for strategic adjustments in real time and consolidating itself as an essential resource in today’s sports. Football, one of the most profitable and influential sports in the world, has integrated technological tools to optimize team and player performance. In recent decades, clubs have adopted big data and ML strategies to make informed decisions, thereby optimizing both individual and collective performance. These techniques enable the analysis of game tactics in real time, as well as the segmentation of actions, such as passes and shots on goal, to enhance strategic planning [4].
The remainder of this paper is structured as follows. Section 2 provides a comprehensive background on ML techniques, including supervised, unsupervised, semi-supervised, reinforcement, and deep learning, and also describes their specific application areas in football. Section 3 presents a review of related work. Section 4 outlines the systematic methodology employed in this study, including planning, conducting, and reporting scheme. Section 5 presents the results of the mapping study in response to the defined research questions, supported by charts, figures, and the corresponding analysis. Section 6 discusses the obtained results; meanwhile, Section 7 presents a couple of case studies in which ML can be used to enhance football analysis. Finally, Section 8 concludes the paper by summarizing the key findings and identifying future research directions.
2. Background
2.1. Machine Learning Techniques
According to the literature review, this section examines the various categories and techniques employed in football.
2.1.1. Supervised Learning
Supervised learning is an ML category that relies on labeled data, where the model receives input–output pairs with expected results. Through this approach, the model learns to identify patterns and associate specific features of the input data with the correct outputs, enabling the automation of classification and prediction tasks with high accuracy. This technique is widely used in recommendation systems and financial analysis, where the precision of decision-making is crucial [8,9]. Supervised learning is divided into two main types of algorithms: (i) classification and (ii) regression, as illustrated in Figure 1.
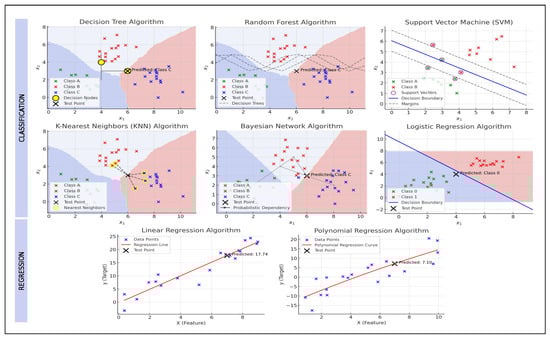
Figure 1.
Example of application of supervised learning techniques.
- Classification algorithms: ML techniques focused on classification enable the assignment of labels or categories to data based on their characteristics, facilitating automated decision-making in various applications. In this context, classification algorithms are fundamental because they can handle structured and unstructured data with high accuracy and efficiency [10]. Among the most widely used models are decision trees, random forests, support vector machines (SVMs), k-nearest neighbors (KNNs), Bayesian networks, and logistic regression, each offering specific advantages depending on the nature of the data and the problem to be solved. Table 1 describes these algorithms.
- Regression algorithms: These techniques enable the prediction of continuous values by modeling the relationship between a dependent variable and one or more independent variables. Regression analysis is essential for identifying trends, making forecasts, and optimizing decision-making in various fields [11]. Among the different regression approaches, linear regression and polynomial regression are two fundamental methods described in Table 2.
2.1.2. Unsupervised Learning
In unsupervised learning, the model is trained on unlabeled data, allowing it to uncover hidden patterns and underlying structures without human intervention. The algorithms used in this approach aim to group similar data points or reduce dimensionality to identify implicit relationships and trends. This methodology is widely applied in market segmentation, anomaly detection, and exploratory data analysis, enabling the discovery of meaningful patterns in large datasets where manual classification is impractical [8]. The main techniques in unsupervised learning can be categorized into three groups: (i) clustering, (ii) association, and (iii) dimensionality reduction, as summarized in Figure 2.
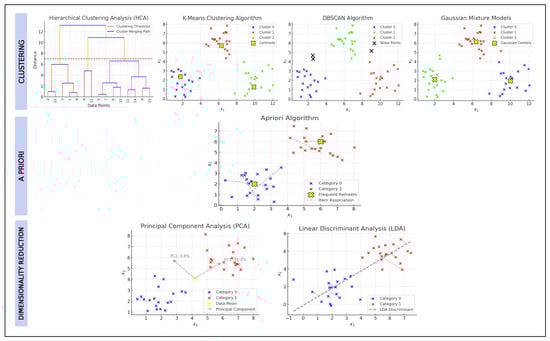
Figure 2.
Example of application of unsupervised learning techniques.
- Clustering algorithms: These unsupervised learning techniques operate on unlabeled data to identify inherent patterns and organize data points into meaningful groups based on their similarities [10]. Table 3 provides a detailed overview of the most commonly used clustering algorithms and their key characteristics.
- Association algorithms: Association rules are used for exploratory data analysis, allowing the identification of hidden patterns and relationships between different events or actions that may initially appear independent. These techniques facilitate the detection of significant correlations within large datasets, helping to understand how the occurrence of one event can influence the probability of another [12]. Among the widely used algorithms for extracting association rules, Apriori is the most representative of this category, described in Table 4.
- Dimensionality reduction algorithms: Dimensionality reduction is a method that represents a dataset using a reduced number of features (or dimensions) while preserving the significant properties of the original data. This process eliminates irrelevant, redundant, or noisy features to construct a more efficient model with fewer variables [13]. Table 5 describes the most common dimensionality reduction algorithms: (i) principal component analysis (PCA) and (ii) linear discriminant analysis (LDA).

Table 1.
Classification algorithms.
Table 1.
Classification algorithms.
| Algorithm | Description |
|---|---|
| Decision tree | This algorithm employs a hierarchical tree-like structure to make sequential decisions based on rules derived from training data. It is widely used in classification and regression due to its ability to handle nonlinear data and provide interpretability in decision-making [10]. In sports analytics, decision trees help classify player performance based on various metrics, such as passing accuracy and movement patterns [2]. |
| Random forest | This algorithm combines multiple decision trees to improve accuracy and reduce overfitting. Each tree is trained on a random subset of the dataset (bootstrap sampling), and the final prediction is obtained through majority voting in classification or averaging in regression [10]. In football, random forests are often used to predict match outcomes by analyzing historical performance data and real-time game statistics [14]. |
| Support vector machine (SVM) | This algorithm identifies an optimal hyperplane that maximizes the separation between classes in a high-dimensional space [15]. SVM has been applied in football scouting systems to classify players based on playing styles and attributes [14]. |
| K-nearest neighbors (KNN) | This algorithm classifies a new data point based on its proximity to its k-nearest neighbors in the feature space. It is an instance-based method, meaning it does not require an explicit training phase, but its performance can be affected by the choice of k and the distance metric used [16]. In football, KNN can be used to find players with similar playing characteristics by comparing historical performance metrics [14]. |
| Bayesian networks | Bayesian networks represent a probabilistic model structured through a set of nodes (variables) and directed edges indicating conditional dependency relationships. In football, Bayesian networks have been applied to assess injury risks by analyzing a player’s physical condition, workload, and historical injury data [17]. |
| Logistic regression | This algorithm is a statistical model used for binary classification, where the output is a probability indicating membership in a specific category [10]. In sports analytics, logistic regression is often used to predict the likelihood of a goal based on variables such as shot angle, distance, and player positioning [2]. |
Table 2.
Regression algorithms.
Table 2.
Regression algorithms.
| Algorithm | Description |
|---|---|
| Linear regression | This algorithm is used to predict numerical values by establishing a linear relationship between a dependent variable and one or more independent variables. It relies on minimizing the error between predictions and actual values using the least squares method [18]. In sports analytics, linear regression is applied, for example, to predict a player’s performance based on playing time, average speed, and the number of completed passes [14]. |
| Polynomial regression | This technique extends linear regression by allowing the modeling of nonlinear relationships between variables using a polynomial of a specific degree. The polynomial degree is configured as a model hyperparameter, adjusted according to the complexity of the data [19]. In football, polynomial regression can be used to analyze shot trajectories, modeling the ball’s curve based on speed, shooting angle, and air resistance [14]. |
Table 3.
Clustering algorithms.
Table 3.
Clustering algorithms.
| Algorithm | Description |
|---|---|
| Hierarchical clustering analysis (HCA) | This algorithm organizes data objects into a tree-like structure called a dendrogram, where clusters are formed based on their level of similarity. This method is beneficial for understanding relationships between data points and does not require a predefined number of clusters [20]. In football analytics, HCA has been applied to group teams based on playing styles [21]. |
| K-means clustering | This algorithm partitions data based on feature similarity, dividing the dataset into k non-overlapping clusters. Each cluster is represented by its centroid, and data points are assigned to the nearest centroid based on distance metrics [22]. Football analytics can be applied to group players based on performance metrics, helping coaches identify similar playing styles across different leagues [23]. |
| Density-based spatial clustering of applications with noise (DBSCAN) | DBSCAN identifies high-density regions separated by areas of low density, where density is defined based on the number of points within a specified radius. Unlike K-means, DBSCAN does not require a predefined number of clusters and is effective in detecting arbitrary-shaped clusters and noise [22]. This makes it particularly useful in spatial clustering applications, such as identifying player movement patterns on a football field [24]. |
| Gaussian mixture models (GMMs) | This technique is based on probability density estimation, assuming that data points are generated from a mixture of multiple Gaussian distributions, each with its mean and variance. GMM provides flexibility in clustering applications where data may belong to multiple overlapping groups [25]. In football, GMM has been used to characterize player performance by clustering athletes based on various performance metrics, thereby aiding in talent identification and team composition [26]. |
Table 4.
Association algorithms.
Table 4.
Association algorithms.
| Algorithm | Description |
|---|---|
| Apriori algorithm | The Apriori algorithm was developed to extract association rules from databases by identifying co-occurrence patterns among frequent elements [27]. In football analytics, this approach is applied in expected goals (xG) models, which estimate the probability of a shot resulting in a goal based on variables such as shot position and goalkeeper location [28]. |
2.1.3. Semi-Supervised Learning
Semi-supervised learning is an approach that combines labeled and unlabeled data during the training process, enabling the model to leverage available information more efficiently. Using a limited amount of labeled data alongside a large volume of unlabeled data improves model performance without requiring a fully labeled dataset. This makes it a cost-effective alternative in terms of computational resources and manual annotation, particularly in domains where data labeling is expensive or labor-intensive. It is commonly applied in fields such as medical diagnosis, where a small set of labeled data is supplemented with unlabeled data to improve model precision [8]. The main techniques used in semi-supervised learning can be categorized into three groups (see Figure 3): (i) self-training, (ii) co-training, and (iii) label propagation, which are described in Table 6.
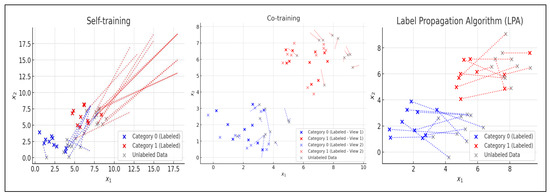
Figure 3.
Example of application of semi-supervised learning techniques.
2.1.4. Reinforcement Learning
Reinforcement learning is based on the interaction between a model and its environment, where the model makes decisions and receives rewards or penalties based on its performance. It is particularly suited for sequential decision-making problems, such as robotic control and the development of game agents, where actions directly impact the environment. The model adjusts its behavior through continuous feedback to optimize its long-term strategy [9]. Figure 4 shows the main reinforcement learning techniques: (i) Q-learning, (ii) policy gradient, and (iii) actor-critic, detailed in Table 7.
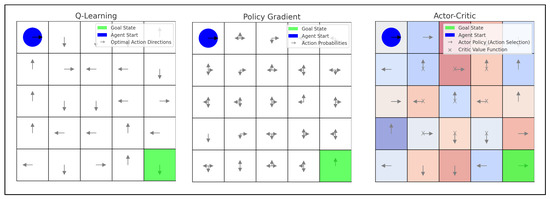
Figure 4.
Example of application of reinforcement learning techniques.
2.1.5. Deep Learning vs. Neural Networks
Deep learning: It is a subset of ML that stands out for its ability to learn from large volumes of data autonomously. Unlike traditional ML approaches, deep learning automates much of the feature extraction process, thereby minimizing the need for manual intervention. Its scalability and ability to process large datasets make it particularly effective for analyzing unstructured data, which accounts for over 80% of the data generated within an organization. By detecting complex patterns, deep learning models can accurately classify data, enhancing performance in tasks such as image recognition, natural language processing, and predictive modeling in dynamic environments [29]. In football analytics, deep learning has been applied to analyze player movements and tactical behaviors. For instance, with high accuracy, deep-learning-based models have been utilized to recognize football-specific activities such as jogging, sprinting, passing, shooting, and jumping, demonstrating their effectiveness in performance analysis and tactical decision-making [30].
Table 5.
Dimensionality reduction algorithms.
Table 5.
Dimensionality reduction algorithms.
| Algorithm | Description |
|---|---|
| Principal component analysis (PCA) | PCA transforms the original dataset into a new set of variables called principal components, which are linear combinations of the original features. These components are ordered so that the first ones capture the most variance in the data, allowing for dimensionality reduction while retaining essential information [13]. In football analytics, PCA analyzes team performance, grouping teams with similar playing styles based on multiple metrics [31]. |
| Linear discriminant analysis (LDA) | LDA also reduces dimensionality but differs from PCA by preserving class labels, maximizing the separation between predefined categories. It finds linear combinations of features that best distinguish different groups, making it useful for classification tasks [13]. In football, LDA could classify players into predefined roles based on their performance metrics, aiding scouting and tactical analysis [32]. |
Neural networks: They are a fundamental machine learning component, particularly in deep learning. These structures are inspired by the functioning of the human brain, where neurons communicate through electrical signals. A typical neural network consists of multiple layers of nodes: an input layer, one or more hidden layers, and an output layer. A network containing more than three layers, including input and output, is classified as a deep learning model [29]. In football analytics, neural networks have been applied to analyze and predict player performance. For instance, a predictive system has been developed to determine a team’s starting lineup using artificial neural networks that evaluate various performance metrics, such as passes, goals, and fouls. This approach optimizes player selection and enhances team strategies [33]. Table 8 presents an overview of the most widely used types of neural networks in modern applications.
Table 6.
Semi-supervised algorithms.
Table 6.
Semi-supervised algorithms.
| Algorithm | Description |
|---|---|
| Self-training | It is a semi-supervised learning technique that begins with a model trained on a small labeled dataset. The model then predicts labels for unlabeled data and incorporates the most confident predictions into the training set. This iterative process continues until the model converges, improving classification accuracy without requiring large volumes of labeled data [34]. In football, this method can be applied in video analysis to identify key match patterns, thereby optimizing tactical decisions and player performance [14]. |
| Co-training | It leverages multiple views or representations of the data by training separate models on different feature subsets. These models collaborate to predict labels for the unlabeled data, and instances where predictions align are confidently added to the labeled dataset. This iterative process enhances model robustness and generalization ability [35]. Co-training could help classify player roles in football by combining physical attributes and tactical movement data to refine positional analysis [14]. |
| Label propagation algorithm (LPA) | LPA is an iterative learning method that assigns labels to unlabeled data by propagating known labels through the dataset. This approach leverages the data structure to infer classifications without requiring extensive labeled samples [36]. Label propagation could categorize players into tactical roles based on inferred relationships between performance metrics [14]. |
2.2. Areas of Application of Machine Learning in Football
The areas of interest are described below:
2.2.1. Match Outcome
The outcome of a match reflects a series of characteristics that can be analyzed to predict future encounters and their possible scores. Metrics and feature selections are employed to improve the accuracy of football match predictions. Factors such as a team’s historical data, the difference between goals scored and conceded in previous matches, home or away performance, ball possession, and the individual performance of each player are some of the characteristics that directly influence match prediction. Additionally, expert opinions based on knowledge and experience enhance the accuracy of ML models in predicting match outcomes [37].
Table 7.
Reinforcement learning.
Table 7.
Reinforcement learning.
| Algorithm | Description |
|---|---|
| Q-learning | It is a reinforcement learning method that identifies the optimal action in each state without requiring a model of the environment. It uses a Q-value table to estimate future rewards for different actions, allowing the agent to learn autonomously through exploration and feedback [38]. This approach has been applied in football to optimize player decision-making in simulations, improving offensive and defensive strategies [39]. |
| Policy gradient | This algorithm directly adjusts the agent’s policy to maximize expected performance without requiring prior knowledge of the environment model. It optimizes action selection through gradient-based updates, enabling more stable learning in complex environments [40]. In football, this technique has been applied in simulations to train agents that learn advanced tactics and dynamic game strategies [39]. |
| Actor-critic | This method combines policy gradient and value-based learning through two components: the actor, which selects actions, and the critic, which evaluates the quality of these actions to refine the agent’s strategy [41]. The actor-critic method has been used in football simulations to develop agents that balance exploring new strategies and exploiting learned tactics, optimizing performance in simulated matches [39]. |
Table 8.
Most widely used neural network types.
Table 8.
Most widely used neural network types.
| Algorithm | Description |
|---|---|
| Artificial neural networks (ANNs) | Used for regression and classification tasks, ANNs consist of interconnected layers of nodes that process and transform input data to make predictions or classifications [22]. |
| Convolutional neural networks (CNNs) | Employed in computer vision, CNNs utilize convolutional layers to extract hierarchical spatial features, making them ideal for tasks such as object recognition and image classification [22]. |
| Recurrent neural networks (RNNs) | Designed for sequential data processing, RNNs maintain internal memory states to analyze time-series data, making them effective for applications such as speech recognition and financial forecasting [22]. |
| Generative adversarial networks (GANs) | Used for generating realistic data, GANs consist of two neural networks—a generator and a discriminator—that compete against each other to improve data synthesis capabilities. They are widely applied in image generation, style transfer, and data augmentation [29]. |
| Autoencoders | Employed for data compression and reconstruction, autoencoders learn to encode input data into a lower-dimensional representation and then reconstruct it, often used for anomaly detection and feature extraction [29]. |
2.2.2. Winning Prediction
Football teams have a common goal when facing a match: winning. Therefore, predicting not only a single game but also more ambitious objectives, such as becoming season champions, is of great interest when combined with ML techniques. Models based on player and team positioning, as well as physiological characteristics such as player workload per minute, distance covered, and acceleration, can achieve high accuracy in predicting victories [42].
2.2.3. Player’s Position
The challenges that arise in a match change suddenly from minute to minute, making the positioning of players on the field a crucial aspect of the game. Information such as the position and direction of the ball and the player’s orientation and speed can help predict each player’s position on a team, both on the horizontal and vertical axes. This approach can be applied in real time during a match to verify whether a player or group of players is following the tactical guidelines established by the coach. If not, the coach and players can adjust tactical and positional aspects to respond effectively to the challenges arising in the match [43].
2.2.4. Player’s Trajectory
Analyzing the trajectories of players throughout a match allows for an evaluation of their performance and effectiveness on the field. These trajectories can identify movement patterns in offense and defense and analyze how players respond to the positions of the ball and their opponents. This information is valuable for generating realistic defensive trajectories that adapt to the movements of offensive players and the ball’s location, optimizing containment and anticipation strategies in real time. This type of analysis helps to better understand the dynamics of the game and make tactical adjustments during the match [44,45].
2.2.5. Game Actions
Various game actions can influence a player’s performance, a team’s effectiveness, and even the match outcome. Actions such as passing, dribbling, shooting, and penalties can be optimized using ML. For example, the sequence of ball possession and passes can be assessed by calculating the difference between the expected reward of the possession sequence before and after each pass. Furthermore, each sequence of ball possession is labeled with its expected reward based on whether the sequence results in a shot and its expected goal value. This methodology allows for a practical assessment of passes, reflecting their anticipated impact on the score [46].
2.2.6. Player and Team Behavior
Behavior, coordination, and team alignment are fundamental for evaluating and optimizing collective and individual player performance. Observing formations and positions on the field enables the study of both group and personal behavior, including the analysis of distances and distribution among players and the number of players in each area of the field, as well as the direction, speed, and acceleration of their movements. This information is crucial for understanding team dynamics, optimizing alignment, and adjusting game strategies based on each player’s specific behaviors and capabilities and the team as a whole [47].
2.2.7. Player Performance
Evaluating a player’s performance to determine their value to the team can be based on a detailed analysis of their characteristics, organized into distinct attributes. Skills such as passing, shooting, ball control, and overall technique are considered technical aspects of the game. Regarding mental attributes, factors such as determination, concentration, decision-making ability, and game vision are evaluated. On the physical level, aspects such as speed, endurance, strength, and agility are assessed, which are crucial for on-field performance. These attributes provide a comprehensive understanding of each player’s potential value, tailored to the demands of their position [48].
2.2.8. Team Performance
A team’s performance on the field depends on multiple factors, including playing style, formation, and match results. A strategic plan that considers both offensive and defensive aspects is crucial, utilizing metrics such as xG to guide the tactical approach. Predicting the success of shots and passes, based on location and other contextual factors, allows the team to adjust their decisions in real time, optimizing collective performance. These tactics aim to improve efficiency in both attack and defense and enhance decision-making to respond swiftly and precisely to the match’s dynamics [49].
2.3. Examples of Real-World Implementations
Below are some real-world implementations of artificial intelligence tools used in football:
2.3.1. TacticAI
TacticAI is a system that functions as an AI-powered tactical football assistant, developed and evaluated in close collaboration with experts from Liverpool FC. This assistant supports football experts (humans) in the analysis of set-piece plays, especially corner kicks, using deep learning models, providing useful, realistic, and accurate tactical suggestions [50,51].
2.3.2. Playermaker
Playermaker is a company that provides the first athlete performance monitoring system designed for coaches and sports scientists. It has successfully passed the FIFA Innovation Programme challenge and obtained the FIFA Electronic Performance Tracking Systems quality certification. This system uses AI-powered shoe trackers to provide insights into technical, tactical, and physical performance. The company also offers several products, including PLAYERMAKER 2.0 and CITYPLAY. The latter product provides personalized insights, advice, and recommendations based on the performance of Manchester City professionals [52,53].
2.3.3. Stats Perform
Stats Perform is a global leader in sports AI. Its core sports AI models are used in over 200 software modules, enabling the world’s leading sports broadcasters, media outlets, applications, leagues, federations, betting houses, and teams to win audiences, customers, and trophies. It has proprietary sports data in the petabyte range and ML-driven analytics for leagues such as the Premier League (England), LaLiga (Spain), and more [54].
2.3.4. Beyond Stats
Beyond Stats is a platform that uses Microsoft AI to provide advanced analytics on player performance. The data is managed by business intelligence experts and football analysts at LaLiGA (Spain), who employ ML and AI capabilities enabled by Microsoft Azure. This project is the result of a partnership between LaLiga and Microsoft [55].
3. Related Work
The application of ML techniques in professional football has gained increasing attention in the scientific community, with use cases ranging from match outcome prediction to tactical behavior analysis and the evaluation of player and team performance. Previous studies have made significant contributions to the development of predictive models, the use of spatiotemporal data, and the creation of metrics to understand both individual and collective behavior.
In general, existing research has successfully addressed areas such as match outcome prediction, leveraging historical data, team statistics, and individual player performance [37]. Additionally, season-level victory prediction has incorporated positional and physiological indicators [42]. From a tactical perspective, studies have examined player positioning [43] and trajectory analysis [44,45], enabling real-time evaluation of tactical compliance. Game actions, such as passing and shooting, have been modeled using expected reward estimations [46]. Team behavior has been analyzed through formations and movement coordination [47], while individual player performance has been evaluated using technical attributes [48] and psychological and physical traits [49]. Other research works in the literature reviewed present a limited analysis or are outdated. For instance, in [56], the authors review only 66 articles from 2018 to 2023, focusing particularly on the problem of evaluating and selecting players who fit football clubs. Likewise, the authors in [57] emphasize the potential use of data mining concepts, techniques, and tools to improve the systematic review process in the field of football performance between 2012 and 2019.
Building upon these foundations, this study proposes a more structured and multi-dimensional perspective. An exhaustive systematic mapping was conducted, analyzing 172 articles—one of the most extensive reviews in this field to date. Unlike previous studies, which often focus on specific tasks or narrower scopes—such as match outcome prediction limited to single leagues and without linking to broader tactical contexts [37], performance analysis that remains descriptive or restricted to selected metrics [48], or event-centric visual tools designed for exploratory purposes without categorial or systematic evaluation [58]—our work offers a more integrative and updated view.
For instance, Bunker and Susnjak’s comprehensive review [37] predominantly examines predictive accuracy across sports but identifies a lack of benchmark datasets and does not classify models by application area. Similarly, Yiğit et al. [48] focus on player valuation using ML but without considering tactical behavior or team-level performance. In another example, Delibas et al. [58] introduce an interactive analytics framework for soccer data, yet their work is primarily tool-oriented and confined to exploratory visual analysis. In contrast, our review categorizes ML techniques according to football-specific application areas, systematically mapping techniques to challenges and linking them to application contexts. This allows us to identify clearer patterns and trends across domains. Moreover, visual analytics tools such as Power BI were integrated to enhance the interpretation of findings. This strategy not only offers a comprehensive view of the current state of the art but also provides researchers and practitioners with a concrete guide for selecting ML models according to the application context.
4. Methodology
The methodology adopted in this paper consists of three stages: (i) planning, (ii) conducting, and (iii) reporting. Figure 5 shows the general diagram of these processes.
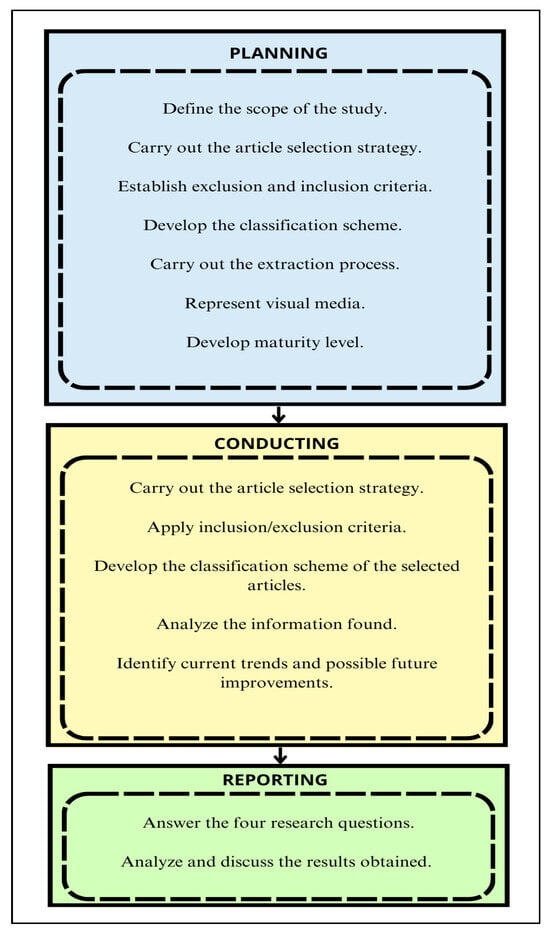
Figure 5.
Flow process and tasks of the systematic study, based on [59].
4.1. Planning
This paper adopts a quantitative approach as it collected, classified, and graphically represented information about using ML techniques to address specific areas in football. Four tasks were carried out during the planning stage to achieve the objectives outlined in this paper [59].
4.1.1. Scope of the Background to the Study
The research questions in this paper are described below:
- RQ1 —What specific aspects, techniques, and ML algorithms were found regarding the performance of players and teams?Identify the specific aspects related to player and team performance and subsequently link them to the ML techniques and algorithms.
- RQ2—What specific aspects, techniques, and ML algorithms were found regarding the prediction of outcomes?Identify the specific aspects related to predicting match outcomes and subsequently link them with the applied ML techniques and algorithms.
- RQ3—What is the availability of the datasets employed by the reported ML techniques?Having information on the availability of the datasets used in the research facilitates the organization of these datasets in accessible repositories, promoting their use by those who need them and enhancing future research.
- RQ4—What is the level of maturity of the reported ML techniques?The classification of the existing literature enables the assignment of a level of maturity to the reported ML techniques, allowing for the identification of their trends and limitations in this field. This information can contribute to the state of the art and serve as a basis for future studies.
4.1.2. Article Search Strategy
The database used for the study was Scopus as it encompasses a broad range of disciplines, enabling researchers to access relevant information across multiple fields of knowledge. Moreover, the publications in its repository undergo a rigorous selection process, ensuring that they meet high scientific quality standards. On this platform, a search string was designed using keywords such as “Machine Learning” and “Football” to encompass as much available information as possible. Figure 6 shows the final search string obtained.

Figure 6.
Search string for article search strategy.
Subsequently, an automated Scopus filter was used to discard information that did not contribute to the areas of interest and that could divert the research towards other unrelated aspects. The automated filters applied were as follows:
- Time range: The defined time range was from 2019 to 2024 to include recent and updated studies.
- Document type: Conferences and articles were selected to offer relevant and up-to-date information.
- Field of study: Certain fields of study were limited to ensure that the work remained consistent with the selected topic. These fields were Computer Science, Engineering, Mathematics, Decision Sciences, Business Management and Accounting, Economics, Econometrics, and Finance.
- Language: Only studies in English were included as it is considered the universal language and widely used for disseminating scientific knowledge.
Finally, the obtained results yielded 458 articles related to the study topic.
4.1.3. Inclusion and Exclusion Procedure
Inclusion and exclusion criteria were manually applied, so specific decisions were made to filter and determine an article’s inclusion or exclusion. These criteria were based on Figure 7, illustrating the decision-making process. From the 458 contributions obtained automatically, the aim is to select the documents that meet two key questions: Does the document address the use of ML applied to soccer? and Does the document address performance and match prediction? If the documents meet these two indicators, the paper is included for the subsequent coding process. In cases where the article’s content is unclear, a review and debate process will be carried out between the authors to determine its inclusion or exclusion. Finally, if the paper does not address either of these questions or only partially addresses one, it will be excluded from the study. This process was initially carried out using the title and abstract of the studies, using the CADIMA web application.
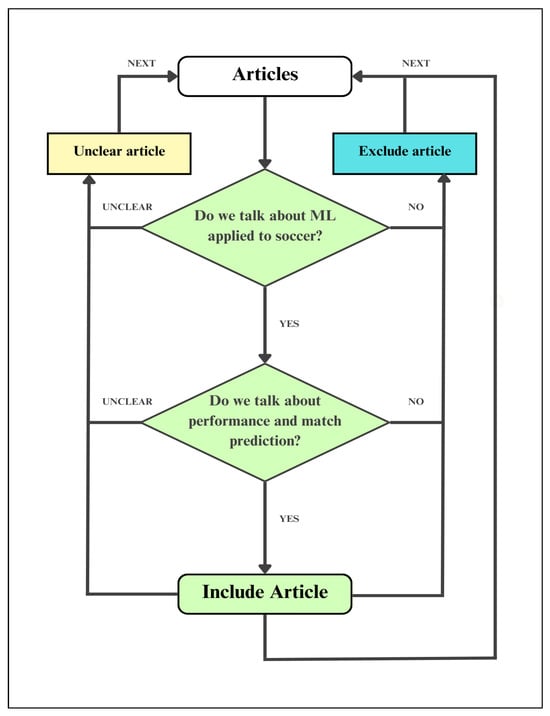
Figure 7.
Decision tree for the manual selection of items, based on [59].
4.1.4. Cadima
On this website, a significant portion of the research process was conducted, beginning with the primary phase, which involved the manual selection of studies based on their titles and abstracts, applying the previously described inclusion and exclusion criteria. Subsequently, the preliminary process for developing the classification scheme and data extraction was carried out in the secondary phase. These phases are described below:
Primary Phase
In the first phase, the authors individually reviewed article Titles and Abstracts, classifying them as included, unclear, or excluded. The secondary phase identified articles categorized as surveys and reviews for further analysis. Any inconsistencies were resolved through discussions. Ultimately, 209 articles were selected for the next stage.
Secondary Phase
In the second phase, the authors conducted a detailed review of 10 selected articles from the 209 identified in the primary phase, focusing on surveys and reviews. Key sections such as the Title, Abstract, and Conclusions were analyzed to extract relevant information for structuring the classification scheme and data extraction. Additional parts, like the Introduction, Motivation, and Background, were reviewed to ensure these sections were clear. The authors then recommended including all 209 articles in the coding process to enhance data extraction and ensure valuable studies were not excluded. After completing both phases, all 209 articles were ready for coding.
4.1.5. Classification and Data Extraction Scheme
This scheme is a tool designed to extract data from each selected article in an organized manner, allowing for their classification and facilitating the acquisition of knowledge useful in answering the four research questions posed above [59]. The following aspects are considered for the development of the scheme:
- Initial section considerations: The ML techniques reviewed in this paper’s Introduction, Motivation, and Background sections serve as a basis for linking the areas reported in the secondary phase. In this context, each area can be associated with the corresponding ML technique, and it can then be classified within the two main approaches of the study. It is also possible to break down each technique into sets of algorithms that compose it, allowing for a precise classification and avoiding the omission of data that could contribute significantly to the present study.
- Articles from the secondary phase: The 10 articles analyzed in the secondary phase provided areas of interest related to the two approaches of the study: (i) the prediction of outcomes and (ii) the performance of players and teams—for example, the result of a match based on selected metrics or the analysis of players’ trajectories. The reviewed articles are detailed below in Table 9. This table details the articles considered in the secondary phase of the manual inclusion and exclusion process. It includes an identifier (ID assigned by CADIMA), which will be used to identify and cite the articles in the following sections, the title of the article, the authors, and its classification as a survey or review. Most articles correspond to reviews as they analyze and synthesize previous literature. Only one article (ID: 332) is classified as a survey, as it presents a collection of specific applications of modern ML techniques.
Table 9. Articles from the secondary phase.The classification scheme shown in Figure 8 was developed with these two considerations.
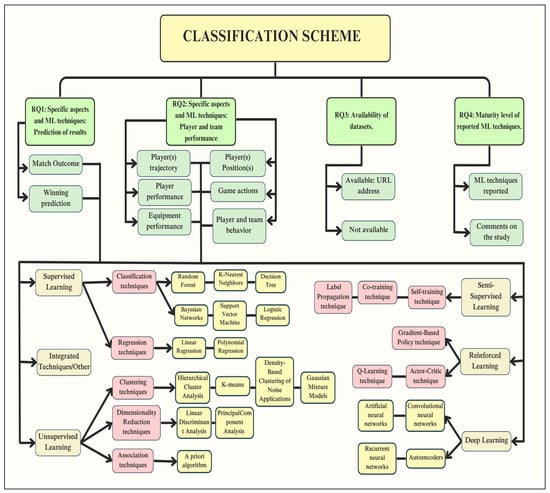 Figure 8. Classification and data extraction scheme, based on [59].
4.2. Conducting
The conducting stage represents the necessary process to answer the four research questions. This involves searching for articles using the search string defined in Scopus and applying automated and manual filters. Subsequently, the selected articles are coded and processed using the classification and data extraction scheme. As of 31 May 2024, 458 initial contributions were identified. After applying the automated and manual filters, the number was reduced to 209 articles. Finally, through coding and using the classification and data extraction scheme, 172 articles were obtained for analysis. Additionally, the articles were classified according to the ML technique used and the availability of their data source. In cases where the information in these sections was unclear, other parts of the document, such as the Introduction and Subsections, were reviewed. Any inconsistencies found during the process were resolved in planned meetings between the tutor and the student.
The list of the 172 selected articles is presented in GitHub repository, which, given its extensive length, can be consulted in [60]. As in Table 9, a unique identifier is included to cite the documents in the results analysis developed in the next section. Once the coding process is completed, the collected information is stored in CADIMA. Subsequently, the database is downloaded in Excel spreadsheet format, preparing it for data processing, presentation, and analysis. The document named “DataExtractionFinal” can be consulted in the GitHub repository [60].
4.3. Reporting
The final stage, corresponding to reporting, answers the four research questions. The information is first processed in Excel and then presented through tables and charts created with Microsoft Power BI to display the data concisely and precisely to facilitate understanding. Additionally, the obtained results are discussed by analyzing the trends of the reported ML techniques and the areas of interest that may impact football clubs, among other aspects. All this information is included in Section 5, and the document with the data processing can be consulted in the GitHub repository: [60].
5. Results
5.1. RQ1—What Specific Aspects, Techniques, and ML Algorithms Were Found Regarding Player and Team Performance?
RQ1 aims to provide insights into the specific aspects, techniques, and ML algorithms related to player and team performance. Six applications of ML in football were considered in this case. These applications are (i) player’s position, (ii) player’s trajectory, (iii) game actions, (iv) player and team behavior, (v) player performance, and (vi) team performance.
5.1.1. Supervised Learning Techniques and Algorithms
Figure 9 shows the distribution of application areas that used supervised learning to address problems related to player or team performance. The graph reveals a wide distribution of articles covering one or more application areas. In total, 55 articles address the aforementioned applications, whose specific identifiers (AID) and algorithms used are detailed in the “DataProcessingFinal” Excel file on the “ML Algorithms Table” section (see GitHub repository [60]), classified according to their techniques. These article AID’s are [6, 15, 51, 52, 80, 86, 87, 91, 103, 110, 121, 124, 132, 135, 155, 160, 179, 192, 204, 212, 228, 252, 255, 259, 260, 266, 271, 273, 292, 301, 315, 318, 322, 329, 345, 348, 374, 386, 392, 394, 395, 404, 406, 408, 410, 413, 419, 423, 441, 455]. Player performance (23.64%) and team performance (16.36%) are the most frequently addressed applications in the reviewed articles. Metrics such as expected goals (reviewed in AID15 [61]) and player profiles including name, age, height, club, international reputation, and position (reviewed in AID260 [62]) stand out as ideal cases for supervised learning tasks, where data are labeled for analysis, interpretation, and prediction.
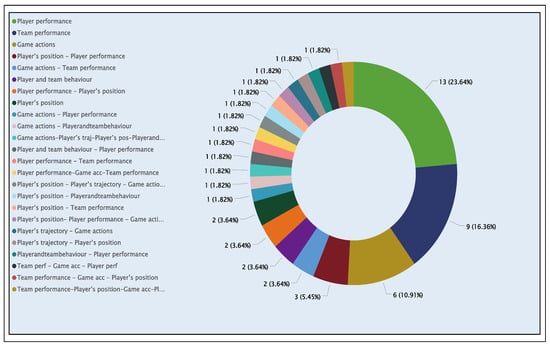
Figure 9.
Classification of articles by application areas using supervised learning.
Figure 10 presents the distribution of articles according to the two main supervised learning techniques: Classification and Regression. Classification techniques dominate studies aimed at improving player or team performance. These techniques allow data to be categorised into specific classes, which helps evaluate performance and identify patterns in football.
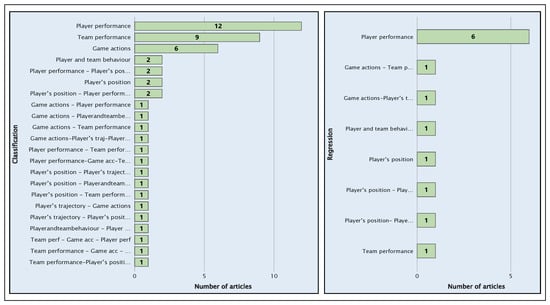
Figure 10.
Distribution of articles using classification and regression techniques.
Supervised learning algorithms used in the analyzed studies, highlighting the frequent use of robust methods like decision trees, random forest, SVM, KNN, regression trees, and multivariate regression. A notable case is AID315 [48], which focuses on assigning a financial value to players based on their performance, evaluating a variety of features:
- Technical Attributes: Passing, shooting, ball control, and technique.
- Mental Attributes: Determination, concentration, decision-making, and vision.
- Physical Attributes: Speed and stamina.
5.1.2. Unsupervised Learning Techniques and Algorithms
Figure 11 shows the distribution of application areas that use unsupervised learning to solve problems related to player or team performance. The graph shows various articles that address one or more application areas. In total, 12 articles deal with the applications mentioned above. Their specific identifiers (AID) and the algorithms used are detailed in the “DataProcessingFinal” Excel file on “ML Algorithms Table” section (see GitHub repository [60]), classified according to their techniques. These articles’ AID’s are [113, 131, 212, 213, 266, 301, 310, 318, 375, 388, 395, 408].
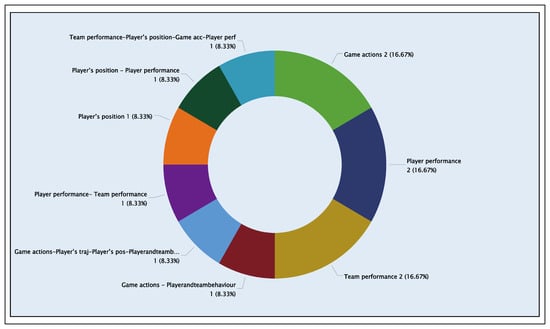
Figure 11.
Classification of articles by application areas that used unsupervised learning.
Figure 12 highlights the number of articles that use clustering techniques to enhance the aforementioned applications. Similarly, dimensionality reduction using PCA and LDA is used in solutions such as AID310 [63], which aims to improve equipment performance based on specific aspects, such as the following:
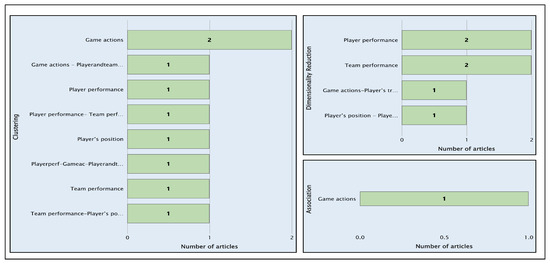
Figure 12.
Distribution of articles in clustering, dimensionality reduction, and association techniques.
- Maintain an upright position with both feet on the ground.
- Walk or move on foot at a moderate speed (approximately 5.5 km/h).
- Run or move on foot at a brisk speed (>8 km/h).
5.1.3. Semi-Supervised and Reinforcement Learning Techniques
In the case of semi-supervised learning, no techniques or algorithms were found that enhanced these areas of application. In contrast, reinforcement learning identified two articles: (i) AID238 [64], focused on team performance (50%); (ii) AID293 [49], which addresses player performance, game actions, player and team behavior, and player trajectory (50%). Both encompass the three main ML techniques in reinforcement learning: Q-learning, policy gradient, and actor-critic, as shown in Figure 13.
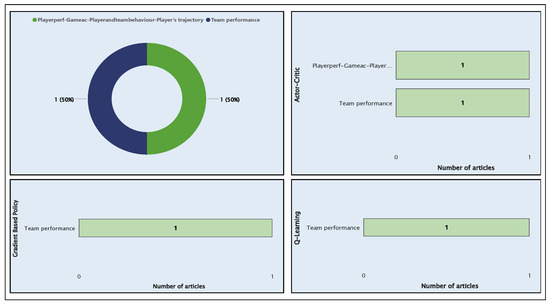
Figure 13.
Classification of articles by application areas using reinforcement learning and the techniques used.
AID293 analyzed two key aspects:
- Game Sequences: Evaluate how an action changes affect the sequence’s outcome.
- Game Criteria: Facilitate iteration and improvement of game strategies.
These areas are enhanced using policy gradient, Q-learning, and actor-critic algorithms, along with the algorithm used by AID238 [64], as shown in Figure 14.
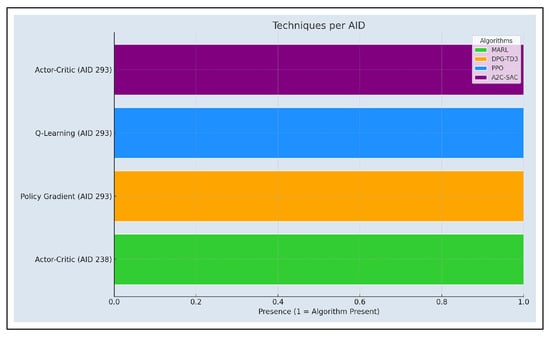
Figure 14.
Distribution of algorithms in selected articles using actor-critic, q-learning, and policy gradient techniques.
5.1.4. Deep Learning Techniques and Algorithms
Figure 15 shows the distribution of application areas that use deep learning to solve problems related to player or team performance. The graph shows many articles covering one or more application areas. In total, 32 articles are related to the six applications previously mentioned. Their specific identifiers (AID) and the algorithms used are detailed in the “DataProcessingFinal” Excel file on the “ML Algorithms Table” section (see GitHub repository [60]), classified according to their techniques. These articles’ AID’s are [16, 19, 21, 48, 49, 59, 64, 66, 86, 99, 208, 212, 213, 220, 238, 245, 265, 280, 293, 301, 302, 310, 345, 368, 375, 385, 386, 392, 394, 395, 404, 410, 443]. The most frequently addressed application areas using deep learning techniques and algorithms are player performance (21.75%), game actions (18.18%), and team performance (12.5%).
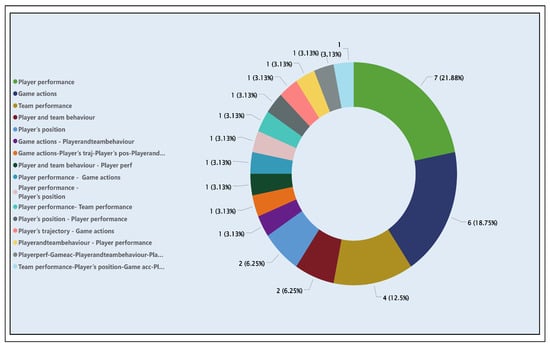
Figure 15.
Classification of articles by application areas using deep learning.
Figure 16 shows the extensive use of two standard deep learning techniques: (i) ANNs and (ii) CNNs. These techniques are highly useful in football-related classification problems, as well as in processing images and videos focused on player performance and game actions. Additionally, a less common technique—autoencoders—is also highlighted. Due to their data compression capabilities, autoencoders are helpful when working with large volumes of data, such as the wide variety of metrics used to evaluate team performance.
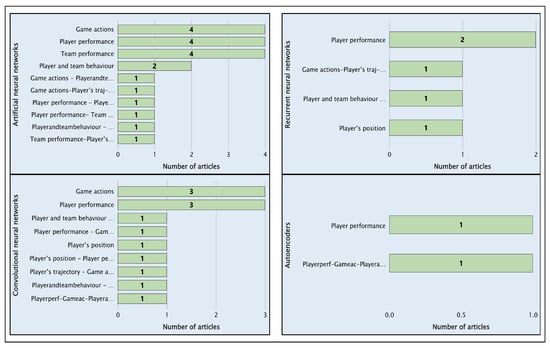
Figure 16.
Distribution of articles using artificial neural networks, convolutional neural networks, recurrent neural networks, and autoencoders.
5.1.5. Integrated/Other Techniques
Figure 17 shows the distribution of application areas that used integrated techniques from the previously mentioned learning methods or other techniques that combine multiple fields, such as data science. The graph indicates many articles covering one or more application areas. In total, 47 articles are related to the six previously mentioned applications, with their specific identifiers (AID) and algorithms shown in the “DataProcessingFinal” Excel file on the “ML Algorithms Table” section (see GitHub repository [60]), classified according to their techniques. These articles’ AID’s are [6, 15, 19, 20, 21, 37, 39, 40, 44, 49, 52, 74, 80, 91, 103, 124, 127, 160, 176, 190, 194, 204, 207, 212, 213, 228, 231, 238, 275, 281, 292, 298, 299, 315, 318, 322, 333, 374, 381, 392, 395, 404, 408, 410, 413, 432, 442]. The most frequently discussed application areas are player performance (23.4%) and game actions (17.02%). Next in line are team performance (12.77%) and player position (6.38%), all addressed using these combined models. A review of the “ML Algorithms Table” reveals one model that covers a large percentage of these solutions: extreme gradient boosting (XGBoost). This model is used in supervised learning problems, where training data predicts a target variable [65]. XGBoost implements a gradient boosting approach that iteratively combines multiple weak models (decision trees) into a single robust model. Its goal is to minimize the errors of previous models at each iteration, resulting in more accurate and efficient predictions [65].
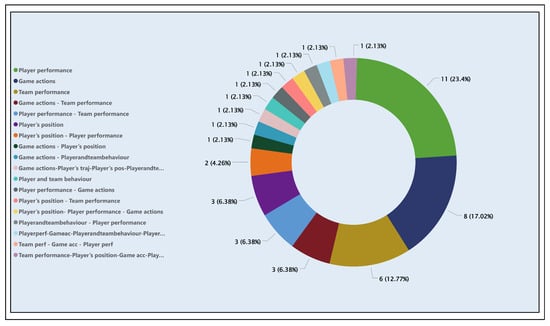
Figure 17.
Classification of articles by application areas using integrated/other techniques.
5.2. RQ2—What Specific Aspects, Techniques, and ML Algorithms Were Found Regarding Match Outcome Prediction?
The following sections present the collected information in a graphical format, classifying each application related to outcome prediction within the relevant ML areas. Additionally, key insights from certain documents that provide valuable knowledge on outcome prediction are highlighted.
5.2.1. Supervised Learning Techniques and Algorithms
Figure 18 displays the distribution of application areas that used supervised learning to address outcome prediction problems. The graph illustrates a broad distribution of articles spanning multiple application areas. In total, 65 articles cover the mentioned applications. Their specific identifiers (AID) and algorithms used are detailed in the “DataProcessingFinal” Excel file on the “ML Algorithms Table” section (see GitHub repository [60]), classified according to their techniques. These articles’ AID’s are [3, 8, 25, 36, 46, 47, 58, 67, 69, 77, 83, 95, 104, 109, 111, 112, 114, 120, 151, 152, 159, 162, 174, 182, 183, 185, 186, 198, 206, 210, 223, 232, 236, 241, 242, 246, 256, 261, 264, 267, 272, 282, 283, 302, 313, 314, 316, 324, 325, 360, 365, 376, 387, 425, 436, 438, 440, 447, 452, 456]. The two application areas related to outcome prediction account for 72.31% of the articles using supervised learning. Of this percentage, 47.69% corresponds to match outcome prediction and 24.62% to win prediction. The remaining 27.69% is distributed between these application areas, along with other previously reviewed areas related to player and team performance. This overview provides a comprehensive view of the potential interrelationships between the various applications in the field of football, highlighting how data analysis and ML can effectively address performance and outcome prediction in this sport.
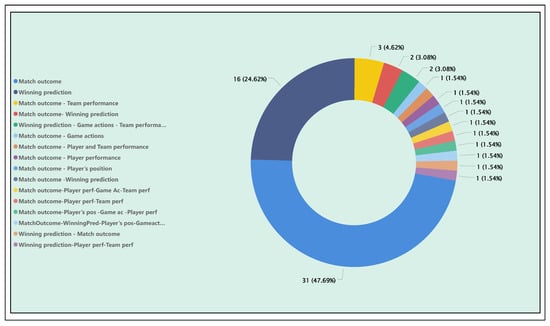
Figure 18.
Classification of articles by application areas using supervised learning.
Figure 19 presents the distribution of articles according to the two main supervised learning techniques: classification and regression. As can be seen, classification techniques predominate in studies aimed at predicting the outcome of a match. These techniques allow data to be categorized into specific classes, which helps evaluate patterns in football, such as predicting wins. On the other hand, the regression technique maintains an equal distribution across both application areas in the reviewed articles. Regression is instrumental in predicting wins as it enables the modeling of continuous relationships between variables, facilitating the estimation of numerical values related to match outcomes, such as the number of goals or shots on goal. Standard algorithms such as KNN, decision trees, and SVM are used to estimate match outcomes, as seen in AID232 [37], which applies various metrics to predict match outcomes throughout a season, specifically in the English Premier League (EPL) [37]. The metrics used include home attacking strength (HAS), home defensive strength (HDS), away attacking strength (AAS), away defensive strength (ADS), home shots on target (HST), away shots on target (AST), home corners (HC), away corners (AC), away red cards (ARC), home red cards (HRC), home yellow cards (HYC), home fouls (HF), and away fouls (AF). These metrics form a strong foundation for supervised ML models, allowing for objective evaluation of team strengths and weaknesses—both home and away—thus enhancing the accuracy of performance predictions throughout the season.
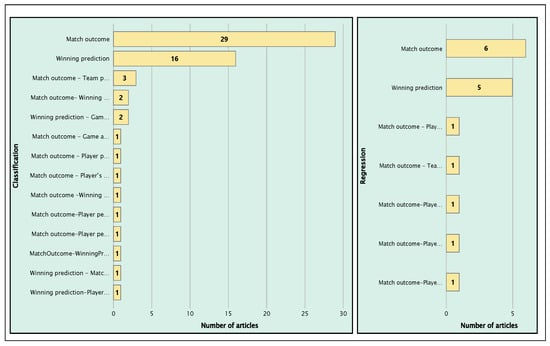
Figure 19.
Distribution of articles using classification and regression techniques.
5.2.2. Unsupervised Learning Techniques and Algorithms
Figure 20 and Figure 21 illustrate the distribution of application areas that used unsupervised learning and its techniques to address match outcome prediction problems. The graphs show a total of four articles covering the two application areas. Their specific identifiers (AID) and algorithms are detailed in Figure 22, categorized by technique. The four articles are distributed as follows: Match win prediction accounts for 50%, while the remaining 50% is distributed among applications related to player and team performance, such as game actions. AID198 ([66]) is an article that covers two unsupervised learning techniques: clustering and dimensionality reduction. AID246 ([67]) uses clustering algorithms, while articles AID272 ([68]) and AID313 ([69]) focus solely on dimensionality reduction. AID246 presents an interesting approach to predicting wins. It utilizes variables such as team past performance, FIFA ranking, and the number of goals scored and conceded [67]. External factors, such as weather, match location, and player fitness, are also taken into account. Ultimately, clustering algorithms, such as K-means, improved prediction accuracy by more than 55%.
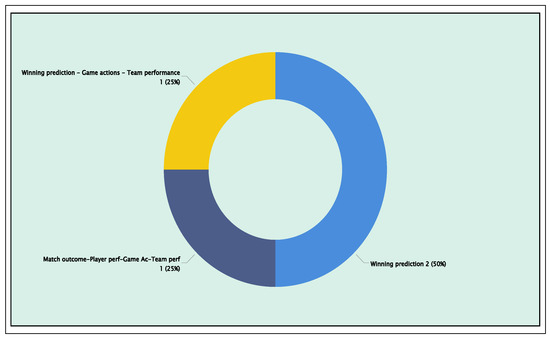
Figure 20.
Classification of articles by application areas using unsupervised learning.
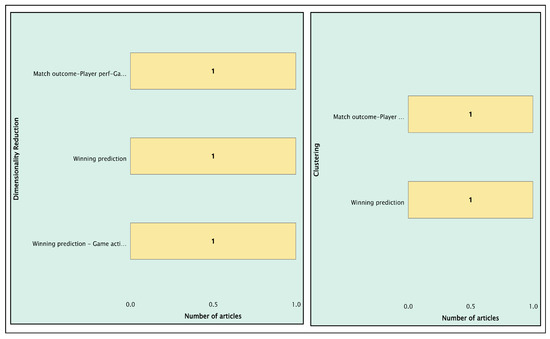
Figure 21.
Distribution of articles using dimensionality reduction and clustering techniques.
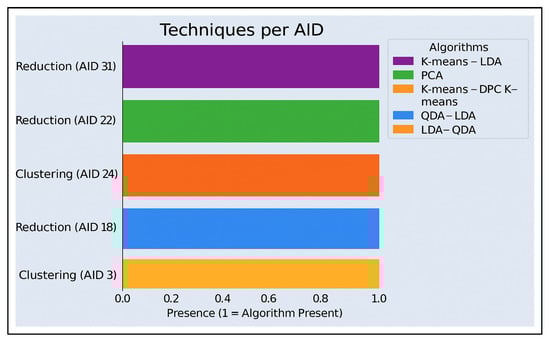
Figure 22.
Distribution of algorithms on selected items using clustering, dimensionality reduction, and association techniques.
5.2.3. Semi-Supervised and Reinforcement Learning Techniques
In the case of the use of semi-supervised learning, only one article was found (AID332 [44]) that covers the area of the result of a match in addition to the analysis of three application areas: (i) trajectory of player(s), (ii) game actions and (iii) the behavior of players and teams. The applied technique was co-training with the imitation learning algorithm, which was used to model players’ behavior and predict trajectories in game sequences, making it valuable for predicting the outcome of a match [44]. In contrast, reinforcement learning identified three articles, as shown in Figure 23. AID332, focusing on the match outcome along with application areas such as player trajectory and game actions (33.33%) [44], AID198, which addresses the outcome of a match along with player performance, game actions and team performance (33.33%) [66], and finally, AID126 with win prediction in conjunction with game actions (33.33%) [70].
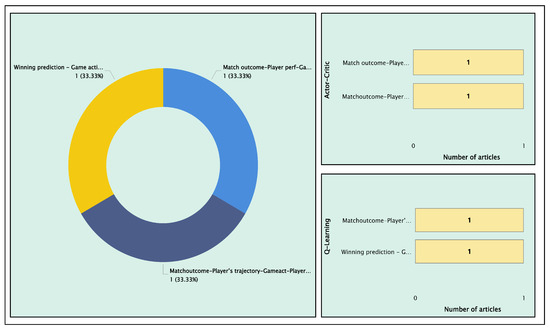
Figure 23.
Classification of articles by application areas using reinforcement learning and the techniques used.
5.2.4. Deep Learning Techniques and Algorithms
Figure 24 shows the distribution of application areas that used deep learning to enhance match outcome prediction. The graph displays a range of articles that cover both outcome prediction applications and some that also address areas related to player and team performance. In total, 22 articles cover these applications. Their specific identifiers (AID) and the algorithms used are detailed in the “DataProcessingFinal” Excel file on the “ML Algorithms Table” section (see GitHub repository [60]), classified according to their techniques. These articles’ AID’s are [57, 104, 114, 162, 186, 198, 201, 210, 230, 232, 249, 251, 256, 282, 312, 316, 324, 325, 332, 436, 447]. In this case, the match outcome (36.36%) was the most frequently addressed area using deep learning; similarly, the winning prediction accounted for 22.73% of the deep learning applications.
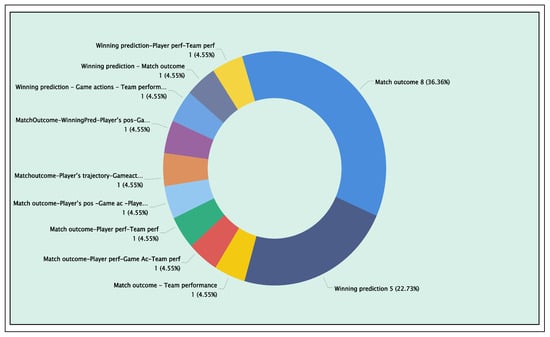
Figure 24.
Classification of articles by application areas using deep learning.
Figure 25 shows three standard techniques in deep learning: (i) ANNs, (ii) CNNs, and (iii) RNNs. Similarly, the absence of autoencoders for this approach is noticeable.
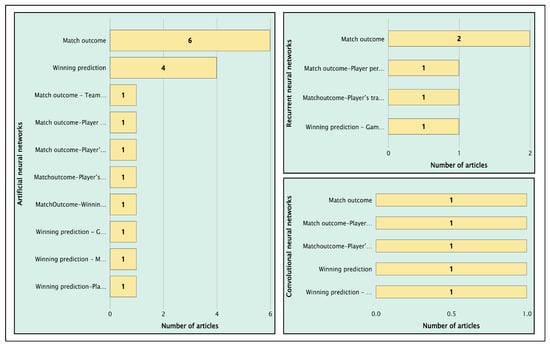
Figure 25.
Distribution of articles using artificial neural networks, convolutional neural networks, recurrent neural networks, and autoencoders.
In AID282 [71], ANN is used based on player and team performance data, allowing favorable results when predicting match outcomes—especially using stats from the last 15 min of the game [71]. However, the study also highlights a temporal bias, which may influence prediction accuracy. Using ANNs, an area under the curve (AUC) score of 0.847 was achieved, indicating a reasonably good prediction capability. This score suggests that the model can effectively distinguish between match outcomes based on the performance metrics used.
5.2.5. Integrated/Other Techniques
Figure 26 shows the distribution of application areas that used integrated techniques from previously mentioned learning approaches or other methods that combine multiple fields, such as data science. The graph shows many articles covering one or more application areas in combination with the two addressed in this section: (i) match outcome and (ii) winning prediction. In total, 44 articles are related to these applications. Their specific identifiers (AID) and algorithms used are listed in the “DataProcessingFinal” Excel file on the “ML Algorithms Table” section (see GitHub repository [60]), classified according to their techniques. These articles’ AID’s are [27, 47, 58, 67, 77, 83, 95, 111, 112, 114, 120, 126, 151, 159, 162, 174, 198, 201, 206, 210, 223, 236, 241, 242, 249, 267, 268, 272, 282, 283, 288, 313, 314, 316, 360, 365, 376, 402, 409, 411, 424, 425, 440, 451]. The most commonly addressed area is match outcome (40.91%), followed by winning prediction (27.27%), consistent with previous learning methods.
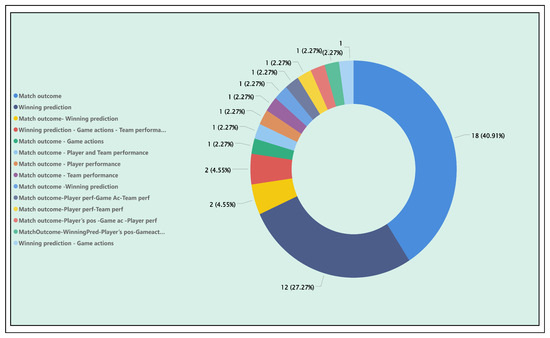
Figure 26.
Classification of articles by application areas using integrated/other techniques.
By reviewing the algorithms and techniques, it is clear that XGBoost once again plays a prominent role—this time in outcome prediction solutions. This highlights its strong capacity to support the application areas addressed in this study. Other boosting models, such as AdaBoost, emphasize the value of implementing ensemble models in ML, which improves prediction accuracy and robustness. In AID365 ([72]), we seek to efficiently predict the results of a football match, based on specific aspects such as: goals scored by the home and away teams, shots taken by the home and away teams, points of the home and away teams, various betting odds, winning and losing streaks of the home and away teams, and points difference between the teams. For this purpose, several models were used, including XGBoost, a boosting algorithm that improves accuracy by focusing on previous prediction errors. The results were training set accuracy: 86.9% and test set accuracy: 82.4%. The AID365 study concludes that ensemble learning models, such as XGBoost, can significantly improve prediction accuracy compared to traditional ML models. For instance, SVM achieved much lower accuracy on the test set (75.6%) and training set (66.0%).
5.3. RQ3—What Is the Availability of Datasets Used by the Reported ML Techniques?
This section presents the availability of datasets referenced in the reviewed literature, emphasizing those accessible through online URLs. Out of the 172 articles analyzed, only 42.44% (i.e., 73 articles) provide direct links to datasets. While this remains a minority, it nonetheless represents a meaningful contribution to the field, offering a foundation for future reproducibility and comparative studies. A detailed list of these 73 articles, including their associated AIDs and URLs to the dataset, can be found in the “ML Algorithms Table” section of the DataProcessingFinal Excel file (available in the GitHub repository [60]). Among the data sources referenced, two websites stand out for their recurrent use in data extraction, transformation, and knowledge generation across various application domains:
- Football-Data.co.uk: A website that provides historical match data, results, and statistics from various football leagues worldwide. It allows users to gather accurate information for analysis, predictions, or sports performance studies [73].
- Sofifa.com: A platform that compiles detailed attributes and player statistics based on the FIFA video game series. It provides data such as skill ratings, physical attributes, and performance metrics—useful for performance analysis, scouting processes, and ML research projects [74].
Limitations of Dataset Availability
Despite the relevance of the available datasets, several limitations must be acknowledged:
- Limited Accessibility: The majority (57.56%) of articles do not provide access to the datasets used, which restricts reproducibility and limits benchmarking efforts.
- Proprietary or Game-Based Data: A significant portion of the publicly available datasets (e.g., Sofifa) originates from video games rather than real-world measurements. This condition may lead to biases or reduced validity in certain types of scientific analysis.
- Data Completeness and Granularity: Public datasets often lack detailed contextual features (e.g., player psychological state, team tactics, or sensor data), which may limit their utility in advanced ML tasks such as behavioral prediction or fine-grained decision support.
5.4. RQ4—What Is the Maturity Level of the Reported ML Techniques?
Figure 27 shows a clear preference for supervised learning techniques, especially classification, which is used in 33.13% of the analyzed articles. This technique has become the most effective for tackling data classification problems in football contexts. It is followed by regression (8.66%), which, although less used, still plays a relevant role in specific quantitative analyses of performance and prediction. An interesting finding is that 28.66% of the articles use combined models or other approaches, such as XGBoost. Although less frequently, more advanced techniques, such as ANNs and CNNs, are also present. This suggests that while traditional techniques remain dominant, more complex models are gaining traction in the research community, indicating a shift toward models capable of handling large volumes of data in both performance analysis and match outcome prediction.
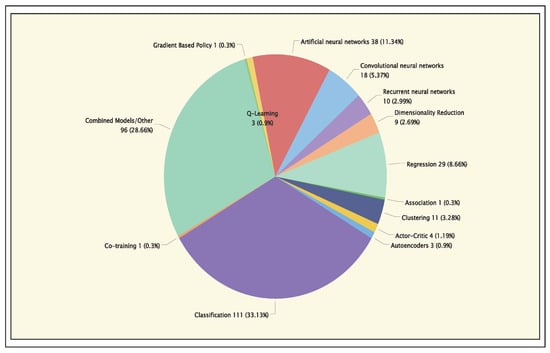
Figure 27.
Distribution of ML techniques across application areas.
Figure 28 presents two graphs showing the number of published articles that used classification and regression for the application areas discussed. Classification was the most used technique, peaking in 2022 with 26 published articles. From 2019 onward, the number of articles consistently increased, particularly in 2022 and 2023, highlighting the effectiveness of this approach for data classification and performance analysis in football. Regression shows moderate growth, with 10 articles published in 2023. Although less common than classification, it is growing steadily, especially in predicting results and analyzing player performance.
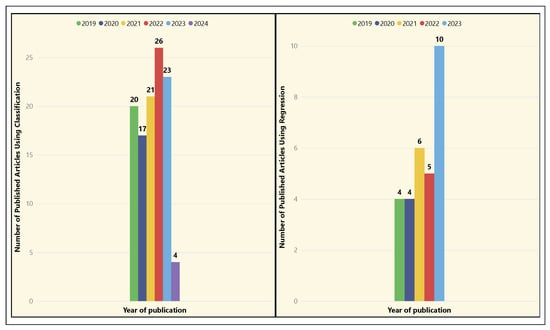
Figure 28.
Temporal distribution of ML techniques–classification and regression.
Figure 29 shows the number of published papers using combination models or other approaches for the aforementioned application areas. It highlights a significant increase in papers using combination models, peaking in 2022 and 2023 at 22 papers published yearly. This reflects a growing trend towards using hybrid approaches, such as XGBoost and other combination algorithm models, which offer advantages in improving prediction accuracy and efficiency. In 2019, the number of papers using combination models was 16, decreasing to 11 in 2020. However, since 2021, there has been a notable increase, with the number of publications rising from 21 in 2021 to 22 in 2022 and 2023. This trend is expected to continue or even intensify in 2024.
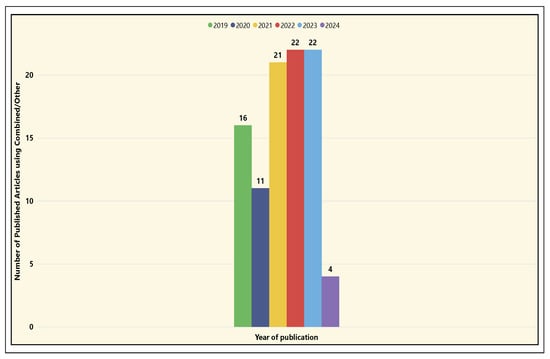
Figure 29.
Temporal distribution of ML techniques—combined models/other.
Figure 30 shows the number of published articles that used ANNs and CNNs. The use of ANNs increased significantly in 2021, with 14 articles published, reflecting a growing interest in applying neural networks to complex football data analysis problems. The use of CNNs remained more balanced, with three and four articles published in 2023 and 2024, respectively. Although there was a dip in 2020 (one article), interest in CNNs grew again in 2023 and 2024, especially in applications involving image and video processing, which are commonly used in player and team performance analysis.
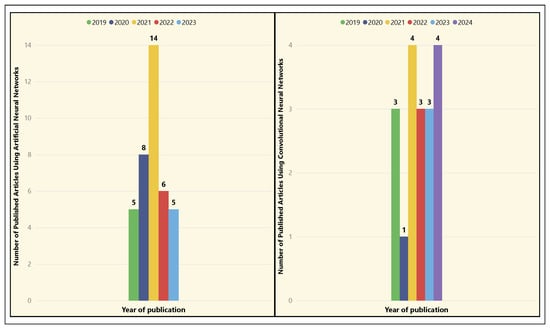
Figure 30.
Temporal distribution of ML techniques—ANNs and CNNs.
6. Discussion of Results
The analysis of the ML techniques and algorithms used in the application areas of player and team performance, as well as match outcome prediction, encompasses several aspects that promise to enhance the management of a professional soccer team. Figure 31 reflects the temporal analysis and shows an increase in the publication of articles from 2019 to 2024. In the first years, such as 2019 and 2020, the number of publications was more moderate, with 27 articles in 2019 and 22 in 2020. This reflects a slower start in research and a lower level of maturity in the use of ML techniques, with a more gradual development within the research community. The most interesting aspect is what happens in 2024, when research articles evolve toward more robust and complex models, such as CNNs and combined models like XGBoost, which require more in-depth and detailed analysis. It is worth noting that the present study conducted a systematic mapping process with a cutoff date of articles published up to March 2024.
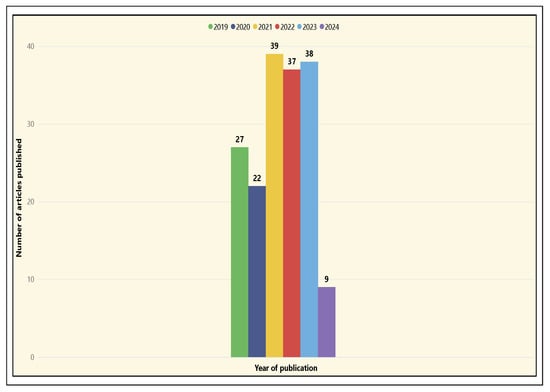
Figure 31.
Temporal distribution of selected articles in the application areas.
During the analysis of the obtained results, the coded articles that cover one or more application areas for player and team performance show a high use of ML techniques and algorithms in the following approaches: supervised learning (55 articles), deep learning (32 articles), and the use of integrated or other techniques (47 articles). On the other hand, the areas applied in the prediction of match results show a similar trend in the use of these ML techniques, with the following approaches: supervised learning (65 articles), deep learning (22 articles), and the use of integrated or other techniques (44 articles). This suggests that classical techniques are widely addressed in these applications. Subsequently, more modern and complex techniques, such as ANNs and combined models like XGBoost, are being enhanced to optimize the processes in a football match. There is no doubt that the six application areas related to team and player performance: player’s position, player’s trajectory, game actions, player and team behavior, player performance, team performance, and the two application areas in result prediction: match outcome and winning prediction are being enhanced with the improvements that this branch of AI can offer. Finally, it is argued that implementing these ML techniques in the aforementioned application areas presents several challenges. Below are some gaps identified during this study that require further attention and development in future research.
- Dataset Availability: The research conducted yielded 42.44% of articles that provide links to the dataset location. However, in some cases, the web pages provided do not provide full access to the data or are restricted or require a paid subscription. An example is AID67, which provides links to the web pages with the data repositories used, but access to the study information requires access restrictions and a paid subscription, creating gaps in the application of the aforementioned areas.
- Data Visualization Tools: The use of powerful visualization tools such as SoccerMap, as applied in articles such as AID49, AID385, and AID198, has been identified as enhancing the analysis and interpretation of data on team performance. However, these robust tools are not easily acquired, so more basic tools are implemented in most of the articles in the study. This suggests a challenge in applying improved visualization tools for more robust analysis.
- Data Acquisition Devices: For performance application areas, existing preprocessed data have been used as training and evaluation metrics for the proposed ML models. However, real-world data acquisition devices, such as wearable sensors, and their combination with ML algorithms can significantly improve the accuracy of classifying game actions, such as the penalty kicks covered in AID394.
In addition to the trends observed in the use of ML techniques, it is important to critically reflect on their effectiveness, limitations, and accuracy across different applications in professional football. Supervised learning methods, particularly ensemble techniques such as random forest and XGBoost, have demonstrated high accuracy rates in predicting match outcomes and player performance. For instance, studies like AID365 reported classification accuracies above 82% using XGBoost for predicting match results. These methods are popular due to their robustness and interpretability when compared to deep learning approaches. However, their performance is strongly dependent on the availability and quality of structured, historical data—a limiting factor for many clubs and organizations, especially in less documented leagues.
Deep learning techniques, including ANNs, CNNs, and RNNs, have demonstrated great potential for analyzing complex patterns such as player trajectories, tactical movements, or video-based data. Despite their modeling power, these techniques often require large volumes of labeled data, and high computational resources, and offer limited transparency in decision-making processes—a critical drawback in practical environments, such as coaching or real-time match analysis. Moreover, the lack of standardized datasets across studies makes it difficult to objectively benchmark their performance. However, its implementation in real-world match scenarios is still limited. The reviewed studies applying reinforcement learning are based on simulation environments, where strategic behaviors can be explored in controlled conditions. This makes practical deployment difficult as real-world football lacks the interactive and replicable environments necessary to apply and test these algorithms effectively.
Another persistent challenge identified throughout the reviewed studies is the lack of standardized, publicly available datasets and evaluation protocols. Studies use different datasets, evaluation metrics, and validation approaches, which makes it difficult to compare results or replicate findings. Although some models report high accuracy or F1 scores, most do not evaluate how their performance changes when applied to other leagues, playing styles, or match conditions. These differences limit the confidence in applying the results beyond the original study, especially in real competitive environments. Addressing these limitations will be essential for transforming ML models from experimental tools into reliable, explainable, and scalable decision-support systems in professional football.
7. Case Studies of Application of ML in Professional Football
This section presents a couple of case studies in which ML can be used to enhance football analysis.
7.1. Predicting the Date Cristiano Ronaldo Will Reach 1000 Goals
The application of ML in professional football has revolutionized performance analysis and outcome prediction, as highlighted in a systematic review of 172 studies spanning 2019–2024. Building on this foundation, this section explores individual performance forecasting by predicting when Cristiano Ronaldo (CR7) will reach 1000 official career goals—a milestone of significant interest in sports analytics. This task leverages supervised learning and deep learning techniques to model goal accumulation based on historical data.
7.1.1. Data and Methodology
The dataset comprises CR7’s historical goal records from October 2002 to 23 March 2025, totaling 929 goals across various competitions (e.g., Primeira Liga, Taça de Portugal, and others). Goals were aggregated monthly to capture temporal patterns. Figure 32 traces CR7’s yearly goals.
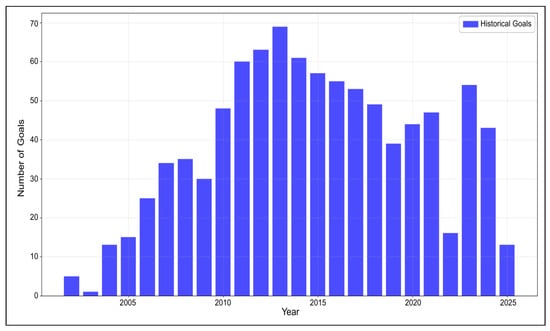
Figure 32.
CR7 historical goals by year.
Three ML models were selected based on their prevalence in the reviewed literature: random forest (an ensemble method), long short-term memory (LSTM, a deep learning approach), and XGBoost (a gradient boosting technique). These models were chosen for their ability to handle time-series data and predict continuous outcomes.
- Random Forest: Utilizes an ensemble of decision trees to capture non-linear relationships in goal-scoring patterns. Features included temporal indices (e.g., time since first goal).
- LSTM: An RNN designed for sequential data, modeling long-term dependencies in monthly goal tallies. A sliding window approach (with a look-back period of 6 months) was used to create input sequences.
- XGBoost: Incorporates temporal features (e.g., year, month, and cyclical month encodings) to enhance prediction accuracy, leveraging gradient boosting to minimize errors iteratively.
The dataset was split into training (70%) and testing (30%) sets, with predictions extended to estimate the date CR7 reaches 1000 goals. Model parameters are summarized in Table 10.
Table 10.
Model configurations.
7.1.2. Results and Evaluation
The models estimate the following dates for CR7 to reach 1000 goals, starting from 929 goals as of 23 March 2025 (71 goals remaining):
- Random Forest: September 2026.
- LSTM: June 2026.
- XGBoost: June 2026.
Random forest predicts a later date, suggesting a steady but cautious pace to cover the remaining 71 goals. In contrast, LSTM and XGBoost project a faster timeline, implying a higher scoring rate over the next 15 months. Figure 33 shows the cumulative goal projections, tracing each model’s forecast from March 2025 onward. It can be observed that Random forest follows a smooth, linear trajectory, crossing the 1000-goal mark in September 2026. This steady climb reflects a balanced estimate, consistent with CR7’s recent scoring trends (e.g., 43 goals in 2024). It is observed that LSTM and XGBoost predict steeper curves, reaching 1000 goals by June 2026, suggesting they expect CR7 to maintain or exceed his peak rates. The red dashed line at 1000 goals highlights the target, and random forest’s gradual slope indicates greater stability compared to the more optimistic LSTM and XGBoost, whose rapid ascents risk overestimating short-term output. Figure 34 shows annual goal forecasts. Comparing the models reveals that they break down the predictions into yearly goals for 2025 and 2026. In this grouped bar chart, it is observed that random forest predicts 36 goals per year. It can be observed that LSTM and XGBoost forecasts higher totals, around 30–45 goals annually, implying sustained high performance. This consistency suggests random forest captures realistic patterns in scoring.
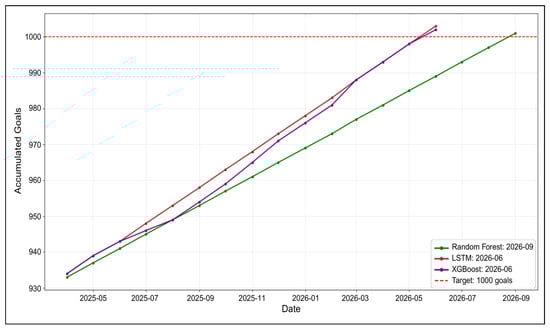
Figure 33.
Prediction of when CR7 will reach 1000 goals according to different models.
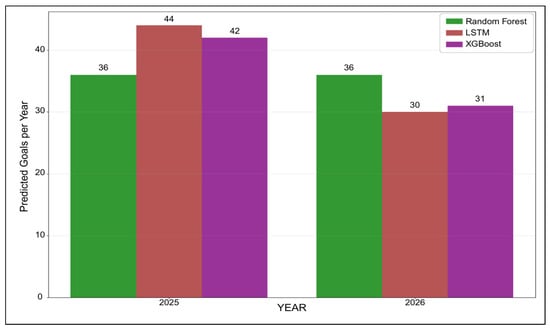
Figure 34.
Annual predictions of CR7 goals by model until reaching 1000 goals.
To evaluate the model’s accuracy, five metrics were calculated: mean squared error (MSE), root mean squared error (RMSE), mean absolute error (MAE), mean absolute percentage error (MAPE), and score. Table 11 shows test results. As shown in Figure 35, the heatmap visually compares these metrics across models. In the heatmap, it can be observed that random forest achieves the lowest RMSE (2.189) and MAE (1.783). These metrics suggest its predictions deviate less from monthly goal tallies, making it the most accurate model. It is observed that LSTM’s errors are higher (RMSE: 2.323, MAE: 1.970), followed by XGBoost (RMSE: 2.479, MAE: 2.097). The negative values indicate that none of the models fully capture the variance in monthly goals, which is a challenge tied to the erratic scoring nature. High MAPE values, especially for LSTM (88.314%) and XGBoost (90.496%), highlight difficulties predicting small monthly counts, as even minor errors yield large percentage deviations. This predictive modeling underscores the potential and limitations of applying ML techniques to athlete performance forecasting. While models like LSTM and XGBoost offer optimistic timelines, random forest stands out for its balanced and stable projections, aligning more closely with historical trends. However, the overall negative values and high error margins highlight the inherent unpredictability in goal scoring, influenced by factors such as injuries, match frequency, and team dynamics—none fully captured in the dataset. Thus, while CR7’s journey to 1000 goals remains statistically plausible by mid-to-late 2026, real-world outcomes will ultimately depend on variables beyond the model’s scope. Nonetheless, this demonstrates the value of ML in sports analytics, not only for forecasting but also for identifying patterns and setting realistic expectations.
Table 11.
Performance metrics.
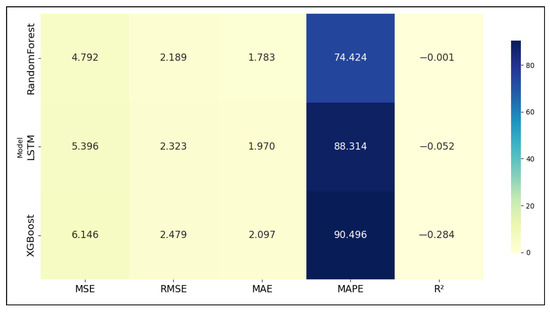
Figure 35.
Model metrics comparison.
7.2. Predicting Penalty Shoots
Another example of applying ML models in football is the ability to predict aspects of the game that can significantly influence the match outcome and a team’s performance. In this context, the study conducted by [75] was analyzed, where data was collected from the Kaggle platform.
7.2.1. Data and Methodology
The dataset includes information from 9074 matches and a total of 941,009 events corresponding to five major European leagues: England, Spain, Germany, Italy, and France, covering the period from the 2011/2012 season to the 2016/2017 season [75]. The data was organized into three files: events.csv, which contains details about the events recorded during the matches; dictionary.txt, which provides descriptions of the events included in events.csv; and ginf.csv, which offers general information about each match [75]. For data analysis and manipulation, Python 3.13.2 was used, while the construction of the ML models was carried out using the scikit-learn package version 1.1.0, and the Pandas module was employed to manage the datasets. The predominantly numerical nature of the data facilitated a quantitative analysis approach. Additionally, Google Colab Notebook was used as the development environment to efficiently create, edit, and debug the scripts.
7.2.2. Predicting Model Result and Evaluation
The player chosen for the model design was CR7 due to his high number of goals during that period. Three machine learning models were evaluated: (i) decision tree, (ii) artificial neural network, and (iii) XGBoost. The dataset was split into training and testing sets to predict the direction in which a football player would take a penalty kick using information from the aforementioned leagues. A combination of relevant events and features was considered, allowing meaningful results to be extracted. The main event considered was the penalty kick, whose possible directions were initially classified as top_left, bottom_left, top_right, bottom_right, and centre. These directions were later grouped into three general classes to simplify and improve the model’s performance, using the following logic:
Group [’top_left’, ’top_right’]: ’top’.
Group [’bottom_left’, ’bottom_right’]: ’bottom’.
Default: ’centre’.
As for the features used to train the model, the following were included: (i) the body part used to take the penalty (bodypart), whether the shot resulted in a goal (is_goal), (ii) the minute when the penalty occurred (time), (iii) the encoded opponent team (opponent_encoded), (iv) whether the player’s team was home or away (side), and (v) the encoded team of the shooter (event_team_encoded) [75]. The predictions were evaluated using three key metrics: Accuracy, Recall, and F1 Score, yielding the results presented in Figure 36.
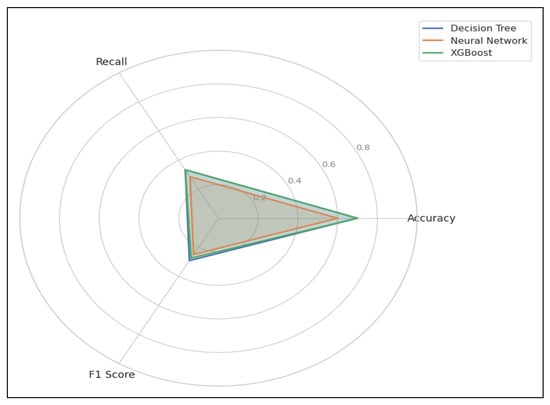
Figure 36.
Radar chart of metrics of the evaluated models.
The decision tree model achieved an accuracy of 70%, tying with XGBoost as the best-performing model in this metric. Its recall was 33.3%, indicating that it correctly identified one-third of the actual classes in the test set. The resulting F1 Score was 0.29, reflecting a reasonable balance between precision and recall. This model stands out for its simplicity, interpretability, and training speed, making it an effective and practical option when a clear and efficient solution is required. In Figure 37, the confusion matrix of the decision tree shows that it predicts the centre class with greater accuracy, while the top and bottom classes exhibit higher levels of confusion with each other. This suggests a model tendency toward the central class, possibly due to data imbalance or the influence of variables such as time, opponent, or side. Overall, this model delivers solid performance and good generalization capability.
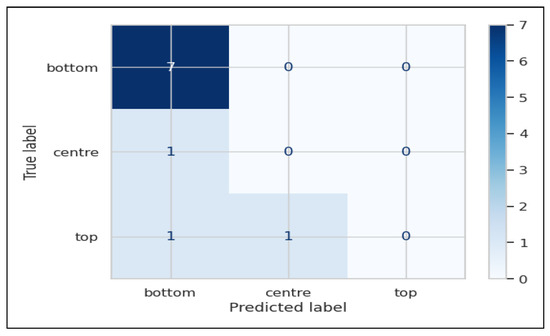
Figure 37.
Confusion matrix of the decision tree model.
In contrast, the neural network showed lower performance, with an accuracy of 50%, a recall of 23.8%, and an F1 Score of 0.22. Despite its ability to capture complex relationships between variables, it failed to outperform simpler models in this specific case. The low recall value indicates that many actual classes were not correctly identified, reducing its reliability in scenarios where high coverage is required for predicting the shot direction. In Figure 38, the corresponding confusion matrix reveals a pronounced tendency toward misclassification, especially for the top and bottom classes. This could be attributed to an overly simplistic architecture, a limited dataset, or insufficient informative variables for a model that heavily depends on nonlinear patterns, such as a neural network. In this context, the network does not stand out and would require significant adjustments to improve its performance.
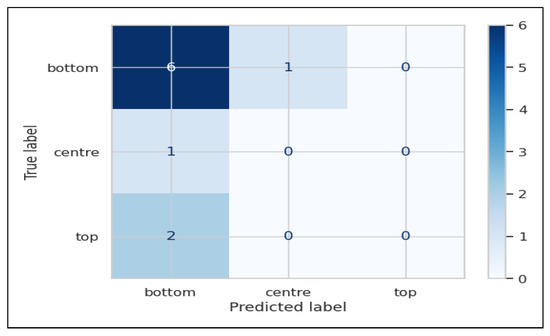
Figure 38.
Confusion matrix of the ANN model.
XGBoost matched the 70% accuracy obtained by the decision tree model, with a recall also of 33.3% and a slightly lower F1 Score of 0.27. Although more complex, this model is widely recognized for its robustness and ability to handle nonlinear relationships and noisy features. Its performance demonstrates that it can effectively compete even with smaller datasets. In Figure 39, the XGBoost confusion matrix showed a distribution similar to that of the decision tree, with better predictions for the centre class and greater confusion between the top and bottom classes. Nevertheless, its boosting-based architecture provides greater stability as more data is added or techniques such as cross-validation are implemented. This makes XGBoost an excellent alternative for scaling or integrating the model into more sophisticated prediction systems.
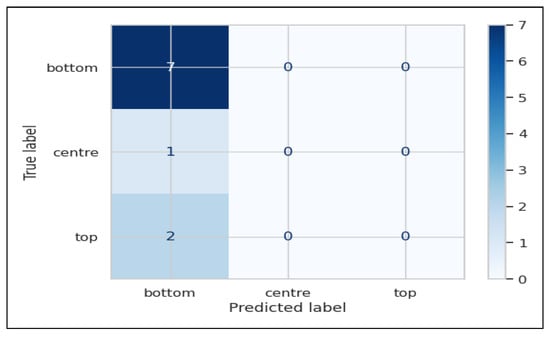
Figure 39.
Confusion matrix of the XGBoost model.
The practical implementation in Section 7.2 using the Google Colab Notebook can be reviewed at [76].
8. Conclusions
This paper conducted a systematic mapping of the ML application on professional football, focusing on player and team performance, as well as match outcome prediction. A total of 172 relevant articles were selected through a structured coding process to address the four research questions and fulfill the study’s objectives. Based on the findings, it can be concluded that the theoretical foundations and categorization of ML techniques have been successfully outlined. Additionally, specific areas of application were identified, including match outcome, winning prediction, player’s position, player’s trajectory, game actions, player and team behavior, player performance, and team performance—each representing key domains where ML algorithms are effectively applied in the context of professional football.
The existing literature within a five-year time frame (2019–2024) was successfully classified through a systematic mapping, identifying the key aspects, techniques, and algorithms that offer advantages and improvements in the application areas. Supervised learning, deep learning, and ensemble techniques emerged as the most frequently used approaches in the selected articles. Classical techniques such as classification and regression continue to play a significant role, providing reliable accuracy with labeled data in training and testing models. Similarly, the increasing adoption of ANNs and CNNs in deep learning contributes to more robust prediction models as neural networks mimic, to some extent, the functioning of the human brain. Moreover, the rising interest in combining multiple learning approaches or using ensemble models is notable as these techniques are well suited for handling large volumes of complex data.
The ML techniques reported have provided a clear perspective on their level of maturity over the defined time range, with the most mature techniques corresponding to the learning approaches most frequently used in the coded articles. On the other hand, there is a noticeably lower use of semi-supervised and reinforcement learning techniques, highlighting limitations in their implementation for performance-based or prediction-driven solutions.
The availability of datasets was analyzed, showing that 42.44% of the articles provide a link to the dataset source. However, despite the availability of these sources, several gaps and limitations were identified, such as access restrictions and paywalls. Additionally, there is limited use of robust visualization tools that could add value to the information analysis, and there is a noticeable lack of real data acquisition devices, such as sensors. These aspects represent challenges and gaps revealed in the paper, which, in turn, constitute opportunities for future research and potential areas for improvement.
The prediction of the moment when Cristiano Ronaldo will reach 1000 official goals using machine learning models demonstrates the potential of these techniques for quantitative analysis of individual performance in professional football. Random forest, LSTM, and XGBoost models were used to project the player’s goal-scoring progression with varying levels of accuracy and realism. Among them, random forest showed the best balance between stability and precision (RMSE = 2.189; MAE = 1.783), despite a slightly negative R2 value (−0.001). On the other hand, the LSTM and XGBoost models yielded higher error rates (RMSE = 2.323 and 2.479, respectively), as well as elevated MAPE values (88.3% and 90.5%). These results reflect both the strengths and limitations of supervised learning approaches. While they are useful for modeling historical trends and generating plausible estimates, they fall short in capturing the full variability inherent in sports performance, which is influenced by factors not represented in the dataset. In this context, machine learning proves to be a valuable tool for setting realistic expectations and supporting strategic planning in the sports field.
The predictive analysis of penalty kick direction using machine learning models confirms their applicability in studying critical game events. Based on a dataset comprising over 900,000 events (2011–2017), three models were evaluated: decision tree, artificial neural network, and XGBoost. The decision tree model achieved the best overall performance, with an accuracy of 70%, a recall of 33.3%, and an F1 score of 0.29, demonstrating a good balance between simplicity and generalization capability. XGBoost matched the accuracy (70%) but yielded a slightly lower F1 score (0.27), while the neural network model produced the weakest results (accuracy = 50%; F1 score = 0.22). The confusion matrix revealed a clear tendency to predict the “center” class, indicating a potential bias due to class imbalance. These findings support the notion that simpler models can outperform more complex techniques when limited variables or structured data are available, reinforcing the role of machine learning as an effective tool for analyzing specific behaviors within the context of professional football.
Author Contributions
Conceptualization, D.M., C.T. and X.C.-H.; methodology, D.M., C.T., G.V. and X.C.-H.; software, D.M. and B.R.; validation, C.T., G.V. and X.C.-H.; formal analysis, D.M., C.T. and X.C.-H.; investigation, D.M., C.T., X.C.-H. and G.V.; resources, C.T. and X.C.-H.; data curation, D.M. and B.R.; writing—original draft preparation, D.M., C.T., G.V. and B.R.; writing—review and editing, C.T. and R.Á.; visualization, D.M., G.V. and B.R.; supervision, C.T.; project administration, C.T. and R.Á.; funding acquisition, C.T., X.C.-H. and R.Á. All authors have read and agreed to the published version of the manuscript.
Funding
The APC was funded by the Escuela Politécnica Nacional.
Institutional Review Board Statement
Not applicable.
Informed Consent Statement
Not applicable.
Data Availability Statement
Data is contained within the article.
Acknowledgments
The authors acknowledge the support provided by the Escuela Politécnica Nacional.
Conflicts of Interest
Author Génesis Villa was employed by the company Telefónica. The remaining authors declare that the research was conducted in the absence of any commercial or financial relationships that could be construed as a potential conflict of interest.
Abbreviations
The following abbreviations are used in this manuscript:
| ANN | Artificial neural network |
| CNN | Convolutional neural network |
| DBSCAN | Density-based spatial clustering of applications with noise |
| xG | Expected goals |
| XGBoost | Extreme gradient boosting |
| GAN | Generative adversarial networks |
| GMM | Gaussian mixture models |
| HCA | Hierarchical clustering analysis |
| KNN | K-nearest neighbors |
| LDA | Linear discriminant analysis |
| LPA | Label propagation algorithm |
| ML | Machine learning |
| PCA | Principal component analysis |
| RNN | Recurrent neural network |
| SVM | Support vector machine |
References
- Chris Richter, M.O.; Delahunt, E. Machine learning in sports science: Challenges and opportunities. Sports Biomech. 2024, 23, 961–967. [Google Scholar] [CrossRef] [PubMed]
- Rico-González, M.; Pino-Ortega, J.; Méndez, A.; Clemente, F.M.; Baca, A. Machine learning application in soccer: A systematic review. Biol. Sport 2023, 40, 249–263. [Google Scholar] [CrossRef] [PubMed]
- Morgulev, E.; Azar, O.H.; Lidor, R. Sports analytics and the big-data era. Int. J. Data Sci. Anal. 2018, 5, 213–222. [Google Scholar] [CrossRef]
- Thakkar, P.; Shah, M. An Assessment of Football Through the Lens of Data Science. Ann. Data Sci. 2021, 8, 823–836. [Google Scholar] [CrossRef]
- Ievoli, R.; Palazzo, L.; Ragozini, G. On the use of passing network indicators to predict football outcomes. Knowl.-Based Syst. 2021, 222, 106997. [Google Scholar] [CrossRef]
- Lewis, M. Moneyball: The Art of Winning an Unfair Game; W. W. Norton & Company: New York, NY, USA, 17 June 2003; p. 288. [Google Scholar]
- Market Data Forecast. Smart Wearables Market Size, Share & Growth Report; Market Data Forecast: Hyderabad, India, 2024; Available online: https://www.marketdataforecast.com/market-reports/smart-wearables-market (accessed on 20 May 2025).
- Berlyand, L.; Jabin, P.-E. Supervised, unsupervised, and semisupervised learning. In Mathematics of Deep Learning: An Introduction; De Gruyter: Berlin, Germany; Boston, MA, USA, 2023; pp. 19–23. [Google Scholar]
- Zhang, Y. New Advances in Machine Learning; IntechOpen: Rijeka, Croatia, 2010; p. 374. [Google Scholar]
- Sarker, I.H. Machine Learning: Algorithms, Real-World Applications and Research Directions. SN Comput. Sci. 2021, 2, 160. [Google Scholar] [CrossRef]
- GeeksforGeeks. Linear vs. Polynomial Regression: Understanding the Differences. GeeksforGeeks, Last Updated 23 July 2025. Available online: https://www.geeksforgeeks.org/machine-learning/linear-vs-polynomial-regression-understanding-the-differences/ (accessed on 10 May 2025).
- Agrawal, R.; Imieliński, T.; Swami, A. Mining association rules between sets of items in large databases. ACM SIGMOD Rec. 1993, 22, 207–216. [Google Scholar] [CrossRef]
- Xiang, R.; Wang, W.; Yang, L.; Wang, S.; Xu, C.; Chen, X. A Comparison for Dimensionality Reduction Methods of Single-Cell RNA-seq Data. Front. Genet. 2021, 12, 646936. [Google Scholar] [CrossRef]
- Sun, D. An Overview of Machine Learning Applications in the Football Field. Appl. Comput. Eng. 2023, 8, 318–322. [Google Scholar] [CrossRef]
- Tang, Y. Deep Learning using Linear Support Vector Machines. arXiv 2013, arXiv:1306.0239. [Google Scholar] [CrossRef]
- Altman, N.S. An Introduction to Kernel and Nearest-Neighbor Nonparametric Regression. Am. Stat. 1992, 46, 175–185. [Google Scholar] [CrossRef]
- Nassis, G.P.; Verhagen, E.; Brito, J.; Figueiredo, P.; Krustrup, P. A review of machine learning applications in soccer with an emphasis on injury risk. Biol. Sport 2022, 40, 233–239. [Google Scholar] [CrossRef]
- James, G.; Witten, D.; Hastie, T.; Tibshirani, R.; Taylor, J. Linear Regression. In An Introduction to Statistical Learning: With Applications in Python; Springer International Publishing: Cham, Switzerland, 2023; pp. 69–134. [Google Scholar] [CrossRef]
- Heiberger, R.M.; Neuwirth, E. Polynomial Regression. In R Through Excel: A Spreadsheet Interface for Statistics, Data Analysis, and Graphics; Use R! Springer Science+Business Media: New York, NY, USA, 2009; pp. 269–284. [Google Scholar] [CrossRef]
- Murtagh, F.; Contreras, P. Algorithms for hierarchical clustering: An overview. WIREs Data Min. Knowl. Discov. 2012, 2, 86–97. [Google Scholar] [CrossRef]
- Marchi, F. Serie A Teams Playing Style: A Cluster Analysis. Medium, 13 October 2024. Available online: https://medium.com/@markfootballdata/serie-a-teams-playing-style-a-cluster-analysis-f0ddc5e30091 (accessed on 5 June 2025).
- Igual, L.; Seguí, S. Introduction to data science. In Introduction to Data Science: A Python Approach to Concepts, Techniques and Applications; Springer: Cham, Switzerland, 2024; pp. 1–4. [Google Scholar]
- Akhanli, S.E.; Hennig, C. Clustering of football players based on performance data and aggregated clustering validity indexes. J. Quant. Anal. Sports 2023, 19, 103–123. [Google Scholar] [CrossRef]
- Shelly, Z.; Burch, R.F.; Tian, W.; Strawderman, L.; Piroli, A.; Bichey, C. Using K-means Clustering to Create Training Groups for Elite American Football Student-athletes Based on Game Demands. Int. J. Kinesiol. Sports Sci. 2024, 8, 47–63. [Google Scholar] [CrossRef]
- Weber, C.M.; Ray, D.; Valverde, A.A.; Clark, J.A.; Sharma, K.S. Algorithms for hierarchical clustering: An overview of Gaussian mixture model clustering algorithms for the analysis of high-precision mass measurements. Nucl. Instrum. Methods Phys. Res. A 2022, 1027, 166299. [Google Scholar] [CrossRef]
- Gyarmati, L.; Kwak, H.; Rodriguez, P. Searching for a Unique Style in Soccer. arXiv 2014, arXiv:1409.0308. [Google Scholar] [CrossRef]
- GeeksforGeeks. Apriori Algorithm. GeeksforGeeks, Last Updated 11 July 2025. Available online: https://www.geeksforgeeks.org/machine-learning/apriori-algorithm/ (accessed on 28 May 2025).
- Mead, J.; O’Hare, A.; McMenemy, P. Expected goals in football: Improving model performance and demonstrating value. PLoS ONE 2023, 18, e0282295. [Google Scholar] [CrossRef]
- Janiesch, C.; Zschech, P.; Heinrich, K. Machine learning and deep learning. Electron. Mark. 2021, 31, 685–695. [Google Scholar] [CrossRef]
- Cuperman, R.; Jansen, K.M.; Ciszewski, M.G. An End-to-End Deep Learning Pipeline for Football Activity Recognition Based on Wearable Acceleration Sensors. Sensors 2022, 22, 1347. [Google Scholar] [CrossRef]
- Gómez-Rubio, V.; Lagos, J.; Palmí-Perales, F. Spatial similarity index for scouting in football. J. Appl. Stat. 2025, 1–14. [Google Scholar] [CrossRef]
- Merlin, M.; Pinto, A.; Moura, F.A.; da Silva Torres, R.; Cunha, S.A. Who are the best passing players in professional soccer? A machine learning approach for classifying passes with different levels of difficulty and discriminating the best passing players. PLoS ONE 2024, 19, e0304139. [Google Scholar] [CrossRef]
- Cao, A.; Lan, J.; Xie, X.; Chen, H.; Zhang, X.; Zhang, H.; Wu, Y. Team-Builder: Toward More Effective Lineup Selection in Soccer. IEEE Trans. Vis. Comput. Graph. 2023, 29, 5178–5193. [Google Scholar] [CrossRef]
- Hady, M.F.A.; Schwenker, F. Semi-supervised Learning. In Handbook on Neural Information Processing; Bianchini, M., Maggini, M., Jain, L.C., Eds.; Springer: Berlin/Heidelberg, Germany, 2013; pp. 215–239. [Google Scholar] [CrossRef]
- van Engelen, J.E.; Hoos, H.H. A survey on semi-supervised learning. Mach. Learn. 2020, 109, 373–440. [Google Scholar] [CrossRef]
- Iscen, A.; Tolias, G.; Avrithis, Y.; Chum, O. Label Propagation for Deep Semi-Supervised Learning. In Proceedings of the IEEE/CVF Conference on Computer Vision and Pattern Recognition (CVPR), Long Beach, CA, USA, 15–20 June 2019; pp. 1196–1208. [Google Scholar] [CrossRef]
- Bunker, R.; Susnjak, T. The Application of Machine Learning Techniques for Predicting Match Results in Team Sport: A Review. J. Artif. Intell. Res. 2022, 73, 1285–1322. [Google Scholar] [CrossRef]
- Watkins, C.J.C.H.; Dayan, P. Q-learning. Mach. Learn. 1992, 8, 279–292. [Google Scholar] [CrossRef]
- Pulis, M.; Bajada, J. Reinforcement learning for football player decision making analysis. In Proceedings of the StatsBomb Conference, London, UK, 20 September 2022; Hudl/StatsBomb: Valletta, Malta, 2022; pp. 1–23. Available online: https://www.um.edu.mt/library/oar/handle/123456789/131785 (accessed on 28 May 2025).
- Khadka, S.; Tumer, K. Evolution-Guided Policy Gradient in Reinforcement Learning. In Advances in Neural Information Processing Systems 31; Bengio, S., Wallach, H., Larochelle, H., Grauman, K., Cesa-Bianchi, N., Garnett, R., Eds.; Curran Associates, Inc.: Red Hook, NY, USA, 2018; pp. 1196–1208. [Google Scholar]
- Grondman, I.; Busoniu, L.; Lopes, G.A.D.; Babuska, R. A survey of actor-critic reinforcement learning: Standard and natural policy gradients. IEEE Trans. Syst. Man Cybern. C 2012, 42, 1291–1307. [Google Scholar] [CrossRef]
- Cortez, A.; Trigo, A.; Loureiro, N. Predicting Physiological Variables of Players that Make a Winning Football Team: A Machine Learning Approach. In Proceedings of the Computational Science and Its Applications—ICCSA 2021, Cagliari, Italy, 13–16 September 2021. [Google Scholar] [CrossRef]
- Giacomo, U.D.; Mercaldo, F.; Santone, A.; Capobianco, G. Machine Learning on Soccer Player Positions. Int. J. Decis. Support Syst. Technol. 2021, 14, 1–19. [Google Scholar] [CrossRef]
- Liu, H.; Zhang, B. A Survey on Applications of Modern Deep Learning Techniques in Team Sports Analytics. In Proceedings of the 12th International Conference on Soft Computing and Pattern Recognition (SoCPaR 2020), Online, 15–18 December 2020. [Google Scholar] [CrossRef]
- Herold, M.; Goes, F.; Nopp, S.; Bauer, P.; Thompson, C.; Meyer, T. Machine Learning in Men’s Professional Football: Current Applications and Future Directions for Improving Attacking Play. Int. J. Sports Sci. Coach. 2019, 14, 798–817. [Google Scholar] [CrossRef]
- Bransen, L.; Haaren, J.V. Measuring Football Players’ On-the-Ball Contributions from Passes During Games. In Proceedings of the Machine Learning and Data Mining for Sports Analytics, Dublin, Ireland, 10 September 2018. [Google Scholar] [CrossRef]
- Suzuki, G.; Takahashi, S.; Ogawa, T.; Haseyama, M. Team Tactics Estimation in Soccer Videos Based on a Deep Extreme Learning Machine and Characteristics of the Tactics. IEEE Access 2019, 7, 153238–153248. [Google Scholar] [CrossRef]
- Yiğit, A.T.; Samak, B.; Kaya, T. Football Player Value Assessment Using Machine Learning Techniques. In Proceedings of the INFUS 2019 Conference, Istanbul, Turkey, 23–25 July 2019. [Google Scholar] [CrossRef]
- Mendes-Neves, T.; Mendes-Moreira, J.; Rossetti, R.J.F. A Data-Driven Simulator for Assessing Decision-Making in Soccer. In Proceedings of the 20th EPIA Conference on Artificial Intelligence, EPIA 2021, Virtual, 7–9 September 2021. [Google Scholar] [CrossRef]
- Wang, Z.; Veličković, P.; Hennes, D.; Tomašev, N.; Prince, L.; Kaisers, M.; Bachrach, Y.; Elie, R.; Wenliang, L.K.; Piccinini, F.; et al. TacticAI: An AI assistant for football tactics. Nat. Commun. 2024, 15, 1906. [Google Scholar] [CrossRef]
- Sastoque, M.A.S. TacticAI: Revolutionizing Football with Artificial Intelligence. 2023. Available online: https://psicologiaymente.com/deporte/tacticai-revolucionando-futbol-inteligencia-artificial (accessed on 8 June 2025).
- Palucci Vieira, L.H.; Clemente, F.M.; Silva, R.M.; Vargas-Villafuerte, K.R.; Carpes, F.P. Measurement Properties of Wearable Kinematic-Based Data Collection Systems to Evaluate Ball Kicking in Soccer: A Systematic Review with Evidence Gap Map. Sensors 2024, 24, 7912. [Google Scholar] [CrossRef]
- Playermaker. Playermaker. 2025. Available online: https://www.playermaker.com/ (accessed on 7 June 2025).
- Stats Perform. Stats Perform. 2025. Available online: https://www.statsperform.com/ (accessed on 8 June 2025).
- Portal ERP España. LaLiga and Microsoft Revolutionize Football with Artificial Intelligence. 2025. Available online: https://portalerp.es/laliga-y-microsoft-revolucionan-el-futbol-con-inteligencia-artificial (accessed on 5 June 2025).
- Ati, A.; Bouchet, P.; Ben Jeddou, R. Using multi-criteria decision-making and machine learning for football player selection and performance prediction: A systematic review. Data Sci. Manag. 2024, 7, 79–88. [Google Scholar] [CrossRef]
- Principe, V.A.; de Souza Vale, R.G.; de Castro, J.B.A.P.; Carvano, L.M.; Henriques, R.A.P.; de Almeida e Sousa Lobo, V.J.; de Alkmim Moreira Nunes, R. A computational literature review of football performance analysis through probabilistic topic modeling. Artif. Intell. Rev. 2022, 55, 1351–1371. [Google Scholar] [CrossRef]
- Delibas, E.; Uzun, A.; Inan, M.F.; Guzey, O.; Cakmak, A. Interactive Exploratory Soccer Data Analytics. INFOR Inf. Syst. Oper. Res. 2019, 57, 141–164. [Google Scholar] [CrossRef]
- Villa, G.; Tipantuña, C.; Guamán, D.S.; Arévalo, G.V.; Arguero, B. Machine Learning Techniques in Optical Networks: A Systematic Mapping Study. IEEE Access 2023, 11, 98714–98750. [Google Scholar] [CrossRef]
- Moya, D. DATA—ML-Football: Machine Learning Applied to Football Data. 2025. Available online: https://github.com/diego99m/DATA---ML-Football (accessed on 6 June 2025).
- Karim, H.; Marwane, L. The Kos Angle: An Optimizing Parameter for Football Expected Goals (xG) Models. Int. J. Comput. Sci. Sport 2023, 22, 49–61. [Google Scholar] [CrossRef]
- Datta, M.; Rudra, B. An Intelligent Decision Support System for Bid Prediction of Undervalued Football Players. In Proceedings of the 2022 2nd International Conference on Intelligent Technologies (CONIT), Hubli, India, 24–26 June 2022. [Google Scholar] [CrossRef]
- Mascher, K.; Laller, S.; Wieser, M. Development of smart shin guards for soccer performance analysis based on MEMS accelerometers, machine learning, and GNSS. In Proceedings of the 11th WiP International Conference on Localization and GNSS (ICL-GNSS 2021), Graz, Austria, 1–3 June 2021. [Google Scholar]
- Tuyls, K.; Omidshafiei, S.; Muller, P.; Wang, Z.; Connor, J.; Hennes, D.; Graham, I.; Spearman, W.; Waskett, T.; Steel, D.; et al. Game Plan: What AI can do for Football, and What Football can do for AI. J. Artif. Intell. Res. 2021, 71, 41–88. [Google Scholar] [CrossRef]
- Chen, T.; He, T. xgboost: eXtreme Gradient Boosting (R Package Vignette), version 1.7.11.1; CRAN mirror: University of Melbourne: Melbourne, Australia, 1 May 2025; Available online: https://cran.ms.unimelb.edu.au/web/packages/xgboost/vignettes/xgboost.pdf (accessed on 28 May 2025).
- Tokić, S.; Panjkota, A.; Matetić, M. Machine Learning for Data Analysis in Football: A Survey of Methods and Problems. In Proceedings of the 33rd DAAAM International Symposium, Vienna, Austria, 27–28 October 2022. [Google Scholar] [CrossRef]
- Bai, Y.; Zhang, X. Prediction Model of Football World Cup Championship Based on Machine Learning and Mobile Algorithm. Mob. Inf. Syst. 2021, 2021, 1875060. [Google Scholar] [CrossRef]
- Goes, F.R.; Kempe, M.; van Norel, J.; Lemmink, K.A.P.M. Modelling Team Performance in Soccer Using Tactical Features Derived from Position Tracking Data. IMA J. Manag. Math. 2021, 32, 519–533. [Google Scholar] [CrossRef]
- Saricaoğlu, A.E.; Aksoy, A.; Kaya, T. Prediction of Turkish Super League Match Results Using Supervised Machine Learning Techniques. In Proceedings of the INFUS 2019 Conference, Istanbul, Turkey, 23–25 July 2019. [Google Scholar] [CrossRef]
- Gupta, K.D.; Dahiya, N.; Dabas, M.; Pushparaj, P. Playing football game using AI agents. In Proceedings of the 2022 International Conference on Emerging Techniques in Computational Intelligence (ICETCI), Hyderabad, India, 25–27 August 2022; IEEE: Piscataway, NJ, USA, 2022; pp. 84–88. [Google Scholar] [CrossRef]
- Galli, L.; Galvan, G.; Levato, T.; Liti, C.; Piccialli, V.; Sciandrone, M. Football: Discovering Elapsing-Time Bias in the Science of Success. Chaos Solitons Fractals 2021, 152, 111370. [Google Scholar] [CrossRef]
- Khan, S.; Kirubanand, V.B. Comparing Machine Learning and Ensemble Learning in the Field of Football. J. Electr. Comput. Eng. 2019, 9, 4321–4325. [Google Scholar] [CrossRef]
- Football-Data. Football-Data.co.uk: Free Football Results, Match Statistics & Betting Odds Data; Last Updated 26 June 2025. Available online: https://www.football-data.co.uk/ (accessed on 7 June 2025).
- SoFIFA. SoFIFA: The EA FC Database and Player Rating Website. Last Updated 1 June 2025. Available online: https://sofifa.com/ (accessed on 2 June 2025).
- Mohandas, A.; Ahsan, M.; Haider, J. Tactically Maximize Game Advantage by Predicting Football Substitutions Using Machine Learning. 2023. Available online: https://www.researchgate.net/publication/371502799_Tactically_Maximize_Game_Advantage_by_Predicting_Football_Substitutions_Using_Machine_Learning (accessed on 19 May 2025).
- Moya, D.; Rivadeneira, B. Case Studies of Application of ML in Professional Football. 2025. Available online: https://colab.research.google.com/drive/1WXhCMigglRnw8Jdj25SBVZh4wgxJ3BwH?usp=sharing (accessed on 19 May 2025).


Disclaimer/Publisher’s Note: The statements, opinions and data contained in all publications are solely those of the individual author(s) and contributor(s) and not of MDPI and/or the editor(s). MDPI and/or the editor(s) disclaim responsibility for any injury to people or property resulting from any ideas, methods, instructions or products referred to in the content. |
© 2025 by the authors. Licensee MDPI, Basel, Switzerland. This article is an open access article distributed under the terms and conditions of the Creative Commons Attribution (CC BY) license (https://creativecommons.org/licenses/by/4.0/).