Article

Multilayer Perceptron Mapping of Subjective Time Duration onto Mental Imagery Vividness and Underlying Brain Dynamics: A Neural Cognitive Modeling Approach

by
Matthew Sheculski
1 and
Amedeo D’Angiulli
1,2,*
1
Neuroscience of Imagination Cognition and Emotion Research (NICER) Lab, Department of Neuroscience, Carleton University, Ottawa, ON K1S 5B6, Canada
2
Children’s Hospital of Eastern Ontario Research Institute, Ottawa, ON K1H 8L1, Canada
*
Author to whom correspondence should be addressed.
Mach. Learn. Knowl. Extr. 2025, 7(3), 82; https://doi.org/10.3390/make7030082
Submission received: 5 June 2025 / Revised: 1 August 2025 / Accepted: 6 August 2025 / Published: 13 August 2025

Abstract

According to a recent experimental phenomenology–information processing theory, the sensory strength, or vividness, of visual mental images self-reported by human observers reflects the intensive variation in subjective time duration during the process of generation of said mental imagery. The primary objective of this study was to test the hypothesis that a biologically plausible essential multilayer perceptron (MLP) architecture can validly map the phenomenological categories of subjective time duration onto levels of subjectively self-reported vividness. A secondary objective was to explore whether this type of neural network cognitive modeling approach can give insight into plausible underlying large-scale brain dynamics. To achieve these objectives, vividness self-reports and reaction times from a previously collected database were reanalyzed using multilayered perceptron network models. The input layer consisted of six levels representing vividness self-reports and a reaction time cofactor. A single hidden layer consisted of three nodes representing the salience, task positive, and default mode networks. The output layer consisted of five levels representing Vittorio Benussi’s subjective time categories. Across different models of networks, Benussi’s subjective time categories (Level 1 = very brief, 2 = brief, 3 = present, 4 = long, 5 = very long) were predicted by visual imagery vividness level 1 (=no image) to 5 (=very vivid) with over 90% success in classification accuracy, precision, recall, and F1-score. This accuracy level was maintained after 5-fold cross validation. Linear regressions, Welch’s t-test for independent coefficients, and Pearson’s correlation analysis were applied to the resulting hidden node weight vectors, obtaining evidence for strong correlation and anticorrelation between nodes. This study successfully mapped Benussi’s five levels of subjective time categories onto the activation patterns of a simple MLP, providing a novel computational framework for experimental phenomenology. Our results revealed structured, complex dynamics between the task positive network (TPN), the default mode network (DMN), and the salience network (SN), suggesting that the neural mechanisms underlying temporal consciousness involve flexible network interactions beyond the traditional triple network model.

1. Introduction

The phrase “subjective time” refers to the length of time that is subjectively experienced over a given duration. It has been previously defined as “judgments of various sorts about how long stimuli and events last, or judgments about how fast time seems to pass” [1]. Unlike objective time, which is measured externally using standardized metrics, subjective time may compress or expand in duration depending on the engagement level of the observer [1]. For example, a mundane task such as spending ten minutes in line at a bank may subjectively feel much longer due to a lack of mental stimulation, whereas spending ten minutes in an engaging conversation may feel much shorter due to an abundance of stimulation. In both cases, the objective time duration was ten minutes, but the subjective experiences differed widely. The psychologist Franz Brentano provided an example of subjective time perception in the context of hearing a series of musical notes played one after another in a short span of objective time [2]. In Brentano’s example, each note occurs within its own partition of objective time, and the observer is consciously aware that they are hearing each note separately, but the overall presentation of the succession of notes is experienced as part of the same moment of the present in subjective time.
Vittorio Benussi was an early 20th century experimental psychologist and a member of the Graz school of psychology, one of the founding schools of Gestalt psychology [3]. Among his many contributions to the field of phenomenology was Benussi’s work on the perception of subjective time [4]. Benussi proposed that the subjective perception of the temporal present could be separated into five distinct durations, each defined by the specific cognitive processes active at the experience of the present [4,5]. The five durations are as follows:
  • Very short durations (90 ms to 234–252 ms)
  • Short durations (234–252 ms to 585–630 ms)
  • Intermediate durations (585–630 ms to 1080–1170 ms)
  • Long durations (1080–1170 ms to 2070 ms)
  • Very long durations (>2070 ms)
According to Benussi’s theories [4,5], perceptions between very short and intermediate durations are experienced as one single moment in the present. In these cases, the perceptual markers that make up the beginning, middle, and end of the perceived present moment are so close together that they are indistinguishable without the mind performing a deeper analysis of the moment’s contents. In contrast, long and very long durations have their perceptual markers spaced further apart. In these cases, the mind must exert greater effort to synthesize these components into one singular unified experience.
Benussi’s framework may have relevance to contemporary research concerning the generation of visual mental imagery. Specifically, the durations defined by Benussi and their neurological underpinnings may correspond to the latency and networks involved in producing mental images. Previous research demonstrated that participants with lower capacity to generate vivid mental images produced more widespread activation of the brain compared to high-vividness participants, possibly as a compensatory mechanism to enhance vividness [6]. This phenomenon may reflect the same integrative “synthesis” mechanism described in the long and very long durations in Benussi’s model [4]. The latency in generating visual mental images has previously been shown to be negatively correlated to ratings of imagery vividness, while familiarity of the object was positively correlated to vividness, implicating that vividness levels were dependent on the degree that the visual memory system was activated [7,8].

1.1. Neural Networks

There are three particular neural networks whose underlying mechanisms may be the plausible neurobiological correlates of the subjective durations described by Benussi: the default mode network (DMN), the task positive network (TPN), and the salience network (SN). The DMN includes the medial prefrontal cortex, the posterior cingulate cortex, the inferior parietal lobule, and the hippocampal formation as its core structures [9]. The DMN was originally defined as being more widely activated during passive, undirected mental states such as in the absence of goal-directed behaviors [9], and being attenuated during external engagement and task performance [10]. Despite these initial definitions, DMN activity has been shown to increase during goal-directed behaviors involving self-generated thought, including the generation of mental imagery [9,11]. In the context of these findings, the core structures of the DMN have been suggested to represent two distinct subsystems: one subsystem consists of the medial temporal lobe, which increases in activity during retrieval of contents from memory; the other subsystem consists of medial prefrontal cortex, which increases in activity during tasks involving self-reference, such as imagined perspectives [9,11].
The TPN, sometimes referred to as the dorsal frontoparietal network, includes the intraparietal sulcus and the frontal eye field as core structures [12,13]. The TPN is activated during the performance of external tasks, especially those which require spatial attention orienting and top-down processing of external cues [13]. TPN functionality has been implicated in preparatory movement planning for anticipated stimuli, and has also been shown to overlap with working memory processes [13].
The SN contains paralimbic core structures such as the anterior cingulate cortex and the anterior insula [14,15]. It forms connections with limbic, paralimbic, subcortical, and brainstem regions to regulate the processing of and behavioral response to internal states, including interoceptive-autonomic processing such as emotional salience of pain, empathy, hunger, pleasurable touch, and reward [14]. The SN is also involved in bottom-up processing of salient environmental stimuli across multiple sensory modalities, acting as a filter which enhances task-related stimuli and attenuates irrelevant noise [15]. It accomplishes this by transiently engaging brain structures associated with attention, working memory, and top-down cognitive processes, while simultaneously disengaging brain structures associated with awake, resting states [15].
As previously described, object familiarity has been shown to be positively correlated to vividness [8]. With the respect to familiarity, the neural structures most active during tasks of high familiarity were associated with the TPN, whereas tasks of low familiarity were associated with the DMN [16]. The TPN and DMN generally demonstrate anticorrelated activation patterns, with the TPN being more active in performing external goal-oriented tasks and the DMN being more active during internally generated stimuli such as episodic memory recall and object imagination [17,18,19]. Interestingly, the anticorrelated activity between the TPN and the DMN is modulated by the SN, with DMN activity being attenuated and TPN activity being strengthened when the SN is activated [20]. This switching behavior between the TPN and the DMN is important, as their co-activation can cause network competition and impairments in cognitive performance [8].

1.2. Analysis

Relating back to Benussi’s durations of the perception of the present, in the context of generating visual mental imagery, it is possible that the TPN and DMN play relevant roles in the experience of time during this task. The TPN may be predominantly active during the very short and short durations, where the experience of the present would be fast due to high vividness and familiarity requiring less overall activation of neural structures to generate the image. Conversely, the DMN may be predominantly active during the long and very long durations, requiring wider network activations involved in episodic memory recall to compensate for low vividness and familiarity. In this context, the SN-modulated network switching may occur at the intermediate duration intervals.
To analyze this hypothesized pattern, the present approach draws from a combination of the traditional connectionism school of parallel distributed processing and symbolic simulation or “cognitive modeling” in cognitive science and computational neuroscience [21]. In particular, our starting point is the pioneering theory of high-level processing subsystems formulated by Kosslyn [22] for mental imagery. The sub-subsystems are modules which represent specialized and organized neural networks and are implemented as essential single functional “neurons” (see, for example, early studies on brain damage simulations [23,24,25]).
The goal of this approach, also known in cognitive computational neuroscience as the hierarchical decomposition constraint (HDC, [26]), is to implement into an essential small neural network the dynamics of relationships between high-level subnetworks. Its rationale corresponds to first deriving hypotheses on functional components of macro neural networks, to understand higher-level “top-down” properties of the brain (e.g., perception, memory, associated behavioral outputs, etc.) while still tolerating incomplete understanding of the more elementary micro-level neuron description (e.g., biochemical, synaptic, etc.) [27].
Our approach however follows current advances on HDC as we do not assume that a single, uncomplicated neuron (positioned within the hidden layer) possesses the capacity to emulate the functionality of a macro neural network. Rather, our rationale is based on three theoretical postulates supported by current neurocomputational research. Firstly, single neurons conceived as complex non-linear dynamic systems [28] themselves can emulate the functionality of macro scale entire neural networks [29]. Secondly, current methods routinely implement reconstruction of effective neural connectivity from neurophysiological signals by assuming that single artificial nodes/neurons validly represent much wider anatomical areas at an exceedingly higher size scale (for example see [30]). Finally, the universal function approximation theorem [31] has been demonstrated with artificial neural networks with one hidden layer including very few nodes (see proof of principle in [32]), and more specifically, two hidden nodes [33]. The latter suggests that, in principle, one hidden layer that possesses a sigmoidal activation function, and a linear output layer, should be able to approximate a variety of complex functions with optimal level of accuracy, provided the minimal number of hidden neurons. We describe this type of architecture in more detail below.

1.3. Test and Evaluation

Consistent with our updated version of HDC, to test whether the proposed three-network architecture might reproduce activation patterns consistent with Benussi’s perceptual model of the present, we implemented a multilayer perceptron (MLP) for classification-tasks with one hidden layer comprising three hidden nodes. An MLP is a feed-forward neural network that approximates network parameters to predict an output based on input data [34]. In our MLP, the single hidden layer’s nodes linearly combine the input layer’s contents, apply a non-linear activation function, and forward the results to the output layer. The output layer utilizes these results as probabilities for class membership predictions. During training, a loss function is computed on the predicted vs. true class. The loss function gradient is back-propagated through the MLP, and the network weights are iteratively updated with an optimization algorithm. Once the loss function reaches convergence, the network connection weights are finalized, and the MLP is tested on new data to evaluate generalizability of the model.
By designing an MLP with one hidden layer containing three nodes, we may directly evaluate whether each node can represent one of the three networks (TPN, DMN, and SN). Technically, it has previously been demonstrated that neural networks that contain only one hidden layer can successfully approximate any continuous function, as long as there are enough nodes in the hidden layer [31]. By designing our hidden layer with three nodes, we ensure that there are sufficient effective connections, as the success of our MLP’s classification performance relies on each of these three nodes to specialize in predicting one of Benussi’s subjective time durations.
Thus, on the one side the present architecture hypothesizes from HDC a rather generic functional connectivity (i.e., symmetric anatomical activity: what’s firing together and what’s not for a given time point). However, on the other side, this architecture allows us to have the most transparent approach to effective connectivity (i.e., directed anatomical activity: this region causes this region to fire later) which is the most appropriate property to validly interpret the relationships of dependence between sub-networks of interest.
Here, we follow a widely growing methodological strategy in deep learning of applying constraints that are interpretable; essentially, by emphasizing a fully interpretable neural network design we make claims based on the weights under those constraints. In the literature, there are many examples of these “regularization” approaches on the network’s weights/loss function [35,36,37]. More specifically, our approach is more in line with theoretically motivated neuroanatomical and neurofunctional constraints in the design of the architecture of the network to make biologically plausible claims based on network structure (as in for example [38,39]).
In relation to the three neural networks, we expect the node representing the TPN to obtain the largest connection weight when correctly predicting very short and short durations and the smallest connection weight when correctly predicting long and very long durations. We expect the node representing the DMN to obtain the largest connection weight when correctly predicting long and very long durations and the smallest connection weight when correctly predicting short and very short durations. As for the node representing the SN, we expect to see a regression slope in connection weight changes across all Benussi levels that is consistent with positive correlation with the TPN weight changes and negative correlation (anticorrelation) with the DMN weight changes, respectively.
Thus, the node representing the SN should obtain its largest connection weight when correctly predicting very short and short durations and its smallest connection weight when correctly predicting long and very long durations. These patterns of activity for all three hidden nodes would reflect the relationship between the three networks that has been uncovered in functional imaging studies [40].
To our knowledge this is the first time that phenomenology aspects of mental processing are simulated mechanistically and precisely via neural network implementation.

2. Materials and Methods

2.1. Dataset and Preprocessing

A secondary analysis was conducted on a dataset of 11,012 trials originally collected to compare latency and vividness ratings while generating visual images of different sizes (1.2° and 11°) [41]. Participants were asked to produce mental images of objects from a list of words. Once each object was sufficiently imagined, participants stopped a timer to record their reaction time durations. Participants were then asked to rate the vividness of their mental image. Reaction time durations were used to assign each trial to one of five subjective time categories derived from Benussi’s framework [4]: Level 1 = “very brief” (0–243 ms), Level 2 = “brief” (244–608 ms), Level 3 = “present” (609–1125 ms), Level 4 = “long” (1126–2070 ms), and Level 5 = “very long” (≥2071 ms). To address overlaps in Benussi’s original categories, the midpoint of each overlapping range was used as the boundary and the fastest category was extended to include all trials from 0 ms onward. Class membership for each Benussi level were as follows: Level 1 n = 327, Level 2 n = 2129, Level 3 n = 2529, Level 4 n = 2023, and Level 5 n = 4004. In order to maintain the frequency of the observed laboratory results, the dataset was not balanced. Data was split into a 70% training partition (n = 7708), a 15% validation partition (n = 1652), and a 15% hold-out test partition (n = 1652).

2.2. Multilayer Perceptron Model

An MLP was implemented in Python to predict the Benussi time categories from reported imagery vividness levels and reaction times. The full Python script is available in Appendix A.1. The MLP network structure diagram is displayed in Figure 1. The network architecture was structured as follows:
  • Input Layer: Five nodes representing factors of vividness levels (1 = No Image to 5 = Very Vivid), one standardized (z-score normalized) reaction time covariate node, and an additional bias node. The five vividness inputs were one-hot encoded so that for each trial, only one vividness node carried a value of 1 and the remaining four carried a value of 0. The standardized reaction time covariate node would typically pass a non-zero value, except in cases where it equalled the sample mean;
  • Hidden Layer: A single layer comprising three nodes with sigmoid activation and an additional bias node;
  • Output Layer: Five nodes corresponding to the Benussi categories (1 = very short durations to 5 = very long durations) using a softmax activation function with categorical cross-entropy as the loss measure. As the Benussi categories were encoded as distinct classes (through one-hot encoding), there was no need to numerically rescale the dependent variables.
Model training employed the Adam optimizer using default momentum parameters (β1 = 0.9, β2 = 0.999 and ε = 1 × 10⁻⁷) [42]. A learning rate of 0.01 over 1000 epochs was selected with a batch size of 32. Early stopping monitored the validation loss with an absolute patience of 30 epochs, a relative patience of 20 epochs, a maximum training time of 15 min, and a minimum relative change in validation loss of 0.0001. All evaluated trials contained complete data (no missing values in reaction time or vividness fields); therefore, no handling or imputation of missing values was necessary. Given the moderate size of the dataset (n = 11,012), all trials were loaded at once during model training, and no additional memory management strategies were required.
A 15% hold-out test partition (n = 1652) was removed from the sample data before training began. To assess robustness of the model, the remaining 85% of data was subjected to k-fold cross-validation (k = 5). Each fold used the standard 4-to-1 data split (80% training, 20% validation) and stratified sampling to manage imbalanced vividness levels. Early stopping occurrences, average accuracy, and average loss were reported once k-fold cross-validation terminated.
After cross-validation, the same 85% of data was split into 70% of the full dataset for training (n = 7708) and 15% for internal validation (n = 1652), and the final model fitting stage began. Afterwards, the trained model was evaluated on the 15% hold-out test partition (n = 1652). Performance metrics included mean training and validation set loss and accuracy, precision, recall, F1-scores, area under the receiver operating characteristic (ROC) curve, and a confusion matrix.
Mean training and validation loss were determined by calculating the standard categorical cross-entropy loss (Equation (1)) [43] for each sample, then averaging the loss over all samples in the training and validation folds, respectively. The standard categorical cross-entropy loss function is as follows:
J c c e = 1 M k = 1 K m = 1 M y m k × l o g h θ x m , k
where M is the number of fold samples, K is the number of classes, y m k is the target label for training example m for class k, x is the input for fold sample m, and h θ is the model with neural network weights θ [43].
Precision, recall, and F1-scores were calculated as follows:
P   =   T P T P   +   F P ,           R   =   T P T P   +   F N   ,           F 1   =   2 P R P   +   R
where TP represents true positive predictions, FP represents false positive predictions, and FN represents false negative predictions [44].
The area under the ROC curve was calculated using the following formula:
A U C f , D 0 D 1   =   t 0 D 0   t 1 D 1   1 f t 0 < f t 1 | D 0 | | D 1 |
where   D 0 is a set of negative examples, D 1 is a set of positive examples, and 1 f t 0 < f t 1 is an indicator function that returns 1 if f t 0 < f t 1 and returns 0 if not [45]. Model implementation was performed in Python 3.10 using TensorFlow 2.12, Scikit-Learn 1.2, and the Keras 3 API. All training was conducted on a standard desktop computer without GPU acceleration. To ensure reproducibility of MLP results, deterministic execution was enforced by (i) setting the environment variables PYTHONHASHSEED = 42, TF_DETERMINISTIC_OPS = 1, and TF_ENABLE_ONEDNN_OPTS = 0 before TensorFlow was imported; (ii) seeding all random-number generators (Python random, NumPy, and TensorFlow) to 42 via tf.keras.utils.set_random_seed; and (iii) restricting TensorFlow to a single inter- and intra-op thread. Within each cross-validation fold the same seed (42 + fold index) was reapplied, ensuring identical weight initialization across runs while keeping folds independent. Mini-batch order was fixed (shuffle = False). These measures made every execution of the MLP script reproducible on any CPU-only machine.

2.3. Analysis of Hidden Node Weights

Once the MLP was generated and evaluated, the weights of the three hidden nodes across all Benussi levels were plotted in a line graph (Microsoft Excel 365) to visually inspect directional changes. Separate simple linear regressions (Python 3.10, statsmodels v0.14) were fit to each node’s weight vector to obtain its unstandardized slope, standard error, t-statistic, two-tailed p-value, 95% confidence interval, and adjusted R2.
Pair-wise differences between slopes were tested with Welch’s t-test for independent coefficients (df = 6). We report slope differences, standard error, t-statistic, two-tailed p-value, 95% confidence interval, Cohen’s d, and the upper Bayes Factor, as described by Benjamin and Berger [46]. Prior odds H1:H0 were set to 1:1, so the obtained upper Bayes Factor equalled the posterior odds.
For each hidden node pair, we performed Pearson’s correlation analysis (n = 5, df = 3). We report Pearson’s r, two-tailed p-value, 95% confidence interval, and upper Bayes Factor.
All analyses were performed in Python 3.10. The full script is available in Appendix A.2. Spreadsheets were exported to Excel with pandas v2.2. Printouts of the data analysis results are available at https://doi.org/10.5281/zenodo.16623955 (accessed on 4 June 2025).

3. Results

3.1. Accuracy and Loss

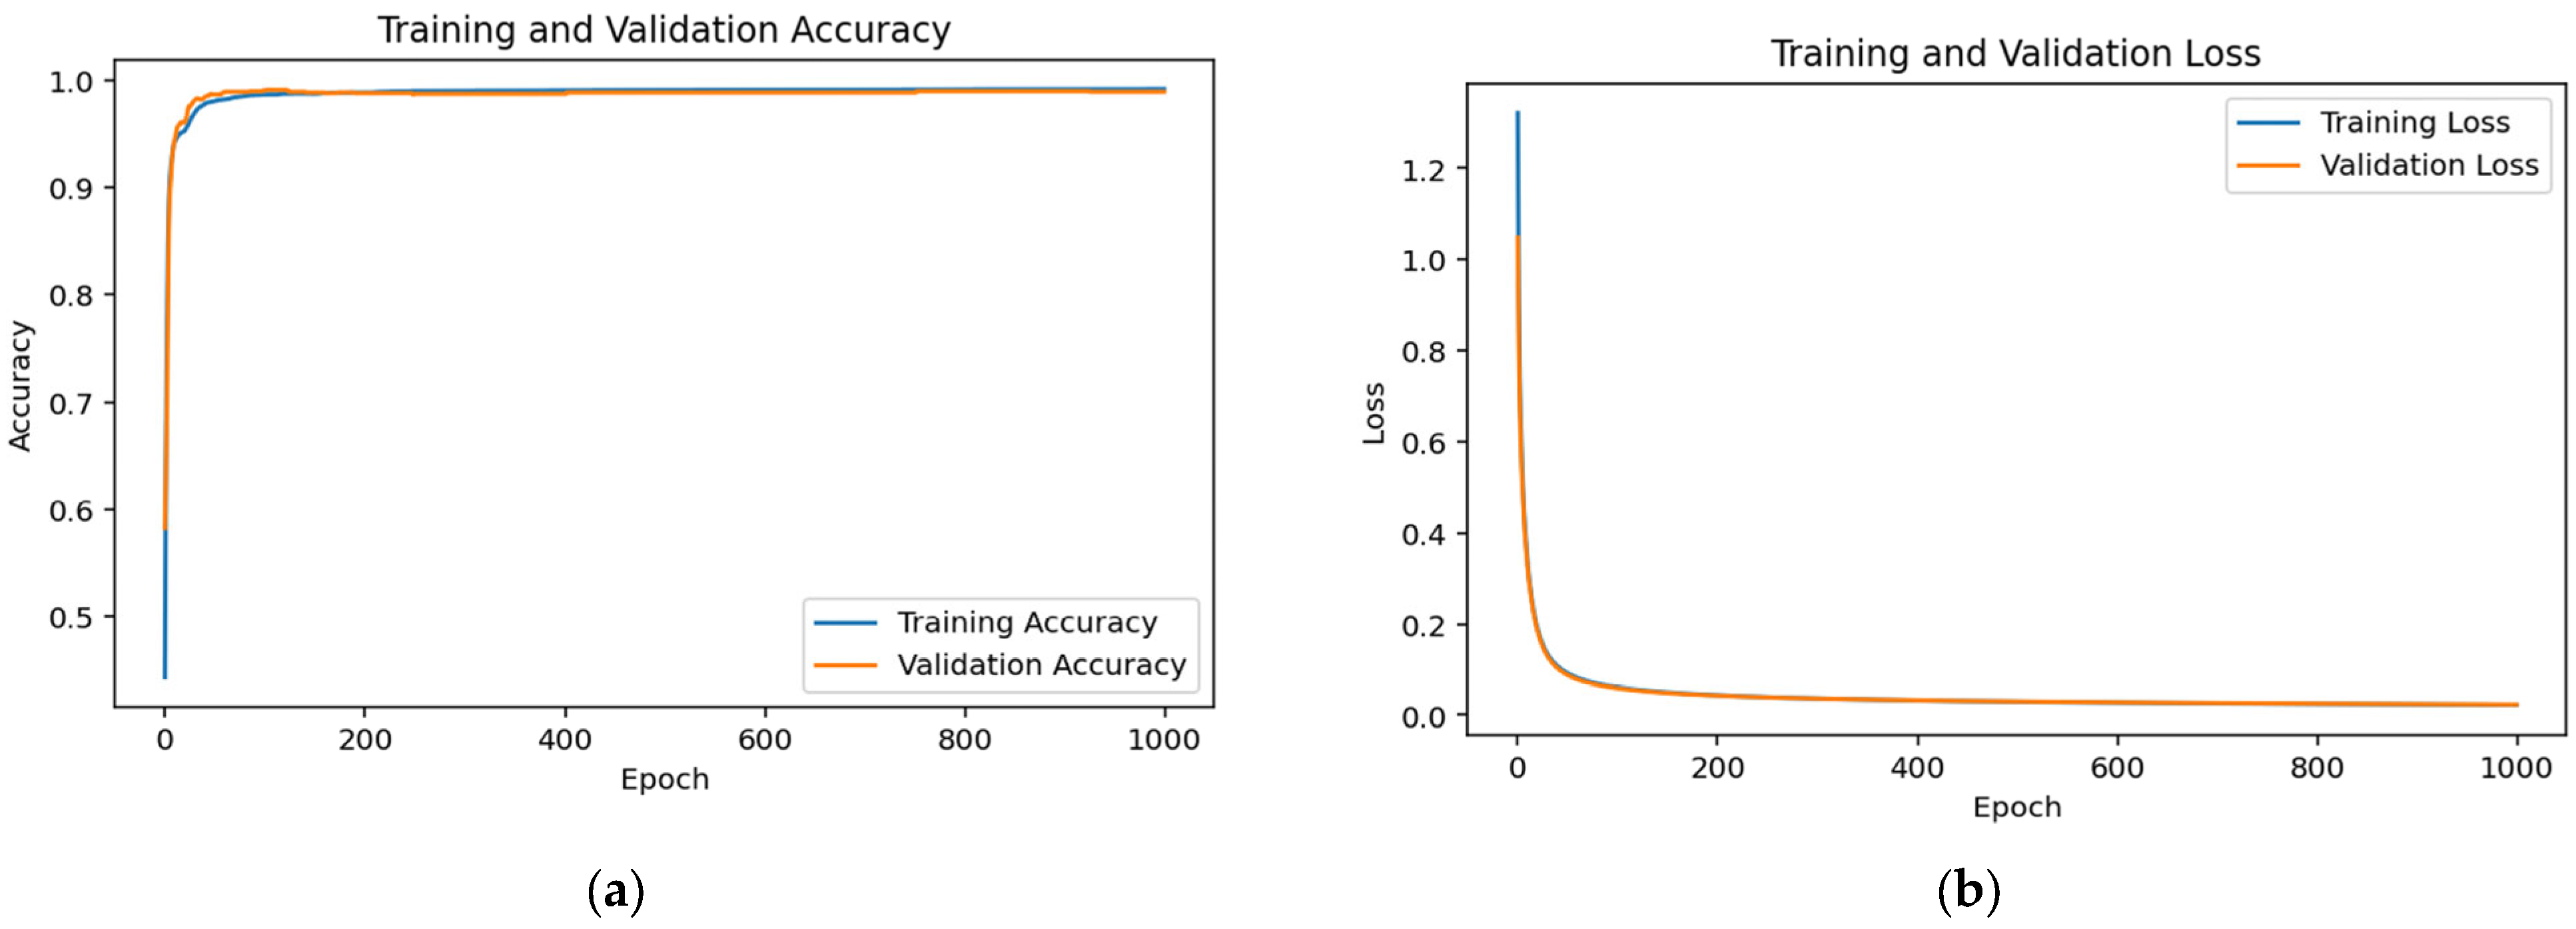
The MLP model achieved a training accuracy of 99.17% (loss = 0.0223), a validation accuracy of 98.91% (loss = 0.0231), and a holdout test accuracy of 99.21% (loss = 0.0191). Five-fold cross-validation produced an average validation accuracy of 99.21% (loss = 0.0218), confirming that the model generalized well to unseen data and that it was not just memorizing patterns in the original dataset. The learning curves for the MLP model are displayed in Figure 2. Early stopping did not occur during any segment. Both the accuracy (Figure 2a) and loss (Figure 2b) curve sets demonstrated a high degree of convergence between the training and validation phases. The lack of divergence between curve sets indicates that overfitting was not an issue for during training, suggesting that the model generalized well to the validation data.

3.2. Precision, Recall, and F1-Score

The MLP model’s additional performance metrics are displayed in Table 1. On the unseen test set, model precision and recall met or exceeded 97% for all Benussi levels. F1-scores for all levels met or exceeded 99%. Overall model performance on the unseen test set, whether using a macro mean or a weighted mean, was 99% for precision, recall, and F1-scores.

3.3. ROC Curve

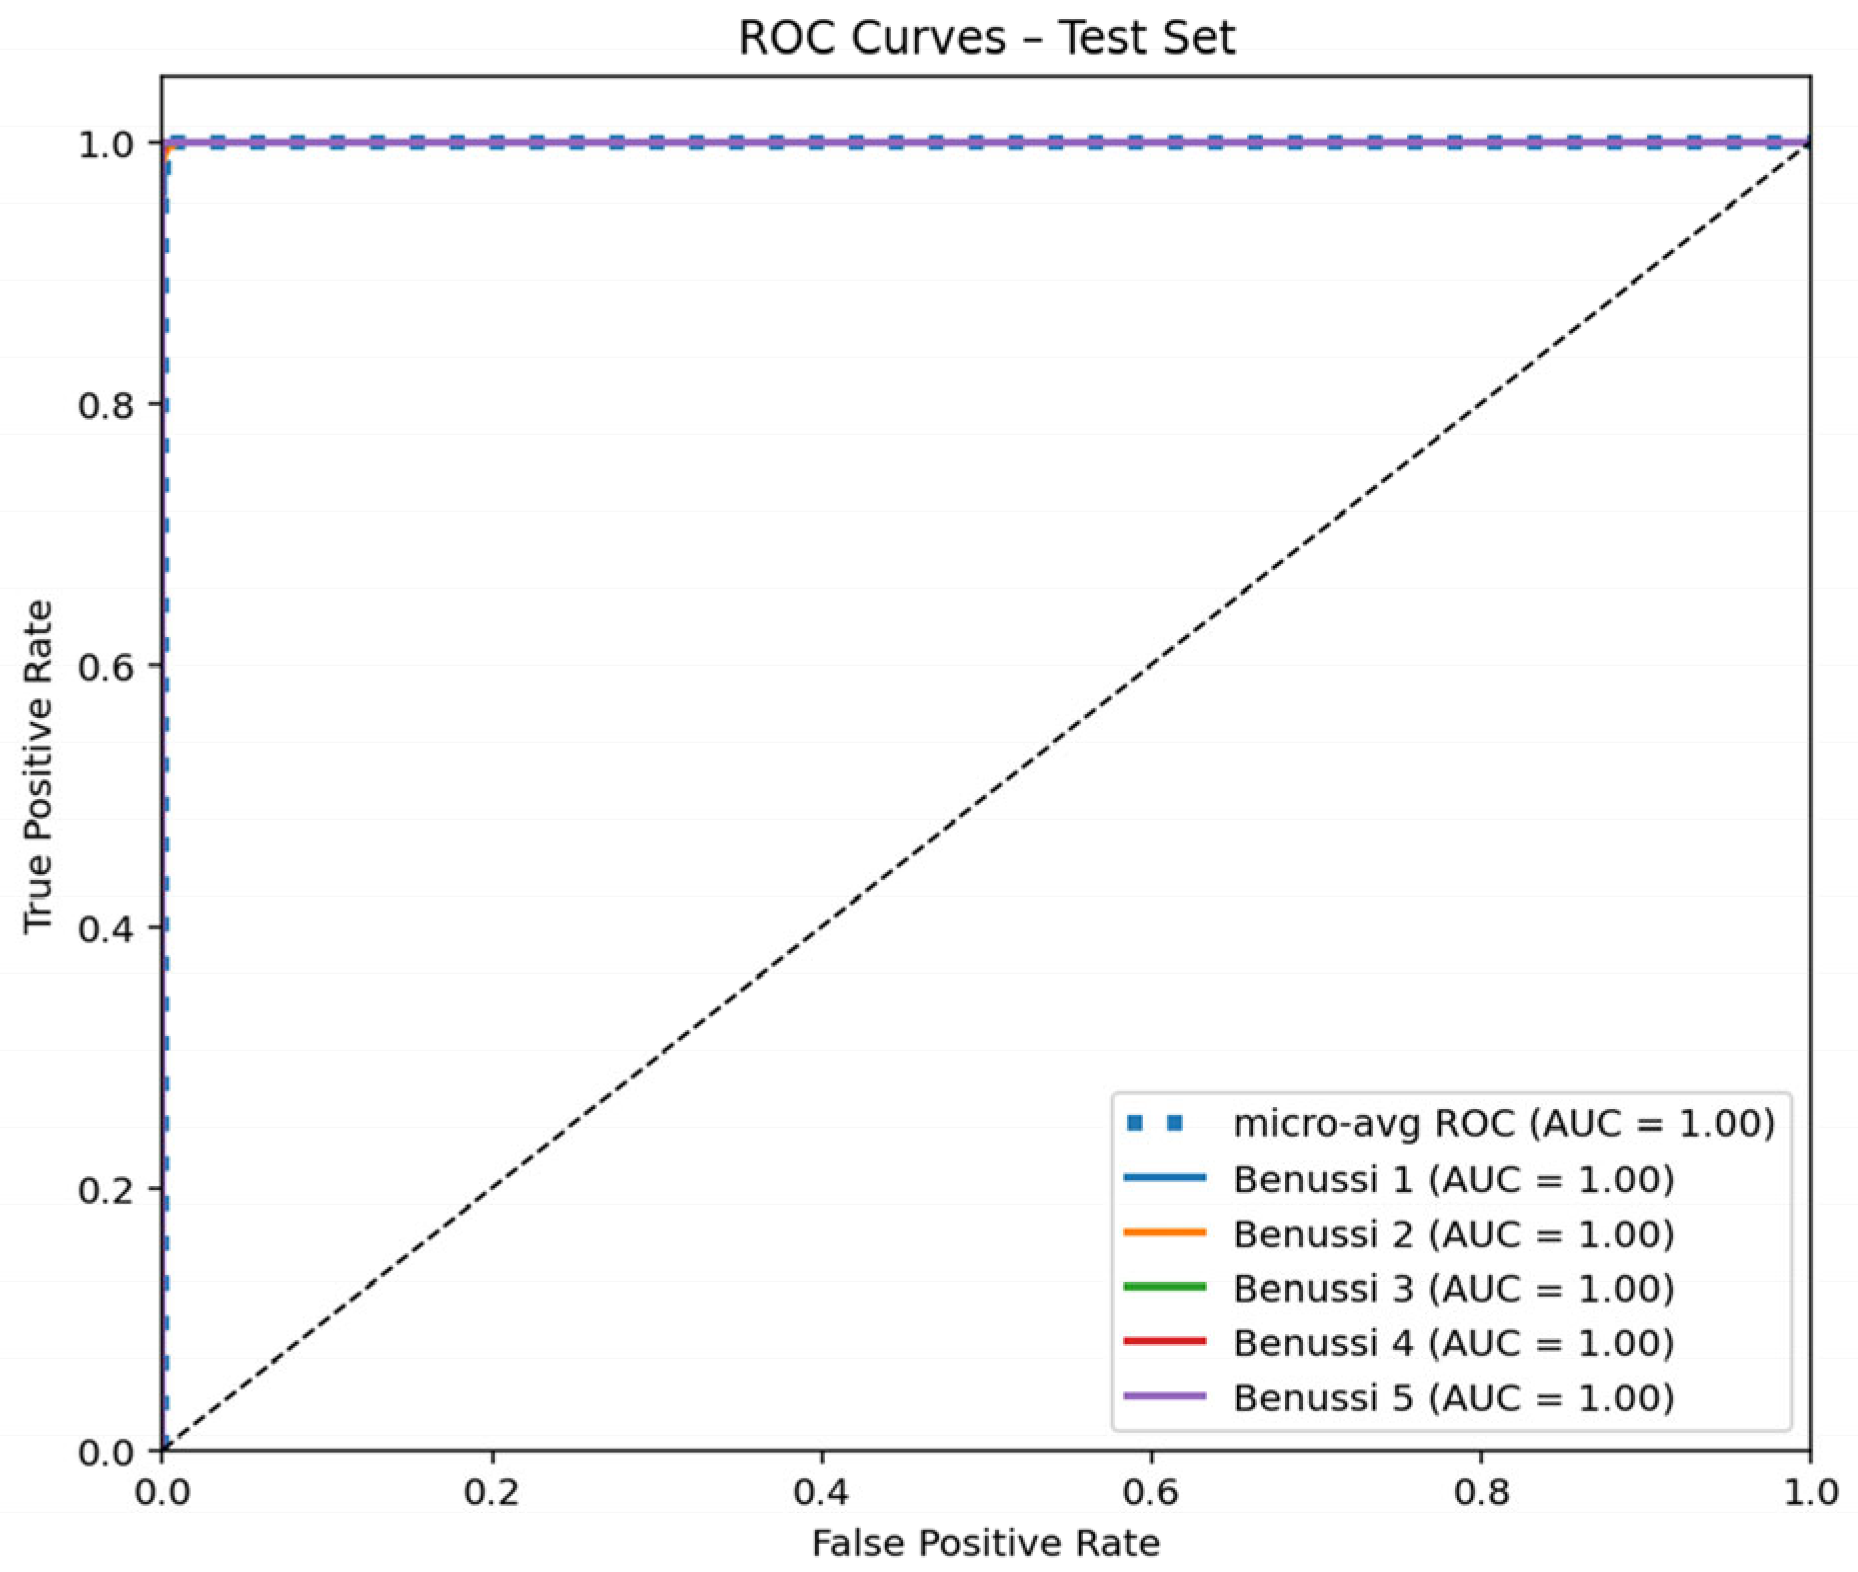
The ROC curve depicts the performance of the MLP model during the validation phase by demonstrating the balance between the true positive rate (the proportion of actual positives correctly identified, plotted on the y-axis) and the false positive rate (the proportion of actual negatives that are incorrectly identified as positive, plotted on the x-axis) [47]. A curve that approaches the top-left corner indicates a high true positive rate and a low false positive rate, reflecting ideal model performance. In contrast, a curve that lies close to the diagonal line suggests that the model performs no better than random chance [47]. The model’s overall ability to correctly discriminate between each Benussi level can be assessed by calculating the area under the curves (AUC). An area closer to 1.00 indicates better performance.
The ROC curve for the model is displayed in Figure 3. All Benussi levels achieved AUCs equal to 1.00, suggesting that the model performed ideally for classifying all levels.

3.4. Confusion Matrix

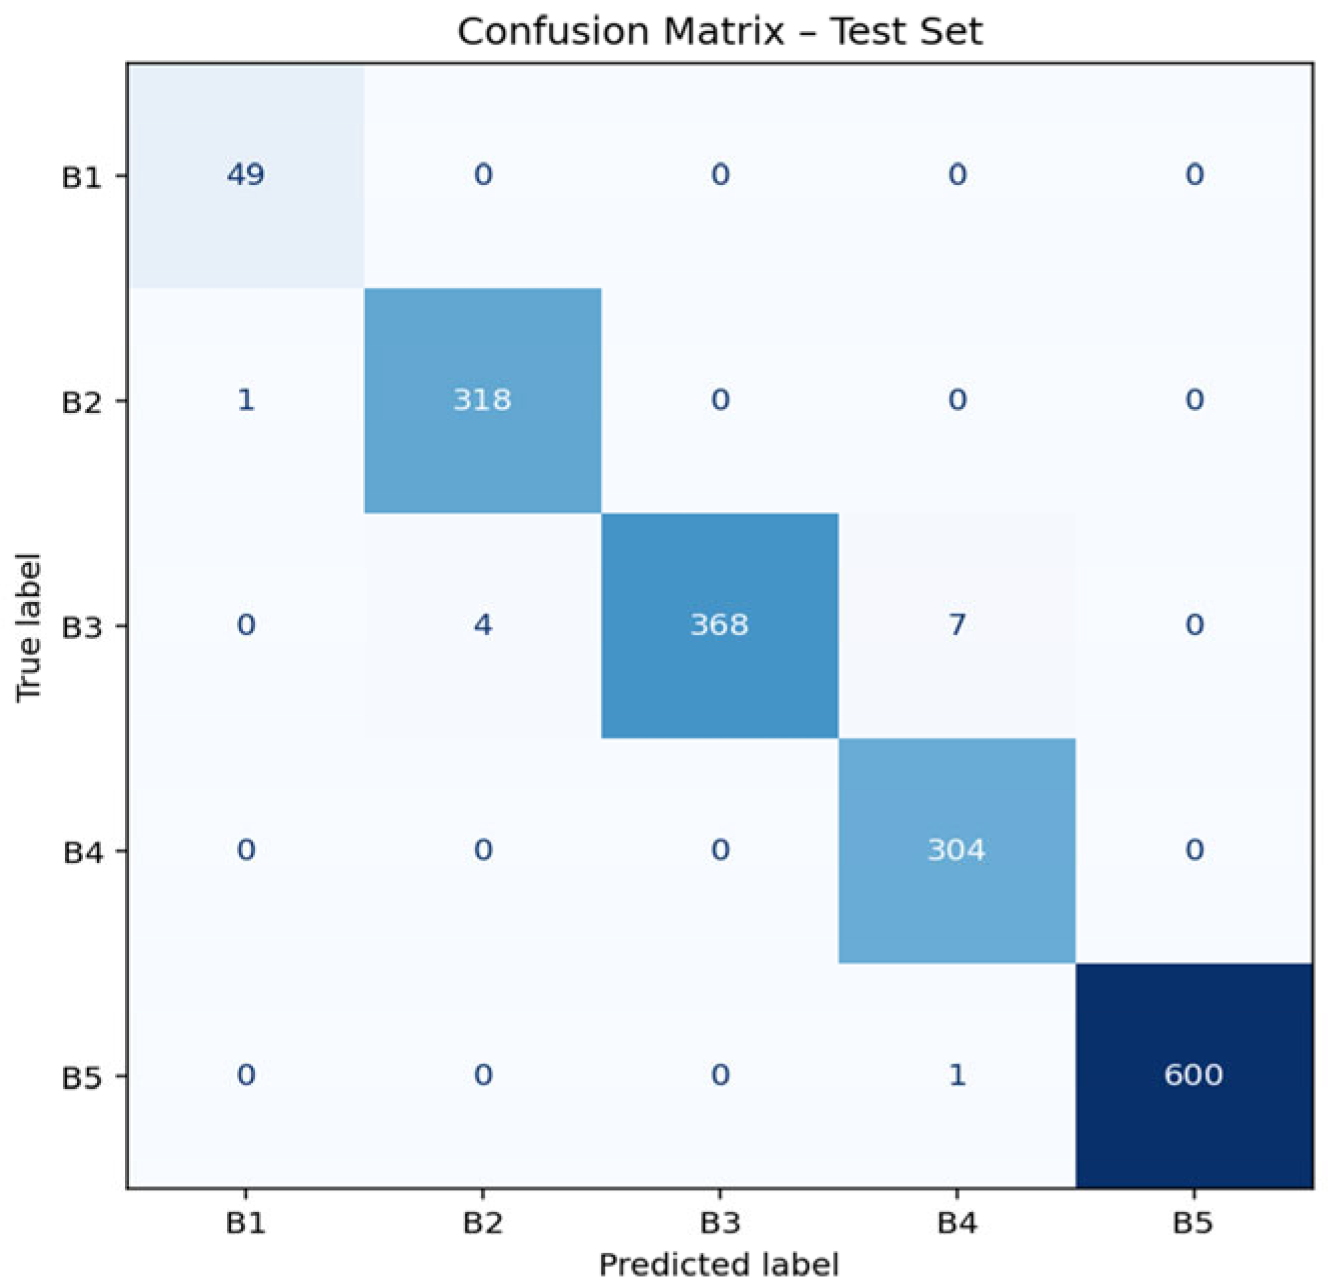
Figure 4 depicts the confusion matrix results for the MLP model on the holdout test set. The majority of predictions were contained within the diagonal, revealing that the model correctly classified most samples. Singular instances of misclassifications occurred between Benussi Levels 1–2 and Levels 4–5. More commonly, Benussi Level 3 was misclassified as Levels 2 or 4, possibly due to class imbalance, but misclassification, in general, was rare. Overall, the near-diagonal pattern of the confusion matrix indicates high accuracy and reliability of the classifier across all Benussi levels.

3.5. Correlation Analysis of Hidden Node Weights

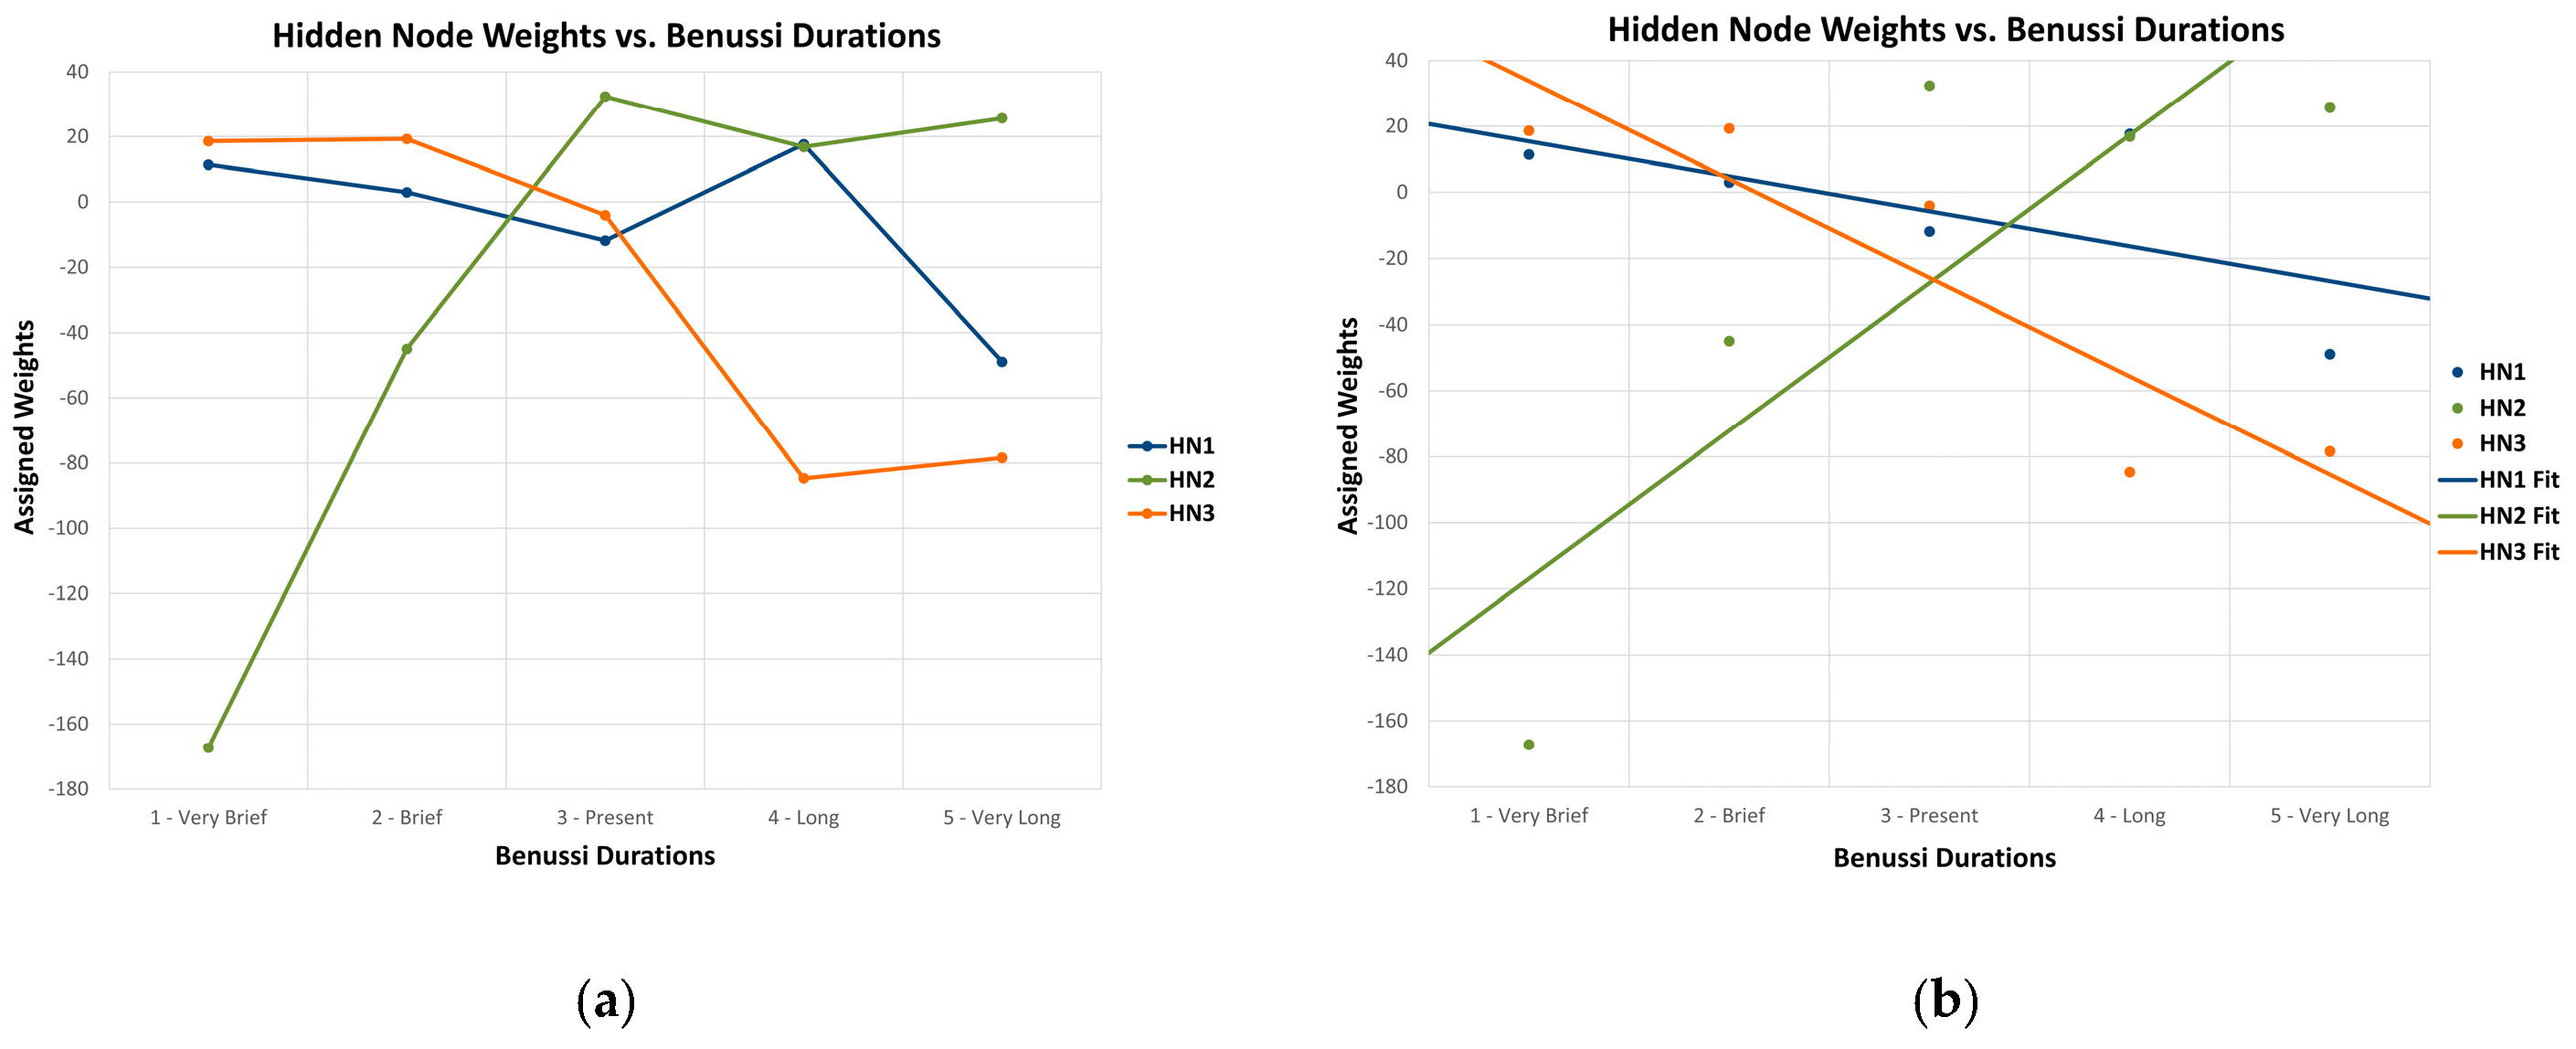
Figure 5 depicts a line graph of the weights of the MLP’s three hidden nodes across all five Benussi levels (Figure 5a) and its associated regression graph (Figure 5b). Upon visual inspection, the graphs would suggest that hidden nodes 1 and 3 may be correlated with one another while both may be anti-correlated with hidden node 2. In Figure 5a, contrary to our expectations, only one node achieved its largest connection weights towards Benussi Level 1 and its smallest connection weights towards Benussi Level 5 (hidden node 3, orange). A second node (hidden node 1, blue) achieved its second-largest weight at Benussi Level 1, decreased towards Benussi Level 3, reversed its direction and achieved its largest weight at Benussi Level 4, before decreasing to its lowest weight at Benussi Level 5. A third node (hidden node 2, green) achieved its smallest weight at Benussi Level 1 and its largest weight at Benussi Level 3, before fluctuating between Benussi Levels 4–5.
To test whether each hidden node changed monotonically across Benussi levels, we fit separate simple linear regressions of node weight on Benussi level. The results are presented in Figure 5b and Table 2. Slope analysis demonstrated that Benussi levels significantly predicted the weights of hidden node3 (β = −29.805, SE = 7.816, t(3) = −3.813, p = 0.032, 95% CI [−54.680, −4.930], Adjusted R2 = 0.772). Hidden node 1 failed to reach significance (β = −10.576, SE = 7.514, t(3) = −1.407, p = 0.254, 95% CI [−34.490, 13.338], Adjusted R2 = 0.197). Hidden node 2 reached marginal significance (p < 0.10, and p = 0.035 if one-tailed directionality is assumed), although the adjusted R2 suggests a proportion of variance was explained (β = 44.750, SE = 16.510, t(3) = 2.710, p = 0.073, 95% CI [−7.792, 97.293], Adjusted R2 = 0.613).
Next, to determine whether the obtained slopes of each hidden node weights were statistically different from one another, we performed a Welch’s t-test for independent slopes (n1 = n2 = 5, df = 6). Obtained p-values were converted to upper Bayes Factors using methods described by Benjamin and Berger [46]. Because the prior odds of H1:H0 were 1:1, the obtained upper Bayes Factor values were equivalent to posterior odds of H1:H0.
The results are presented in Table 3. Comparison between the negative-sloped hidden nodes 1 and 3 (∆β = 19.229, t(6) = 1.774, p = 0.127, BF10 = 1.407) demonstrated a 1.41:1 odds in favor of H1 over H0, resulting in near-equal likelihood, and is therefore uninformative [48]. Cohen’s d for this comparison was 1.448, indicating a very large effect size. Comparison between hidden nodes 1 and 2 (∆β = −55.326, t(6) = −3.050, p = 0.023, BF10 = 4.307) resulted in a 4.31:1 odds in favor of H1 over H0, providing positive evidence against the null hypothesis [48]. This comparison’s Cohen’s d was −2.490, indicating a very large effect size. Comparison between hidden nodes 2 and 3 (∆β = 74.555, t(6) = 18.267, p = 0.006, BF10 = 11.250) resulted in an 11.25:1 odds in favor of H1 over H0, providing positive evidence against the null hypothesis [48]. This comparison’s Cohen’s d was 3.332, also indicating a very large effect size.
To assess the validity of the directionality (positive correlation or anticorrelation) of how the hidden nodes co-vary across Benussi levels, we computed pair-wise Spearman non-parametric correlations among the weight vectors, which replicated the same direction of effects shown by the parametric slopes, indicating that the above results cannot be explained by violation of normality or distribution skew associated with the small n of hidden nodes.
Finally, our coefficients for Pearson’s correlation analysis demonstrated medium anticorrelated effect sizes between hidden nodes 1 and 2 and between hidden nodes 2 and 3, and a medium positive correlated effect size between hidden nodes 1 and 3. These values were potentially inflated. However, the Pearson’s r effect sizes were within the bounds of those generally reported in the literature (see, for example, [49,50]), lending further converging evidence of validity to our model.

4. Discussion

In the present study, we investigated whether an MLP could accurately classify Benussi’s subjective time categories based on reaction times and vividness ratings collected during a mental imagery generation task. We designed an MLP architecture with a single hidden layer and three nodes to represent the TPN, the DMN, and the SN. Our MLP predicted the five subjective time categories (1 = very brief, 2 = brief, 3 = present, 4 = long, 5 = very long) based on reaction times and vividness ratings (1 = no image to 5 = very vivid) with over 97% classification accuracy, precision, and recall. Our MLP maintained this level of accuracy under k-fold cross validation (k = 5), demonstrating its robustness when performing on unseen data. The areas under the ROC curves and the confusion matrix demonstrated that our MLP has a high degree of discrimination between classes, and the learning curves (accuracy and loss) indicated minimal overfitting.
In terms of neurobiological plausibility, one potential interpretation of our hidden layer results implicates hidden node 2 as the DMN (most activated during present, long, and very long durations), hidden node 3 as the TPN (most activated during very short and short durations), and hidden node 1 as the SN (activity was positive at Benussi Level 1, slowly declined towards Benussi Level 3, then fluctuated between positive and negative values from Benussi Levels 3 to 5). The relationship between DMN and TPN node activity appeared to be anticorrelated, although the node representing the DMN did not achieve peak positive connection weight at Benussi Level 5. Furthermore, hidden node 1, intended to represent the SN, achieved a pattern that would indicate a general positive correlation with the TPN node and anticorrelation with the DMN node, complementing what was observed in the previous literature [16,20]. The relationship between the connection weights of our three nodes may implicate the modulation of two of those nodes by the third.

4.1. Multilayer Perceptron

Our MLP’s ability to validly classify Benussi’s five levels of subjective time duration provides a computational methodology that complements the field of experimental phenomenology. Gustav Fechner, a 19th century psychophysicist, was one of the first to describe that images generated from memory (termed “memory-images”) only exist within consciousness for short periods [51]. Building on the works of E. R. Clay, psychologist William James referred to this short period of consciousness as the “specious present,” describing it as a “duration-block” that is experienced as a whole, rather than as a succession of time intervals [52]. Franz Brentano, whose work was influential to Vittorio Benussi, theorized that in each instant of conscious awareness, there is a perception of the “now” as well as a simultaneous retained awareness of the instants that had just passed (referred to as “proteraestheses”), which together form a unified present [2]. As described in the introduction, Vittorio Benussi grouped these instants that make up the unified present into five time durations [5]. Alexius Meinong, a mentor of Benussi, connected temporal consciousness to perceptual vividness. He stated that vividness levels relied on the ability to consciously experience an object in brief, separated segments of time [2].
In line with the above theories, our MLP successfully illustrated a mechanism in which distinct neural network patterns (TPN, DMN, SN) are needed to produce vivid and nonvivid mental images. While the patterns of activity between the three nodes that represent these networks did not match our exact expectations, they were still sufficient in accurately predicting Benussi’s five levels. Thus, these network patterns may still represent the biologically plausible underlying neural correlates of the conscious experience of the temporal present. The distinctive activation patterns of the TPN and DMN during the generation of mental imagery suggests that each network specializes in qualitatively different types of mental imagery, dependent on imagery vividness. The difference in the effort required to generate each type of mental imagery may in turn affect subjective time perception.

4.2. Task Positive Network

The TPN was predominantly associated with the very short and short intervals of Benussi’s subjective time duration. This feature implicates the role of the TPN in very fast generations of mental images. Previous studies have demonstrated that the TPN is typically activated during tasks requiring attention focusing and rapid response generation [53,54,55], which complements our findings. In this context, the brain may capitalize on the TPN’s ability to quickly coordinate other mental processes when generating mental imagery that is of high vividness and low latency. The seemingly instantaneous generation of this mental imagery may in turn compress the subjective experience of the temporal present, causing the perceptual markers that make up the beginning, middle, and end of the present moment to become indistinguishable from one another. Such a mechanism was described by Benussi as requiring a conscious effort of “analysis” to differentiate the experience of these perceptual markers [4].

4.3. Default Mode Network

The DMN was predominantly associated with the present, long, and very long intervals of Benussi’s subjective time duration, implicating the role of the DMN in the slower generation of mental images. The DMN has previously been shown to be involved in the generation of mental imagery pertaining to constructive processes, such as integrating past experiences into imagined future events [56,57], which may complement our findings. In this context, the generation of a mental image of low vividness may initially rely on the TPN, but when the low vividness of the image cannot be rectified, the brain may gradually recruit the processes of the DMN involved in episodic memory and other imaginative processes in an attempt to maximize the vividness of the mental image. This gradual recruitment process may in turn expand the subjective experience of the temporal present, as the brain requires more time to integrate the perceptual markers that make up the beginning, middle, and end of the present moment into one coherent experience of the present. Again, such a mechanism was described by Benussi as “synthesis” [4].

4.4. Salience Network

We initially expected that the SN would show slopes consistent with positive correlation in relation to the TPN but consistent with an anticorrelation with respect to the DMN across all Benussi levels, acting as a “switch” between the two networks, mirroring the dynamic control defined in previous studies [15,20,40]. Generally, when a salient stimulus or event occurs, the SN activates to coordinate the recruitment of the TPN for external focused attention [13] or the recruitment of the DMN for introspective processing [58]. In the context of our study, we theorized that the SN would evaluate the initial vividness at which a mental image was generated. The SN would hypothetically determine whether the TPN alone was sufficient in generating vividness, or whether a shift towards DMN activation was necessary to increase vividness.
With an exception at Benussi Level 4, the resultant network connection weights of our SN revealed our expected trend for correlation/anticorrelation with the other two networks across Benussi levels: it appeared that the SN node (hidden node 1) had greater activation at Benussi Level 1, diminishing activation towards Benussi Level 3, and then fluctuations in activity between Benussi Levels 4–5, including peak activation at Benussi Level 4. This trend implicates the SN as attaining greatest activation during a moment in which it should be diminishing in activity, similar to what is seen with the TPN, during slower mental imagery generation of lower vividness. Interestingly, the sudden peak for the SN at Benussi Level 4 corresponds with both the greatest reduction in the TPN node weight as well as a sudden reversal of direction of the weight for the DMN, implying the SN caused a degree of attenuation of both nodes. By Benussi Level 5, the SN resumes its diminishing trend, and both the TPN and the DMN slightly increase in weight magnitude. This unexpected behavior of the SN node’s activation pattern suggests that the SN’s role in modulating the generation of mental imagery may be more complex and non-linear than we anticipated.
It is possible that, instead of acting as a linear “switch” between the TPN and DMN, the SN may be more involved in specific subfeatures of the imagery generation task (i.e., emotional relevance of the object to be imagined), rather than the speed of which the image is generated. This involvement of the SN may in turn shape the way in which it modulates TPN and DMN activity, which may not correspond linearly to fast vs. slow image generation. The complexity of the SN in this context contrasts the original simplistic view that SN activation is correlated with TPN activation and DMN deactivation in response to salient stimuli [59], as in this context, the salient stimulus is generated internally.

4.5. Future Research Directions

Our synthesis of computational modeling, functional neuroanatomy, and temporal phenomenology provides a number of potential directions for future research. Our proposed model of TPN, DMN, and SN activation patterns during the generation of mental imagery of varying vividness could be verified through neuroscientific experiments that utilize functional neuroimaging (i.e., fMRI) during task performance. If our model is correct, we would expect to see peak TPN activity correlating with highly vivid, very fast generations of mental imagery, and peak DMN activity correlating with low vivid, very slow generations. This technique can also provide a clearer role for the SN in our model. Perturbation experiments may be another future direction, in which SN functioning could be disrupted through techniques such as transcranial magnetic stimulation to observe the effects on perceived imagery vividness and subjective time perception. Our choice of a simple feed-forward model (MLP) also offers a novel direction for future research. Neural networks of higher complexity that are capable of interpreting timing dynamics and gating mechanisms, such as recurrent neural networks or long short-term memory networks, may provide a greater insight into the contexts in which the SN switches between the DMN and the TPN. Finally, our results may provide a new direction for phenomenological research. Given that the DMN and TPN showed predominant activity at different extremes of Benussi’s subjective time durations, it is worth investigating whether the specious present may be subdivided into a shorter, content-rich, salience-driven specious present and a longer, introspective specious present.

4.6. Limitations to Methodology

There are a few limitations to our methodology. For example, our data contained unbalanced groups (Figure 4; Benussi Level 1 n = 49; Level 5 n = 600), which may have biased our MLP to predict Level 5 more frequently and Level 1 less frequently. Additionally, the pseudo-linear relationships between our hidden node weights (Figure 5) should be interpreted with caution: we would expect to see the TPN and SN to have positive values (indicating activity) and the DMN to have negative values (indicating attenuation) for Benussi Level 1, with the inverse relationship for Benussi Level 5. While we did observe this general trend, each node exhibited non-linear fluctuations in their weight values towards Benussi Levels 4 and 5: the TPN (hidden node 3) reached its negative peak weight at Benussi Level 4 before slightly increasing towards Benussi Level 5; the DMN reached its positive peak weight at Benussi Level 3, reduced slightly towards Benussi Level 4, and then increased slightly towards Benussi Level 5; and the SN reversed its negative direction to achieve a positive peak at Benussi Level 4 before reaching its negative peak at Benussi Level 5.
Also, while the node that represents the SN appears to behave pseudo-linearly in its activation across all Benussi levels, this may not represent how the SN performs in the brain. SN-mediated network switching between the TPN and DMN has previously been described as a transient burst of activity [11], rather than a linear activation [20]. Finally, more granular work is needed to further confirm the generalizability of the specific neurobiological identity (i.e., DMN, TPN, or SN?) of the hidden nodes and the related novel dynamics of dependency we have preliminarily uncovered. Our findings are sufficient to warrant the obvious way forward for future studies in suggesting further tests based on a deep architecture version of our model with more extensive experimental phenomenological data from humans and the full-blown neuronal power afforded by spiking recurrent convolutional models as well as folded-in-time single neuron architecture using feedback-modulated delay loops (see [29]).

5. Conclusions

This study demonstrates the potential utility of a simple multilayer perceptron (MLP) architecture for modeling subjective time perception as a function of mental imagery vividness and reaction times. By mapping Benussi’s five levels of subjective time duration onto the activation patterns of three hidden nodes, representative of the task positive network (TPN), the default mode network (DMN), and the salience network (SN), we offer a novel computational approach to experimental phenomenology. Despite some deviations from the expected behaviors of our nodes, the MLP achieved near-perfect classification accuracy. These results provide quantitative proof to support Benussi’s model, suggesting that the neural mechanisms underlying subjective time perception may follow structured, predictable patterns generated by large-scale network dynamics within the brain.
Our findings challenge the traditional assumption of the triple network model that defines the SN as a switch that co-activates the TPN and deactivates the DMN during task-based performances. Instead, we found that the SN’s relationship with the TPN and DMN is more complex in the context of mentally generated imagery, potentially reflecting salience tied to emotional content or cognitive effort. These results provide a foundation for future neurocomputational models, including temporally sensitive neural networks, to better simulate the dynamics of conscious experience. Additionally, our presented approach may inspire future interdisciplinary collaborations between cognitive neuroscience, artificial intelligence, and phenomenology, ultimately advancing our understanding of the temporal structure of human consciousness.

Author Contributions

Conceptualization, M.S. and A.D.; methodology, M.S. and A.D.; software, M.S.; validation, M.S. and A.D.; formal analysis, M.S. and A.D.; investigation, M.S. and A.D.; resources, M.S. and A.D.; data curation, M.S.; writing—original draft preparation, M.S. and A.D.; writing—review and editing, M.S. and A.D.; visualization, M.S.; supervision, A.D.; project administration, M.S. and A.D.; funding acquisition, A.D. All authors have read and agreed to the published version of the manuscript.

Funding

This research received no external funding.

Data Availability Statement

https://doi.org/10.5281/zenodo.16623955 (accessed on 4 June 2025).

Acknowledgments

The authors would like to thank Adam Reeves and Rizwan Shareef for their contributions to this study. During the preparation of this study, the authors used ChatGPT version 5 AI software for the purpose of generating a customizable multilayer perceptron architecture. The authors have reviewed and edited the output and take full responsibility for the content of this publication. We would like to thank the three anonymous reviewers for their comments and suggestions which were key to improve our paper.

Conflicts of Interest

The authors declare no conflicts of interest. The funders had no role in the design of the study; in the collection, analyses, or interpretation of data; in the writing of the manuscript; or in the decision to publish the results.

Abbreviations

The following abbreviations are used in this manuscript:
HDCHierarchical decomposition constraint
MLPMultilayer perceptron
TPNTask positive network
DMNDefault mode network
SNSalience network
ROCReceiver operating characteristic
AUCArea under the curve

Appendix A

Appendix A.1. MLP Python Script

   import os
   # <<< NEW: define seed and set env vars BEFORE any TF import
   seed = 42
   os.environ[“PYTHONHASHSEED”]       = str(seed)      # Python hash seed
   os.environ[“TF_DETERMINISTIC_OPS”] = “1”            # TF deterministic ops (>=TF2.13)
   os.environ[“TF_ENABLE_ONEDNN_OPTS”] = “0”           # disable oneDNN non-determinism
   os.environ[‘TF_CPP_MIN_LOG_LEVEL’] = ‘2’  # only show errors, hide INFO and WARNING
   # Standard libs
   import random
   random.seed(seed)                             # seed Python RNG
   import time
   import datetime


   # Data libs
   import pandas as pd
   import numpy as np
   np.random.seed(seed)                          # seed NumPy RNG


   # TensorFlow import & determinism setup
   # Note: Requires using tf.keras; ensure you’ve uninstalled standalone ‘keras’ package
   #       pip uninstall keras
   import tensorflow as tf                       # MUST follow env vars & RNG seeds
   try:
       tf.keras.utils.set_random_seed(seed)      # TF >=2.11
   except (AttributeError, ModuleNotFoundError, ImportError):
       # Fallback for TF2.10 or missing keras.api
       tf.random.set_seed(seed)                  # fallback for TF2.10
                     # fallback for TF2.10
   # limit parallelism to avoid non-determinism
   tf.config.threading.set_inter_op_parallelism_threads(1)
   tf.config.threading.set_intra_op_parallelism_threads(1)


   # Other imports (using standalone Keras for model building)
   import dingsound
   import matplotlib.pyplot as plt


   import seaborn as sns
   from itertools import cycle
   from sklearn.metrics import (
       roc_curve, auc, confusion_matrix,
       ConfusionMatrixDisplay, classification_report
   )
   from sklearn.model_selection import train_test_split, StratifiedKFold
   from sklearn.preprocessing import StandardScaler, LabelEncoder
   # Use standalone Keras
   from keras.models import Sequential
   from keras.layers import Dense, Input
   from keras.optimizers import Adam
   from keras.callbacks import EarlyStopping, Callback


   # -----------------------------------------------------------------------------
   # Utility Callbacks (unchanged)
   # ----------------------------------------------------------------------------- (unchanged)
   # -----------------------------------------------------------------------------
   def get_callbacks():
       early_stopping = EarlyStopping(
           monitor = “val_loss”, patience = 30,
           restore_best_weights = True, verbose = 1
       )
       relative_early_stopping = EarlyStopping(
           monitor = “val_loss”, min_delta = 1 × 10⁻⁴,
           patience = 20, restore_best_weights = True,
           verbose = 1
       )
       class TimeStopping(Callback):
           def __init__(self, seconds = None, verbose = 0):
               super().__init__()
               self.seconds = seconds
               self.verbose = verbose
               self.start_time = None
           def on_train_begin(self, logs = None):
               self.start_time = time.time()
           def on_epoch_end(self, epoch, logs = None):
               if time.time()-self.start_time > self.seconds:
                   if self.verbose:
                       print(f”\nTimeStopping: training stopped after {self.seconds} seconds.”)
                   self.model.stop_training = True
       return [early_stopping, relative_early_stopping, TimeStopping(seconds = 900, verbose = 1)]


   # -------- Load & preprocess data --------
   file_path = “Benussi Data.xlsx”
   df = pd.read_excel(file_path)
   label_encoder = LabelEncoder()
   df[“Vivid”] = label_encoder.fit_transform(df[“Vivid”])
   vivid_dummies = pd.get_dummies(df[“Vivid”], prefix = “Vivid”)
   X = pd.concat([vivid_dummies, df[[“RTs”]]], axis = 1).astype(np.float32).values
   y = pd.get_dummies(df[“Benussi”]).astype(np.float32).values


   y_labels = np.argmax(y, axis = 1)


   # -----------------------------------------------------------------------------
   # Independent Train/Test split BEFORE cross-validation (no test leakage)
   # -----------------------------------------------------------------------------


   X_remain, X_test, y_remain, y_test = train_test_split(
       X, y, test_size = 0.15, stratify = y_labels, random_state = seed
   )
   y_remain_labels = np.argmax(y_remain, axis = 1)
   print(f”Hold-out Test Set: {len(X_test)} samples held aside”)


   # -----------------------------------------------------------------------------
   # Stratified K-Fold Cross-Validation on the remaining data (no test leakage)
   # -----------------------------------------------------------------------------
   print(“Running Stratified K-Fold Cross-Validation…”)
   k = 5
   skf = StratifiedKFold(n_splits = k, shuffle = True, random_state = seed)


   fold_acc, fold_loss, fold_time, fold_early = [], [], [], []


   for fold, (train_idx, val_idx) in enumerate(skf.split(X_remain, y_remain_labels), start = 1):
       # reproducible initialization per fold
       random.seed(seed + fold)
       np.random.seed(seed + fold)
       try:
           tf.random.set_seed(seed + fold)
       except Exception:
           pass


       print(f”\nTraining fold {fold}/{k}...”)


       # 1) Build fold-specific datasets
       X_train_fold = X_remain[train_idx].copy()
       y_train_fold = y_remain[train_idx]
       X_val_fold   = X_remain[val_idx].copy()
       y_val_fold   = y_remain[val_idx]


       # 2) Scale RT feature on TRAIN only, then apply to VAL
       scaler_cv = StandardScaler().fit(
           X_train_fold[:, −1].reshape(−1, 1)
       )
       X_train_fold[:, −1] = scaler_cv.transform(
           X_train_fold[:, −1].reshape(−1, 1)
       ).ravel()
       X_val_fold[:, −1] = scaler_cv.transform(
           X_val_fold[:, −1].reshape(−1, 1)
       ).ravel()


       # 3) Instantiate a fresh model for this fold
       model_cv = Sequential([
           Dense(3, activation = “sigmoid”,
                 input_shape = (X_train_fold.shape[1],)),
           Dense(y.shape[1], activation = “softmax”),
       ])
       model_cv.compile(
           optimizer = Adam(learning_rate = 0.01),
           loss = “categorical_crossentropy”,
           metrics = [“accuracy”],
       )


       # 4) Train & time it
       cb   = get_callbacks()
       t0   = time.time()
       hist = model_cv.fit(
           X_train_fold, y_train_fold,
           epochs = 1000, batch_size = 32,
           validation_data = (X_val_fold, y_val_fold),
           callbacks = cb,
           shuffle = False,
           verbose = 0,
       )
       t1 = time.time()


       # 5) Record metrics
       fold_time.append(t1 − t0)
       fold_loss.append(hist.history[“val_loss”][−1])
       fold_acc.append(hist.history[“val_accuracy”][−1])
       fold_early.append(len(hist.history[“loss”]) < 1000)


   # Summarize CV results
   print(
       f”\nStratified K-Fold Results on Remain Set: “
       f”avg acc = {np.mean(fold_acc):.4f}, “
       f”avg loss = {np.mean(fold_loss):.4f}, “
       f”avg time = {np.mean(fold_time):.2f}s, “
       f”early stops = {sum(fold_early)}/{k}”
   )


   # -----------------------------------------------------------------------------
   # Final Training on Remaining -> Validation and Evaluate on Hold-out Test
   # -----------------------------------------------------------------------------
   # Split remaining into train/val
   X_train, X_val, y_train, y_val = train_test_split(
       X_remain, y_remain,
       test_size = 0.17647, stratify = y_remain_labels, random_state = seed
   )
   # scale RT on X_train only
   scaler = StandardScaler().fit(X_train[:, −1].reshape(−1,1))
   X_train[:, −1] = scaler.transform(X_train[:, −1].reshape(−1,1)).ravel()
   X_val[:, −1]   = scaler.transform(X_val[:, −1].reshape(−1,1)).ravel()
   X_test[:, −1]  = scaler.transform(X_test[:, −1].reshape(−1,1)).ravel()
   print(f”Dataset sizes → Train: {X_train.shape[0]}, Validation: {X_val.shape[0]}, Test: {X_test.shape[0]}”)


   # -----------------------------------------------------------------------------
   # Build & compile model using tf.keras exclusively
   # -----------------------------------------------------------------------------
   model = Sequential([
       Dense(3, activation = “sigmoid”, input_shape = (X_train.shape[1],)),  # specify input shape here instead of Input layer
       Dense(y.shape[1], activation = “softmax”),
   ])
   model.compile(
       optimizer = Adam(learning_rate = 0.01),
       loss = “categorical_crossentropy”,
       metrics = [“accuracy”],
   )


   # -----------------------------------------------------------------------------
   # Train with deterministic batches
   # -----------------------------------------------------------------------------
   callbacks = get_callbacks()
   start_time = time.time()
   history = model.fit(
       X_train, y_train,
       epochs = 1000, batch_size = 32,
       validation_data = (X_val, y_val),
       callbacks = callbacks,
       shuffle = False,
       verbose = 0,
   )
   elapsed = time.time()-start_time


   train_acc_last = history.history[“accuracy”][−1]
   val_acc_last = history.history[“val_accuracy”][−1]
   train_loss_last = history.history[“loss”][−1]
   val_loss_last = history.history[“val_loss”][−1]


   print(f”\nFinal Training Accuracy (last epoch): {train_acc_last:.4f}”)
   print(f”Final Validation Accuracy (last epoch): {val_acc_last:.4f}”)
   print(f”Final Training Loss: {train_loss_last:.4f}”)
   print(f”Final Validation Loss: {val_loss_last:.4f}”)
   print(f”Total Training Time: {elapsed:.2f} s”)


   # -----------------------------------------------------------------------------
   #  Evaluate on all three splits
   # -----------------------------------------------------------------------------
   train_loss_eval, train_acc_eval = model.evaluate(X_train, y_train, verbose = 0)
   val_loss_eval, val_acc_eval = model.evaluate(X_val, y_val, verbose = 0)
   test_loss_eval, test_acc_eval = model.evaluate(X_test, y_test, verbose = 0)


   print(“\nFinal Performance:”)
   print(f” • Training  –loss: {train_loss_eval:.4f}, acc: {train_acc_eval:.4f}”)
   print(f” • Validation–loss: {val_loss_eval:.4f}, acc: {val_acc_eval:.4f}”)
   print(f” • Test      –loss: {test_loss_eval:.4f}, acc: {test_acc_eval:.4f}”)


   # -----------------------------------------------------------------------------
   #  Confusion Matrix & Classification Report (Test Set)
   # -----------------------------------------------------------------------------
   print(“\nClassification Report (Test Set):”)


   y_test_labels = np.argmax(y_test, axis = 1)


   y_pred_prob = model.predict(X_test, verbose = 0)
   y_pred_labels = np.argmax(y_pred_prob, axis = 1)


   print(
       classification_report(
           y_test_labels,
           y_pred_labels,
           target_names = [f”Benussi {i + 1}” for i in range(y.shape[1])],
       )
   )


   cm = confusion_matrix(y_test_labels, y_pred_labels)
   cmd = ConfusionMatrixDisplay(
       cm,
       display_labels = [f”B{i + 1}” for i in range(y.shape[1])],
   )
   fig_cm, ax_cm = plt.subplots(figsize = (6, 6))
   cmd.plot(ax = ax_cm, cmap = “Blues”, colorbar = False)
   ax_cm.set_title(“Confusion Matrix–Test Set”)
   plt.tight_layout()
   plt.show()


   # -----------------------------------------------------------------------------
   #  ROC Curves (Multi-class, One-vs-Rest)
   # -----------------------------------------------------------------------------
   print(“\nPlotting ROC curves…”)


   fpr = {}
   tpr = {}
   roc_auc = {}


   for i in range(y.shape[1]):
       fpr[i], tpr[i], _ = roc_curve(y_test[:, i], y_pred_prob[:, i])
       roc_auc[i] = auc(fpr[i], tpr[i])


   # Micro-average
   fpr[“micro”], tpr[“micro”], _ = roc_curve(y_test.ravel(), y_pred_prob.ravel())
   roc_auc[“micro”] = auc(fpr[“micro”], tpr[“micro”])


   colors = cycle([“#1f77b4”, “#ff7f0e”, “#2ca02c”, “#d62728”, “#9467bd”])


   plt.figure(figsize = (7, 6))
   plt.plot(
       fpr[“micro”],
       tpr[“micro”],
       linestyle = “:”,
       linewidth = 4,
       label = f”micro-avg ROC (AUC = {roc_auc[‘micro’]:.2f})”,
   )


   for i, color in zip(range(y.shape[1]), colors):
       plt.plot(
           fpr[i],
           tpr[i],
           color = color,
           lw = 2,
           label = f”Benussi {i + 1} (AUC = {roc_auc[i]:.2f})”,
       )


   plt.plot([0, 1], [0, 1], “k--”, lw = 1)
   plt.xlim([0.0, 1.0])
   plt.ylim([0.0, 1.05])
   plt.xlabel(“False Positive Rate”)
   plt.ylabel(“True Positive Rate”)
   plt.title(“ROC Curves–Test Set”)
   plt.legend(loc = “lower right”)
   plt.tight_layout()
   plt.show()


   # ————————————————————————————————————————————————————————————————
   # Plot training & validation accuracy
   # ————————————————————————————————————————————————————————————————
   plt.figure()  # new figure for accuracy
   plt.plot(history.history[‘accuracy’],    label = ‘Training Accuracy’)
   plt.plot(history.history[‘val_accuracy’], label = ‘Validation Accuracy’)
   plt.title(‘Training and Validation Accuracy’)
   plt.xlabel(‘Epoch’)
   plt.ylabel(‘Accuracy’)
   plt.legend(loc = ‘best’)
   plt.tight_layout()
   plt.show()


   # ————————————————————————————————————————————————————————————————
   # Plot training & validation loss
   # ————————————————————————————————————————————————————————————————
   plt.figure()  # new figure for loss
   plt.plot(history.history[‘loss’],     label = ‘Training Loss’)
   plt.plot(history.history[‘val_loss’], label = ‘Validation Loss’)
   plt.title(‘Training and Validation Loss’)
   plt.xlabel(‘Epoch’)
   plt.ylabel(‘Loss’)
   plt.legend(loc = ‘best’)
   plt.tight_layout()
   plt.show()


   # -----------------------------------------------------------------------------
   #  Record & Export Network Weights (including bias nodes)
   # -----------------------------------------------------------------------------
   print(“\nExporting weight matrix …”)


   input_nodes = [f”Vivid {i + 1}” for i in range(5)] + [“RTs”]
   hidden_nodes = [“H1_1”, “H1_2”, “H1_3”]
   output_nodes = [f”Benussi {i + 1}” for i in range(y.shape[1])]


   W1, bias_hidden, W2, bias_output = model.get_weights()


   connections = []


   # Input → Hidden
   for i in range(W1.shape[0]):
       for j in range(W1.shape[1]):
           connections.append([f”[{input_nodes[i]}] --> [{hidden_nodes[j]}]”, W1[i, j]])


   # Bias to Hidden
   for j, b in enumerate(bias_hidden):
       connections.append([f”[Bias (Input)] --> [{hidden_nodes[j]}]”, b])


   # Hidden → Output
   for i in range(W2.shape[0]):
       for j in range(W2.shape[1]):
           connections.append([f”[{hidden_nodes[i]}] --> [{output_nodes[j]}]”, W2[i, j]])


   # Bias to Output
   for j, b in enumerate(bias_output):
       connections.append([f”[Bias (Hidden)] --> [{output_nodes[j]}]”, b])


   weights_df = pd.DataFrame(connections, columns = [“Connection”, “Weight”])


   output_dir = “New_Attempts”
   timestamp = datetime.datetime.now().strftime(“%Y%m%d_%H%M%S”)
   file_name = f”MLP_Assigned_Weights_{timestamp}.xlsx”
   file_path = os.path.join(output_dir, file_name)
   weights_df.to_excel(file_path, index = False)
   print(f”Weights saved → {file_path}”)


   # -----------------------------------------------------------------------------
   #  Save final trained model
   # -----------------------------------------------------------------------------
   model.save(“mlp_benussi_model_final.keras”)
   dingsound.ding()
	

Appendix A.2. Python Script for Regression, Welch's t-Test, and Pearson's Correlation Analysis

   # -*- coding: utf-8 -*-


   import pandas as pd, numpy as np
   import statsmodels.api as sm
   from scipy.stats import pearsonr, t, norm


   # ------------------------------------------------------------------
   # Helper functions
   # ------------------------------------------------------------------


   def bf_upper_bound(p_val):
       “““Sellke–Bayarri–Berger upper bound BF₀₁ (null/alt).”““
       return -np.e * p_val * np.log(p_val) if p_val <= 1 / np.e else 1.0


   def z_score(r_coeff, p_two):
       “““Large-sample z associated with two-tailed p and sign(r).”““
       p_two = max(p_two, np.finfo(float).tiny)
       return np.sign(r_coeff) * norm.isf(p_two)


   # ------------------------------------------------------------------
   # Load data and collapse to Benussi–level means
   # ------------------------------------------------------------------
   FILE_PATH = “Correlation Analysis data NEW.xlsx”
   df = pd.read_excel(FILE_PATH)


   BEN = “Output_Benussi_Level”  # predictor
   HN  = [
       “Hidden_Node_1_Weight”,
       “Hidden_Node_2_Weight”,
       “Hidden_Node_3_Weight”,
   ]


   collapsed = (df[[BEN] + HN]
                .groupby(BEN, as_index = False)
                .mean()
                .sort_values(BEN))  # five rows


   n_rows = len(collapsed)          # 5


   # ------------------------------------------------------------------
   # Simple linear regressions: weight ~ Benussi
   # ------------------------------------------------------------------
   slopes = []
   for col in HN:
       y = collapsed[col]
       X = sm.add_constant(collapsed[BEN])
       fit = sm.OLS(y, X).fit()


       # Basic estimates
       beta      = fit.params[BEN]
       se_beta   = fit.bse[BEN]
       t_beta    = fit.tvalues[BEN]
       p_beta    = fit.pvalues[BEN]          # two-tailed
       df_resid  = int(fit.df_resid)         # n-2


       # 95 % CI
       ci_low, ci_high = fit.conf_int().loc[BEN]


       # Standardised β = β * (SD_x / SD_y)
       sd_x = collapsed[BEN].std(ddof = 0)
       sd_y = y.std(ddof = 0)
       beta_std = beta * sd_x / sd_y if sd_y else np.nan


       # Model-level stats
       r2       = fit.rsquared
       f_val    = float(fit.fvalue)
       f_p      = float(fit.f_pvalue)


       slopes.append({
           “Node”: col,
           “beta”: beta,
           “SE”: se_beta,
           “t”: t_beta,
           “df”: df_resid,
           “p_two”: p_beta,
           “CI_low”: ci_low,
           “CI_high”: ci_high,
           “beta_std”: beta_std,
           “R2”: r2,
           “Adj_R2”: fit.rsquared_adj,
           “F”: f_val,
           “F_p”: f_p,
       })


   slopes_df = pd.DataFrame(slopes)


   # ------------------------------------------------------------------
   # Pair-wise slope contrasts  (df = 6) – adds 95 % CI and Cohen’s d
   # ------------------------------------------------------------------
   contr = []
   for i in range(3):
       for j in range(i + 1, 3):
           b1, se1, name1 = slopes_df.loc[i, [“beta”, “SE”, “Node”]]
           b2, se2, name2 = slopes_df.loc[j, [“beta”, “SE”, “Node”]]


           diff    = b1 − b2
           se_diff = np.sqrt(se1 ** 2 + se2 ** 2)
           t_stat  = diff / se_diff
           df_con  = (n_rows-2) * 2  # 6
           p_two   = 2 * t.sf(abs(t_stat), df_con)
           bf01    = bf_upper_bound(p_two)


           # 95 % confidence interval for the slope difference
           t_crit = t.ppf(0.975, df_con)
           ci_low = diff-t_crit * se_diff
           ci_high = diff + t_crit * se_diff


           # Cohen’s d from t (independent groups, unequal variances)
           # d = 2t / sqrt(df)
           cohen_d = 2 * t_stat / np.sqrt(df_con)


           contr.append({
               “contrast”: f”{name1} vs. {name2}”,
               “beta_diff”: diff,
               “SE_diff”: se_diff,
               “t”: t_stat,
               “df”: df_con,
               “p_two”: p_two,
               “CI_low”: ci_low,
               “CI_high”: ci_high,
               “Cohen_d”: cohen_d,
               “BF10_upper”: 1.0 / bf01,
               “Posterior_Odds”: 1.0 / bf01,  # prior odds = 1:1 so posterior odds = BF10
           })


   contr_df = pd.DataFrame(contr)


   # ------------------------------------------------------------------
   # Main correlation loop
   # ------------------------------------------------------------------
   N_full  = len(df)
   z_crit  = norm.ppf(0.975)          # 1.96 for 95% CI
   corr_rows = []


   for i, c1 in enumerate(HN):
       for j, c2 in enumerate(HN):
           if j <= i:
               continue


           r_val, p_two = pearsonr(df[c1], df[c2])


           z = np.arctanh(r_val)
           se = 1 / np.sqrt(N_full-3)
           delta = z_crit * se


           # 2) back-transform to r-space
           ci_low_r  = np.tanh(z-delta)
           ci_high_r = np.tanh(z + delta)


           corr_rows.append({
               “var1”:       c1,
               “var2”:       c2,
               “n”:          N_full,
               “Pearson_r”:  r_val,
               “CI_low_r”:   ci_low_r,
               “CI_high_r”:  ci_high_r,
           })


   corr_df = pd.DataFrame(corr_rows)


   # ------------------------------------------------------------------
   # Export to Excel
   # ------------------------------------------------------------------
   OUT = “Hidden_Node_Analysis_Full.xlsx”
   with pd.ExcelWriter(OUT) as writer:
       collapsed.to_excel(writer, sheet_name = “Collapsed_means”, index = False)
       slopes_df.to_excel(writer,    sheet_name = “Slopes”,       index = False)
       contr_df.to_excel(writer,     sheet_name = “Slope_tests”,  index = False)
       corr_df.to_excel(writer,      sheet_name = “Pearson_corr”, index = False)


   print(“✓ Analyses complete–results saved to”, OUT)
	

References

  1. Wearden, J.; O’Donoghue, A.; Ogden, R.; Montgomery, C. Subjective Duration in the Laboratory and the World Outside. In Subjective Time: The Philosophy, Psychology, and Neuroscience of Temporality; Arstila, V., Lloyd, D., Eds.; The MIT Press: Cambridge, MA, USA, 2014; pp. 287–306. ISBN 978-0-262-32274-4. [Google Scholar]
  2. Dainton, B. Temporal Consciousness. In The Stanford Encyclopedia of Philosophy; Zalta, E.N., Nodelman, U., Eds.; Metaphysics Research Lab, Stanford University: California, CA, USA, 2024; Available online: https://plato.stanford.edu/archives/fall2024/entries/consciousness-temporal/ (accessed on 4 June 2025).
  3. Albertazzi, L. Forms of Completion. Grazer Philos. Stud. 1995, 50, 321–340. [Google Scholar] [CrossRef]
  4. Benussi, V. Psychologie Der Zeitauffassung; C. Winter; 1913; Volume 6, Available online: https://onlinebooks.library.upenn.edu/webbin/book/lookupid?key=ha005762281 (accessed on 4 June 2025).
  5. Albertazzi, L. Vittorio Benussi (1878–1927). In The School of Alexius Meinong; Routledge: London, UK, 2017; pp. 99–134. ISBN 978-1-315-23717-6. [Google Scholar]
  6. Fulford, J.; Milton, F.; Salas, D.; Smith, A.; Simler, A.; Winlove, C.; Zeman, A. The Neural Correlates of Visual Imagery Vividness—An fMRI Study and Literature Review. Cortex 2018, 105, 26–40. [Google Scholar] [CrossRef]
  7. D’Angiulli, A.; Reeves, A. Generating Visual Mental Images: Latency and Vividness Are Inversely Related. Mem. Cognit. 2002, 30, 1179–1188. [Google Scholar] [CrossRef] [PubMed]
  8. Lefebvre, E.; D’Angiulli, A. Imagery-Mediated Verbal Learning Depends on Vividness–Familiarity Interactions: The Possible Role of Dualistic Resting State Network Activity Interference. Brain Sci. 2019, 9, 143. [Google Scholar] [CrossRef] [PubMed]
  9. Buckner, R.L.; Andrews-Hanna, J.R.; Schacter, D.L. The Brain’s Default Network. Ann. N. Y. Acad. Sci. 2008, 1124, 1–38. [Google Scholar] [CrossRef]
  10. Raichle, M.E.; MacLeod, A.M.; Snyder, A.Z.; Powers, W.J.; Gusnard, D.A.; Shulman, G.L. A Default Mode of Brain Function. Proc. Natl. Acad. Sci. USA 2001, 98, 676–682. [Google Scholar] [CrossRef]
  11. Andrews-Hanna, J.R.; Smallwood, J.; Spreng, R.N. The Default Network and Self-Generated Thought: Component Processes, Dynamic Control, and Clinical Relevance. Ann. N. Y. Acad. Sci. 2014, 1316, 29–52. [Google Scholar] [CrossRef]
  12. Astafiev, S.V.; Shulman, G.L.; Stanley, C.M.; Snyder, A.Z.; Van Essen, D.C.; Corbetta, M. Functional Organization of Human Intraparietal and Frontal Cortex for Attending, Looking, and Pointing. J. Neurosci. 2003, 23, 4689–4699. [Google Scholar] [CrossRef]
  13. Corbetta, M.; Shulman, G.L. Control of Goal-Directed and Stimulus-Driven Attention in the Brain. Nat. Rev. Neurosci. 2002, 3, 201–215. [Google Scholar] [CrossRef]
  14. Seeley, W.W.; Menon, V.; Schatzberg, A.F.; Keller, J.; Glover, G.H.; Kenna, H.; Reiss, A.L.; Greicius, M.D. Dissociable Intrinsic Connectivity Networks for Salience Processing and Executive Control. J. Neurosci. 2007, 27, 2349–2356. [Google Scholar] [CrossRef]
  15. Menon, V.; Uddin, L.Q. Saliency, Switching, Attention and Control: A Network Model of Insula Function. Brain Struct. Funct. 2010, 214, 655–667. [Google Scholar] [CrossRef]
  16. Kim, H. Dissociating the Roles of the Default-Mode, Dorsal, and Ventral Networks in Episodic Memory Retrieval. NeuroImage 2010, 50, 1648–1657. [Google Scholar] [CrossRef] [PubMed]
  17. Cheng, X.; Yuan, Y.; Wang, Y.; Wang, R. Neural Antagonistic Mechanism between Default-Mode and Task-Positive Networks. Neurocomputing 2020, 417, 74–85. [Google Scholar] [CrossRef]
  18. Kim, H.; Daselaar, S.M.; Cabeza, R. Overlapping Brain Activity between Episodic Memory Encoding and Retrieval: Roles of the Task-Positive and Task-Negative Networks. NeuroImage 2010, 49, 1045–1054. [Google Scholar] [CrossRef] [PubMed]
  19. Mancuso, L.; Cavuoti-Cabanillas, S.; Liloia, D.; Manuello, J.; Buzi, G.; Cauda, F.; Costa, T. Tasks Activating the Default Mode Network Map Multiple Functional Systems. Brain Struct. Funct. 2022, 227, 1711–1734. [Google Scholar] [CrossRef]
  20. Sridharan, D.; Levitin, D.J.; Menon, V. A Critical Role for the Right Fronto-Insular Cortex in Switching between Central-Executive and Default-Mode Networks. Proc. Natl. Acad. Sci. USA 2008, 105, 12569–12574. [Google Scholar] [CrossRef]
  21. Levine, D.S. Introduction to Neural and Cognitive Modeling; Psychology Press: New York, NY, USA, 2000. [Google Scholar]
  22. Kosslyn, S.M. Seeing and Imagining in the Cerebral Hemispheres: A Computational Approach. Psychol. Rev. 1987, 94, 148. [Google Scholar] [CrossRef]
  23. Farah, M.J.; McClelland, J.L. A Computational Model of Semantic Memory Impairment: Modality Specificity and Emergent Category Specificity. J. Exp. Psychol. Gen. 1991, 120, 339–357. [Google Scholar] [CrossRef]
  24. Farah, M.J.; O’Reilly, R.C.; Vecera, S.P. Dissociated Overt and Covert Recognition as an Emergent Property of a Lesioned Neural Network. Psychol. Rev. 1993, 100, 571–588. [Google Scholar] [CrossRef]
  25. Cohen, J.D.; Romero, R.D.; Servan-Schreiber, D.; Farah, M.J. Mechanisms of Spatial Attention: The Relation of Macrostructure to Microstructure in Parietal Neglect. J. Cogn. Neurosci. 1994, 6, 377–387. [Google Scholar] [CrossRef]
  26. Kosslyn, S.M.; Van Kleeck, M. Broken Brains and Normal Minds: Why Humpty-Dumpty Needs a Skeleton. In Computational Neuroscience; Schwartz, E.L., Ed.; MIT Press: Cambridge, MA, USA, 1990; pp. 390–402. [Google Scholar]
  27. Farah, M.J. Neuropsychological Inference with an Interactive Brain: A Critique of the “Locality” Assumption. In Cognitive Modeling; Polk, T.A., Seifert, C.M., Eds.; A Bradford Book; MIT Press: Cambridge, MA, USA, 2002; pp. 1149–1192. ISBN 978-0-262-66116-4. [Google Scholar]
  28. Beniaguev, D.; Segev, I.; London, M. Single Cortical Neurons as Deep Artificial Neural Networks. Neuron 2021, 109, 2727–2739.e3. [Google Scholar] [CrossRef] [PubMed]
  29. Stelzer, F.; Röhm, A.; Vicente, R.; Fischer, I.; Yanchuk, S. Deep Neural Networks Using a Single Neuron: Folded-in-Time Architecture Using Feedback-Modulated Delay Loops. Nat. Commun. 2021, 12, 5164. [Google Scholar] [CrossRef]
  30. Kasabov, N.K. NeuCube: A Spiking Neural Network Architecture for Mapping, Learning and Understanding of Spatio-Temporal Brain Data. Neural Netw. Off. J. Int. Neural Netw. Soc. 2014, 52, 62–76. [Google Scholar] [CrossRef] [PubMed]
  31. Cybenko, G. Approximation by Superpositions of a Sigmoidal Function. Math. Control Signals Syst. 1989, 2, 303–314. [Google Scholar] [CrossRef]
  32. Aleksander, I. Impossible Minds: My Neurons, My Consciousness (Revised Edition); World Scientific: Singapore, 2014; ISBN 1-78326-571-X. [Google Scholar]
  33. Albantakis, L.; Hintze, A.; Koch, C.; Adami, C.; Tononi, G. Evolution of Integrated Causal Structures in Animats Exposed to Environments of Increasing Complexity. PLoS Comput. Biol. 2014, 10, e1003966. [Google Scholar] [CrossRef]
  34. Goodfellow, I.; Bengio, Y.; Courville, A. Deep Learning; MIT Press: Cambridge, MA, USA, 2016. [Google Scholar]
  35. Ji, J.; Liu, J.; Han, L.; Wang, F. Estimating Effective Connectivity by Recurrent Generative Adversarial Networks. IEEE Trans. Med. Imaging 2021, 40, 3326–3336. [Google Scholar] [CrossRef]
  36. Dai, P.; He, Z.; Ou, Y.; Luo, J.; Liao, S.; Yi, X. Estimating Brain Effective Connectivity from Time Series Using Recurrent Neural Networks. Phys. Eng. Sci. Med. 2025, 48, 785–795. [Google Scholar] [CrossRef]
  37. Abbasvandi, Z.; Nasrabadi, A.M. A Self-Organized Recurrent Neural Network for Estimating the Effective Connectivity and Its Application to EEG Data. Comput. Biol. Med. 2019, 110, 93–107. [Google Scholar] [CrossRef]
  38. Pulvermüller, F.; Tomasello, R.; Henningsen-Schomers, M.R.; Wennekers, T. Biological Constraints on Neural Network Models of Cognitive Function. Nat. Rev. Neurosci. 2021, 22, 488–502. [Google Scholar] [CrossRef]
  39. Sun, L.; Zhang, D.; Lian, C.; Wang, L.; Wu, Z.; Shao, W.; Lin, W.; Shen, D.; Li, G. Topological Correction of Infant White Matter Surfaces Using Anatomically Constrained Convolutional Neural Network. NeuroImage 2019, 198, 114–124. [Google Scholar] [CrossRef]
  40. Goulden, N.; Khusnulina, A.; Davis, N.J.; Bracewell, R.M.; Bokde, A.L.; McNulty, J.P.; Mullins, P.G. The Salience Network Is Responsible for Switching between the Default Mode Network and the Central Executive Network: Replication from DCM. NeuroImage 2014, 99, 180–190. [Google Scholar] [CrossRef]
  41. Reeves, A.; D’Angiulli, A. What Does the Visual Buffer Tell the Mind’s Eye? Abstr. Psychon. Soc. 2003, 8, 82. [Google Scholar]
  42. Kingma, D.; Ba, J. Adam: A Method for Stochastic Optimization. arXiv 2014, arXiv:1412.6980. [Google Scholar]
  43. Ho, Y. The Real-World-Weight Cross-Entropy Loss Function: Modeling the Costs of Mislabeling. IEEE Access 2020, 8, 4806–4813. [Google Scholar] [CrossRef]
  44. Wang, R.; Li, J. Bayes Test of Precision, Recall, and F1 Measure for Comparison of Two Natural Language Processing Models. In Proceedings of the 57th Annual Meeting of the Association for Computational Linguistics, Florence, Italy, 28 July–2 August 2019; Korhonen, A., Traum, D., Màrquez, L., Eds.; Association for Computational Linguistics: Florence, Italy, 2019; pp. 4135–4145. [Google Scholar]
  45. Calders, T.; Jaroszewicz, S. Efficient AUC Optimization for Classification. In Proceedings of the Knowledge Discovery in Databases: PKDD 2007, Warsaw, Poland, 17–21 September 2007; Kok, J.N., Koronacki, J., Lopez de Mantaras, R., Matwin, S., Mladenič, D., Skowron, A., Eds.; Springer: Berlin/Heidelberg, Germany, 2007; pp. 42–53. [Google Scholar]
  46. Benjamin, D.J.; Berger, J.O. Three Recommendations for Improving the Use of p-Values. Am. Stat. 2019, 73, 186–191. [Google Scholar] [CrossRef]
  47. Nahm, F.S. Receiver Operating Characteristic Curve: Overview and Practical Use for Clinicians. Korean J. Anesthesiol. 2022, 75, 25–36. [Google Scholar] [CrossRef]
  48. Trujillo-Barreto, N.J. Bayesian Model Inference. In Brain Mapping; Toga, A.W., Ed.; Academic Press: Waltham, MA, USA, 2015; pp. 535–539. ISBN 978-0-12-397316-0. [Google Scholar]
  49. Sneve, M.H.; Grydeland, H.; Amlien, I.K.; Langnes, E.; Walhovd, K.B.; Fjell, A.M. Decoupling of Large-Scale Brain Networks Supports the Consolidation of Durable Episodic Memories. NeuroImage 2017, 153, 336–345. [Google Scholar] [CrossRef]
  50. Fox, M.D.; Snyder, A.Z.; Vincent, J.L.; Corbetta, M.; Van Essen, D.C.; Raichle, M.E. The Human Brain Is Intrinsically Organized into Dynamic, Anticorrelated Functional Networks. Proc. Natl. Acad. Sci. USA 2005, 102, 9673–9678. [Google Scholar] [CrossRef]
  51. Marks, D.F. Phenomenological Studies of Visual Mental Imagery: A Review and Synthesis of Historical Datasets. Vision 2023, 7, 67. [Google Scholar] [CrossRef]
  52. James, W. The Principles of Psychology; Henry Holt and Co.: New York, NY, USA, 1890; Volume I. [Google Scholar]
  53. Li, X.; Wong, D.; Gandour, J.; Dzemidzic, M.; Tong, Y.; Talavage, T.; Lowe, M. Neural Network for Encoding Immediate Memory in Phonological Processing. Neuroreport 2004, 15, 2459–2462. [Google Scholar] [CrossRef]
  54. Marek, S.; Dosenbach, N.U.F. The Frontoparietal Network: Function, Electrophysiology, and Importance of Individual Precision Mapping. Dialogues Clin. Neurosci. 2018, 20, 133–140. [Google Scholar] [CrossRef]
  55. Cole, M.W.; Braver, T.S.; Meiran, N. The Task Novelty Paradox: Flexible Control of Inflexible Neural Pathways during Rapid Instructed Task Learning. Neurosci. Biobehav. Rev. 2017, 81, 4–15. [Google Scholar] [CrossRef]
  56. Lee, S.; Parthasarathi, T.; Kable, J.W. The Ventral and Dorsal Default Mode Networks Are Dissociably Modulated by the Vividness and Valence of Imagined Events. J. Neurosci. Off. J. Soc. Neurosci. 2021, 41, 5243–5250. [Google Scholar] [CrossRef] [PubMed]
  57. Addis, D.R.; Pan, L.; Vu, M.-A.; Laiser, N.; Schacter, D.L. Constructive Episodic Simulation of the Future and the Past: Distinct Subsystems of a Core Brain Network Mediate Imagining and Remembering. Neuropsychologia 2009, 47, 2222–2238. [Google Scholar] [CrossRef] [PubMed]
  58. Ribeiro da Costa, C.; Soares, J.M.; Oliveira-Silva, P.; Sampaio, A.; Coutinho, J.F. Interplay between the Salience and the Default Mode Network in a Social-Cognitive Task toward a Close Other. Front. Psychiatry 2022, 12, 718400. [Google Scholar] [CrossRef] [PubMed]
  59. Menon, V. Large-Scale Brain Networks and Psychopathology: A Unifying Triple Network Model. Trends Cogn. Sci. 2011, 15, 483–506. [Google Scholar] [CrossRef]
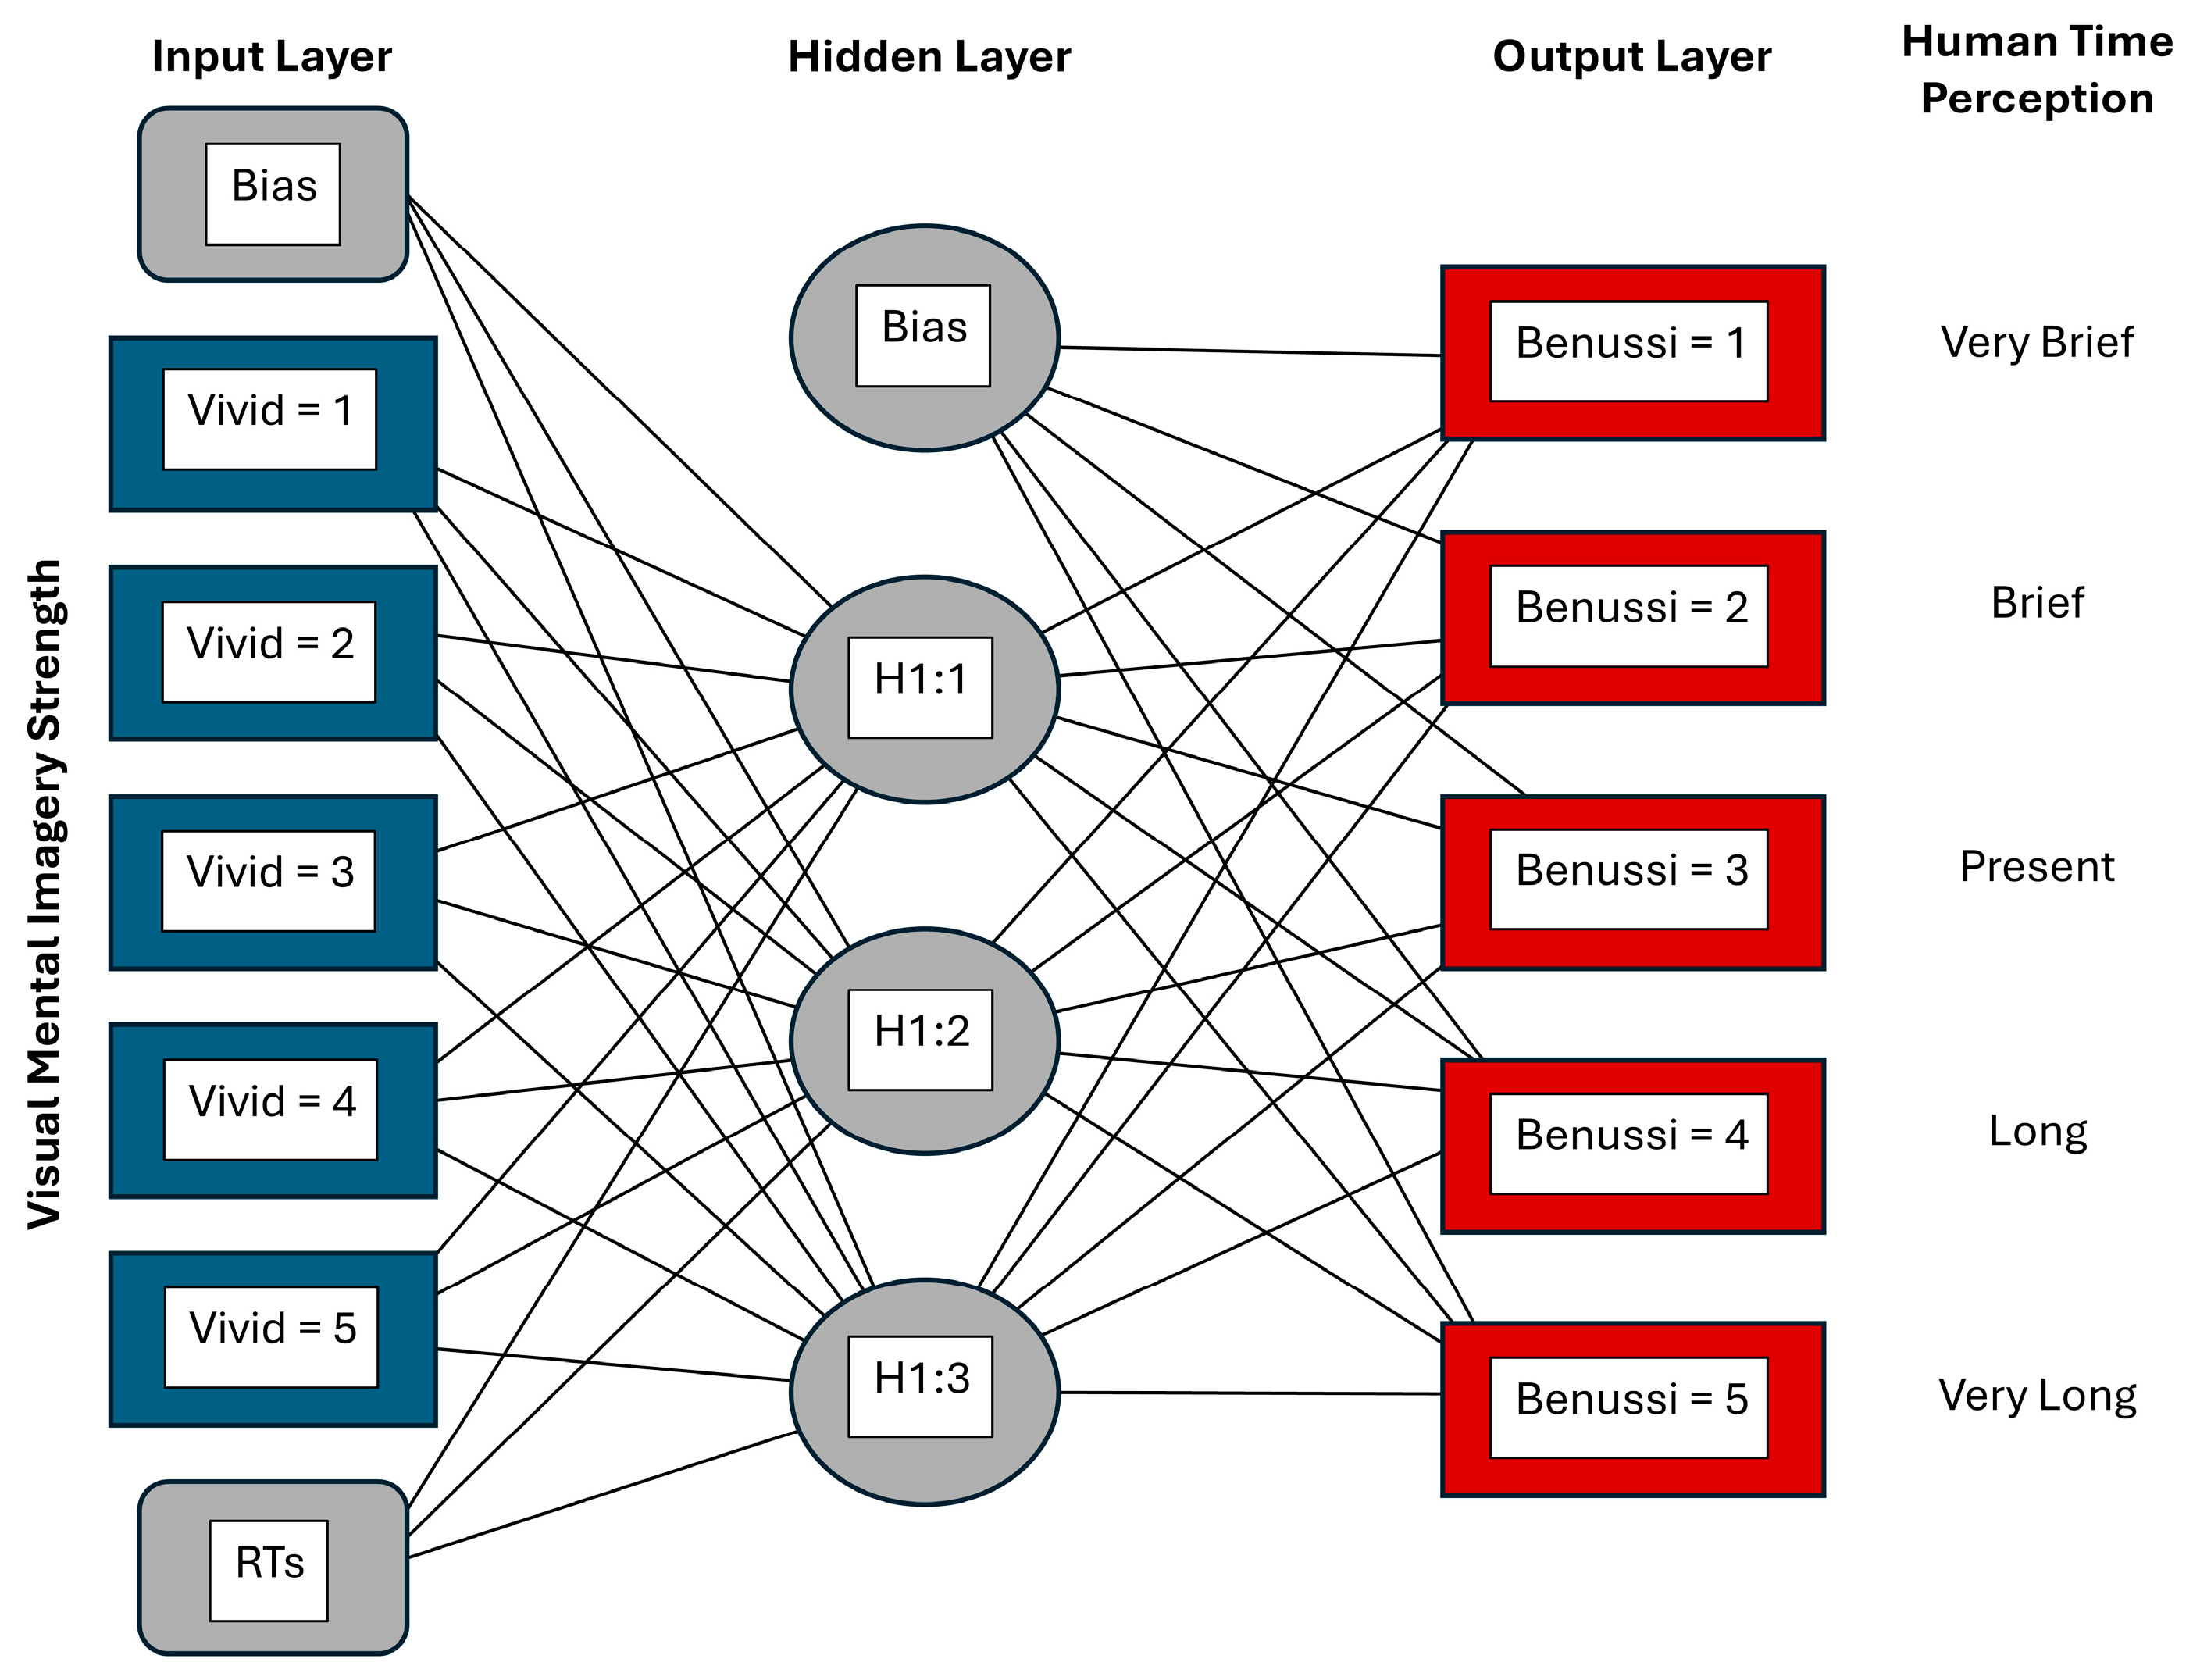
Figure 1. Network structure diagram for the MLP.
Make 07 00082 g001
Figure 2. Learning curves of the MLP model. Each curve plateaus by epoch 200 but continues to make small improvements up to epoch 1000. In each case, the high convergence of the curves indicate that the model is able to generalize well with the validation data. (a) Accuracy curve of the training (blue) and validation (orange) phases. In each phase, accuracy steeply increases over the first 25 epochs and eventually plateaus near 0.99. (b) Loss curve of the training (blue) and validation (orange) phases. In each phase, the loss function steeply decreases over the first 25 epochs before leveling off near 0.02.
Make 07 00082 g002
Figure 3. ROC Curves for Benussi levels 1–5. All AUCs were equal to 1.00, indicating ideal classification performance.
Make 07 00082 g003
Figure 4. Confusion matrix for the MLP model on the test dataset.
Make 07 00082 g004
Figure 5. (a) Hidden node weights across all Benussi levels. From visual inspection, hidden nodes 1 (blue) and 3 (orange) appear to decrease as hidden node 2 (green) increases. (b) Regression fit of hidden node weights as a function of Benussi Level show directionality among the slopes (positive correlation or anticorrelation).
Make 07 00082 g005
Table 1. Precision, Recall, and F1-Scores of the MLP Model.
Benussi LevelPrecisionRecallF1-ScoreSupport 1
10.981.000.9949
20.991.000.99319
31.000.970.99379
40.971.000.99304
51.001.001.00601
Accuracy--0.991652
Macro Mean0.990.990.991652
Weighted Mean0.990.990.991652
1 Support values indicate the number of samples within each level of the validation data.
Table 2. Planned linear regression slope tests for each set of hidden node weights against Benussi levels.
Hidden
Node
βSEt-Statistic
(n = 5, df = 3)
p-Value95% CIAdjusted R2
1−10.5767.514−1.4070.254−34.490, 13.3380.197
244.75016.5102.7100.073−7.792, 97.2930.613
3−29.8057.816−3.8130.032−54.680, −4.9300.772
Table 3. Welch’s t-test for independent slopes of each set of hidden node weights.
Hidden Node
Contrast
∆βSE(∆β)t-Statistic
(n1 = n2 = 5,
df = 6)
p-Value95% CICohen’s dBF10
1 vs. 2−55.32618.140−3.0500.023−99.712, −10.940−2.4904.307
1 vs. 319.22910.8421.7740.127−7.301, 45.7601.4481.407
2 vs. 374.55518.2674.0810.00629.858, 119.2523.33211.250
Disclaimer/Publisher’s Note: The statements, opinions and data contained in all publications are solely those of the individual author(s) and contributor(s) and not of MDPI and/or the editor(s). MDPI and/or the editor(s) disclaim responsibility for any injury to people or property resulting from any ideas, methods, instructions or products referred to in the content.