Abstract
As programming education becomes increasingly complex, grading student code has become a challenging task. Traditional methods, such as dynamic and static analysis, offer foundational approaches but often fail to provide granular insights, leading to inconsistencies in grading and feedback. This study addresses the limitations of these methods by integrating contrastive learning with explainable AI techniques to assess SQL code submissions. We employed contrastive learning to differentiate between student and correct SQL solutions, projecting them into a high-dimensional latent space, and used the Frobenius norm to measure the distance between these representations. This distance was used to predict the percentage of points deducted from each student’s solution. To enhance interpretability, we implemented feature ablation and integrated gradients, which provide insights into the specific tokens in student code that impact the grading outcomes. Our findings indicate that this approach improves the accuracy, consistency, and transparency of automated grading, aligning more closely with human grading standards. The results suggest that this framework could be a valuable tool for automated programming assessment systems, offering clear, actionable feedback and making machine learning models in educational contexts more interpretable and effective.
1. Introduction
With the popularity of computer science, more students enroll in corresponding higher education institutions every year, which then results in increasing problems when those students are tested during exam terms. This generates problems like inconsistency, and even more problematic, the lack of feedback for the students, which is an important part of their learning process.
A significant amount of time and effort, as well as a high cognitive load, are needed to evaluate programming submissions. Algorithmic implementations built in certain programming languages are typically included in programming assignments to evaluate students’ ability to reason logically and solve problems. Programming assignments are evaluated by evaluators using either a source code analysis or a test case-driven methodology. Evaluators must examine the source code when conducting assessments because many evaluation criteria and grading rubrics provide partial points for submissions with mistakes in their syntax. This puts more time and effort on evaluators and adds to their workload [1]. Human graders can vary significantly in their assessment of partially correct solutions [2,3]. Furthermore, a survey was conducted among 42 university lecturers teaching modules such as Java, Python, C, C++, SQL, etc. The survey included questions that covered the teachers’ experiences in assessing programming assignments, and the results showed that only 33% of the lecturers completed the assessment process within the given deadlines and that 66% of the points awarded during the assessment process were changed after later reviews. Among results related to other programming languages, the survey results show that database lecturers spent 22 h to assess 1533 SQL student solutions, which is a significant time commitment [1]. Due to the disadvantages of manual grading and staff shortages, it is easy to understand why automated programming assessment systems (APASs) have been in the spotlight for decades and will continue to be in the spotlight for the foreseeable future [4].
APASs are used to solve problems associated with manually administered programming tasks while providing timely and useful feedback and efficient and objective grading of large numbers of student solutions [5]. By implementing clear criteria, they can correct errors made by human graders and potentially increase student performance [5,6]. Accuracy of grading, consistency, and quality feedback on errors made are primary goals of APASs, especially in courses with many students and few human graders.
APASs support all important phases of the evaluation process: they offer a rich infrastructure for recording and monitoring exams to stop any cheating, they enable different text-based programming languages, and they enable data analysis and the visualization of student results, tests, and question quality. Although computer education lecturers at other universities are aware of their advantages, they are rarely used outside the institutions where they were created [7]. Lecturers are often too busy to find, study, and incorporate APAS into their courses, especially when the notation and methods of the system differ significantly from their own [8]. An additional problem is, in some cases, the very demanding definition of the necessary APAS parameters, the adjustment of which directly affects the success of the assessment, which then results in giving up on its use. Here, we suggest a solution for the above-mentioned problems in the form of a new, machine learning-based grading method. Before gaining insight into the different existing traditional methods used for automated grading and the solution that the authors propose, let us first examine what the possibilities of comprehensive APASs are in general.
Comprehensive APASs support all phases of the course assessment process: course management, content creation, exam administration, logging, problem solving, and data export and analysis. It should be adaptable and expandable to accommodate a variety of needs in the field of computer science. Using an intuitive GUI, teachers should be able to teach the course and maybe export all the data gathered. The necessary feature set to designate an APAS as “comprehensive” is as follows [4]:
Course administration: Students enroll in courses according to their academic year, and exams are connected to courses. APASs should offer a basic enrollment management system that manages teacher permits, student-course assignments, and integration with university authentication systems, as most universities already have information systems in place.
System monitoring: To guarantee scalability and avoid possible problems like disk shortages, all systems, including APASs, should be monitored.
Exam logging and monitoring: Every action taken by students during tests should be collected, giving teachers real-time progress tracking through a dashboard that records activity heartbeats, lost focus warnings, and student data. The log, which is available during and after the exam, aids in problem solving, software bug detection, and plagiarism detection.
Problem mitigation: Monitoring and logging during the exam helps in resolving student-caused problems, but professors can also sometimes make mistakes while creating questions. Since mistakes are inevitable, APASs must allow error correction and human modifications, e.g., overriding grades given by the APAS.
Analysis and visualization: APASs should include analytics to improve exam material and show student performance. Various kinds of visualizations, such as bubble charts, box plots, and timelines, can help to monitor exam progress and to pinpoint troublesome questions based on usage frequency, average scores, and exam results.
Data import and export: APASs usually supplement current information systems; hence, supporting the import and export of data is essential.
Content authoring: Rich elements like text formatting, graphics, tables, and mathematical formulas should be included in content design assistance so that non-technical teachers may easily produce materials. APASs should include built-in versioning and a review procedure so that teachers can evaluate each other’s questions because question production is frequently a collaborative activity.
Rich question types and grading methods: Topics including different programming languages, question types, and alternative grading methods (such as dynamic or static code analysis) are the focus of the majority of APAS research. Programming language features should be separated from the concepts being tested.
User-friendly online examination: Students should be able to use a responsive web application to take exams from a variety of devices and locations. While guaranteeing stability, scalability, and resilience to technical challenges, the system should offer a straightforward, user-friendly interface, instant feedback, and the option for students to check their submitted solutions with the errors they have made highlighted.
Despite all the above-mentioned capabilities of the APAS system, this paper focuses on the development of a new method for evaluating SQL queries: problem-solving skills are tested in a realistic environment, and feedback is generated. The authors of this research work as lecturers at universities where hundreds of students enroll in a software engineering program, which includes, among others, database-related courses, during which students must master the SQL language. For these reasons, this paper focuses on systems and methods for automated evaluation of solutions written in SQL, although APASs are generally used to evaluate a wide range of programming languages. The method proposed in this paper is an attempt to avoid the complexity of adjusting APAS parameters using machine learning, which could make it easier for teachers to start using APAS to assess student solutions written in SQL, without demanding preparation, while retaining all the advantages of automatic grading. In the following chapters, existing, traditional grading methods will be discussed.
2. Related Work
2.1. Static and Dynamic Analysis
The first idea of how to assess the problem with a proposed solution was introduced in 1960 [5]. Later, new ideas were proposed, but until machine learning technology, most solutions used dynamic analysis and static analysis [8,9]. Dynamic analysis is a method in which the teacher’s correct solution and the student’s solution to be tested are executed against the database, and their results are compared. The disadvantage of this method is that it cannot distinguish whether the student solution is correct or not; it can only check if it provides the same result set as the correct solution [10]. Although some APASs use this method to identify correct student solutions, others use this method only to identify the solutions that are not correct. Furthermore, this method cannot provide partial grades with valuable feedback to students. This is more than a good reason for researchers to try different ideas and propose the static analysis method. Static analysis does not execute teacher and student solutions, instead, it compares their structure and focuses on specific features of SQL statements that can be used to provide partial points and more precise feedback to students. In some implementations, it tests the logical equivalence of the correct solution and the student’s solution with a much more complex approach [8,11,12]. The disadvantage of a static analysis method is that the teachers should provide a wide range of possible correct solutions, since SQL is a language that enables us to obtain the same results through different methods. If just one correct SQL statement is provided for the comparison, the results of the static analysis will be unsatisfactory, with inconsistent final grades. In addition to dynamic and static methods, some researchers used the text similarity method, which can produce more detailed feedback to the students. However, just like the static analysis, it requires that student solutions are tested against all possible correct answers, rather than one or only a few [13,14].
2.2. Hybrid Method
Because of the lack of dynamic, static, and text similarity methods, researchers proposed systems that use them together, in a new, hybrid method. They often identify incorrect solutions with the dynamic method, and after that, use the static method to calculate the points that should be awarded for partially correct solutions or to find out all the necessary steps that should be done to change the student’s solution and make it equal to the correct solution. An interesting approach was introduced in [10], where the hybrid method first identifies all correct student solutions and then uses all of those correct solutions for the new comparison with student solutions. This minimizes the problem where only one or at least a few correct solutions were provided by the teacher in the first place. The hybrid method uses the complementary advantages of each method and provides a more comprehensive, precise, consistent, and generally more successful approach [8,9,13,15,16]. However, there are still shortcomings that need to be addressed. For instance, teachers must spend a significant amount of time and effort to adapt the grading methods to the context of their institution, defined by the learning outcomes of the course curriculum. The adaptation means that teachers and teacher assistants should fine-tune dozens of parameters of grading methods and test the efficiency and correctness of given grades, which is heavily demanding and time-consuming. Another situation that should be mentioned is the fact that the above-mentioned hybrid method first used a fixed database when comparing students with the teacher’s correct solution. This could lead to the oversight of the mistakes students made in their solutions, simply because there were no data to cover all the possible data states. Some researchers addressed this problem and proposed data generation as an addition to the hybrid method. The effect of preparing data for testing SQL code was to catch more errors students made in their solutions [14,17,18].
2.3. Natural Language Method
The development of APASs’ grading methods continued, and the next approach benefits from the similarity of SQL and natural language. Natural language processing (NLP), as part of artificial intelligence and linguistics, with its methods, algorithms, and tools, tries to understand human language: it interprets it and analyses it with natural language words for some desired functionality. In the last decade, NLP has significantly improved human language analysis, with an impact on all different kinds of implementations, including translation, information extraction, summarization, spam detection, dialogue systems, medical needs, etc. [19].
The first language-based implementations for sentence generation analyzed the possible next word in one direction; however, later, a new model named Bi-directional Encoder Representations from Transformers (BERTs) appeared, which analyzed the text in both directions. BERT, as a pre-trained model with unlabeled text available on the English Wikipedia, can also define the context for different NLP implementations, including grading SQL solutions. Researchers in [18,19] proposed an idea to train BERT on a set of SQL student solutions and their grades given by the teachers, which will allow BERT to learn about the SQL structure and syntax [7,19,20,21,22,23,24]. This method brings higher consistency and accuracy, reducing the manual grading effort, compared to self-attention models and convolutional networks, which researchers also proposed for grading SQL solutions. More examples of NLP applications include the usage of a Long Short-Term Memory (LSTM) method, Bidirectional Long Short-Term Memory (BiLSTM), a convolutional neural network (CNN), and an attention mechanism [8,25,26,27,28,29,30]. Overall, NLP methods have greater efficacy and consistency, resulting in them gaining more popularity but at the cost of interpretability [8,25,31,32]. Moreover, while machine learning models, particularly in the realm of NLP, offer significant advancements in automating complex tasks, they are often critiqued as being ‘black boxes’. This term refers to the challenge of interpreting how these models make decisions or derive conclusions, a critical issue when the results need to be transparent and understandable, especially in educational settings where feedback and grading are involved.
2.4. State-of-the-Art Methods
Although not all methods are listed in the previous paragraphs, we have focused on the most common ones. In recent years, efforts have been made to combine the above methods to improve their individual results, and the emergence and application of newer technologies open the possibility of further progress and minimize still-existing shortcomings, such as the demanding preparation for using APAS systems.
In addition, it should be considered that the requirements for APAS systems have also changed over time. Initially, it was only a check of the functionality of the program code; however, over time, additional functionalities have been requested, such as checking the quality of the written program code, detecting plagiarism, the analytics of the learning process, measuring the performance of the program code, etc. [5]. Aware of all the above-mentioned properties of existing traditional methods, the authors propose a new assessment method described in the following section.
2.5. Proposed Method
Here, we present a comprehensive framework that integrates contrastive learning with explainable AI techniques to analyze SQL code submissions. Our dataset consists of paired student and correct PostgreSQL code submissions, along with the scores achieved for each student solution (Figure 1A,B). The methodologies presented in this paper rely on grades manually assigned by teachers and teaching assistants, which are treated as the “gold standard”. However, it is crucial to acknowledge that even this benchmark is not without flaws. Inconsistencies in grading by both teachers and teaching assistants can occur, even when evaluating the same student’s solutions multiple times [33]. Given the diversity of question types within the dataset, we decided not to categorize questions arbitrarily or based on maximum achievable points. Instead, we designed and employed unsupervised contrastive learning to naturally differentiate and understand the variances in SQL coding approaches without predefined labels. This contrastive model served as the foundational input layer for a secondary model, which projects the SQL code into a high-dimensional latent representation [34]. A latent representation (also called a latent vector or embedding) is a compressed, abstract version of input data that captures its most important feature. The idea of latent representation is to reduce the size and complexity while preserving the most important information in the input data. This creates a new space where we can apply distance metrics. Central to our methodology is the use of distance, more specifically, the Frobenius norm, aiming to model the differences between the high-dimensional vectors representing student and correct SQL codes (Figure 1C). By quantifying this distance, our model predicts the percentage of points deducted from each student’s solution, offering a metric of code correctness (Figure 1D). To further enhance understanding and provide actionable feedback, we implemented two explainable AI techniques: feature ablation and integrated gradients (IGs) [35]. Both methods are crucial for interpreting which specific parts of the student code most significantly impact the prediction outcomes. Feature ablation evaluates the influence of removing certain tokens, while IG computes the contribution of each token to the model’s predictions. Together, these approaches offer deep insights into the model’s decision-making processes, assisting instructors in pinpointing key areas for student improvement and clarifying how the model assesses code quality (Figure 1E).
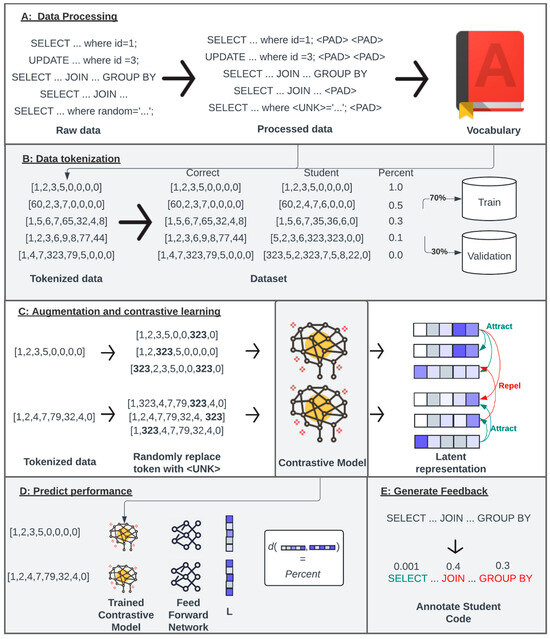
Figure 1.
Overview of the study: (A) The vocabulary was constructed exclusively from tokens identified in the correct SQL code, purposely excluding any student-specific aliases or errors. These non-standard elements were substituted with a placeholder token for unknown elements (<UNK>), ensuring that the vocabulary reflected only the correct syntactic elements of SQL. (B) Each word was replaced with the corresponding integer representing a token. Leveraging the vocabulary derived solely from correct solutions, both student and correct SQL solutions were tokenized. Next, the tokenized student code was paired with its corresponding correct code to ensure accurate comparisons. These pairs were annotated with a percentage value representing the points deducted for errors in the student’s code. The dataset was subsequently divided using the holdout cross-validation method, with 70% allocated for training and 30% reserved for validation to assess model performance. (C) During the model’s training phase, a contrastive learning approach was employed where the tokenized data underwent augmentation by randomly inserting <UNK> tokens (integer 323). The same token sequence, augmented in various ways, formed the basis of positive pairs meant to attract each other in the model’s learning space, whereas all distinct token sequences were treated as negative pairs, intended to be distanced from the first sequence. (D) After training the contrastive model, the model was utilized to train a further model (transfer learning) aimed at predicting the percentage of points deducted. This prediction was based on the measured distance between the high-dimensional latent representations of the student’s submission and the correct solution. (E) Using a predictive model and feature ablation, we generated feedback by evaluating the impact of each token in the students’ code.
3. Design and Methods
3.1. Data Collection
The anonymized dataset used in this study was collected from the exam terms administered between April 2021 and April 2024 as part of a course titled “Introduction to Databases” at the Faculty of Electrical Engineering and Computing in Zagreb, Croatia. The data consist of several paired key components, including the textual description of the question, the maximum achievable points for each question, the student’s submitted SQL code (in PostgreSQL), the correct solution (also in PostgreSQL), and the actual points the student earned based on the submitted code. This dataset provides a detailed record of how students approached SQL problem-solving tasks in an academic setting, offering valuable insight into their understanding and application of SQL concepts. In total, this process resulted in 10,373 observations. For each observation, we computed the percentage of points the students earned. This was computed based on the actual points students earned and the maximum achievable points. We also defined the inverse of that percentage (1 − percentage), which we call percent-wrong, and will use for modeling. Finally, the dataset was split into training and testing subsets following a 70–30 ratio, employing a holdout cross-validation technique (Figure 1B).
3.2. Data Tokenization and Filtering
SQL tokenization involves several stages to standardize the input data. First, both single-line comments (denoted by --) and multi-line comments (enclosed by /*...*/) were removed from the queries to focus solely on the executable portions of the SQL code. To ensure consistency across different formatting styles, all line breaks and tabs were replaced with single spaces, and any occurrences of multiple consecutive spaces were reduced to a single space. Additionally, the queries were converted to lowercase, eliminating any inconsistencies due to case sensitivity and ensuring uniform treatment of SQL keywords and identifiers. Following this, the SQL code was split into individual tokens, capturing meaningful components such as SQL keywords (e.g., select, where), operators (e.g., =, >, <), punctuation (e.g., ,, ;), and other symbols (Figure 1A,B).
To maintain consistency in input length, all SQL code was padded to a fixed maximum length. Sequences shorter than the specified length were padded with a special padding token (<PAD>), allowing them to match the required length without introducing noise. Next, we computed the distribution of SQL sequence lengths and defined a maximum allowable sequence length of 180 tokens, as it captured most SQL queries in the dataset without excluding meaningful information (Supplementary Figure S1). SQL queries that exceeded this length were filtered out of the dataset to prevent potential noise or model performance issues arising from excessively long sequences. This analysis removed 127 observations from the data.
3.3. Vocabulary Definition
The vocabulary for this study was constructed exclusively from the tokens present in the correct SQL solutions, yielding a total of 321 unique tokens. This approach was deliberately chosen to prevent the model from capturing and modeling the high variability often found in student solutions, such as custom alias names or inconsistent token usage. Student submissions frequently contain noise and variability, including random or arbitrary aliases for table and column names, which do not contribute meaningfully to assessing the correctness of the SQL logic. As a result, only the tokens from correct solutions were included in the vocabulary, ensuring that the model focused on evaluating key structural and logical components of the SQL queries. Any student token that is not present in the correct solution’s vocabulary was automatically assigned the <UNK> (Unknown) token, simplifying the analysis and preventing the model from being influenced by irrelevant variability in student submissions. Adding <UNK> and <PAD> to the vocabulary, the final vocabulary resulted in 323 unique tokens (Figure 1A,B).
3.4. Contrastive Model Definition
The contrastive model implemented for this study was designed in Python (version 3.11.10) and PyTorch (version 2.4.1) to compare the embeddings of students and correct SQL queries by projecting them into a high-dimensional latent space. The model architecture was relatively simple, beginning with an embedding layer that transformed tokenized SQL queries into dense vector representations. This embedding layer served as the input layer and was followed by the LSTM layer, effectively summarizing the entire query as a single embedding vector. Next, we used the fully connected hidden layer, which applied a linear transformation to the embeddings. A ReLU activation function was employed to introduce non-linearity to the hidden layer. The final output layer projected the hidden representations into a latent space where the embeddings of the student and correct SQL queries could be compared. The output of the model was normalized using L2 normalization to ensure that the vectors had unit length, making them suitable for computing distances between embeddings (Supplementary Figure S2).
3.5. Contrastive Model Augmentation and Hyperparameter Optimization
Contrastive learning has emerged as a powerful technique in unsupervised machine learning for learning representations by maximizing agreement between differently augmented views of the same data example via a Normalized Temperature-Scaled Cross-Entropy loss (NT-Xent Loss) in the latent space [34,36]. In the context of SQL analysis, SimCLR (a simple framework for contrastive learning of visual representations) can be adapted for an unsupervised setting where the primary task is to create a latent representation where similar code is grouped, and different code is far away. This adaptation involves creating augmented versions of SQL data by selectively introducing unknown tokens, effectively simulating variations in SQL queries that a model might encounter in practical scenarios (Figure 1C). This method is advantageous for enhancing the model’s robustness and ability to discern nuanced differences in SQL queries, such as syntax errors or logical discrepancies. In our study, augmentation was implemented by replacing certain percentages of tokens in SQL sequences with a <UNK> token. Each SQL sequence was augmented at least five times, creating the positive pairs for the contrastive learning process. The percentage of tokens replaced in each sequence was determined dynamically during hyperparameter optimization for the contrastive model using the Optuna library (version 4.0.0). Over the course of 100 trials, with each trial running for 100 epochs and a batch size of 1024, Optuna explored a range of values for several hyperparameters (Figure 2A):
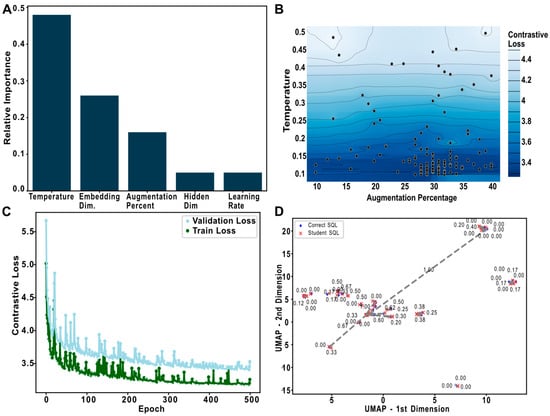
Figure 2.
Contrastive model training: (A) This panel illustrates the impact of various hyperparameters on the performance of the contrastive model, as determined through systematic testing using the Optuna framework. The results highlight which parameters are most influential in optimizing the model’s accuracy and efficiency. (B) This contour plot visualizes the interaction between two critical hyperparameters: the temperature and augmentation percentage. The plot demonstrates how different combinations of these parameters affect the model’s performance, providing insights into the optimal settings for achieving the lowest contrastive loss. (C) Featured here is a line plot that tracks the evolution of the contrastive model’s training over multiple epochs. The plot uses distinct colors to differentiate between the training and testing phases: green for training loss and light blue for validation loss. (D) After training, the latent space is projected into a two-dimensional space using Uniform Manifold Approximation and Projection (UMAP) for easier visualization and analysis. This projection is used to assess how well the model separates or clusters different SQL queries based on their syntactic and semantic similarities, reflecting the effectiveness of the learned embeddings. The dotted line and the number on it are the distance between two latent representations.
- Learning Rate: The learning rate was varied between 1 × 10⁻⁵ and 1 × 10⁻², allowing the optimization process to find a balance between convergence speed and stability.
- Embedding Dimension: Embedding dimensions represent the number of values (or features) used to represent each token (word or symbol) in a dense vector space. In natural language processing and machine learning, embedding is a way to encode categorical data (like words, tokens, or characters) into continuous-valued vectors that capture semantic relationships. A smaller embedding dimension might not capture the full complexity of a token’s relationships, leading to a less nuanced model, while a larger dimension may provide more expressive power but also risks overfitting or increased computational cost. The dimensionality of the embeddings was adjusted from 32 to 256, which influences the model’s ability to encapsulate token information in a dense form.
- LSTM Hidden Dimension: Long Short-Term Memory (LSTM) networks are a type of recurrent neural network (RNN) used for sequence modeling. The “hidden dimension” refers to the number of neurons in the hidden layers of the LSTM. These neurons store the state of the network, which helps the LSTM retain information over time (important for tasks like language modeling or sequence prediction). The hidden dimension is crucial in determining the model’s capacity: a smaller hidden dimension (e.g., 32 neurons) may restrict the LSTM’s ability to model complex relationships within data, while a larger dimension (e.g., 256 neurons) can capture more intricate dependencies. Similar to the embedding dimension, the size of the hidden layers varied from 1 to 256, affecting the model’s capacity and complexity.
- Temperature: In contrastive learning, the temperature is a hyperparameter that influences the magnitude of the similarity between positive (correct) and negative (incorrect) pairs in the contrastive loss function. It controls how strongly the model penalizes incorrect predictions in comparison to correct ones. The temperature is typically used in the SoftMax function to scale the logits before calculating the loss, affecting how “hard” or “soft” the decision boundary is between pairs. A higher temperature (e.g., 0.9) leads to a softer distinction between positive and negative pairs, which could help the model generalize better, while a lower temperature (e.g., 0.1) sharpens the distinction, making the model more confident. In our case, varying the temperature between 0.1 and 0.9 explores different levels of contrastive loss sensitivity.
- Augmentation Percentage: Augmentation in this context refers to introducing artificial noise by replacing a portion of tokens in the sequence with a special token (e.g., <UNK> for unknown). This technique helps simulate real-world variability and can enhance the model’s robustness and generalization. By varying the augmentation percentage (from 10% to 50%), the study tests how the model reacts to different levels of noise. A higher augmentation percentage introduces more challenges, encouraging the model to learn more generalized representations, while a lower percentage might allow the model to focus more on learning specific patterns in the data. The percentage of tokens replaced by <UNK> in each sequence was varied from 10% to 50%, testing different levels of noise to understand its impact on model training and generalization.
- Latent representation: A latent representation refers to a learned, lower-dimensional encoding or vector representation of data in a model. This representation captures the underlying, abstract features of the data, which may not be immediately apparent in the raw input but are critical for the model to understand patterns and make predictions. In natural language processing (NLP), the latent representation of a sentence may capture semantic information, such as the overall meaning or intent, rather than individual words. In contrastive learning, such latent representations of positive (correct) and negative (incorrect) pairs are compared to help the model learn to distinguish between similar and dissimilar items.
The hyperparameter optimization conducted using the Optuna library determined the ideal settings for our contrastive learning model, achieving the lowest validation NT-Xent loss. The best configuration included an augmentation percentage of 34%, which indicates that a fifth of the tokens in each SQL query were replaced with <UNK> tokens to simulate variability. The embedding dimension was set to 76, an LSTM’s hidden dimension of 12, a learning rate of 0.005032, and a temperature parameter of 0.03189 in the NT-Xent loss function. After completing all hyperparameter search trials, we observed that the temperature was the most critical hyperparameter. The relative importance of hyperparameters was computed using the Optuna framework, which uses fANOVA tests and normalizes the score; therefore, the sum of the importance values is equal to 1.0. The temperature parameter significantly influences how contrastive loss compares to negative samples. Specifically, a lower temperature value intensifies the penalties on the negative samples. This higher penalization ensures that the local structure of each sample is more distinctly separated, emphasizing a clearer differentiation among the data points in the model’s learning process. The next most influential hyperparameter was the embedding dimension, underscoring the importance of selecting an appropriate size for the embedding layer for the specific task at hand (Figure 2A,B). The third most important hyperparameter was the percentage of augmentation, which ensured the robustness and generalizability of the model. Effective augmentation ensures that the model can recognize and react to the essence of the data rather than just “memorizing” specific data configurations. To further evaluate the impact of the augment percentage and temperature on the performance of the model, we generated a contour plot visualizing the contrastive loss as a function of both these hyperparameters (Figure 2B). This visualization revealed an interesting pattern: lower values of temperature tended to perform better when paired with augmentation around 30%. The contour plot effectively highlighted regions of parameter space where the model achieved lower losses, providing valuable insights into the optimal combinations of temperature and augmentation percentage for this specific task (Figure 2B, Supplementary Figure S3).
3.6. Predictive Model Hyperparameter Optimization
We implemented a predictive model developed using the contrastive model as a feature extractor to leverage the learned representations of SQL queries. The contrastive model served as the input layer, where it projected the SQL queries into a latent space, which the predictive model then utilized to derive further insights using two dense layers followed by L2 normalization that formed the final output, projecting the data into a newly defined latent space. This model was also subjected to hyperparameter optimization using the Optuna library. The architecture of the predictive model incorporated the pre-trained contrastive model, which was either fine-tuned or used as a static feature extractor depending on the hyperparameter settings optimized via Optuna. Allowing the contrastive model to fine-tune its weights (i.e., adjusting the pre-trained weights during training) proved to be far superior compared to keeping the weights static or locked, indicating that the model benefits significantly from adapting to the nuances of the new task (Supplementary Figures S4 and S5). This hyperparameter optimization resulted in the best configuration, as follows: learning rate = 0.0047, new latent space dimension = 228, contrastive model fine-tuning = True.
3.7. Integrated Gradients
In our analysis, we utilized the integrated gradients method from the Captum library (version 0.7.0) to derive gradients associated with each input token in the student SQL submissions. Captum, which is specifically designed for model interpretability within the PyTorch ecosystem, provides robust tools for attributing the predictions of neural networks to their input features. Integrated gradients is a feature attribution technique that quantifies the contribution of each input feature by computing the path integral of the gradients of the model’s output with respect to the input features. Specifically, it integrates the gradients along a straight-line path from a baseline input (e.g., an all-zero embedding or neutral token representation) to the actual input. This approach satisfies axiomatic properties such as sensitivity and implementation invariance, making it theoretically grounded and practically effective for attributing model predictions. In the integrated gradients formulation, represents the i-th feature of the actual input, while the is the corresponding feature of the baseline input. The variable is a scaling factor that traces a linear path from the baseline input to the actual input. The term denotes the gradient of the model’s output with respect to the i-th input feature, as follows:
By employing the integrated gradients technique, we were able to calculate the contribution of each token in the student’s SQL code to the model’s output, thus identifying how individual tokens influence the predicted distance metric.
3.8. Feature Ablation
To estimate the relative importance of each token in the student’s SQL code, we performed a feature ablation procedure by systematically replacing individual tokens with a special <UNK> (unknown) token and measuring the resulting change in embedding space distance. The goal of this approach is to quantify how much each token contributes to the overall semantic alignment between the student’s solution and the correct reference. For a given pair of tokenized sequences, correct SQL () and student SQL (, we first computed their latent representations using the shared encoder model. The baseline distance between these representations was calculated as the L2 norm as follows:
where f(⋅) denotes the model’s embedding function. Then, for each token position i in the student’s sequence, we replaced the i-th token with the <UNK> token to generate a perturbed version of the student’s input. The perturbed representation was passed through the model, and a new distance was calculated between the perturbed student’s representation and the original correct representation. The change in distance, defined as follows:
A larger indicates a greater influence of the corresponding token on the model’s ability to align the student solution with the correct one.
3.9. Code Availability
The code used for model training and generating the figures presented in this study is available on the GitHub repository (https://github.com/mxs3203/Grader.git, accessed on 20 April 2025). This repository includes scripts used in analysis and model training.
3.10. Computational Requirements
Our system was equipped with the following specifications: AMD Ryzen 9 5950X 16-Core Processor for CPU processing, an NVIDIA GEFORCE RTX3080 (24 GB VRAM) for GPU acceleration, and 64 GB of RAM. To harness the power of GPU computation, we utilized CUDA version 12.0, with the GPU driver version set to 525.60.13.
4. Results and Discussion
4.1. Contrastive Model Training
Once the optimal hyperparameters for the contrastive model were determined, we proceeded to train the model for 500 epochs using these parameters, continuing until the model reached convergence (Figure 2C). This extended training period allowed the model to thoroughly learn and adapt to the nuances of the SQL queries, ensuring that it could accurately differentiate between student submissions and correct solutions based on their structural and semantic similarities and differences. To visualize and better understand the behavior of the model, we employed Uniform Manifold Approximation and Projection (UMAP) to reduce the high-dimensional space generated by the model into a more interpretable two-dimensional space [37]. The UMAP visualization provided insightful visual feedback on the effectiveness of the model’s learning process. It demonstrated that student solutions were projected close to the correct solutions in the latent space when they resembled the correct SQL code (Figure 2D). Conversely, solutions with a higher percentage of incorrect code were positioned further away from their corresponding correct solutions. This spatial arrangement in the UMAP plot was closely associated with the “percentWrong” score, where the distance in the plot correlated with the degree of errors in the student submissions. This visualization not only confirmed the model’s ability to capture and reflect the quality of SQL solutions but also offered a tangible representation of how student errors were distributed relative to correct implementations (Figure 2D). More importantly, the model effectively clustered the data based on similarity, creating a latent space that automatically groups similar types of questions. This was particularly crucial as the dataset we used contains a wide range of SQL code complexities, spanning from simple SELECT statements to more complex queries involving multiple joins followed by GROUP BY operations. This allowed us to group the data using a data-driven method without manually grouping the questions.
4.2. Predictive Model Training
In the development of our predictive model, we leveraged a pre-trained contrastive model as the foundational input layer, adding two additional layers to create a new latent representation optimized for predicting the percentage of deducted points. The reason we want to predict this percentage is that we are using distance-based prediction; therefore, we want larger distances to represent a larger percentage of point deduction. This approach effectively translates the physical distances in the latent space into meaningful, quantifiable measures of similarity or dissimilarity between the student’s SQL solutions and the correct SQL solutions. By feeding the student and correct solutions independently into the model, each is transformed into its respective latent representation.
4.3. Using Latent Representation in Distance Computation
The Frobenius norm of the difference between these representations is then calculated, providing a scalar value that represents the ‘distance’ between the student’s attempt and the correct solution.
This distance is normalized and used directly as a predictive factor in the loss function (mean squared error), enabling the model to fine-tune the latent spaces in such a way that they align with the expected percentage of points deducted for errors in the SQL code ().
First, our experimental approach evaluated the efficacy of fine-tuning versus a transfer learning strategy of a contrastive model to ascertain the most effective method for our specific application. In the fine-tuning approach, we allowed the weights of the contrastive model to be adjusted during training, thereby adapting the pre-learned representations to better suit our predictive requirements. Conversely, in the transfer learning approach, the weights of the contrastive model were frozen, thus utilizing the model solely as a feature extractor. The results from these experiments showed that fine-tuning the model significantly enhanced its predictive accuracy, yielding a mean squared error (MSE) of 0.02 on the validation dataset (Figure 3A). This was markedly lower than the MSE obtained from the transfer learning approach, which recorded a higher error rate of 0.03 and, after the 400th epoch, an upward trend of validation loss, indicating overfitting. Based on this experiment, we finally trained the model using a fine-tuning approach and used that model for the following tasks (Figure 3B). To visualize the performance, we made a scatter plot showing the validation data ground truth vs. predicted distance, indicating a strong association (r = 0.97, p < 0.0001) (Figure 3C).
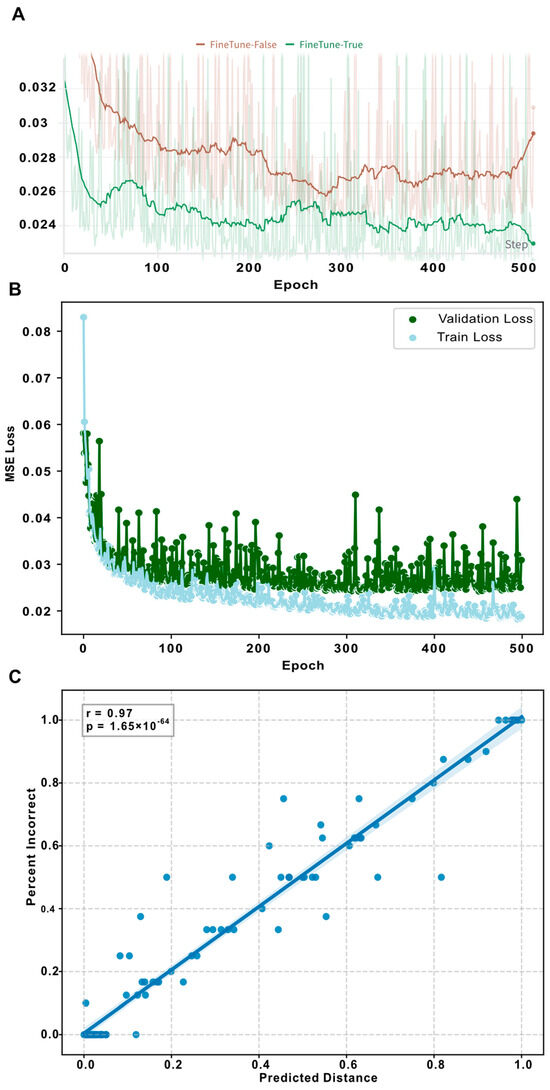
Figure 3.
Predictive model training: (A) This line plot contrasts the validation mean squared error (MSE) of the predictive model under two scenarios: with and without fine-tuning of the underlying contrastive model. The plot clearly demonstrates that allowing fine-tuning leads to superior performance, as evidenced by lower MSE values. Importantly, it also suggests that fine-tuning helps in preventing potential overfitting, enhancing the model’s ability to generalize to new data. (B) The second line plot in this figure tracks the training process of the predictive model, highlighting the loss metrics over successive training epochs. Green is used to denote the validation loss, while light blue represents the training loss. (C) The regression plot shows the validation data only. The X-axis represents the predicted distance by the model, while the y-axis represents the ground truth, the percentage of incorrectness while graded (percentWrong). We also fitted a simple regression line, which shows that the predicted value (distance) and ground truth value (percentWrong) are strongly associated (r = 0.97, p < 0.001).
4.4. Feature Ablation Analysis Indicates Highly Important Tokens in Student Code
The trained predictive model is employed to deliver targeted feedback on SQL solutions in the validation dataset, utilizing a feature ablation method to evaluate the influence of individual tokens. This method starts by processing both the student’s solution and the correct solution through the model to generate their latent representations. The initial distance between these representations is computed using the Frobenius norm, serving as the baseline for subsequent comparisons. Subsequently, we conduct a systematic ablation of the student’s code by replacing each token sequentially with a <UNK> token, which represents an unknown or missing element. This modification is intended to simulate the removal of specific information from the student’s submission. After each replacement, the ablated student solution is re-evaluated through the model to obtain a new latent representation, and the distance from the correct solution’s representation is recalculated. The key metric derived from this process is the absolute difference between the newly computed distance (after ablation) and the baseline distance. This difference quantifies the impact of each specific token on the overall distance between the student and the correct code (Figure 4A). Tokens that increase the distance when replaced suggest high relevance to the correctness of the code, indicating that their correct usage or presence is vital for aligning the student’s solution more closely with the correct solution (Figure 4B,C).
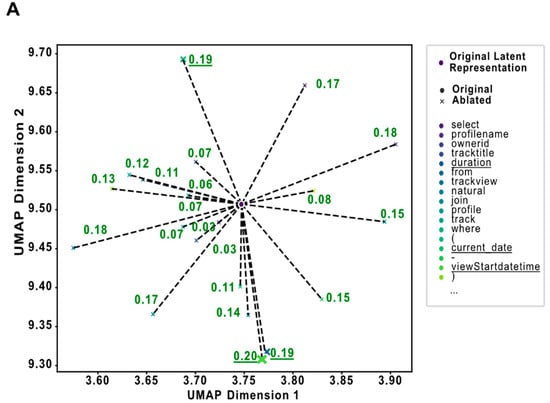
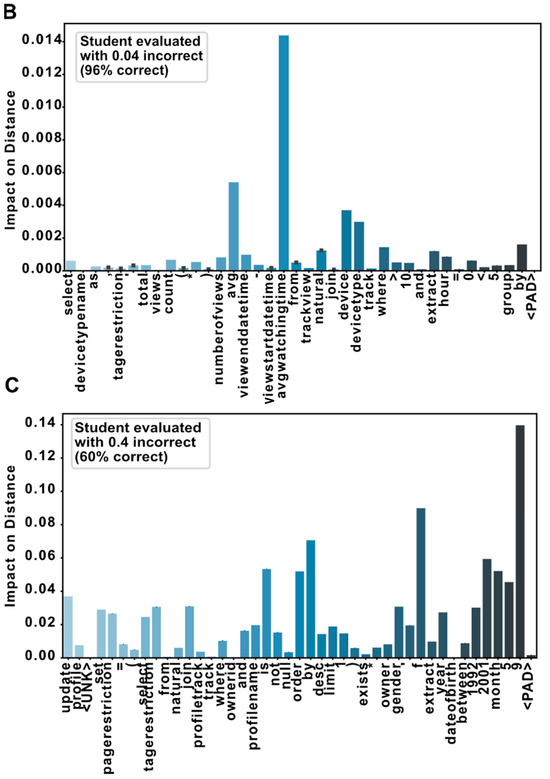
Figure 4.
Ablation analysis: (A) This plot illustrates a simplified example to demonstrate the impact of token ablation on the embedding of an SQL query in a two-dimensional latent space. Each point represents the embedding of the entire SQL code, either with all tokens present (‘Original’) or with one token replaced by a <UNK> token (‘Ablated’). The lines connecting the original embedding to each ablated version highlight how the removal of specific tokens affects the spatial representation of the SQL code. Distances annotated on these lines quantify the change in the embedding caused by each token’s ablation. (B) This panel displays an example of a student’s SQL code that was evaluated as correct by the model. Each token in the code is annotated based on its impact on the distance metric used in the model. Notably, the impacts associated with each token are relatively low, indicating that the code closely aligns with the correct SQL standards and contains no significant errors. (C) This section presents an example of a student’s SQL code that the model assessed as 40% incorrect. The analysis highlights specific tokens that have the highest impact on increasing the distance from the correct solution, signifying potential errors. The tokens with major impacts are ‘order’, ‘by’, ‘f’, ‘2001’, ‘month’, ‘5’, and ‘9’. These findings suggest that the primary issues may lie in the misuse of the ‘ORDER BY’ clause or incorrect values within the query, particularly in parts of the code handling dates and sorting mechanisms. This targeted identification of problematic tokens provides clear guidance on where the students should focus their revisions to improve the accuracy of their SQL code.
4.5. Using Integrated Gradients to Find Impactful Tokens
In the study, we further enhanced our methodology by implementing integrated gradients (IGs), a technique well-suited for providing granular insights into the model’s decision-making process. This method allowed us to quantify the influence of individual tokens within the student’s SQL code on the model’s predictions. By leveraging this approach, we aimed to uncover which specific aspects of the SQL code contributed most significantly to the computed distance between the students’ submission and the correct solution. We began by passing both the correct and the student SQL through the predictive model to obtain their respective latent representations. The Frobenius norm was then calculated between these two representations to establish a baseline measure of similarity or discrepancy. IG was applied to analyze how slight modifications to each token in the student’s SQL influenced this baseline distance. The results of this analysis were then compiled into a comprehensive feedback report where gradients annotated each token in the student’s code. Tokens with the highest positive gradients were marked as areas needing the most attention, directly pointing out errors that had a disproportionate impact on the model’s assessment of the code’s accuracy. Conversely, tokens with minimal impact on the distance provided reassurance about their correctness or their lesser relevance to the errors being evaluated. Here we visualized three distinct scenarios from the validation dataset, demonstrated varying levels of code correctness, and provided clear, actionable feedback based on the model’s analysis (Figure 5A–C). In the first scenario, where the student’s solution was nearly perfect with a prediction of only 1% incorrect, the IG revealed very small changes in gradients across all tokens, confirming that no specific part of the code significantly deviated from the correct implementation (Figure 5A, Supplementary Figure S6). The second scenario featured a solution with 43% predicted errors, where IG highlighted large positive gradients in specific areas related to numerical calculations and SQL clauses. This pinpointed the erroneous sections that led to the substantial deductions (Figure 5B, Supplementary Figure S7). Finally, in the third scenario, a solution was scored as 90% incorrect, which showcased widespread large positive gradients across most tokens, indicating errors throughout the SQL code (Figure 5C, Supplementary Figure S8). Interestingly, the negative gradients, which indicate correct code, are minimal for <UNK> tokens. This likely reflects the method’s ability to accurately identify tokens that correctly align with the expected SQL syntax and semantics when the initial prediction indicated almost fully incorrect code.
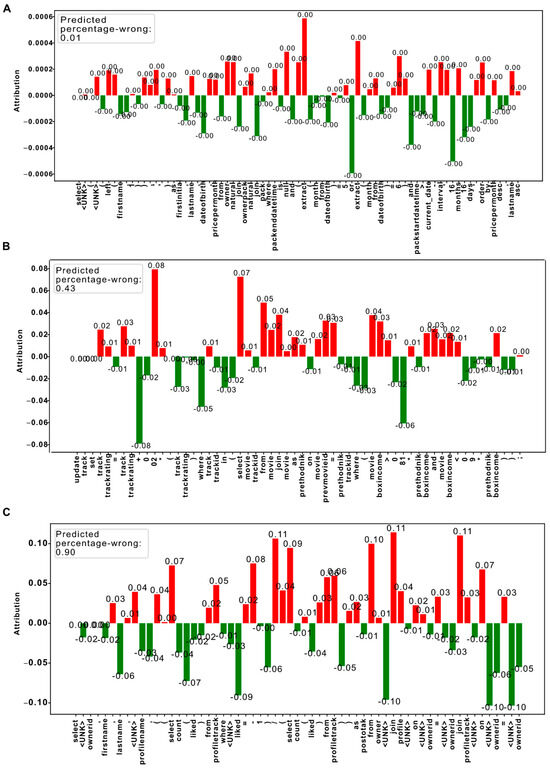
Figure 5.
Integrated Gradients analysis: (A) near-perfect code (1% Incorrect). This bar plot visualizes the integrated gradients for a student’s SQL code, which was predicted to be only 1% incorrect. Each bar represents a token from the student’s SQL submission, with the height of the bar indicating the magnitude of the gradient associated with each token. (B) Partially correct code (43% Incorrect). This bar plot displays the integrated gradients for a student’s SQL code predicted to be 43% incorrect. The tokens that impacted the correctness of the code, such as those involved in erroneous numerical calculations and incorrect SQL clause structures, are highlighted with larger positive gradients. (C) Largely incorrect code (90% Incorrect). In this bar plot, the integrated gradients for a student’s SQL code predicted to be 90% incorrect are shown. Nearly all tokens exhibit relatively large positive gradients, indicating a widespread lack of understanding or multiple fundamental errors in the SQL submission.
5. Discussion
Recent research on automated SQL grading has seen a rapid maturation of techniques leveraging both static and dynamic analysis, as well as hybrid approaches that integrate elements of text similarity or natural language processing (NLP) [9,10,13,14]. This evolution reflects ongoing efforts to balance the practical need for scalable, reliable grading with deeper insights into student errors. While our proposed method, built on contrastive learning combined with feature ablation and integrated gradients (IGs), addresses some limitations in interpretability and adaptability, several critical nuances require further scrutiny when comparing our work to established state-of-the-art techniques. The introduction of a contrastive model allowed us to bifurcate the task into two distinct components, each handled by simpler models rather than a single complex one. This separation facilitated a more focused approach to learning and adapting the features relevant to our objective. By adopting a framework that utilizes two simpler models in tandem with advanced explainable AI methods, we effectively navigate the trade-off between model complexity and interpretability. This approach not only simplifies the understanding of the model’s functioning but also enhances the reliability and instructional value of the feedback provided to learners.
First, contrastive learning offers a structured way to capture both syntactic and semantic differences between student and correct SQL. By creating a high-dimensional latent space, it encodes subtle, token-level misalignments that static analysis may overlook (e.g., logical equivalences) or dynamic analysis might misjudge if the underlying dataset does not reflect all erroneous edge cases [4,10,13]. However, while dynamic analysis sometimes fails to identify where partial errors lie within a query, it excels in confirming correctness when the data fully captures the query’s intended output. Consequently, a purely contrastive framework must ensure it does not penalize legitimate query variations (e.g., alternate join strategies) that yield the same results. Future refinements might merge generative data augmentation [14,17,18] with our approach; therefore, the model is exposed to both typical and edge-case query patterns, ultimately improving alignment with ground-truth correctness.
Second, explainable AI (XAI) is receiving increasing emphasis, particularly in educational settings where students and instructors need transparent, high-quality feedback [7,25,32]. Although our combination of feature ablation and IG offers interpretability by highlighting the tokens that most affect the predicted “distance”, a more in-depth hierarchical view could bring the system closer to actual instructor feedback standards. For instance, DeepLIFT or integrated gradients could be adapted to cluster or group tokens into SQL clauses (e.g., SELECT, WHERE, GROUP BY) and interpret them collectively [38]. This more granular explainability would help educators pinpoint not just which tokens, but which sections of a query contribute most to errors, which is particularly important for more advanced SQL constructs like subqueries or window functions [9,11,12,38]. In our study, to ensure clarity in how our model processes and interprets data, and to generate meaningful feedback for educational purposes, we employed two prominent explainable AI techniques: feature ablation and integrated gradients (IGs). These methods, though fundamentally different in their approach, provide valuable insights into the influence of specific code elements on the model’s predictions. While feature ablation systematically assesses the impact of removing tokens, integrated gradients quantify the contribution of each token to the prediction output. Furthermore, alternative methodologies such as DeepLIFT [39], which shares similarities with IG in tracing output sensitivity back to inputs, could also be explored to enrich our understanding and interpretation of model decisions.
Third, state-of-the-art machine learning-based approaches using transformer architectures (e.g., BERT variations) or attention-based convolutional neural networks [7,8,28] typically excel in capturing contextual relationships between tokens. Compared to purely recurrent networks, these advanced models can handle longer or more complex SQL queries with fewer issues of vanishing gradients or lost context. Such transformer-driven methods can potentially outperform simpler LSTM pipelines when the query structure becomes intricate or students use a wide variety of syntactic forms. While our model offers a simpler two-component pipeline (contrastive model + predictive model) conducive to interpretability, adapting or fine-tuning a pre-trained language model might capture deeper nuances, especially for advanced queries. This trade-off between using advanced architectures for performance and explainability remains a key tension in the field [25,31,32]. Moreover, our methodology employs a non-parametric approach, which allows for a more flexible adaptation to the data without assuming a fixed parameter model structure. This flexibility is crucial in capturing the differences and similarities in SQL coding styles across diverse datasets. By not strictly adhering to parametric assumptions, our model can more accurately reflect the inherent variability and complexity of real-world student submissions, making it a robust tool for educational assessments.
Conversely, the framework is trained on a limited amount of data (N = 10,373) and uses only PostgreSQL solutions. This constraint hinders the generalization of the findings, as the model may not perform as well when applied to other SQL dialects (e.g., MySQL or T-SQL) or larger, more varied datasets. Furthermore, the model’s foundation relies heavily on manually assigned grades, treated as the “gold standard”. However, human grading can be inconsistent, and the assumption that teacher-assigned grades are flawless might introduce bias into the model. The interpretation and partial grading remain key areas for further innovation. Our feature ablation and IG approaches show which tokens drive the prediction; however, a more domain-specific alignment of errors could contextualize common mistakes in SQL (e.g., misuse of ORDER BY, incorrect join conditions, or logical errors in subqueries). A system that dynamically organizes errors into recognized categories (structural, logical, semantic) could provide not just where but why the SQL is incorrect—a level of actionable detail valuable to both novices and instructors [13,14,16]. Indeed, a frequent critique of “black-box” scoring is that it lacks actionable next steps for students. By enhancing the interpretability layers and connecting them to widely known taxonomies of SQL mistakes, we could strengthen the educational impact.
Lastly, model generalization stands as a significant concern. Much like earlier hybrid or language-based solutions, our approach is tested on a specific set of PostgreSQL queries. Extending the approach to T-SQL or MySQL might require either re-tokenization or domain-specific adaptation, as even small dialect changes in syntax (e.g., date handling, proprietary functions) can degrade performance [7,20,21,22,39]. Indeed, ensuring portability and consistency across different contexts is one reason purely dynamic solutions, albeit limited in partial grading, remain popular. Future work could incorporate domain adaptation strategies or meta-learning to robustly handle cross-dialect variations in SQL syntax while preserving interpretability.
6. Conclusions and Future Work
This study presents a novel approach to automated SQL grading that integrates contrastive learning and explainable AI techniques, providing both high accuracy and transparency in the grading process. We demonstrate that by comparing student SQL solutions to correct solutions using a contrastive learning model, we can predict the degree of error in a student’s code with an accuracy that closely aligns with human grading. Additionally, the use of explainable AI methods, such as feature ablation and integrated gradients, allows for actionable feedback by pinpointing specific areas of the code that influence grading outcomes.
Unlike many APASs that rely solely on static or dynamic analysis, our model captures a deeper understanding of SQL queries by considering both structural and semantic differences between student and correct solutions. From an educational perspective, this method significantly enhances the feedback loop between instructors and students. By automatically grading SQL code and highlighting specific mistakes, the system reduces the time instructors spend on grading, allowing them to focus more on individual student needs. Furthermore, the transparency of the model ensures that instructors can trust the grading process, while students receive clear insights into the areas they need to improve. Overall, the results suggest that this framework could be a valuable tool for improving the scalability and effectiveness of automated grading systems in programming education. It provides consistent, objective, and interpretable feedback that is more aligned with human grading practices, and it could serve as a foundation for future APAS implementations in various programming languages.
Future Work
Building on the results and insights from this study, several of the following key directions for future work have been identified to enhance the framework and further its application in educational contexts:
Expansion to Multiple SQL Dialects: One of the primary avenues for improvement is extending the framework to support a wider variety of SQL dialects, such as T-SQL and MySQL. This expansion will involve adapting the model to handle the syntactic and semantic differences across SQL dialects, ensuring its robustness across different database systems. This enhancement would broaden the model’s applicability, making it more suitable for a diverse range of educational institutions and contexts.
Refinement of Preprocessing and Tokenization: The current preprocessing steps could be refined to better filter out irrelevant elements in SQL code, such as aliases and other custom identifiers. These elements often do not contribute meaningfully to the semantic correctness of SQL queries. By improving the tokenization process to focus more precisely on the core SQL syntax and logical structure, we can further enhance the model’s ability to evaluate the correctness of student submissions. This improvement will ensure that the model focuses on the elements that are most indicative of a student’s understanding of SQL, rather than being influenced by idiosyncratic variations in their code.
Incorporation of a Broader Range of SQL Query Types: Expanding the dataset to include a more diverse set of SQL queries is crucial for improving the model’s ability to assess complex SQL tasks. This includes adding queries that incorporate advanced features such as subqueries, complex joins, and nested operations. By doing so, the model can be trained to evaluate more sophisticated aspects of SQL coding, ultimately providing a deeper and more comprehensive assessment of student proficiency. This addition will also help ensure that the model remains relevant as the complexity of SQL-based assignments increases in higher education curricula.
Enhancement of Feedback Mechanisms: Future work should also focus on expanding the feedback capabilities provided by the system. While the current model offers insights based on token ablation and integrated gradients, there is potential for incorporating more detailed, actionable feedback. This could include personalized recommendations for improving specific SQL skills or offering additional resources based on the errors detected in students’ solutions. By broadening the scope of feedback, we can ensure that students receive not only a grading score but also a deeper understanding of where they went wrong and how they can improve.
These advancements will continue to bridge the gap between automated code evaluation and actionable educational feedback, thereby enriching the learning experience for students navigating the complexities of SQL programming.
Supplementary Materials
The following supporting information can be downloaded at: https://www.mdpi.com/article/10.3390/make7020041/s1, Figure S1: Histogram showing the length of sequences for correct solutions and student solutions. Figure S2: Contrastive model architecture containing embedding as input layer, which is then input into LSTM and finally produces a latent representation (embedding). Once the contrastive model was trained, the output layer was added. Figure S3: Parallel line plot showing all hyperparameter optimization trials for contrastive models. The plot shows ideal hyperparameters with dark blue (low contrastive loss). Figure S4: The bar plot shows showing relative importance of each hyperparameter in a predictive model. Figure S5: The plot shows all Optuna trials for predictive models, indicating that fine-tuning worked better in most cases. Figure S6: The illustration represents correct tokens compared to student tokens for the student with a completely correct solution. Figure S7: The illustration represents correct tokens compared to student tokens for the student with partially correct code. Figure S8: The illustration represents correct tokens compared to student tokens for the student with a completely wrong solution.
Author Contributions
M.S. and M.F. conceived and designed the experiments; M.S. performed the experiments, developed the methodology, analyzed the data, wrote the initial manuscript, and supervised the project. M.F. contributed to the methodology and assisted in writing the manuscript with a focus on the analysis sections. I.M. contributed to the development of data collection tools and manuscript writing. L.M. assisted in refining the experimental design and provided critical feedback on the manuscript. All authors have read and agreed to the published version of the manuscript.
Funding
This research received no external funding.
Data Availability Statement
The data are currently used in an ongoing study but can be accessed upon request from the corresponding author.
Conflicts of Interest
The authors declare that they have no conflicts of interest.
References
- Tharmaseelan, J.; Manathunga, K.; Reyal, S.; Kasthurirathna, D.; Thurairasa, T. Revisit of automated marking techniques for programming assignments. In Proceedings of the 2021 IEEE Global Engineering Education Conference (EDUCON), Vienna, Austria, 21–23 April 2021. [Google Scholar] [CrossRef]
- Rößling, G.; Joy, M.; Moreno, A.; Radenski, A.; Malmi, L.; Kerren, A.; Naps, T.; Ross, R.J.; Clancy, M.; Korhonen, A.; et al. Enhancing learning management systems to better support computer science education. ACM SIGCSE Bull. 2008, 40, 142–166. [Google Scholar] [CrossRef]
- Albluwi, I. A closer look at the differences between graders in introductory computer science exams. IEEE Trans. Educ. 2018, 61, 253–260. [Google Scholar] [CrossRef]
- Mekterovic, I.; Brkic, L.; Milasinovic, B.; Baranovic, M. Building a comprehensive automated programming assessment system. IEEE Access 2020, 8, 81154–81172. [Google Scholar] [CrossRef]
- Hollingsworth, J. Automatic graders for programming classes. Commun. ACM 1960, 3, 528–529. [Google Scholar] [CrossRef]
- Insa, D.; Silva, J. Automatic assessment of Java code. Comput. Lang. Syst. Struct. 2018, 53, 59–72. [Google Scholar] [CrossRef]
- Sooksatra, K.; Khanal, B.; Rivas, P.; Schwartz, D.R. Attribution scores of BERT-based SQL-query automatic grading for explainability. In Proceedings of the 2023 International Conference on Computational Science and Computational Intelligence (CSCI), Las Vegas, NV, USA, 13–15 December 2023. [Google Scholar] [CrossRef]
- Rivas, P.; Schwartz, D.R. Modeling SQL Statement Correctness with Attention-Based Convolutional Neural Networks. In Proceedings of the 2021 International Conference on Computational Science and Computational Intelligence (CSCI), Las Vegas, NV, USA, 15–17 December 2021; pp. 64–71. [Google Scholar]
- Paiva, J.C.; Leal, J.P.; Figueira, Á. Automated assessment in computer science education: A state-of-the-art review. ACM Trans. Comput. Educ. 2022, 22, 1–40. [Google Scholar] [CrossRef]
- Kelkar, A.; Relan, R.; Bhardwaj, V.; Vaichal, S.; Khatri, C.; Relan, P. Bertrand-DR: Improving Text-to-SQL using a Discriminative Re-ranker. arXiv 2020, arXiv:2002.00557. [Google Scholar]
- Wang, S.; Pan, S.; Cheung, A. QED: A powerful query equivalence decider for SQL. Proc. VLDB Endow. 2024, 17, 3602–3614. [Google Scholar] [CrossRef]
- He, Y.; Zhao, P.; Wang, X.; Wang, Y. VeriEQL: Bounded equivalence verification for complex SQL queries with integrity constraints. Proc. ACM Program Lang. 2024, 8, 1071–1099. [Google Scholar] [CrossRef]
- Stajduhar, I.; Mausa, G. Using string similarity metrics for automated grading of SQL statements. In Proceedings of the 2015 38th International Convention on Information and Communication Technology, Electronics and Microelectronics (MIPRO), Opatija, Croatia, 25–29 May 2015. [Google Scholar] [CrossRef]
- Bhangdiya, A.; Chandra, B.; Kar, B.; Radhakrishnan, B.; Reddy, K.V.M.; Shah, S.; Sudarshan, S. The XDa-TA system for automated grading of SQL query assignments. In Proceedings of the 2015 IEEE 31st International Conference on Data Engineering, Seoul, Republic of Korea, 13–17 April 2015. [Google Scholar] [CrossRef]
- Chandra, B.; Banerjee, A.; Hazra, U.; Joseph, M.; Sudarshan, S. Automated grading of SQL queries. In Proceedings of the 2019 IEEE 35th International Conference on Data Engineering (ICDE), Macao, 8–11 April 2019. [Google Scholar] [CrossRef]
- Chandra, B.; Joseph, M.; Radhakrishnan, B.; Acharya, S.; Sudarshan, S. Partial marking for automated grading of SQL queries. Proc. VLDB Endow. 2016, 9, 1541–1544. [Google Scholar] [CrossRef][Green Version]
- Chandra, B.; Chawda, B.; Kar, B.; Reddy, K.V.M.; Shah, S.; Sudarshan, S. Data generation for testing and grading SQL queries. VLDB J. 2015, 24, 731–755. [Google Scholar] [CrossRef]
- Chandra, B.; Chawda, B.; Shah, S.; Sudarshan, S.; Shah, A. Extending XData to kill SQL query mutants in the wild. In Proceedings of the Sixth International Workshop on Testing Database Systems, New York, NY, USA, 24 June 2013; ACM: New York, NY, USA, 2013. [Google Scholar] [CrossRef]
- Khurana, D.; Koli, A.; Khatter, K.; Singh, S. Natural language processing: State of the art, current trends and challenges. Multimed. Tools Appl. 2023, 82, 3713–3744. [Google Scholar] [CrossRef] [PubMed]
- Sung, C.; Dhamecha, T.; Saha, S.; Ma, T.; Reddy, V.; Arora, R. Pre-training BERT on domain resources for short answer grading. In Proceedings of the 2019 Conference on Empirical Methods in Natural Language Processing and the 9th International Joint Conference on Natural Language Processing (EMNLP-IJCNLP), Hong Kong, China, 3–7 November 2019; Association for Computational Linguistics: Stroudsburg, PA, USA, 2019. [Google Scholar] [CrossRef]
- Devlin, J.; Chang, M.W.; Lee, K.; Toutanova, K. BERT: Pre-training of deep bidirectional Transformers for language understanding. arXiv 2018, arXiv:1810.04805. [Google Scholar]
- Subakti, A.; Murfi, H.; Hariadi, N. The performance of BERT as data representation of text clustering. J. Big Data 2022, 9, 15. [Google Scholar] [CrossRef]
- Müller, M.; Salathé, M.; Kummervold, P.E. COVID-Twitter-BERT: A natural language processing model to analyse COVID-19 content on Twitter. Front. Artif. Intell. 2023, 6, 1023281. [Google Scholar] [CrossRef] [PubMed]
- Chalkidis, I.; Fergadiotis, M.; Malakasiotis, P.; Aletras, N.; Androutsopoulos, I. LEGAL-BERT: The Muppets straight out of Law School. In Proceedings of the Findings of the Association for Computational Linguistics: EMNLP 2020, Online Event, 16–20 November 2020; pp. 2898–2904. [Google Scholar]
- Abdul Salam, M.; El-Fatah, M.A.; Hassan, N.F. Automatic grading for Arabic short answer questions using optimized deep learning model. PLoS ONE 2022, 17, e0272269. [Google Scholar] [CrossRef]
- Rahaman, M.A.; Mahmud, H. Automated evaluation of handwritten answer script using deep learning approach. Trans. Mach. Learn. Artif. Intell. 2022, 10. [Google Scholar] [CrossRef]
- Maji, S.; Appe, A.; Bali, R.; Chowdhury, A.G.; Raghavendra, V.C.; Bhandaru, V.M. An Interpretable Deep Learning System for Automatically Scoring Request for Proposals. In Proceedings of the 2021 IEEE 33rd International Conference on Tools with Artificial Intelligence (ICTAI), Washington, DC, USA, 1–3 November 2021; pp. 851–855. [Google Scholar]
- Vaswani, A.; Shazeer, N.; Parmar, N.; Uszkoreit, J.; Jones, L.; Gomez, A.N.; Kaiser, Ł.; Polosukhin, I. Attention is all you need. In Proceedings of the 31st International Conference on Neural Information Processing Systems, Long Beach, CA, USA, 4–9 December 2017; pp. 6000–6010. [Google Scholar]
- Wu, Y.; Ma, Y.; Liu, J.; Du, J.; Xing, L. Self-Attention Convolutional Neural Network for Improved MR Image Reconstruction. Inf. Sci. 2019, 490, 317–328. [Google Scholar] [CrossRef]
- Fahim, S.R.; Sarker, Y.; Sarker, S.K.; Sheikh, M.R.I.; Das, S.K. Self attention convolutional neural network with time series imaging based feature extraction for transmission line fault detection and classification. Electr. Power Syst. Res. 2020, 187, 106437. [Google Scholar] [CrossRef]
- Wang, Y.; Gales, M.; Knill, K.; Kyriakopoulos, K.; Malinin, A.; van Dalen, R.; Rashid, M. Towards automatic assessment of spontaneous spoken English. Speech Commun. 2018, 104, 47–56. [Google Scholar] [CrossRef]
- Rivas, P.; Schwartz, D.R.; Quevedo, E. BERT goes to SQL school: Improving automatic grading of SQL statements. In Proceedings of the 2023 Congress in Computer Science, Computer Engineering, & Applied Computing (CSCE), Las Vegas, NV, USA, 24–27 July 2023; pp. 83–90. [Google Scholar]
- Messer, M.; Brown, N.C.; Kölling, M.; Shi, M. How consistent are humans when grading programming assignments? arXiv 2024, arXiv:2409.12967. [Google Scholar]
- Chen, T.; Kornblith, S.; Norouzi, M.; Hinton, G. A simple framework for contrastive learning of visual representations. In Proceedings of the 37th International Conference on Machine Learning, Virtual Event, 13–18 July 2020. [Google Scholar]
- Sundararajan, M.; Taly, A.; Yan, Q. Axiomatic attribution for deep networks. In Proceedings of the 34th International Conference on Machine Learning, Sydney, Australia, 6–11 August 2017; Volume 70, pp. 3319–3328. [Google Scholar]
- Hong, I.; Tran, H.; Donnat, C. A Simplified Framework for Contrastive Learning for Node Representations. In Proceedings of the 2023 57th Asilomar Conference on Signals, Systems, and Computers, Pacific Grove, CA, USA, 29 October–1 November 2023; pp. 573–577. [Google Scholar]
- McInnes, L.; Healy, J.; Saul, N.; Großberger, L. UMAP: Uniform Manifold Approximation and Projection. J. Open Source Softw. 2018, 3, 861. [Google Scholar] [CrossRef]
- Wang, J.; Zhao, Y.; Tang, Z.; Xing, Z. Combining dynamic and static analysis for automated grading SQL statements. J. Netw. Intell. 2020, 5, 179–190. [Google Scholar]
- Shrikumar, A.; Greenside, P.; Kundaje, A. Learning important features through propagating activation differences. In Proceedings of the 34th International Conference on Machine Learning, Sydney, Australia, 6–11 August 2017; Volume 70, pp. 3145–3153. [Google Scholar]
Disclaimer/Publisher’s Note: The statements, opinions and data contained in all publications are solely those of the individual author(s) and contributor(s) and not of MDPI and/or the editor(s). MDPI and/or the editor(s) disclaim responsibility for any injury to people or property resulting from any ideas, methods, instructions or products referred to in the content. |
© 2025 by the authors. Licensee MDPI, Basel, Switzerland. This article is an open access article distributed under the terms and conditions of the Creative Commons Attribution (CC BY) license (https://creativecommons.org/licenses/by/4.0/).