Article

Long-Range Bird Species Identification Using Directional Microphones and CNNs

1
STRIX, 4450-286 Matosinhos, Portugal
2
Norwegian Institute for Nature Research (NINA), 7485 Trondheim, Norway
*
Author to whom correspondence should be addressed.
Mach. Learn. Knowl. Extr. 2024, 6(4), 2336-2354; https://doi.org/10.3390/make6040115
Submission received: 26 July 2024 / Revised: 16 September 2024 / Accepted: 26 September 2024 / Published: 16 October 2024
(This article belongs to the Topic Applications in Image Analysis and Pattern Recognition)

Abstract

:
This study explores the integration of directional microphones with convolutional neural networks (CNNs) for long-range bird species identification. By employing directional microphones, we aimed to capture high-resolution audio from specific directions, potentially improving the clarity of bird calls over extended distances. Our approach involved processing these recordings with CNNs trained on a diverse dataset of bird calls. The results demonstrated that the system is capable of systematically identifying bird species up to 150 m, reaching 280 m for species vocalizing at frequencies greater than 1000 Hz and clearly distinct from background noise. The furthest successful detection was obtained at 510 m. While the method showed promise in enhancing the identification process compared to traditional techniques, there were notable limitations in the clarity of the audio recordings. These findings suggest that while the integration of directional microphones and CNNs for long-range bird species identification is promising, further refinement is needed to fully realize the benefits of this approach. Future efforts should focus on improving the audio-capture technology to reduce ambient noise and enhance the system’s overall performance in long-range bird species identification.

1. Introduction

Anthropogenic activities are the main driver behind loss of biodiversity. Being able to predict where species occur, and assess the extent of impacts infrastructural development poses, will be especially important for highly mobile species, such as birds. Migration allows birds to exploit geographically separated habitats, making them of great significance to natural ecosystems and human societies alike [1,2,3], but also making populations vulnerable to impacts from anthropogenic structures along their flyways [1,4]. Accurate detection and identification of bird species is, therefore, crucial for conservation and ecological studies regarding behavior, breeding success, and habitat use, as well as for tracking of bird migratory routes [5,6].
The current state-of-the-art for identification of birds involves a combination of traditional field-based observations and various technological advancements [7]. Field-based surveys conducted by trained observers or skilled amateurs remain a fundamental method for monitoring bird populations [8]. Complementing these surveys with acoustic [9,10] or digital imaging [11] enables overcoming certain limitations of traditional visual surveys [12]. Satellite imagery can be used to detect and monitor birds in open environments, such as bird colonies or at sea [13,14,15,16]. To overcome the inherent limitations of satellite imagery regarding spatial and temporal resolution, unmanned aerial vehicles (UAVs) equipped with high-resolution cameras or thermal imaging sensors are increasingly used [17,18,19,20]. UAVs can also be used in bioacoustics monitoring [21]. Bioacoustics monitoring typically involves deploying autonomous recording units (ARUs) in relevant habitats to capture bird vocalizations for species identification [22,23]. Recent advances in machine learning and computer vision techniques enable the automated analysis of data captured by these sensors [24,25,26]. These units also have the advantage of being non-invasive, detecting the kind of sounds that birds make in the absence of human disturbance [27,28]. In recent years, the affordability of ARUs has revolutionized our understanding of the migration routes of certain birds [29,30].
While most ARUs use omnidirectional microphones, bird calls can be detected over much greater distances using directional microphones [31,32], especially parabolic microphones. These microphones also reduce environmental noise from directions where birds are unlikely to be detected, e.g., from waves crashing against man-made structures or from road and aerial traffic, simply by pointing above or away from them. Parabolic microphones can only amplify bird sounds when pointing toward them. This may require fixing the parabola in the general direction from which migrating birds are expected to arrive, e.g., along leading lines, such as shorelines or valleys. Alternatively, a hand-held parabola or an automated target detection system (e.g., bird radar) can be used to direct the directional microphone to detected targets. Microphone arrays allow the monitoring of the direction of travel of vocalizing birds [33,34,35]. When the microphones are sufficiently far apart, a bird of interest may only be picked up by one microphone at a time, and its movement can be traced as it passes closer to different microphones in turn. When the microphones are closer together, differences in the arrival time of the sound make location in three-dimensional space possible by triangulation [36].
Early attempts at using machine learning techniques for bird call classification were based on classification of the mel-frequency cepstral frequencies for short time segments. In the BirdCLEF annual challenge, dedicated to bird call species identification, competitors used classifiers based on SVMs [37], KNN [38], decision trees [39], and random forests [40]. However, these types of low-level feature classification restricted the amount of data that could be used due to computational restraints, which highlighted the need for more advanced techniques.
Convolutional neural networks (CNNs) are a type of deep learning neural network, composed of multiple filtering and pooling layers to autonomously learn intricate patterns and representations from data. This hierarchical approach enables the extraction of complex features, facilitating advanced tasks, such as image [41] and environmental sound [42] classification. Currently, the most promising approaches for automatic bird call species identification are based on transforming the audio recording into spectrograms using a fast Fourier transform algorithm, followed by some level of preprocessing before applying a CNN model for classification of bird calls [43,44].
The BirdCLEF 2016 challenge [45] saw the first introduction of CNNs to bird call classification. Since then, the approaches regarding this problem have been based on deep learning architectures. The BirdCLEF competition has introduced some ingenious techniques, based, among others, on ensembles of deep learning models. An ensemble represents essentially two or more models that were fed the same inputs and whose outputs are aggregated in some form to determine the final classification result. The aggregation of outputs from each individual model can be achieved by taking the mean (or a weighted mean) of the probability of classification for each species or by assigning votes to each model, or a mix of the two. Examples of ensembles include BirdCLEF submissions of the 1st [46] and 6th places [47] of the 2023 competition. The first uses an ensemble of three neural networks used for image classification. The second performs an ensemble of the BIRDNET Analyzer 2.2 version, with the solution proposed by the 2nd place of the BirdCLEF 2021 edition [48], which is an ensemble itself.
A popular CNN used extensively for bird species identification is BirdNET [49], a model developed by Cornell University that is claimed to distinguish between 6522 species of birds, and whose pre-trained model checkpoints as well as training and inference scripts have been made public in [50]. This allows for the use of transfer learning, by removing the classification layer of the model and replacing it with a new one for any number of bird species. The model with the new classification head is then trained on data related to the new list of species, while keeping all the other layers static. This is essentially training a simple linear classifier, where the inputs are features determined by the pre-training, and the outputs are the new species. Such a process is considerably faster when compared to the process of training an entire model from the beginning, hence the importance of having a reliable pre-trained model for relatively fast training on a new list of species.
Integrating acoustic sensors and CNNs enables reliable long-range bird species identification [51]. We propose that using directional microphones may offer significant improvements. For example, the combination of this system with bird radar technology can greatly increase their effectiveness, with the bird radar detecting bird targets toward which to point the parabola before the bird has even come within acoustic range, thereby allowing accurate species identification at the greatest possible distance.

2. Materials and Methods

We developed a directional microphone acoustic sensor, capable of pointing at and capturing audio samples from birds, and a deep learning model capable of identifying multiple bird species, which was trained and validated on publicly available datasets. We then tested the integration of the two components, performing a characterization of the system in terms of the acoustic response (sound quality) and bird call detection capabilities in field conditions.

2.1. Directional Microphone Prototype

The directional microphone prototype displayed in Figure 1 is composed of a Wildlife Acoustics SM4 [52] microphone mounted on a parabola, connected to a Capture Systems CARACAL [53] for positioning and a shield canvas for protection against the wind and rain. Audio is captured at a sampling rate of 48 kHz.

2.2. Deep Learning Model

The deep learning model used consists of an ensemble of three CNN architectures with different backbone architectures, based on the 1st place solution from BirdCLEF2023 [46].

2.2.1. Model Description

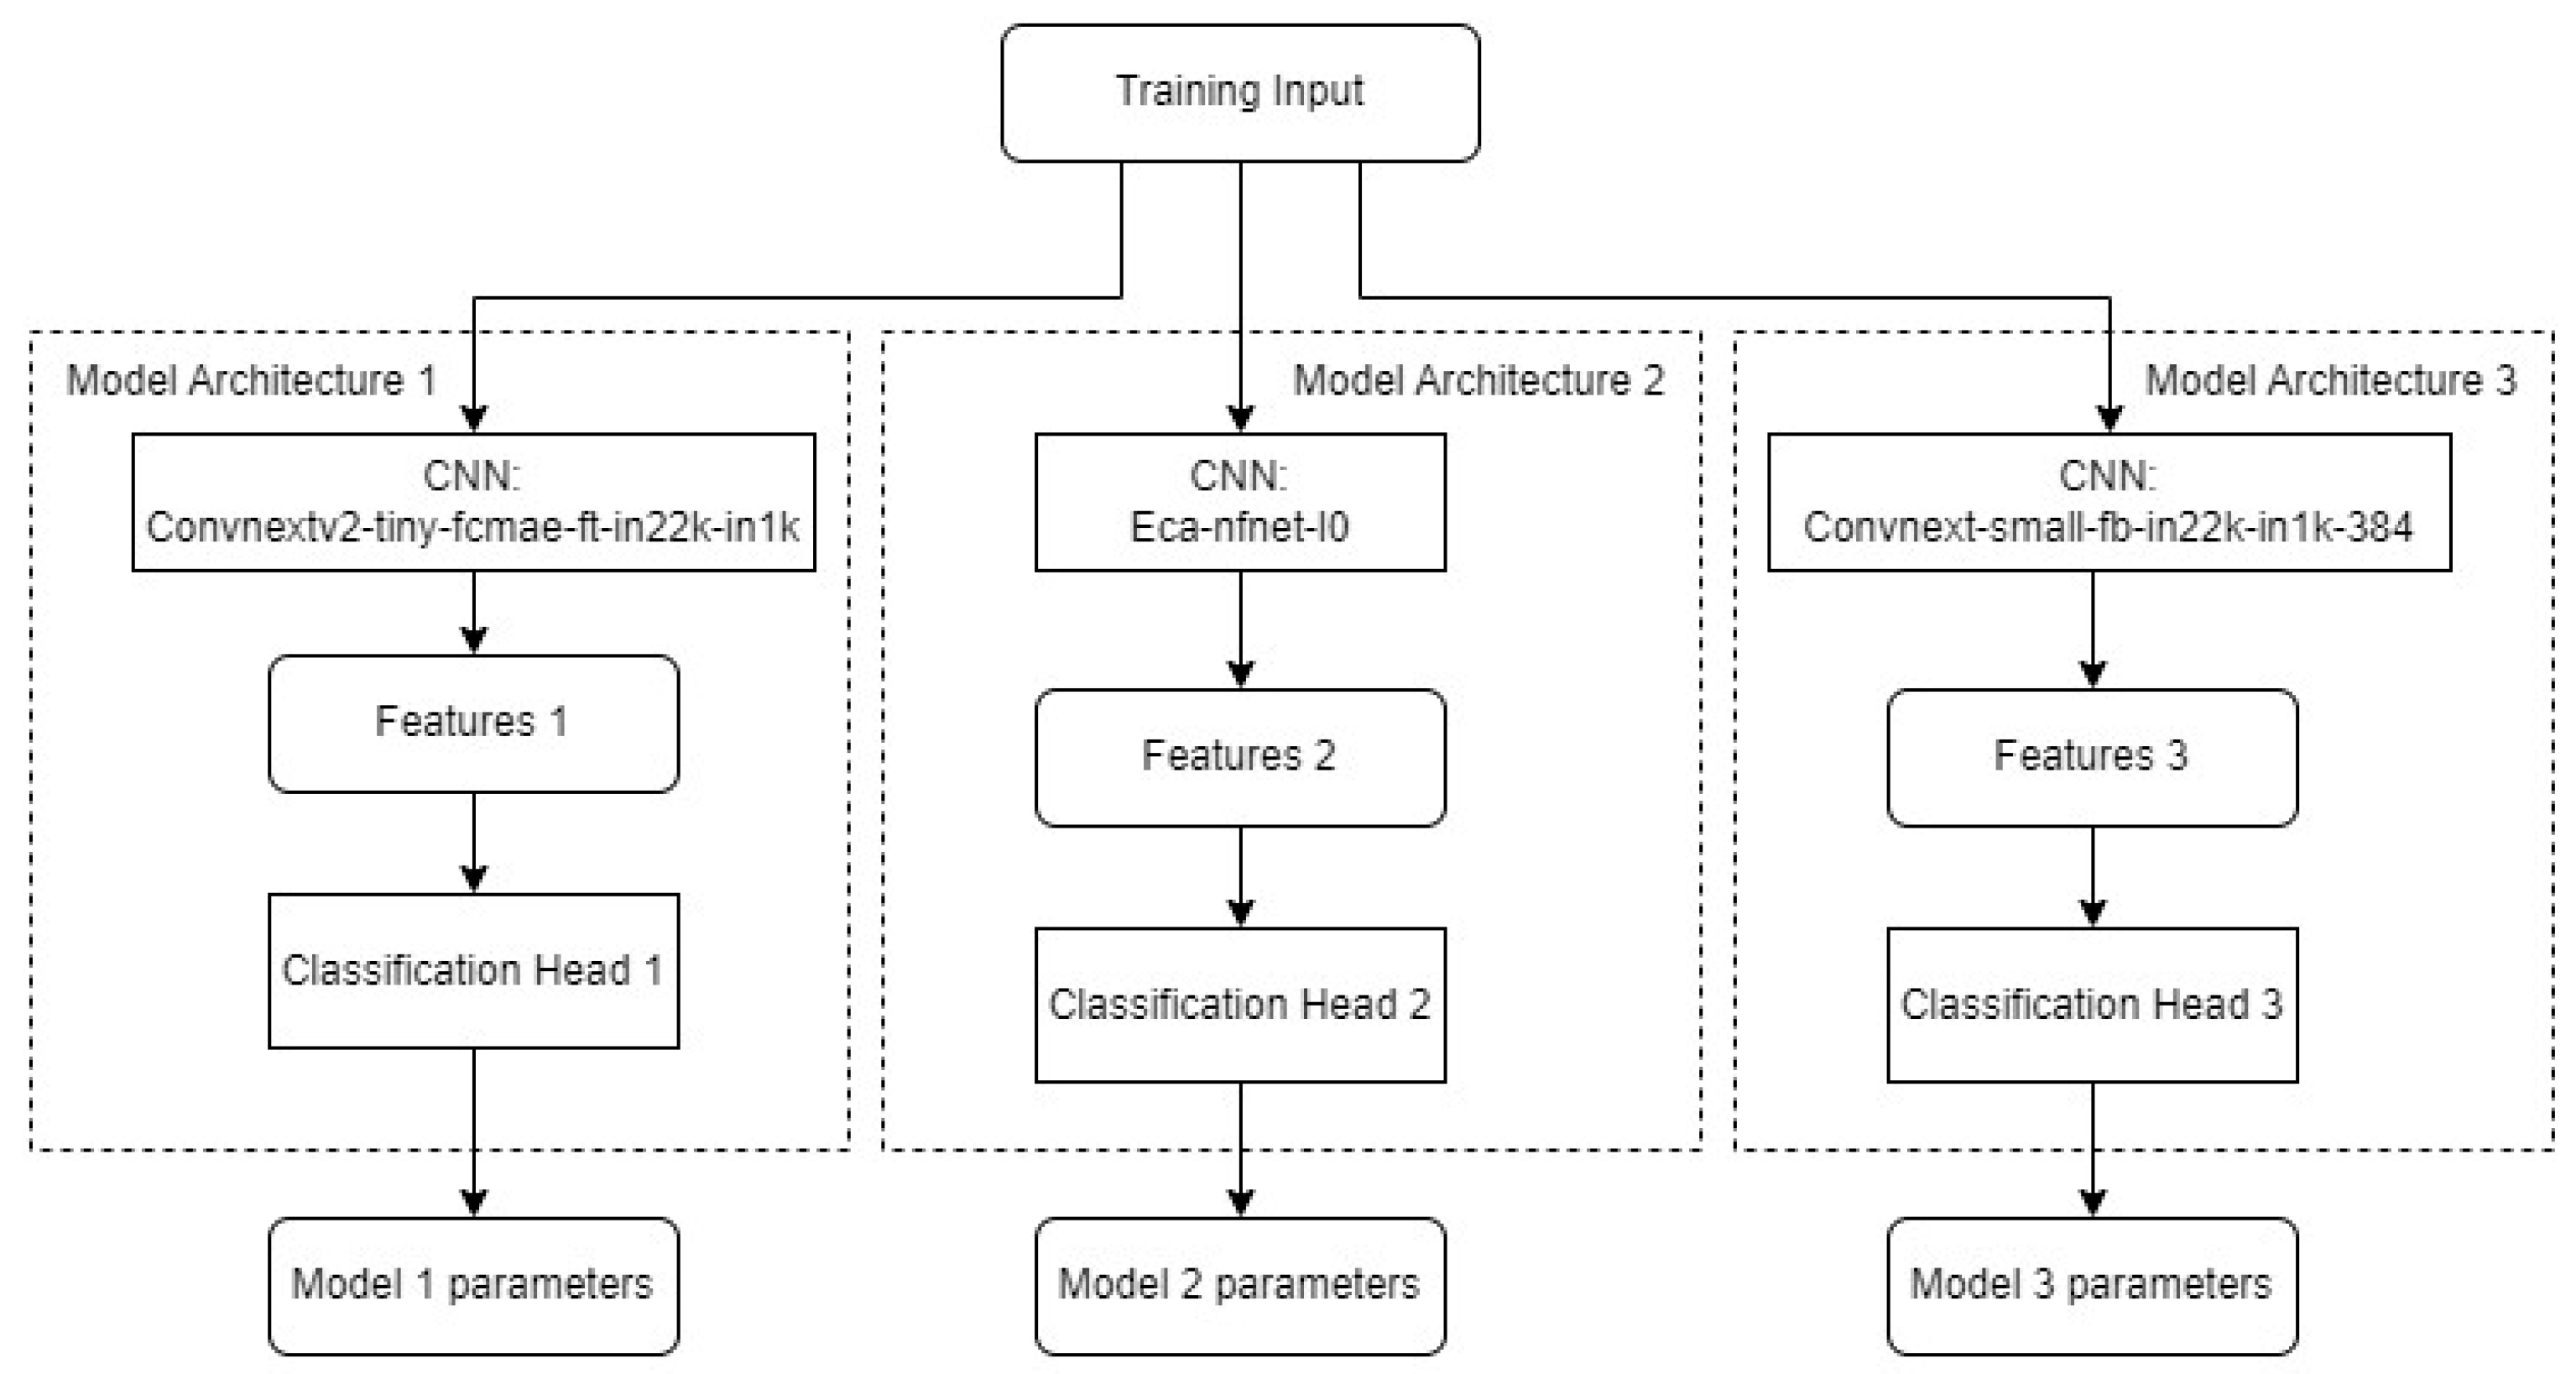
The model inputs were 5 s spectrograms obtained from applying the FFT algorithm on the input audios, as shown in Figure 2. The input audios are 32 kHz, mono-channel recordings. Audios with different specifications are resampled prior to the training and inference processes. The spectrogram images were then fed to the model, as in Figure 3, which contains the following architectures:
  • Eca-nfnet-l0 [54], from the NFNet (Normalization-Free Net) family of deep learning models, introduced in [55].
  • Convnext-small-fb-in22k-in1k-384 [56], introduced in [57].
  • Convnextv2-tiny-fcmae-ft-in22k-in1k [58], first introduced in [59].
Each model in the ensemble was already pre-trained on public image datasets and can be used pre-trained with the “timm” python module. A Convnext-small-fb-in22k-in1k-384 model trained on a 264 bird call species dataset [60] was already available in [61]. We retrained the Eca-nfnet-l0 and the Convnextv2-tiny-fcmae-ft-in22k-in1k on these 264 species and then retrained all three models on a final dataset with the 37 species shown in Table 1. No layers of the models were frozen on any of the training processes.
The species were selected based on their known presence along the Portuguese and Western European coasts and mainland. The ensemble model output was the average of the outputs of each model.
Each training run encompassed 50 epochs using a NVIDIA RTX3050 laptop GPU with 4 GB of dedicated memory. Training was conducted on a laptop running Windows 11 with 16 GB of RAM memory, using a page file [62] to obtain an additional 128 GB virtual RAM. The batch size was set to 16, which was the maximum that the GPU can withstand. For each epoch, the training dataset was preprocessed according to Figure 2 and then trained in the three architectures to obtain the model parameters, as shown in Figure 3.
The total training time for each ensemble was 25 h, split among the three models as:
  • Convnext_small: 10 h
  • Convnextv2-tiny: 9.5 h
  • Eca-nfnet: 5.5 h
The optimizer used was the adaptive moment estimation (ADAM) optimizer, which dynamically adapts the learning rate for each parameter during training. The initial learning rate was set to 0.0001. The main metric used for the training was focal loss, which mitigates class imbalance and is defined as:
F L p t = α t a p t γ log p t
where p t is the predicted probability of the correct class, α t is a balancing weight for each class, and γ is the fusing parameter, which emphasizes hard examples.
Audios from the Xeno-Canto public dataset [63] were used, comprising both .mp3 and .wav audio files with sampling rates equal or greater than 32 kHz. Data were filtered by duration (<60 s) and by quality ranking ‘A’ or ‘B’ (the audio metadata files contain an audio quality classification ranging from ‘A’ to ‘E’ [64]). Training a model to recognize faint signals may actually overfit it, lowering its performance [65]. A maximum of five chunks per audio file were considered, selected as the first ones in the audio file. The total bird call audio files considered were circa 30,000.
Data augmentation included mixing the training dataset with no-call datasets, containing soundscape and background sounds. These no-call sounds were retrieved from the ESC-50 dataset [66] (from categories “natural soundscapes and water sounds” and “exterior/urban noises”, for a total of 800 files) and from Zenodo [67], from which 60,000 audios were selected at random to be considered for each model training. Each audio in the training dataset was mixed with a random sound from one of the two no-call datasets, with a 0.9 probability of mixing with a soundscape audio and a 0.1 probability of mixing with an ESC-50 sound. Since same audio samples with different background noises will correspond to the same class, the model is able to learn that these background noises are not correlated to the classification itself, and will, therefore, determine that the defining features of the audio that result in the classification provided are the bird call features themselves and not the background audio features. This processing is an alternative to having a no-call class, which would have the majority of the samples causing a heavy class imbalance. Additionally, that class would generalize features pertaining to completely different sounds. Tests were conducted in [65] that discouraged the incorporation of a no-call class in the context of multi-species bird call classification. Class sampling weights were applied as described in [46] to correct class imbalance.
Additional data augmentation included time and frequency shifts being applied, with a probability of 0.3, to make the model robust to slight variations in timing or frequency.
The inference pipeline is depicted in Figure 4. For inference, the model was converted to Open Neural Network Exchange (ONNX). For each species, the model output a score ranging from 0 to 1. The presence of a bird species in the provided audio sample was determined by its score being above the selected threshold.

2.2.2. Model Validation

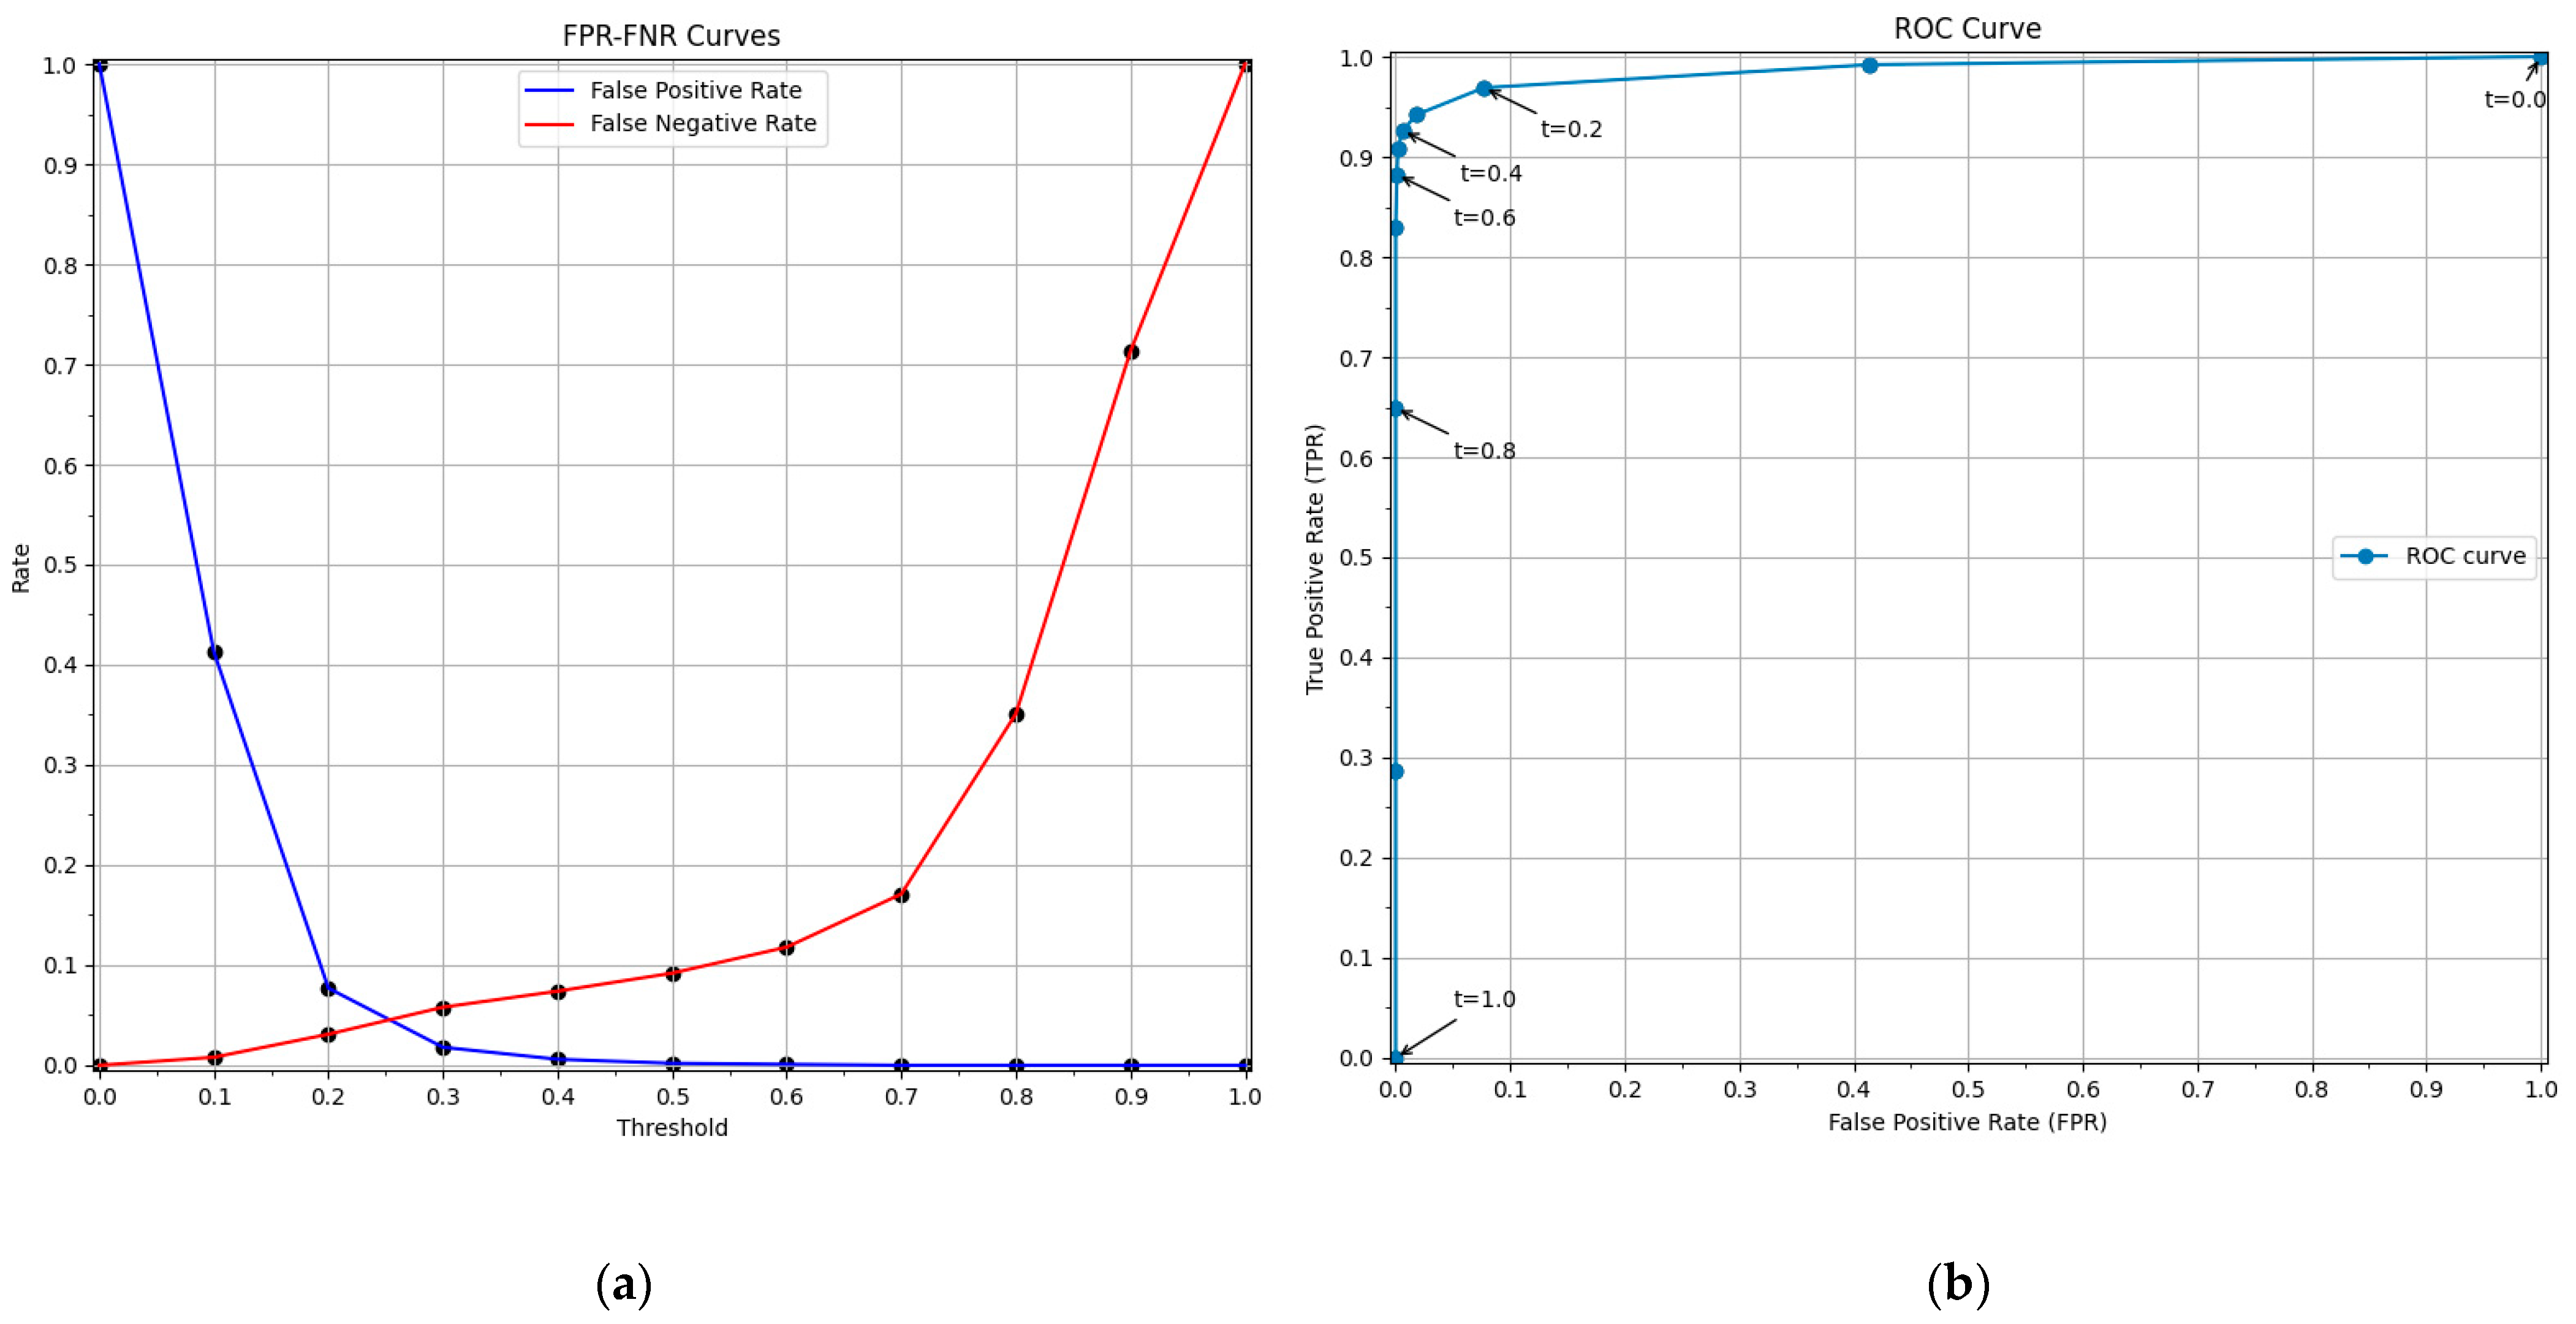
The ensemble model was evaluated in all available audios for the species in Table 1, without any filtering. This evaluation also allowed the selection of a preliminary value for the model score threshold. Inference was performed for threshold values ranging from 0 to 1 at intervals of 0.1. The plots, shown in Figure 5, evaluate the model in terms of:
False positive rate–false negative rate (FPR–FNR) curves: analyze the trade-off between false positives and false negatives, according to user goal specifications [68].
Receiver operating characteristic (ROC) curve: Measuring the relation between true positive rate (TPR) and false positive rate (FPR). A perfect ROC curve will have an area under the curve (AUC-ROC) of 1, while a random classifier will have an area of 0.5 [69].
For both curves, the results were calculated for each class first, followed by an average for all classes.
Although the model showed a capability of simultaneously identifying multiple species in the same recording (more than one species meeting the selected threshold), this paper will only address the task of identifying one bird species at a time.

2.3. Field Testing Methodology

2.3.1. Field Testing Objectives

The objective of these tests was to assess the quality of the sound captured by the microphone prototype (signal amplification and noise reduction) and the signal-to-noise ratio, regarding:
  • The distance from the parabola, allowing to determine the effective range of the prototype.
  • The relative angle of the parabola axis in relation to the sound source, allowing to determine the sound amplification as a function of the angle deviation from the exact direction of the target. Small deviations are expected to significantly reduce the sound amplification capabilities of the parabola.
  • The frequency of the signal, therefore determining the influence of the sound frequency on the detection range and angle. Higher frequencies are expected to be more absorbed and distorted by air compared to lower ones. Including a range of different frequency signals allows the determination of the limit conditions at which a bird emitting a call on a specific frequency range will be detected.
Additionally, the AI model capabilities of detecting a bird call in environmental conditions were determined by playing selected recordings from the Xeno-Canto dataset and analyzing the respective score assigned to that species.

2.3.2. Testing Location and Conditions

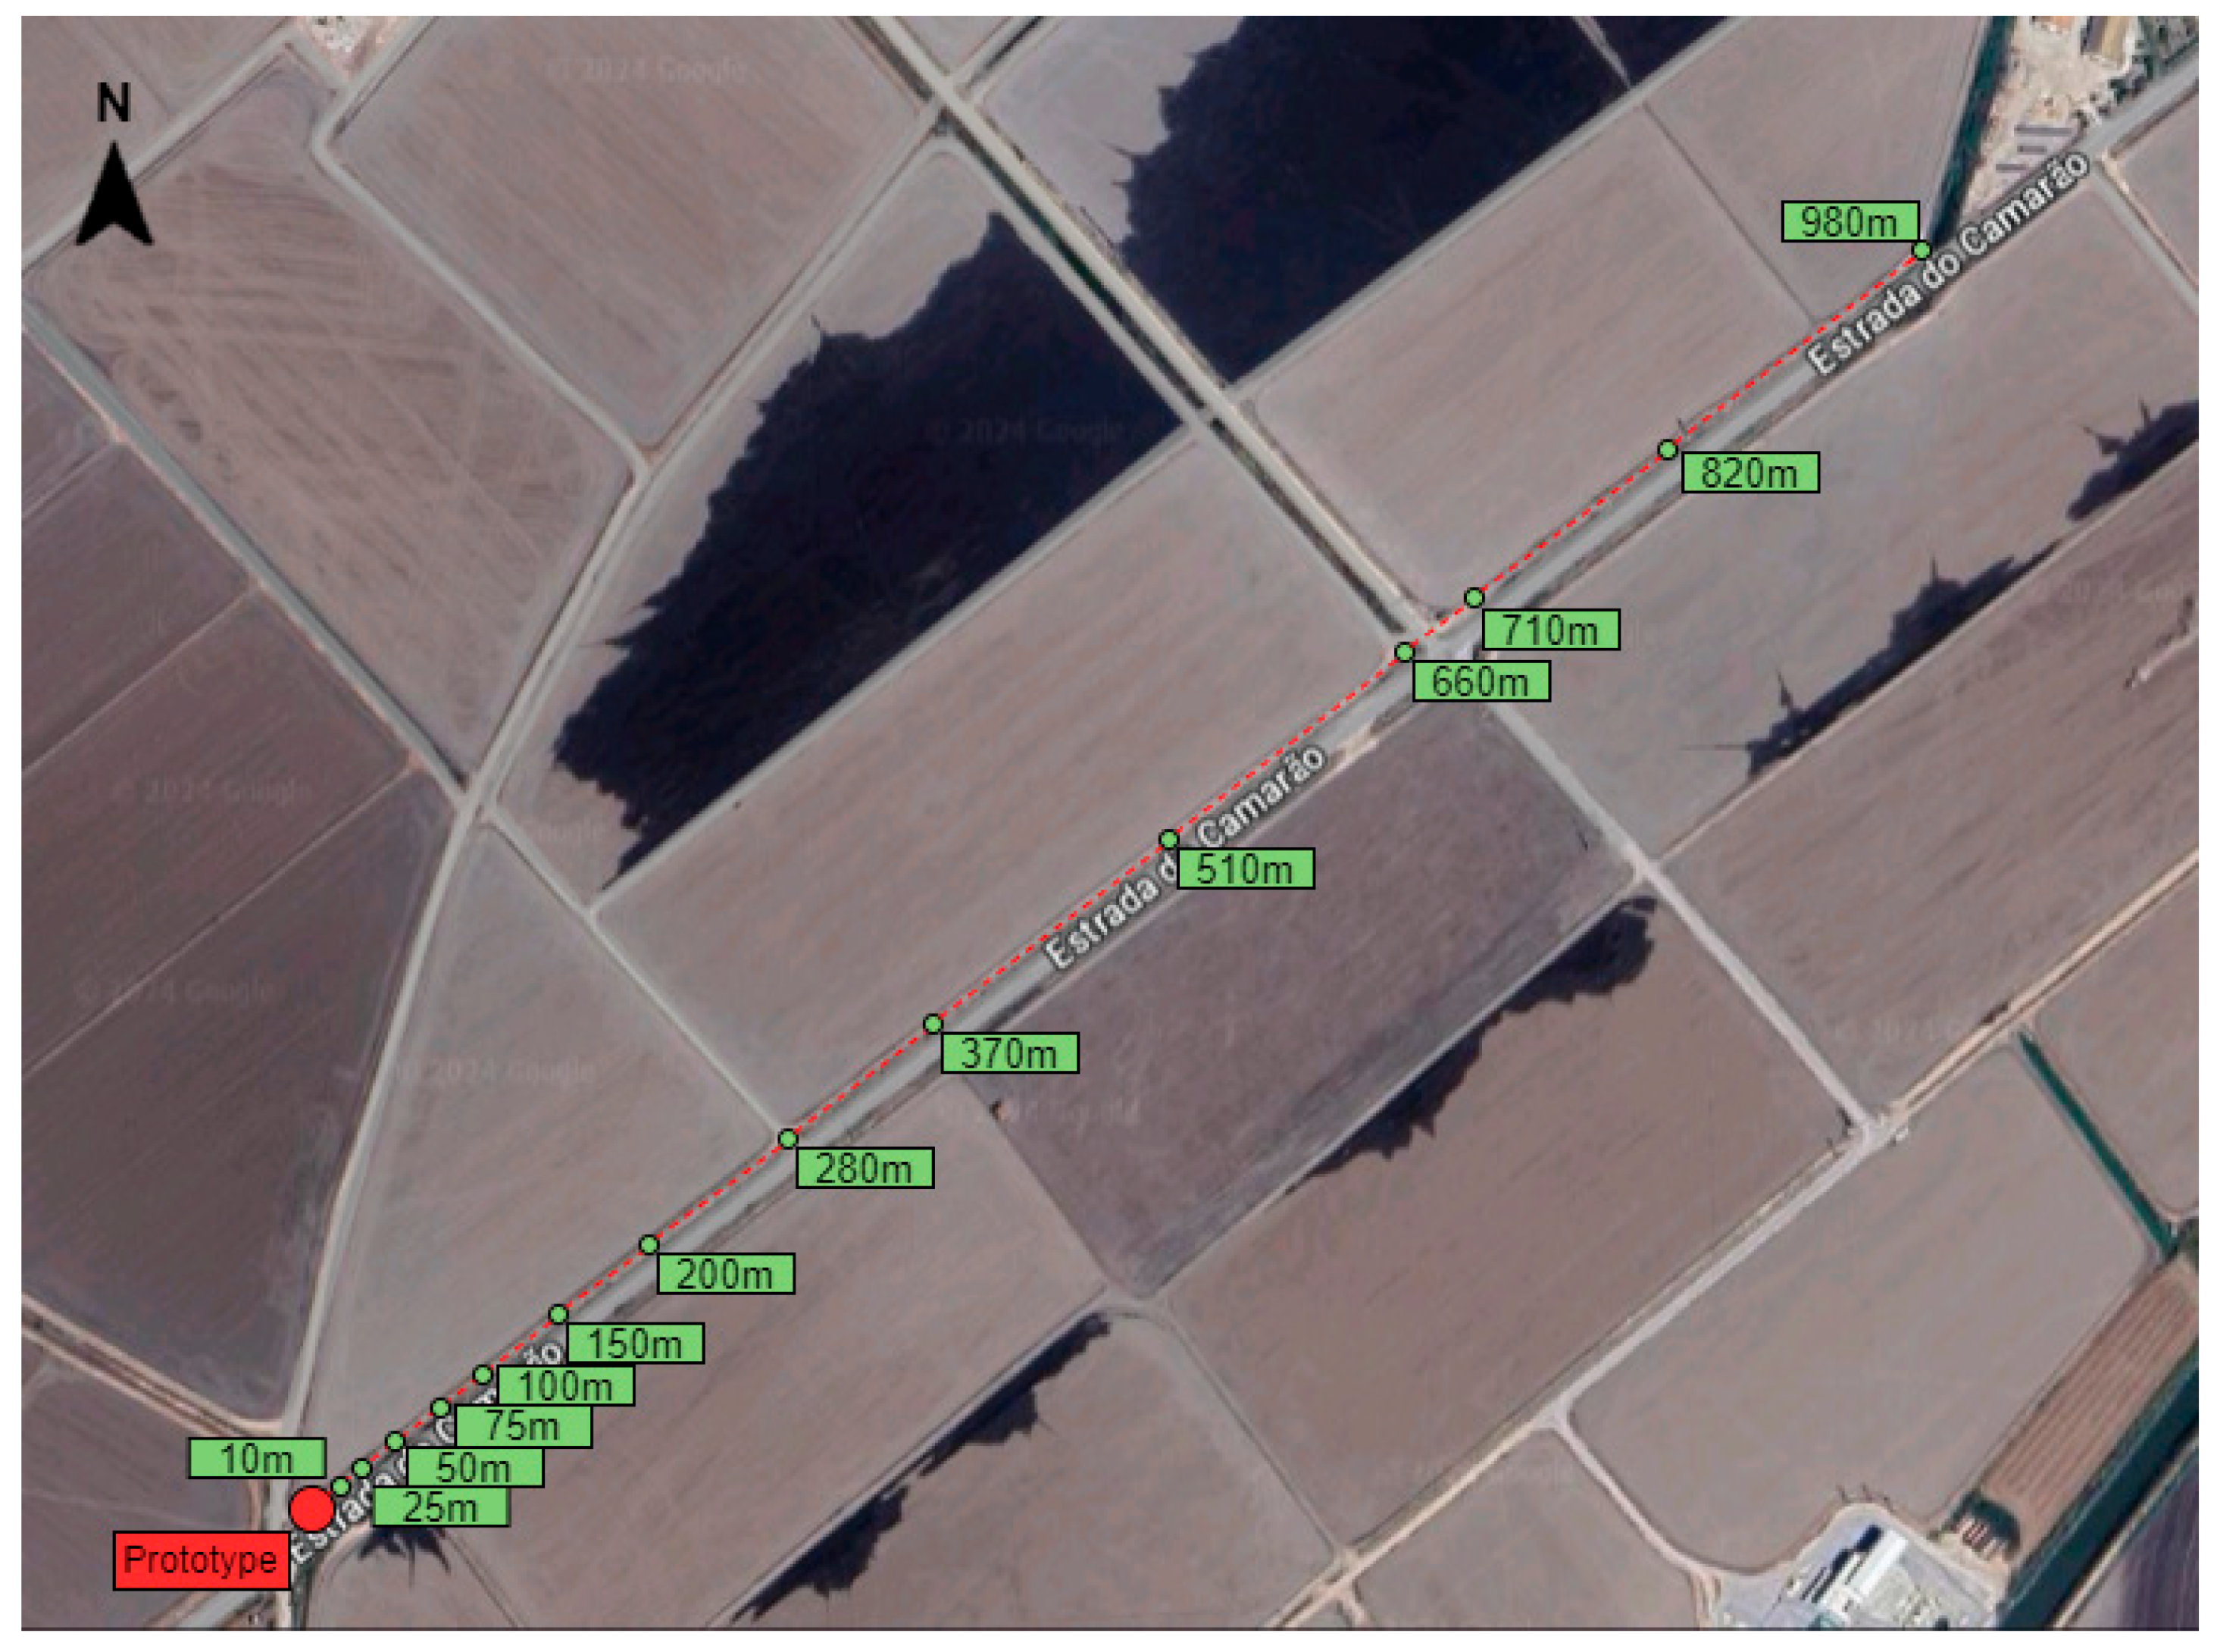
The testing of the integration between the directional microphone prototype and the deep learning model was performed next to a secondary service road named “Estrada do Camarão” on the Tagus Estuary Reserve, Vila Franca de Xira, Portugal. This location is surrounded by agricultural fields and is located in the middle of migratory bird flyways. A flat, straight dirt road with low height vegetation on the sides (<30 cm) was used for the testing locations at varying distances to the microphone (Figure 6). The tests were conducted from 7 am to 15 pm on 5 July 2024. The wind speed during testing was negligible at first (<5 km/h), having increased to approximately 15 km/h by the end of the experiment. The wind direction varied between North and Northwest. Traffic passed by sporadically, but completely compromised samples when it occurred, causing high-intensity noise throughout the frequency spectrum during those incidences. The sound samples containing traffic passing by were discarded, but they could have induced low-frequency noise seconds in the samples immediately before and after the discarded samples.

2.3.3. Testing Data and Procedure

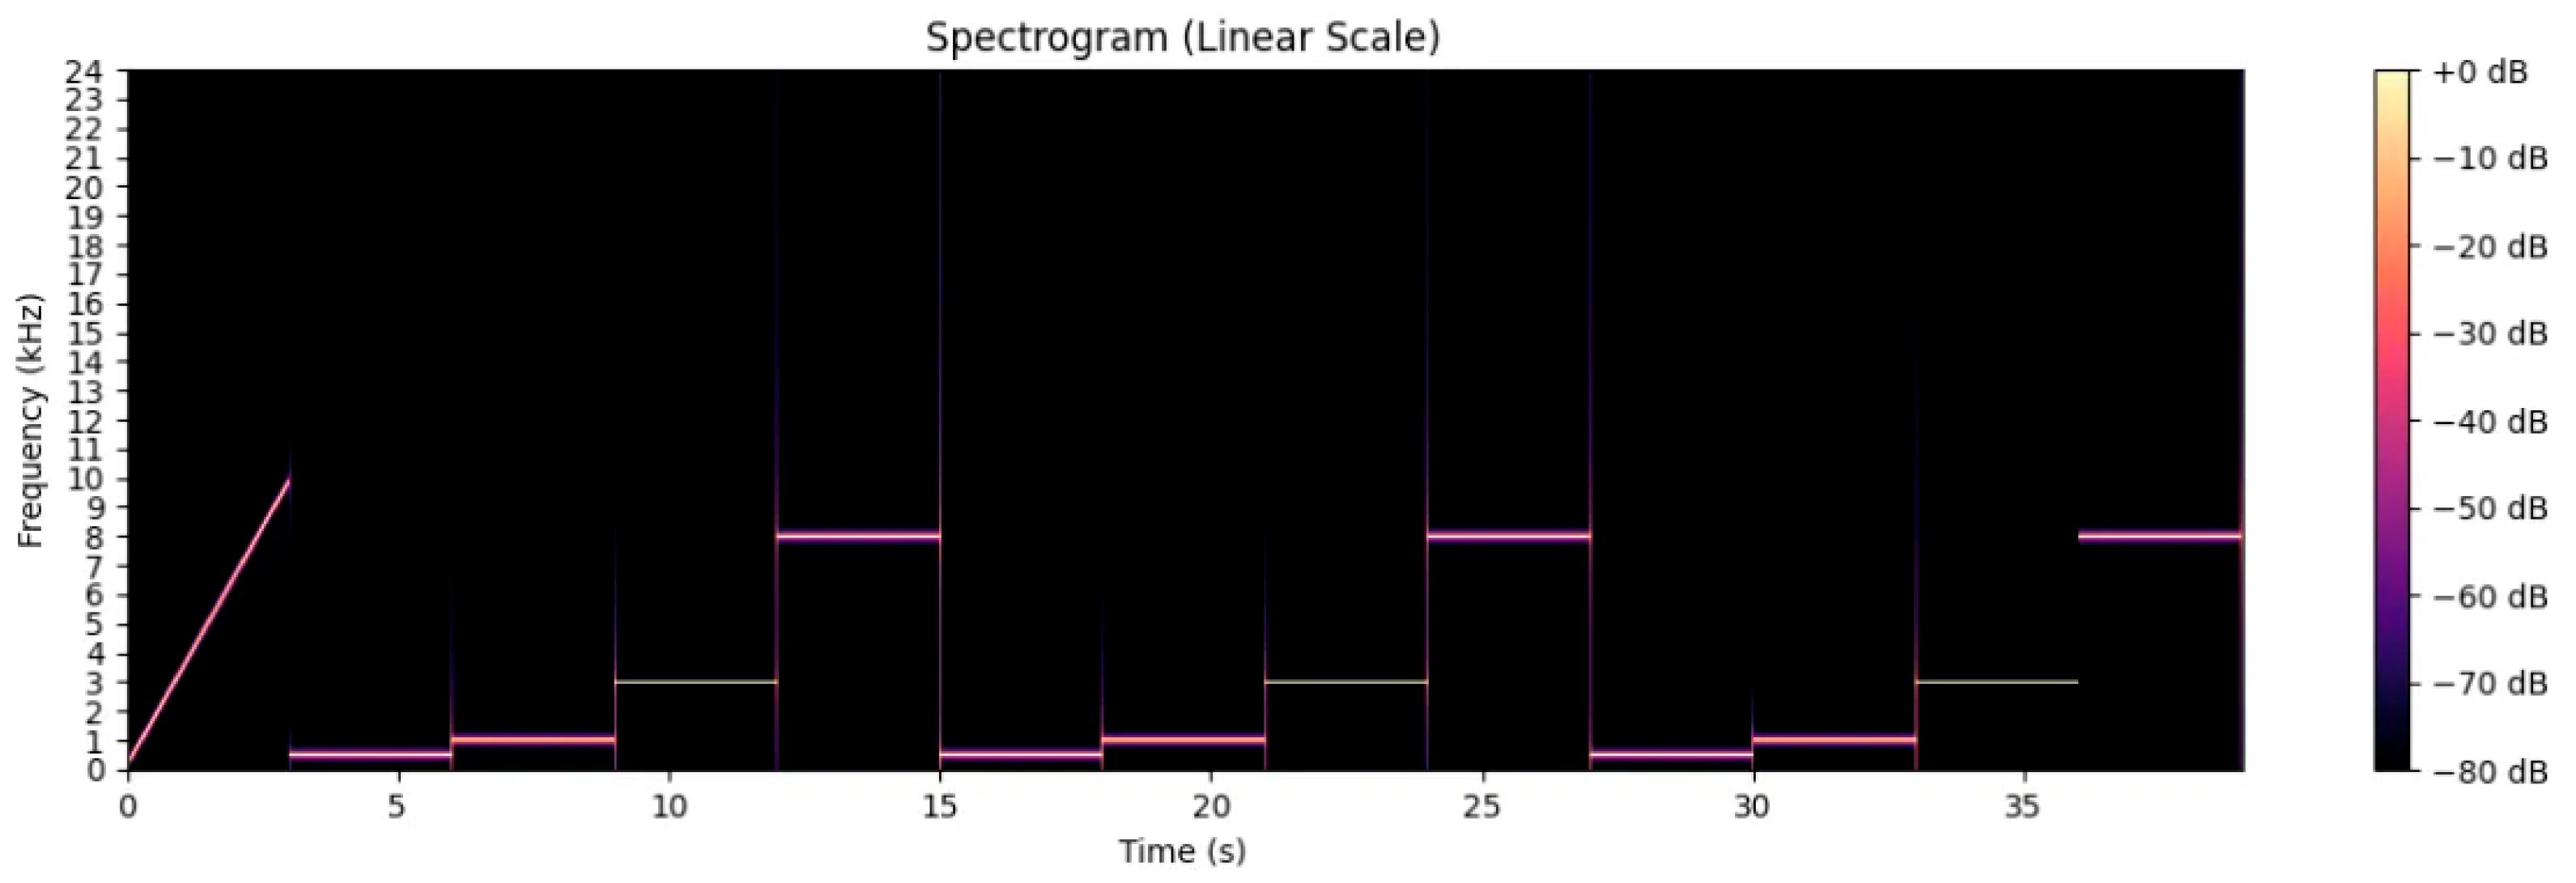
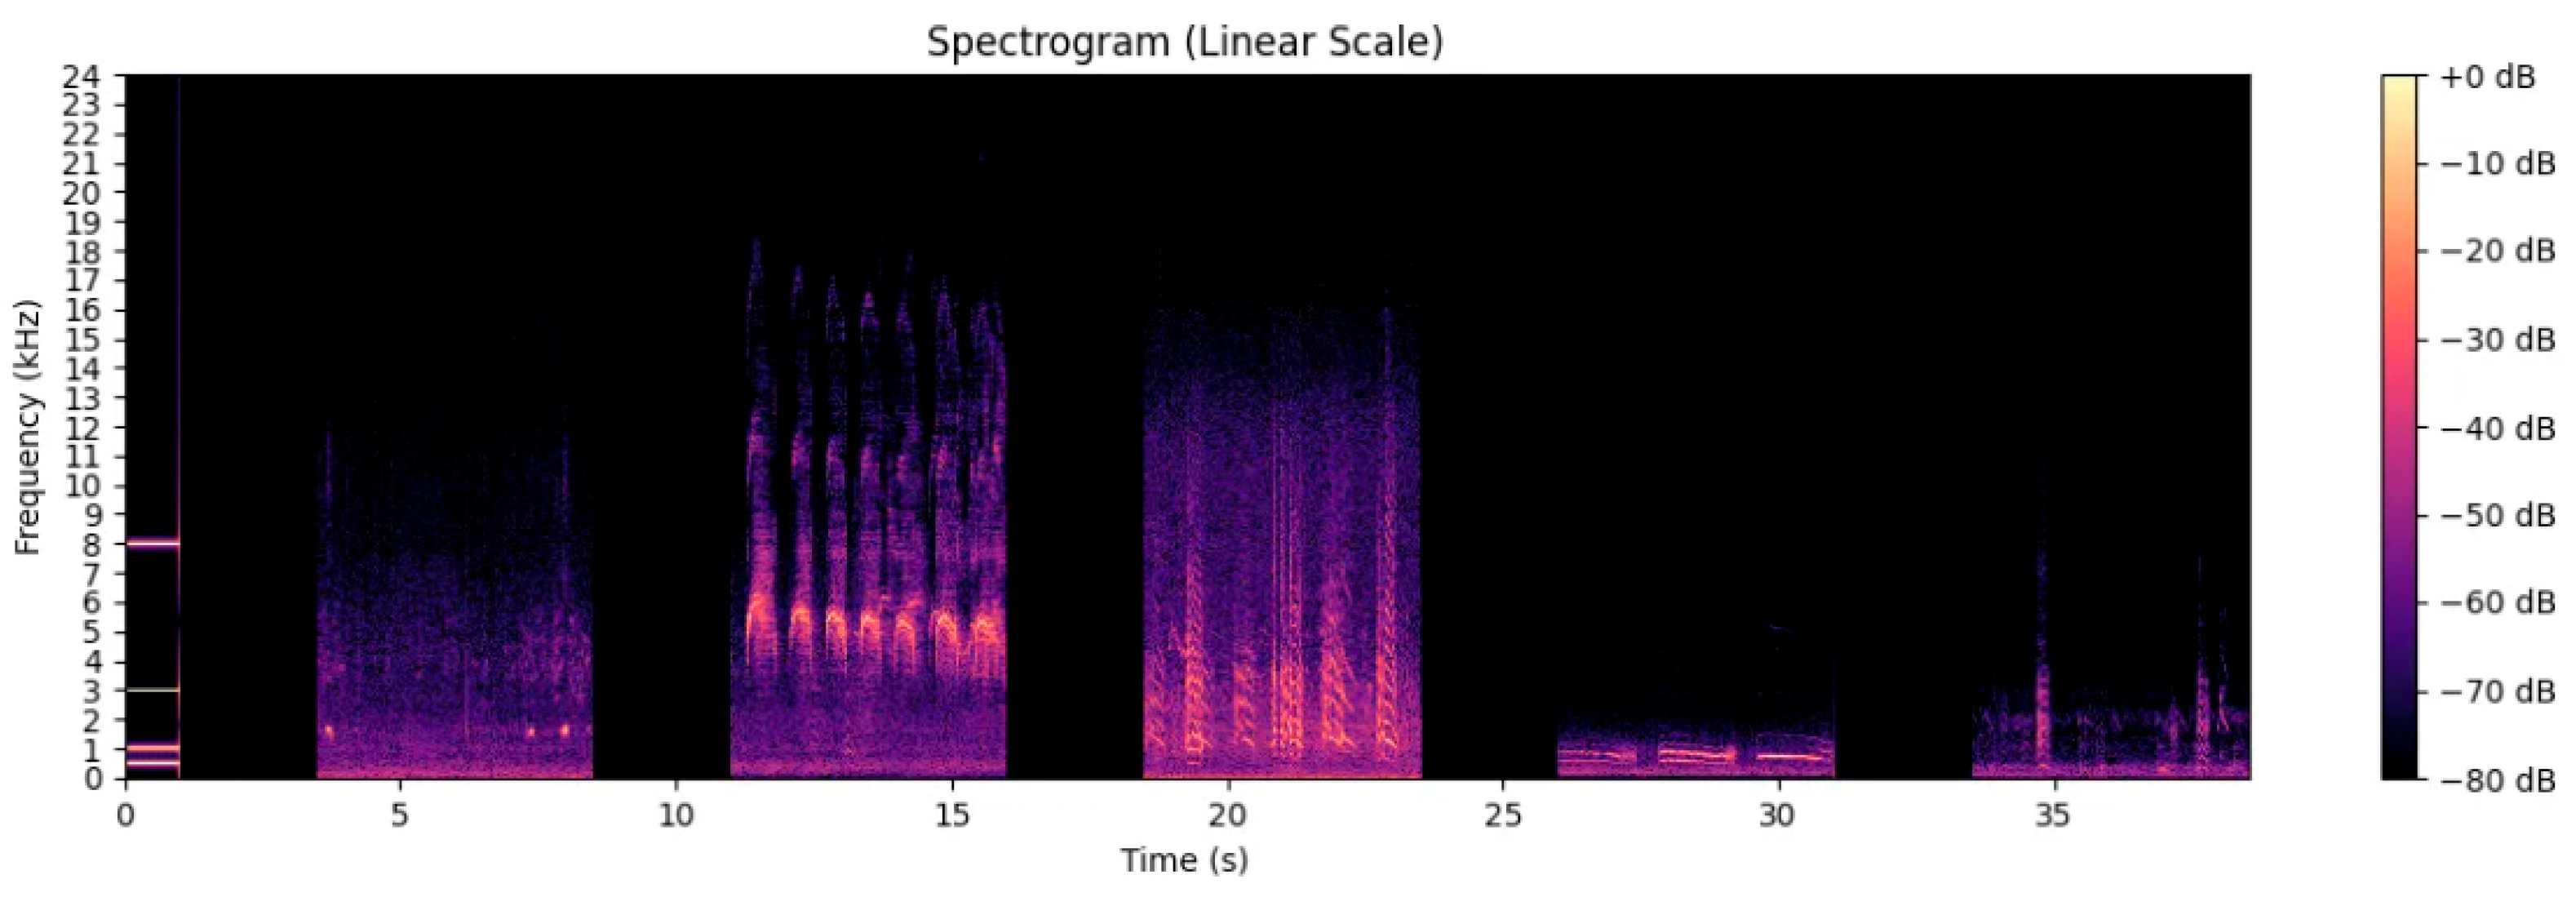
A Tronsmart Element Mega 40 W sound speaker was used to play an array of 3 s simple-frequency audios (500 Hz, 1 kHz, 3 kHz, and 8 kHz) looped three times (Figure 7), as well as previously recorded 7 s audios pertaining to five species displayed in Table 2 (Figure 8). The species were selected from the list of 37 species on which the model was trained, with different vocalization frequencies and call durations. For synchronization purposes, the recordings started with a siren sound (Figure 7) and a buzz sound (Figure 8).
First, a distance characterization was performed. The testing locations shown in Figure 6 ranged from 10 m up to 980 m and were selected based on landmarks present (lamp posts, road crossings, etc.). The testing audio was played three times per distance for redundancy purposes. Although the characterization was attempted up to the maximum distance of 980 m, only results up to 510 m are presented, as from 660 m onwards, not a single tested frequency reached the minimum signal-to-noise ratio value of 20 dB.
For the angular response characterization, two tests were performed at two distances based on the preliminary results of the distance characterization tests:
  • Close-range test: At a distance of 25 m, signal power was measured at intervals of one degree in each direction in the interval [−30°, 30°]. The objective was to obtain a detailed characterization of the prototype and determine the critical angles at which there was a significant drop in the signal intensity.
  • Long-range test: At a distance of 280 m, signal power was measured at intervals of two degrees in the interval [−10°, 10°]. The objective was to obtain an approximation of the angular precision needed to obtain a quality audio sample at a distance at approximately the effective range of the prototype, where all the frequencies were still audible above the 20 dB signal-to-noise ratio. This distance was chosen while performing the distance characterization test, by real-time analysis of the spectrograms.
The angular response tests were conducted by fixing the sound source and varying the directional microphone yaw angle with the CARACAL positioning system. This might have introduced noise variations between samples, as the prototype was capturing audio from different directions. The angular response was tested in both directions to address this issue. If results are similar for the same absolute angular value, then the noise variation is negligible.
The species detection with distance test aimed at determining the ‘effective range’ and ‘maximum detection range’ of the prototype. ‘Effective range’ is defined as the distance for which the microphone is able to consistently capture a sound for which the AI algorithm outputs a reliable score of more than the threshold of 0.6, meaning a high score greater than 0.6 and average score of more than 0.5, and a consistent rank of 1. ‘Maximum detection range’ is defined as the range for which the microphone was able to capture one sound sample of quality sufficient enough to obtain one positive classification with a score greater than 0.6, or a score greater than 0.4 if the species was ranked in first place.

2.3.4. Theoretical Sound Decay Function

The experimental results were fitted to a curve considering the inverse square law [70] with an additional attenuation term, depending on the signal frequency.
The theoretical decay according to the inverse square law is given by:
P 1 P r e f = x r e f 2 x 1 2
where P r e f is the signal power at a given reference point (chosen at 10 m), P 1 is the power at a given point, x r e f = 10 is the distance of the reference point to the sound source, and x 1 is the distance of the point to the sound source. On the logarithmic scale, this relation is given by:
P 1 , d B P r e f , d B = 10   log 10 x 1 x r e f 2 = 20   log 10 x 1 x r e f
The theoretical decay does not take into account the influence of the frequency and the environmental conditions on the signal power decay. As such, it should be considered as the maximum possible value for a given distance.
Introducing a complex variable to assume spherical propagation and a homogenous environment [71,72] (equal in all directions, not influenced by the wind) allows the modeling of an additional attenuation term, as:
P attenuation = e λ x r e f x 2
where λ is an attenuation constant, assumed to depend on the signal frequency, to be determined with the experimental data. Converting this expression to the logarithmic scale yields:
P attenuation , dB = 20   log 10 λ x r e f x × log e log 10
where log e log 10 is used to change from logarithmic base e to base 10. Adding both terms yields the final equation of the signal decay with distance, as:
P 1 , d B P r e f , d B = 20   log 10 x 1 x r e f λ x 1 x r e f log 10

3. Results

The results were calculated using the 10 m point as the reference, as detailed in Section 2.3.4.

3.1. Simple-Frequency Audio Test Results

3.1.1. Distance Characterization with Frequency

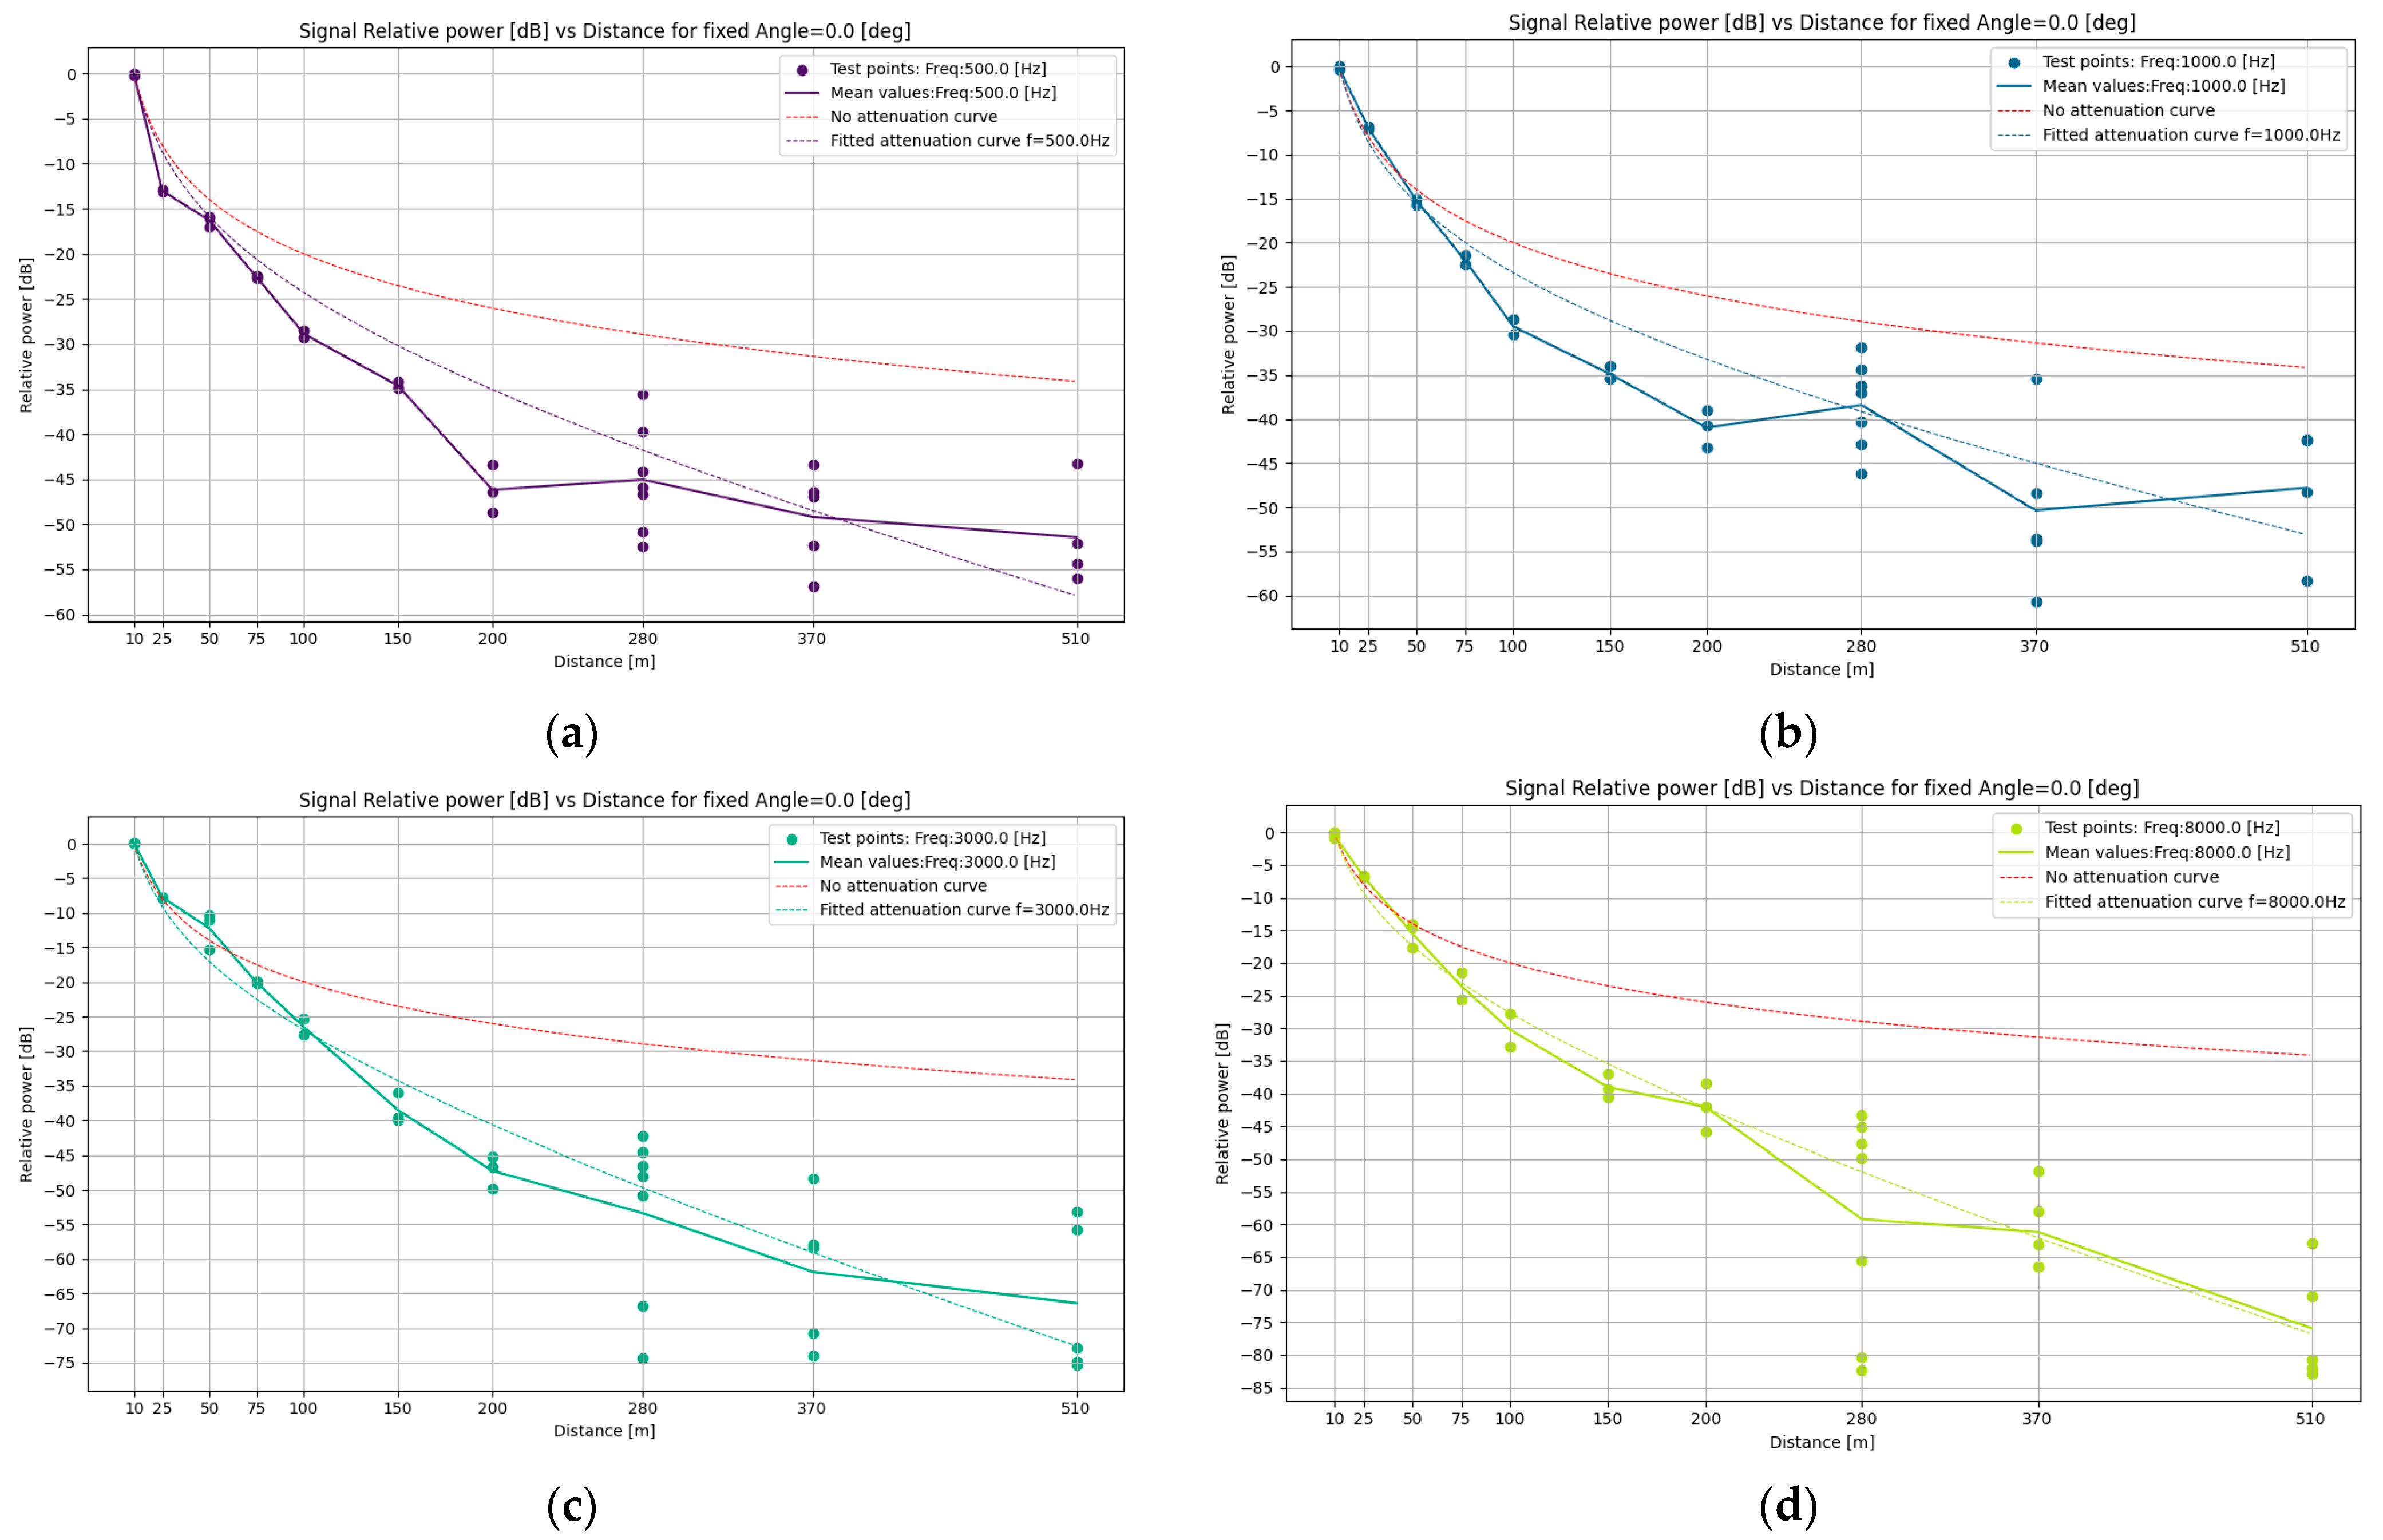
The results obtained for the distance response characterization are presented in Figure 9 for each frequency. These curves demonstrate the theoretical and experimental decay obtained for the relative power of the sound captured by the prototype in relation to the reference point. Fitting the expression in (6) to the experimental data using the least-squares algorithm yielded the values for the attenuation constant, λ , and respective R 2 values in Table 3. The value of this constant increased with frequency, except at 500 Hz, indicating that higher frequencies decayed more rapidly with distance.

3.1.2. Angle Characterization with Frequency and Distance

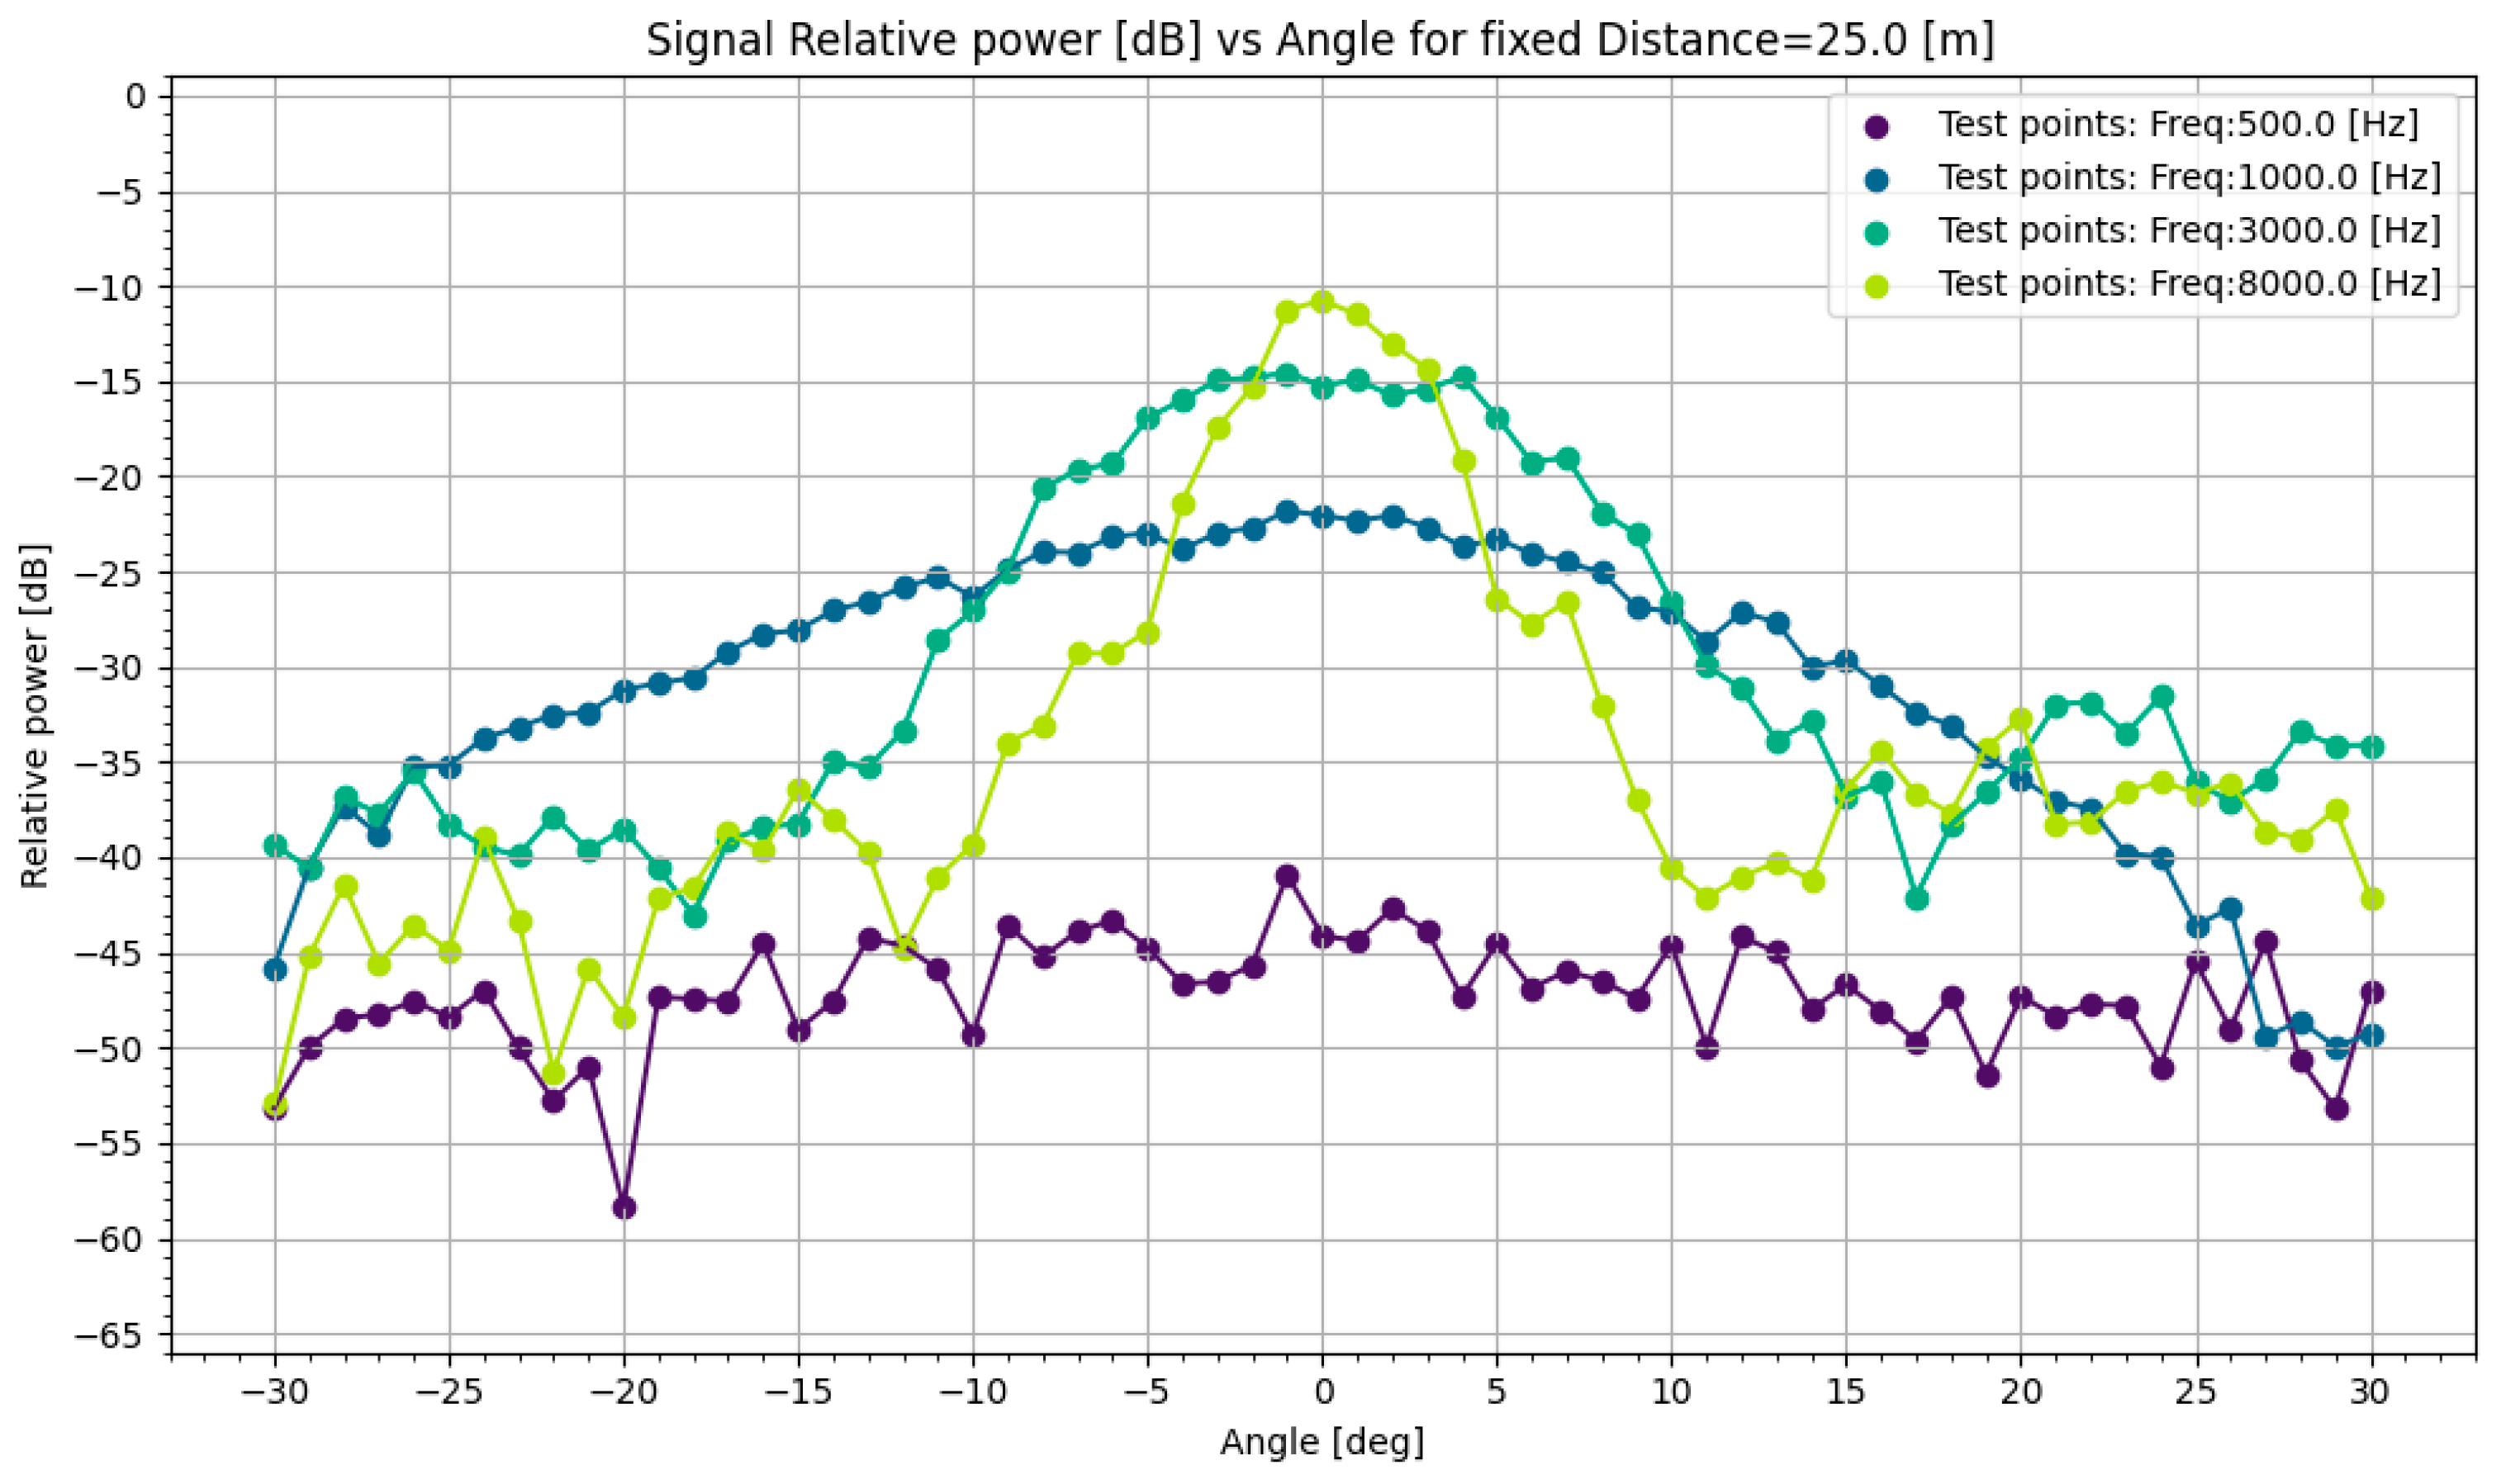
The close-range test (Figure 10) showed a major drop between 0 and 10 degrees, especially for the higher 3 kHz and 8 kHz frequencies, remaining constant up to the limit values tested. During testing, background noise was present in the range of the 500 Hz frequency, which might have influenced the results, even with post-processing.
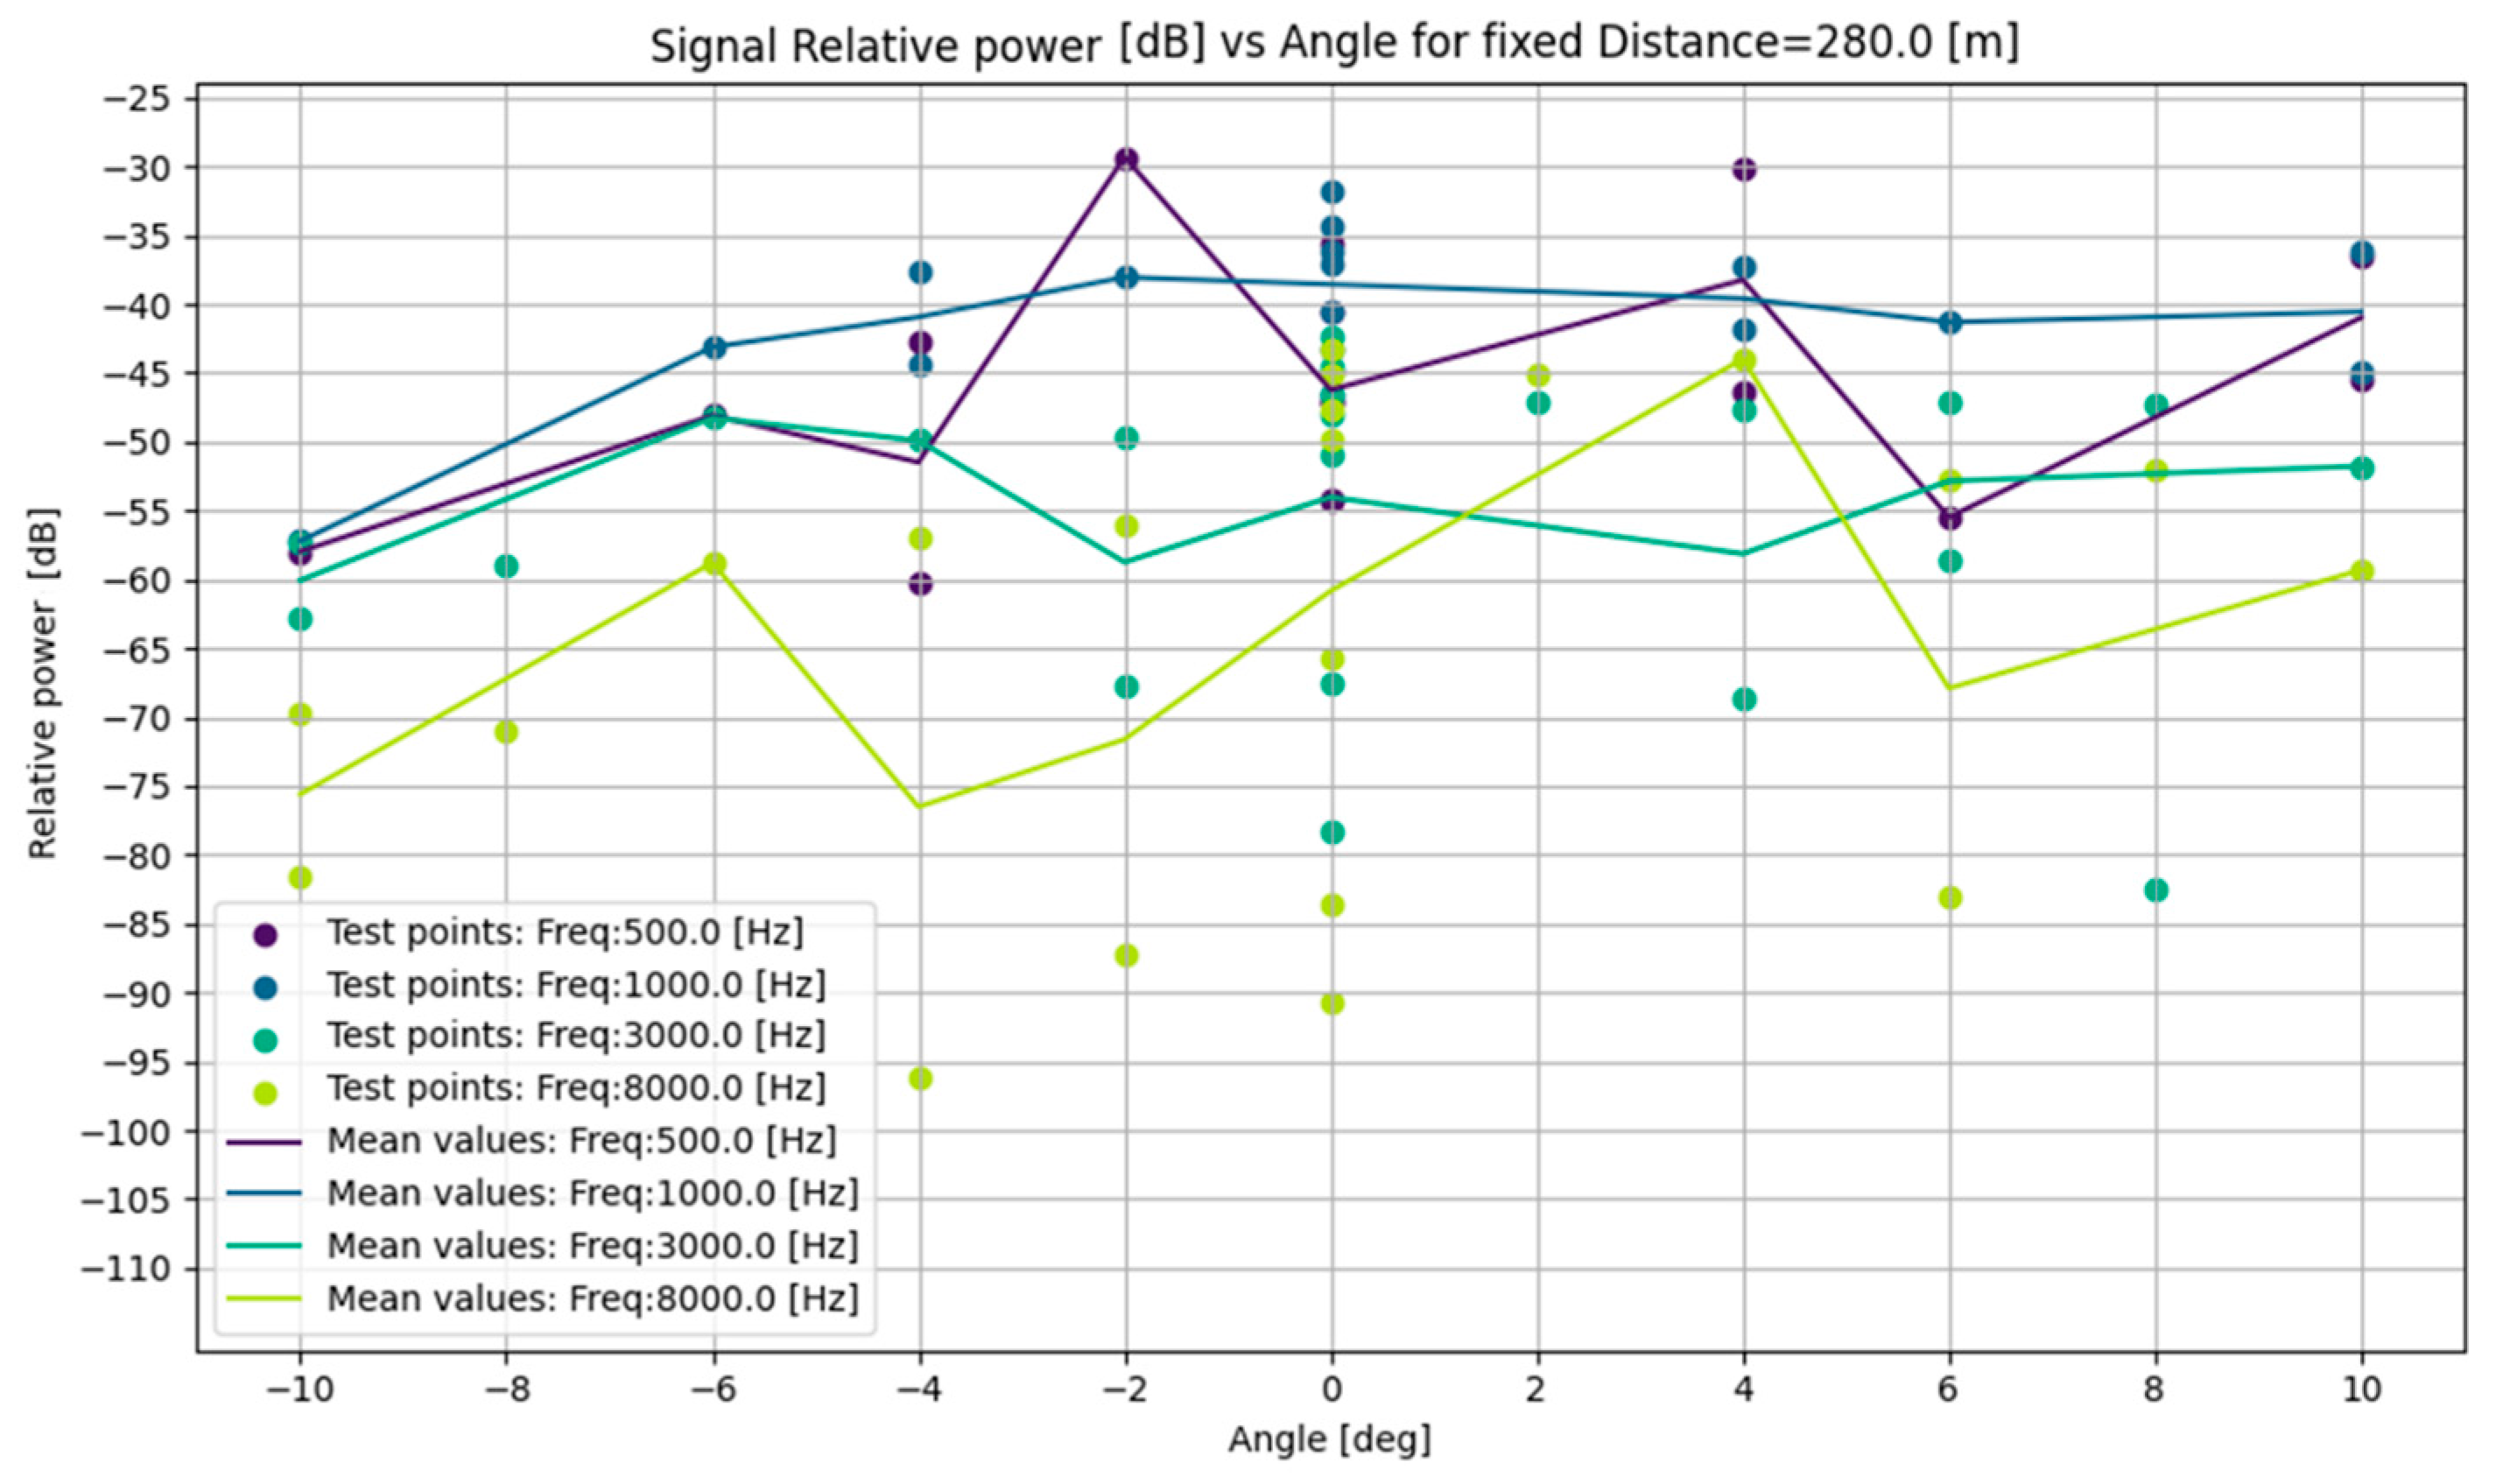
The long-range test (Figure 11) was highly influenced by the wind, surpassing the effect of the angular deviation. Moreover, the high variance between the samples can be attributed to constant wind gusts and wind variations in speed and direction.

3.2. Species Detection with Distance Test Results

Table 4 and Table 5 show the results obtained when running the CNN model on the audios captured at the tested distances. The high scores show the capabilities of the system of performing any detection, while the average scores provide information about the system robustness, meaning lower deviations between the highest and average scores, with both values above the detection threshold implying a systematic detection capability for that species and distance. The ranks in Table 5 indicate the accuracy with which the correct species was identified by the system among all the species in the training dataset. Results were compared with those obtained for the original recording. Anas acuta and Apus pallidus could be identified up to distances of 280 m. Larus fuscus vocalizations could be identified up to 200 m. Identification of Pterodroma madeira and Uria aalge was more variable and started declining within the range of 75–150 m.
Applying the criteria described in Section 2.3.3 to the results in Table 4 and Table 5, these ranges correspond to the values shown in Table 6. Based on medians across species, the effective range was 150 m, with a maximum detection range of 280 m.
The audio samples for Pterodroma madeira and Uria aalge at 100 m were compromised by nearby traffic noise, resulting in a considerably lower performance than at 150 m. As such, one cannot truly evaluate the performance of the system at 100 m for these two species. It can, however, be assumed that the values at 100 m were within the range of the ones at 75–150 m, as was observed for the remaining species. As such, Pterodroma madeira would have a high score ranging from 0.68 to 0.78, and an average score ranging from 0.32 to 0.76, and Uria aalge would have a high score from 0.59 to 0.61 and an average score from 0.40 to 0.59. This would most likely change, in Table 6, the effective ranges of Pterodroma madeira and Uria aalge to 150 m and 100 m, respectively. The maximum detection ranges would not be affected, nor would the median values across species.

4. Discussion

The purpose of fitting the experimental distance characterization data to the signal decay with distance expression and determining the attenuation constant for each frequency was to assess whether the values obtained for this constant were dependent on the frequency of the signal. This can be explained by the ambient noise present in the area during the experiment, which, although direct disturbance was removed prior to analyses, latent noise contributed to inflate the values obtained for this frequency. One other cause was the relative power spike in 1000 Hz at 280 m (observed in Figure 9b), which was likely caused by other background noise.
The fact that some points exceeded the theoretical maximum line (red line in Figure 9) may be due to less-than-ideal conditions at the reference point, including minimal noise visually amplified by the logarithmic scale. In this case, the reference point measurements could have been repeated at another time with lower noise conditions, but in doing so, other the environmental conditions (humidity, etc.) could be different from the ones on the testing day.
Results from 200 m onwards were compromised by unfavorable wind conditions, which highly distorted the measurements at such ranges. Additionally, at these distances, varying levels of background noise, composed of mainly lower frequencies (up to 1000 Hz), affected the microphone. This demonstrates the need to make the microphone even more directional, with better isolation from the surroundings. Even so, the distances of 280 m, 370 m, and 510 m were included in the analysis to provide quantitative sound metrics within the radar operational range. For the 3 kHz and 8 kHz, although with greater variation, the average values followed the evolution of the expected curve. For these frequencies, wind was the most likely cause for any error introduced.
The long-range angular response test was conducted to verify the impact of wind when aiming the microphone at bird targets detected by a bird radar within its operational range, typically beyond 200 m. As expected, wind had an influence on the quality of the audio acquired and, consequently, on the species identification, even for light breezes of 5 m/s.
The angular positioning was found to be more important for capturing high frequencies than lower frequencies, given the relative rate of signal power decay near the center (0 degrees). This is due to the smaller size of higher frequency wavelengths, which create a smaller ‘ball’ of amplified sound near the focus of the parabola. If the direction of sound propagation is distorted by being pushed sideways by the wind or if the parabola is misaligned with this direction, a smaller ‘ball’ will more easily miss the target (the microphone in the focus point) than a larger ‘ball’ [72]. For the long-range test, a quantitative relation between angular position, frequency, and signal power could not be extracted from the experiment. Instead, in the test conditions, the effect of the wind was dominant at the long range of 280 m.
The species detection test indicated better results for the audios taken at 510 m compared to those taken at 370 m. The audios taken at 370 m were likely compromised by a breeze observed at the time these audios were taken or slight miscalibration between the microphone and the sound source. At 370 m, even small angle differences were significant. The audio samples at 100 m had to be recorded a second time due to nearby traffic compromising the Pterodroma madeira and Uria aalge recordings. Even so, the new samples proved still to be of low quality, as they had a considerably lower performance compared to 150 m. As such, one cannot truly evaluate the performance of the microphone and the AI algorithm for this distance for these two species.
The recordings for Apus pallidus had an AI score of 0.39 and 0.45 at 370 m and 510 m, respectively, which were carefully verified in the recorded audio and respective spectrogram. A very weak signal (approximately 20 dB) for this species was observed. Several other bird species were present in the testing environment at the same time. Particularly, Larus fuscus, Turdus merula (Eurasian Blackbird), and Anthus pratensis (Meadow Pipit) were identified by the CNN algorithm. The presence of these species in the recordings might have reduced the scores for the species that were being tested.
As the distance to the sound source increased, low-frequency vocalizations ceased to be detected, but the higher-frequency vocalization species could still be identified. This contradicts expectations, as higher frequencies generally lose more energy over distance when travelling through the air [73]. However, since the tests were conducted in a relatively noisy environment with lower-frequency noise, the intensity of background noise near the microphone surpassed that of the audio signal farther away. This also demonstrates the need to provide a better lateral isolation to the microphone, which can be achieved by using a casing of soundproof materials, such as rubber, foam, or cork. The parabola can also be enlarged to be able to focus sound waves from greater angular offsets. Furthermore, incorporating a wind station sensor near the microphone could allow for real-time adjustments to account for wind direction and speed through an automated process that adjusts the microphone’s positioning based on the sensor information.
Background noise effects can also be minimized after audio acquisition. This can be achieved by applying high-pass filters and retuning the CNN model with audio samples recorded at locations at which the system is to be deployed to obtain models fitted to each location with different noise specifications.
Overall, the directional microphone was able to identify all species up to 150 m (determined as its effective range), albeit with some uncertainty for lower-frequency vocalizations (Pterodroma madeira) and for Uria aalge. For the latter, it may result from the audio used for this species (see Figure 8, from approximately 34 to 39 s) only containing one well-defined pitch (at 35 s) and one weakly defined pitch (at 38 s). A better audio for this species could have been used. The correct identification of very weak, high-frequency bird vocalizations at 510 m shows the potential of the deep learning model used for long-range bird vocalization identification, providing the threshold is lowered for these distances.
Compared to existing studies, the outcomes of the experiments represent an improvement on reported ranges of 50–100 m of maximum range [73,74,75] using various microphone types, though these studies did not use a parabolic dish to focus signals. Although many acoustic sensors with parabolas for acquisition directionality have been used [76], benchmarks on effective detection ranges for bird calls are lacking. The sensor described in [77,78] was proven to detect gunshots up to 800 m; however, its range has not been tested for detecting bird calls. In general, the exact detection range of sound-recording devices is often unknown [79], but it often depends on the frequency of the vocalizations of the bird species [80].
Since the experiments used recorded audios rather than live bird calls, the effective range of the microphone may differ when capturing vocalizations from real birds. This would merit further in situ tests with real bird calls in their natural environment.

5. Conclusions

The practical capabilities of a directional microphone for automatic bird species identification were tested in experiments conducted both in a controlled environment and in situ field conditions. The tests revealed that the determining factors influencing the performance of the directional microphone and its practical deployment were the spectral density of both the environmental noise and the bird call, the wind conditions (acting as both a signal disperser and a noise source), and the distance of the microphone to the sound source.
Both the angular and distance responses of the microphone were tested, showing that the rate of decay increased with frequency, consistent with theoretical expectations. The distance characterization enabled the determination of curves relating signal attenuation to distance, allowing the estimation of detection ranges for bird vocalizations considering their spectra.
The system revealed clear bird call identification capabilities up to 75 m, with most species being clearly identifiable up to 150 m. At 280 m, species could still be reliably identified if their emitted frequencies were outside the range of the background noise. The furthest detection was obtained at 510 m for a high-frequency vocalizing species. Low-frequency noise captured during the tests limited the detection of birds emitting at lower frequency ranges.
Overall, the tests showed that the use of the directional microphone for bird identification was only appropriate for distances up to 150 m and in low background noise conditions. Combining this system with radar systems for bird monitoring would require further efforts to minimize the influence of ambient noise.

Author Contributions

Conceptualization, L.P., M.R., R.M. and R.O.; methodology, T.G., L.P. and M.R.; software, T.G. and R.O.; validation, T.G., L.P. and M.R.; formal analysis, T.G. and R.M.; investigation, T.G., M.R. and J.M.; resources, L.P. and J.M.; data curation, T.G.; writing—original draft preparation, T.G.; writing—review and editing, T.G., L.P., M.R. and R.M.; visualization, T.G.; supervision, L.P. and R.O.; project administration, L.P.; funding acquisition, L.P. and R.O. All authors have read and agreed to the published version of the manuscript.

Funding

This research was funded by EEA-Grants 2014–2021 under the Blue Growth Programme, project number 106 (PT-INNOVATION-0106), through the program Crescimento Azul operated by the Portuguese Direção-Geral de Política do Mar (DGPM) under the scope of the Mecanismo Financeiro do Espaço Económico Europeu (MFEEE 2014–2021).

Data Availability Statement

The datasets presented in this article are not readily available because the data are part of an ongoing study. Requests to access the datasets should be directed to [email protected].

Conflicts of Interest

The authors declare no conflicts of interest.

References

  1. Bauer, S.; Hoye, B.J. Migratory animals couple biodiversity and ecosystem functioning worldwide. Science 2014, 344, 1242552. [Google Scholar] [CrossRef] [PubMed]
  2. Whelan, C.J.; Wenny, D.G.; Marquis, R.J. Ecosystem services provided by birds. Ann. N. Y. Acad. Sci. 2008, 1134, 25–60. [Google Scholar] [CrossRef] [PubMed]
  3. Lees, A.C.; Haskell, L.; Allinson, T.; Bezeng, S.B.; Burfield, I.J.; Renjifo, L.M.; Butchart, S.H. State of the world’s birds. Annu. Rev. Environ. Resour. 2022, 47, 231–260. [Google Scholar] [CrossRef]
  4. Yong, D.L.; Heim, W.; Chowdhury, S.U.; Choi, C.Y.; Ktitorov, P.; Kulikova, O.; Szabo, J.K. The state of migratory landbirds in the East Asian Flyway: Distributions, threats, and conservation needs. Front. Ecol. Evol. 2021, 9, 613172. [Google Scholar] [CrossRef]
  5. Robinson, W.D.; Bowlin, M.S.; Bisson, I.; Shamoun-Baranes, J.; Thorup, K.; Diehl, R.H.; Winkler, D.W. Integrating concepts and technologies to advance the study of bird migration. Front. Ecol. Environ. 2010, 8, 354–361. [Google Scholar] [CrossRef]
  6. Chen, X.; Pu, H.; He, Y.; Lai, M.; Zhang, D.; Chen, J.; Pu, H. An Efficient Method for Monitoring Birds Based on Object Detection and Multi-Object Tracking Networks. Animals 2023, 13, 1713. [Google Scholar] [CrossRef]
  7. Kumar, S.; Kondaveeti, H.K.; Simhadri, C.G.; Reddy, M.Y. Automatic Bird Species Recognition using Audio and Image Data: A Short Review. In Proceedings of the 2023 IEEE International Conference on Contemporary Computing and Communications (InC4), Bangalore, India, 21–22 April 2023; IEEE: Piscataway, NJ, USA, 2023; pp. 1–6. [Google Scholar]
  8. Viola, B.M.; Sorrell, K.J.; Clarke, R.H.; Corney, S.P.; Vaughan, P.M. Amateurs can be experts: A new perspective on collaborations with citizen scientists. Biol. Conserv. 2022, 274, 109739. [Google Scholar] [CrossRef]
  9. Leach, E.C.; Burwell, C.J.; Ashton, L.A.; Jones, D.N.; Kitching, R.L. Comparison of point counts and automated acoustic monitoring: Detecting birds in a rainforest biodiversity survey. Emu 2016, 116, 305–309. [Google Scholar] [CrossRef]
  10. Vold, S.T.; Handel, C.M.; McNew, L.B. Comparison of acoustic recorders and field observers for monitoring tundra bird communities. Wildl. Soc. Bull. 2017, 41, 566–576. [Google Scholar] [CrossRef]
  11. Žydelis, R.; Dorsch, M.; Heinänen, S.; Nehls, G.; Weiss, F. Comparison of digital video surveys with visual aerial surveys for bird monitoring at sea. J. Ornithol. 2019, 160, 567–580. [Google Scholar] [CrossRef]
  12. Margalida, A.; Oro, D.; Cortés-Avizanda, A.; Heredia, R.; Donázar, J.A. Misleading population estimates: Biases and consistency of visual surveys and matrix modelling in the endangered bearded vulture. PLoS ONE 2011, 6, e26784. [Google Scholar] [CrossRef] [PubMed]
  13. Gottschalk, T.K.; Huettmann, F.; Ehlers, M. Thirty years of analysing and modelling avian habitat relationships using satellite imagery data: A review. Int. J. Remote Sens. 2005, 26, 2631–2656. [Google Scholar] [CrossRef]
  14. Ozdemir, I.; Mert, A.; Ozkan, U.Y.; Aksan, S.; Unal, Y. Predicting bird species richness and micro-habitat diversity using satellite data. For. Ecol. Manag. 2018, 424, 483–493. [Google Scholar] [CrossRef]
  15. Fretwell, P.T.; Scofield, P.; Phillips, R.A. Using super–high resolution satellite imagery to census threatened albatrosses. IBIS 2017, 159, 481–490. [Google Scholar] [CrossRef]
  16. Regos, A.; Gómez-Rodríguez, P.; Arenas-Castro, S.; Tapia, L.; Vidal, M.; Domínguez, J. Model-assisted bird monitoring based on remotely sensed ecosystem functioning and atlas data. Remote Sens. 2020, 12, 2549. [Google Scholar] [CrossRef]
  17. Hodgson, J.C.; Baylis, S.M.; Mott, R.; Herrod, A.; Clarke, R.H. Precision wildlife monitoring using unmanned aerial vehicles. Sci. Rep. 2016, 6, 22574. [Google Scholar] [CrossRef]
  18. Han, Y.G.; Yoo, S.H.; Kwon, O. Possibility of applying unmanned aerial vehicle (UAV) and mapping software for the monitoring of waterbirds and their habitats. J. Ecol. Environ. 2017, 41, 21. [Google Scholar] [CrossRef]
  19. Díaz-Delgado, R.; Mañez, M.; Martínez, A.; Canal, D.; Ferrer, M.; Aragonés, D. Using UAVs to map aquatic bird colonies. In The Roles of Remote Sensing in Nature Conservation: A Practical Guide and Case Studies; Springer: Cham, Switzerland, 2017; pp. 277–291. [Google Scholar]
  20. Lee, W.Y.; Park, M.; Hyun, C.U. Detection of two Arctic birds in Greenland and an endangered bird in Korea using RGB and thermal cameras with an unmanned aerial vehicle (UAV). PLoS ONE 2019, 14, e0222088. [Google Scholar] [CrossRef]
  21. Michez, A.; Broset, S.; Lejeune, P. Ears in the sky: Potential of drones for the bioacoustic monitoring of birds and bats. Drones 2021, 5, 9. [Google Scholar] [CrossRef]
  22. Abrahams, C.; Geary, M. Combining bioacoustics and occupancy modelling for improved monitoring of rare breeding bird populations. Ecol. Indic. 2020, 112, 106131. [Google Scholar] [CrossRef]
  23. Shaw, T.; Hedes, R.; Sandstrom, A.; Ruete, A.; Hiron, M.; Hedblom, M.; Mikusiński, G. Hybrid bioacoustic and ecoacoustic analyses provide new links between bird assemblages and habitat quality in a winter boreal forest. Environ. Sustain. Indic. 2021, 11, 100141. [Google Scholar] [CrossRef]
  24. Alswaitti, M.; Zihao, L.; Alomoush, W.; Alrosan, A.; Alissa, K. Effective classification of birds’ species based on transfer learning. Int. J. Electr. Comput. Eng. IJECE 2022, 12, 4172–4184. [Google Scholar] [CrossRef]
  25. Rabhi, W.; Eljaimi, F.; Amara, W.; Charouh, Z.; Ezzouhri, A.; Benaboud, H.; Ouardi, F. An Integrated Framework for Bird Recognition using Dynamic Machine Learning-based Classification. In Proceedings of the 2023 IEEE Symposium on Computers and Communications (ISCC), Gammarth, Tunisia, 9–12 July 2023; IEEE: Piscataway, NJ, USA, 2023; pp. 889–892. [Google Scholar]
  26. Chen, A.; Jacob, M.; Shoshani, G.; Charter, M. Using computer vision, image analysis and UAVs for the automatic recognition and counting of common cranes (Grus grus). J. Environ. Manag. 2023, 328, 116948. [Google Scholar] [CrossRef] [PubMed]
  27. Thomas, A.; Speldewinde, P.; Roberts, J.D.; Burbidge, A.H.; Comer, S. If a bird calls, will we detect it? Factors that can influence the detectability of calls on automated recording units in field conditions. Emu 2020, 120, 239–248. [Google Scholar] [CrossRef]
  28. Shonfield, J.; Bayne, E.M. Autonomous recording units in avian ecological research: Current use and future applications. Avian Conserv. Ecol. 2017, 12, 14. [Google Scholar] [CrossRef]
  29. Sound Approach. Common Scoters in Strange Places. Available online: https://soundapproach.co.uk/common-scoters-strange-places/ (accessed on 21 August 2024).
  30. Metcalf, O.C.; Bradnum, D.; Dunning, J.; Lees, A.C. Nocturnal overland migration of Common Scoters across England. Br. Birds 2019, 115, 130–141. [Google Scholar]
  31. Olson, H.F. Directional microphones. J. Audio Eng. Soc. 1967, 15, 420–430. [Google Scholar] [CrossRef]
  32. Smith, A.; Brown, T. Enhancing acoustic monitoring with directional microphones. Acoust. Res. Lett. 2021, 22, 134–142. [Google Scholar]
  33. Blumstein, D.T.; Mennill, D.J.; Clemins, P.; Girod, L.; Yao, K.; Patricelli, G.; Kirschel, A.N. Acoustic monitoring in terrestrial environments using microphone arrays: Applications, technological considerations and prospectus. J. Appl. Ecol. 2011, 48, 758–767. [Google Scholar] [CrossRef]
  34. Verreycken, E.; Simon, R.; Quirk-Royal, B.; Daems, W.; Barber, J.; Steckel, J. Bio-acoustic tracking and localization using heterogeneous, scalable microphone arrays. Commun. Biol. 2021, 4, 1275. [Google Scholar] [CrossRef]
  35. Suzuki, R.; Matsubayashi, S.; Hedley, R.W.; Nakadai, K.; Okuno, H.G. HARKBird: Exploring acoustic interactions in bird communities using a microphone array. J. Robot. Mechatron. 2017, 29, 213–223. [Google Scholar] [CrossRef]
  36. Gayk, Z.G.; Mennill, D.J.; Daniel, J. Acoustic similarity of flight calls corresponds with the composition and structure of mixed-species flocks of migrating birds: Evidence from a three-dimensional microphone array. Philos. Trans. R. Soc. B 2023, 378, 20220114. [Google Scholar] [CrossRef]
  37. Chakraborty, D.; Mukker, P.; Rajan, P.; Dileep, A.D. Bird call identification using dynamic kernel based support vector machines and deep neural networks. In Proceedings of the 2016 15th IEEE International Conference on Machine Learning and Applications (ICMLA), Anaheim, CA, USA, 18–20 December 2016; IEEE: Piscataway, NJ, USA, 2016; pp. 280–285. [Google Scholar]
  38. Andono, P.N.; Shidik, G.F.; Prabowo, D.P.; Pergiwati, D.; Pramunendar, R.A. Based on Combination Feature Extraction and Reduction Dimension with the K-Nearest Neighbor. Int. J. Intell. Eng. Syst. 2022, 15, 262–272. [Google Scholar]
  39. Lasseck, M. Improved Automatic Bird Identification Through Decision Tree Based Feature Selection and Bagging. CLEF Work. Notes 2015, 1391. Available online: https://ceur-ws.org/Vol-1391/160-CR.pdf (accessed on 23 July 2024).
  40. Ross, J.C.; Allen, P.E. Random forest for improved analysis efficiency in passive acoustic monitoring. Ecol. Inform. 2014, 21, 34–39. [Google Scholar] [CrossRef]
  41. Krizhevsky, A.; Sutskever, I.; Hinton, G.E. ImageNet classification with deep convolutional neural networks. Commun. ACM 2017, 60, 84–90. [Google Scholar] [CrossRef]
  42. Patel, R.; Kumar, S. Application of CNNs in environmental sound classification. J. Acoust. Soc. Am. 2021, 149, 1234–1245. [Google Scholar]
  43. Kahl, S.; Wilhelm-Stein, T.; Klinck, H.; Kowerko, D.; Eibl, M. Recognizing birds from sound—The 2018 BirdCLEF baseline system. arXiv 2018, arXiv:1804.07177. [Google Scholar]
  44. Jasim, H.A.; Ahmed, S.R.; Ibrahim, A.A.; Duru, A.D. Classify bird species audio by augment convolutional neural network. In Proceedings of the 2022 International Congress on Human-Computer Interaction, Optimization and Robotic Applications (HORA), Ankara, Turkey, 9–11 June 2022; IEEE: Piscataway, NJ, USA, 2022; pp. 1–6. [Google Scholar]
  45. Sprengel, E.; Jaggi, M.; Kilcher, Y.; Hofmann, T. Audio based bird species identification using deep learning techniques. LifeCLEF 2016, 2016, 547–559. [Google Scholar]
  46. Kaggle. BirdCLEF2023 1st Place Solution: Correct Data Is All You Need. Available online: https://www.kaggle.com/competitions/birdclef-2023/discussion/412808 (accessed on 21 August 2024).
  47. Kaggle BirdCLEF2023 6th Place Solution: BirdNET Embedding + CNN. Available online: https://www.kaggle.com/competitions/birdclef-2023/discussion/412708 (accessed on 21 August 2024).
  48. Kaggle. BirdCLEF2023 2nd Place Solution. Available online: https://www.kaggle.com/competitions/birdclef-2021/discussion/243463 (accessed on 21 August 2024).
  49. Kahl, S.; Wood, C.M.; Eibl, M.; Klinck, H. BirdNET: A deep learning solution for avian diversity monitoring. Ecol. Inform. 2021, 61, 101236. [Google Scholar] [CrossRef]
  50. GitHub. BirdNET-Analyzer. Available online: https://github.com/kahst/BirdNET-Analyzer (accessed on 21 August 2024).
  51. Nolan, V.; Scott, C.; Yeiser, J.M.; Wilhite, N.; Howell, P.E.; Ingram, D.; Martin, J.A. The development of a convolutional neural network for the automatic detection of Northern Bobwhite Colinus virginianus covey calls. Remote Sens. Ecol. Conserv. 2023, 9, 46–61. [Google Scholar] [CrossRef]
  52. Wildlife Acoustics. Song Meter SM4. Available online: https://www.wildlifeacoustics.com/products/song-meter-sm4 (accessed on 21 August 2024).
  53. Capture Systems. CARACAL. Available online: https://www.capture-sys.com/caracal (accessed on 21 August 2024).
  54. Hugging Face. ECA-NFNet-L0. Available online: https://huggingface.co/timm/eca_nfnet_l0 (accessed on 23 July 2024).
  55. Brock, A.; De, S.; Smith, S.L.; Simonyan, K. High-performance large-scale image recognition without normalization. In Proceedings of the 38th International Conference on Machine Learning, Virtual, 18–24 July 2021; pp. 1059–1071. [Google Scholar]
  56. Hugging Face. ConvNext-Small-FB-IN22K-IN1K-384. Available online: https://huggingface.co/facebook/convnext-base-384-22k-1k (accessed on 23 July 2024).
  57. Li, Z.; Liu, F.; Yang, W.; Peng, S.; Zhou, J. A survey of convolutional neural networks: Analysis, applications, and prospects. IEEE Trans. Neural Netw. Learn. Syst. 2021, 33, 6999–7019. [Google Scholar] [CrossRef] [PubMed]
  58. Hugging Face. ConvNextV2-Tiny-FCMAE-FT-IN22K-IN1K. Available online: https://huggingface.co/facebook/convnextv2-tiny-22k-384 (accessed on 23 July 2024).
  59. Woo, S.; Debnath, S.; Hu, R.; Chen, X.; Liu, Z.; Kweon, I.S.; Xie, S. Convnext v2: Co-designing and scaling convnets with masked autoencoders. In Proceedings of the IEEE/CVF Conference on Computer Vision and Pattern Recognition (CVPR), Vancouver, BC, Canada, 17–24 June 2023; pp. 16133–16142. [Google Scholar]
  60. Kaggle. Birdclef-2023-data-part1. Available online: https://www.kaggle.com/datasets/vladimirsydor/birdclef-2023-data-part1 (accessed on 21 August 2024).
  61. Kaggle. Bird-clef-2023-models. Available online: https://www.kaggle.com/datasets/vladimirsydor/bird-clef-2023-models (accessed on 21 August 2024).
  62. Microsoft. Introduction to Page Files. Available online: https://learn.microsoft.com/en-us/troubleshoot/windows-client/performance/introduction-to-the-page-file (accessed on 21 August 2024).
  63. Xeno-Canto. Xeno-Canto Public Dataset. Available online: https://xeno-canto.org/ (accessed on 23 July 2024).
  64. Xeno-Canto. FAQ. Available online: https://xeno-canto.org/help/FAQ (accessed on 21 August 2024).
  65. Maclean, K.; Triguero, I. Identifying bird species by their calls in Soundscapes. Appl. Intell. 2023, 53, 21485–21499. [Google Scholar] [CrossRef]
  66. GitHub. ESC-50 Dataset. Available online: https://github.com/karolpiczak/ESC-50 (accessed on 23 July 2024).
  67. Zenodo Soundscape Collections. BirdCLEF 2023 Discussion. Available online: https://www.kaggle.com/competitions/birdclef-2023/discussion/394358#2179605 (accessed on 23 July 2024).
  68. Gonçalves, L.; Subtil, A.; Oliveira, M.R.; de Zea Bermudez, P. ROC curve estimation: An overview. REVSTAT Stat. J. 2014, 12, 1–20. [Google Scholar]
  69. Dalvi, S.; Gressel, G.; Achutan, K. Tuning the false positive rate/false negative rate with phishing detection models. Int. J. Eng. Adv. Technol. 2019, 9, 7–13. [Google Scholar] [CrossRef]
  70. Voudoukis, N.; Oikonomidis, S. Inverse square law for light and radiation: A unifying educational approach. Eur. J. Eng. Technol. Res. 2017, 2, 23–27. [Google Scholar]
  71. Sü Gül, Z.; Xiang, N.; Çalışkan, M. Investigations on sound energy decays and flows in a monumental mosque. J. Acoust. Soc. Am. 2016, 140, 344–355. [Google Scholar] [CrossRef]
  72. Wahlberg, M.; Larsen, O.N. Propagation of sound. Comp. Bioacoust. Overv. 2017, 685, 61–120. [Google Scholar]
  73. Darras, K.F.; Deppe, F.; Fabian, Y.; Kartono, A.P.; Angulo, A.; Kolbrek, B.; Prawiradilaga, D.M. High microphone signal-to-noise ratio enhances acoustic sampling of wildlife. PeerJ 2020, 8, e9955. [Google Scholar]
  74. Stepanian, P.M.; Horton, K.G.; Hille, D.C.; Wainwright, C.E.; Chilson, P.B.; Kelly, J.F. Extending bioacoustic monitoring of birds aloft through flight call localization with a three-dimensional microphone array. Ecol. Evol. 2016, 6, 7039–7046. [Google Scholar]
  75. Darras, K.; Batáry, P.; Furnas, B.; Celis-Murillo, A.; Van Wilgenburg, S.L.; Mulyani, Y.A.; Tscharntke, T. Comparing the sampling performance of sound recorders versus point counts in bird surveys: A meta-analysis. J. Appl. Ecol. 2018, 55, 2575–2586. [Google Scholar] [CrossRef]
  76. Madhusudhana, S.; Pavan, G.; Miller, L.A.; Gannon, W.L.; Hawkins, A.; Erbe, C.; Thomas, J.A. Choosing equipment for animal bioacoustic research. In Exploring Animal Behavior Through Sound; Springer: Cham, Switzerland, 2022; Volume 37. [Google Scholar]
  77. Prince, P.; Hill, A.; Piña Covarrubias, E.; Doncaster, P.; Snaddon, J.L.; Rogers, A. Deploying acoustic detection algorithms on low-cost, open-source acoustic sensors for environmental monitoring. Sensors 2019, 19, 553. [Google Scholar] [CrossRef] [PubMed]
  78. Osborne, P.E.; Alvares-Sanches, T.; White, P.R. To bag or not to bag? How AudioMoth-based passive acoustic monitoring is impacted by protective coverings. Sensors 2023, 23, 7287. [Google Scholar] [CrossRef] [PubMed]
  79. Darras, K.; Furnas, B.; Fitriawan, I.; Mulyani, Y.; Tscharntke, T. Estimating bird detection distances in sound recordings for standardizing detection ranges and distance sampling. Methods Ecol. Evol. 2018, 9, 1928–1938. [Google Scholar] [CrossRef]
  80. Weisshaupt, N.; Saari, J.; Koistinen, J. Evaluating the potential of bioacoustics in avian migration research by citizen science and weather radar observations. PLoS ONE 2024, 19, e0299463. [Google Scholar] [CrossRef] [PubMed]
Figure 1. Directional microphone prototype: (a) fully assembled prototype and (b) close-up of the parabola and microphone.
Make 06 00115 g001
Figure 2. Preprocessing audio pipeline.
Make 06 00115 g002
Figure 3. Deep learning model architecture used.
Make 06 00115 g003
Figure 4. Deep learning inference pipeline.
Make 06 00115 g004
Figure 5. Model assessment in the public Xeno-Canto dataset using the (a) FPR–FNR plot (rate vs. threshold) and (b) ROC curve (TPR vs. FPR), where threshold points are drawn at intervals of 0.1 and values are displayed at intervals of 0.2.
Make 06 00115 g005
Figure 6. Microphone position (red) and testing locations (green) at varying distances.
Make 06 00115 g006
Figure 7. Simple-frequency testing audio.
Make 06 00115 g007
Figure 8. Species detection testing audio.
Make 06 00115 g008
Figure 9. Signal relative power (dB) vs. distance for each of the four tested frequencies: (a) 500 Hz, (b) 1000 Hz, (c) 3000 Hz, and (d) 8000 Hz. The scatter points represent measurements obtained at each point, the solid line represents the average of these points, the dashed line represents the fitted inverse square law with additional attenuation, and the dashed red line is the theoretical maximum, not considering frequency decay.
Make 06 00115 g009
Figure 10. Close-range angular characterization (25 m).
Make 06 00115 g010
Figure 11. Long-range angular characterization (280 m).
Make 06 00115 g011
Table 1. Species selected for model training.
Common NameScientific NameCommon NameScientific Name
Arctic TernSterna paradisaeaLittle EgretEgretta garzetta
Atlantic PuffinFratercula arcticaManx ShearwaterPuffinus puffinus
Balearic ShearwaterPuffinus mauretanicusMeadow PipitAnthus pratensis
Bearded BellbirdProcnias averanoMediterranean GullLarus melanocephalus
Black-headed GullLarus ridibundusNorthern GannetMorus bassanus
Black-legged KittiwakeRissa tridactylaNorthern LapwingVanellus vanellus
Common BlackbirdTurdus merulaNorthern PintailAnas acuta
Common MoorhenGallinula chloropusPallid SwiftApus pallidus
Common MurreUria aalgeParasitic JaegerStercorarius parasiticus
Common Ringed PloverCharadrius hiaticulaPied AvocetRecurvirostra avosetta
Common ScoterMelanitta nigraPomarine JaegerStercorarius pomarinus
Common TernSterna hirundoPurple HeronArdea purpurea
Cory’s ShearwaterCalonectris borealisRazorbillAlca torda
Eurasian CootFulica atraRed KnotCalidris canutus
Eurasian WhimbrelNumenius phaeopusSandwich TernThalasseus sandvicensis
Great Black-backed GullLarus marinusWater RailRallus aquaticus
Great SkuaStercorarius skuaYellow-legged GullLarus michahellis
Grey PloverPluvialis squatarolaZino’s PetrelPterodroma madeira
Lesser Black-backed GullLarus fuscus
Table 2. Selected species and respective vocalization frequencies.
Scientific NameCommon NameVocalization Frequencies
Anas acutaNorthern Pintail1500–2000 Hz, harmonics up to 6000 Hz
Apus pallidusPallid Swift3000–6000 Hz, harmonics up to 15,000 Hz
Larus fuscusLesser Black-Backed GullHarmonics from 300 Hz up to 13,000 Hz
Pterodroma madeiraZino’s Petrel500–1000 Hz, harmonics up to 4000 Hz
Uria aalgeCommon Murre250–4000 Hz, harmonics up to 8000 Hz
Table 3. Fitted curve parameters for all tested frequencies.
Frequency (Hz) Attenuation   Constant ,   λ R 2 Value
5005.478 × 10−30.910
10004.358 × 10−30.924
30008.857 × 10−30.968
80009.811 × 10−30.985
Table 4. Highest and average AI model scores for the tested species per distance. NR (non-relevant) indicates an absence of meaningful results.
DistanceAnas acutaApus pallidusLarus fuscusPterodroma madeiraUria aalge
HighAvg.HighAvg.HighAvg.HighAvg.HighAvg.
Original Recording0.880.880.880.880.920.920.920.920.800.80
100.820.800.890.850.770.730.830.820.780.78
250.870.870.860.850.800.800.780.800.770.76
500.860.850.860.860.750.740.830.800.770.60
750.850.800.880.870.710.700.780.760.610.59
1000.820.800.850.820.680.640.340.270.160.10
1500.820.730.750.650.630.550.680.320.590.40
2000.790.710.780.740.570.430.120.090.110.08
2800.580.510.760.630.460.280.160.070.120.07
3700.190.140.390.15NRNRNRNRNRNR
5100.260.190.480.18NRNRNRNRNRNR
Table 5. Highest and average AI model ranks for the tested species per distance. Ranks indicate the ordered place of the actual species within the full species list in the training dataset (37 species) based on AI model scores. NR (non-relevant) indicates an absence of meaningful results.
DistanceAnas acutaApus pallidusLarus fuscusPterodroma madeiraUria aalge
HighAvg.HighAvg.HighAvg.HighAvg.HighAvg.
Original Recording1111111111
101111111111
251111111111
501111111112
751111111111
100111111191928.5
1501111111513.5
200111111.51421.33133
2801111110.61323.32933.3
370714.4220NRNRNRNRNRNR
51019.6121NRNRNRNRNRNR
Table 6. Effective and maximum detection ranges determined for the tested species.
Scientific NameEffective RangeMaximum Detection Range
Anas acuta200 m280 m
Apus pallidus280 m510 m
Larus fuscus150 m280 m
Pterodroma madeira75 m150 m
Uria aalge75 m150 m
Disclaimer/Publisher’s Note: The statements, opinions and data contained in all publications are solely those of the individual author(s) and contributor(s) and not of MDPI and/or the editor(s). MDPI and/or the editor(s) disclaim responsibility for any injury to people or property resulting from any ideas, methods, instructions or products referred to in the content.