1. Introduction
In the finance industry, textual data play a vital role in various financial business use cases. However, the representation of financial knowledge within these textual data is often unstructured, limiting its value and potential. Financial knowledge graphs have gained significant attention by providing a structured way to represent financial data. This structured nature enhances their applicability in various domains, including risk management [
1], fraud detection [
2], investment analysis [
3], and financial decision-making.
Recent advancements in temporal knowledge graph (TKG) representation learning have shown significant promise for tasks that involve reasoning and forecasting on evolving knowledge. Our work builds upon several key contributions in this area. Cai et al. [
4] propose a taxonomy for TKG representation learning methods and highlight various approaches for capturing temporal dynamics. He et al. [
5] introduce the concept of a “Hip network” that leverages historical information for reasoning on TKGs. For temporal knowledge graph completion, Wang et al. [
6] present MADE, a method using multicurvature adaptive embeddings, while Dong et al. [
7] explore temporal inductive path neural networks. Liao et al. [
8] investigate generative forecasting on TKGs with large language models, while Luo et al. [
9] explore the potential of large language models for learning and forecasting with TKG completion. Ding et al. [
10] introduce zrLLM for zero-shot relational learning, and Wang et al. [
11] propose IME, a method integrating multicurvature embeddings for TKG completion. Finally, Gastinger et al. [
12] establish a baseline for temporal knowledge graph forecasting. Our work introduces a framework that combines temporal relational graph convolutional networks with financial performance prediction, offering a way to integrate temporal dynamics from financial data.
The first challenge in real-world applications is that knowledge graphs often face issues related to incomplete and inaccurate data. Cheng et al. [
13] focus on structured news events extracted from a raw text corpus, constructing a large-scale knowledge graph called FinKG, which covers over 3000 companies listed in the Shanghai and Shenzhen stock exchanges. Despite this, the paper highlights the difficulties in creating a complete and accurate knowledge graph. Our approach uses scenario-based extractors to accurately capture complex relationships between entities in financial textual data, resulting in a more complete and accurate representation of financial information.
The second challenge is the lack of a systematic and repeatable approach to knowledge graph construction. Zehra et al. [
14] present a financial knowledge graph-based financial report query system utilizing Wikidata and DBpedia, but the construction process lacks repeatability. Loster et al. [
15] highlight challenges in the entity resolution, maintenance, and exploration of such graphs. Cheng et al. [
16] propose a multi-modality graph neural network (MAGNN) but do not provide sufficient details on the construction process. Our paper proposes a systematic way of constructing a financial knowledge graph using scenario-based knowledge extractors, which ensures an accurate capture of complex relationships. A scenario-based knowledge extractor includes modules such as Financial Growth Extractor, Market Development Extractor, Contract Extractor, and Acquisition Extractor. These modules focus on specific scenarios to extract relevant financial information, accurately identifying key entities and relationships to ensure comprehensive and precise financial knowledge representation.
The third challenge is incorporating consistent domain-specific knowledge within the knowledge graphs. Knowledge graphs constructed from internet sources like Wikipedia have been explored in various domains [
17,
18,
19]. Domain-specific graphs have also been developed in healthcare [
20,
21]. However, these approaches lack structured methods for knowledge extraction. K-BERT [
22] injects domain knowledge into BERT but does not leverage domain-specific taxonomies for consistent extraction. Our approach incorporates domain knowledge through taxonomies and scenario-specific extraction methods.
Wang et al. [
23] introduced the Financial Research Report Knowledge Graph (FR2KG) dataset in Chinese, focusing on domain-specific triples. Our work presents a generalized systematic approach applicable to any domain with a well-defined taxonomy, emphasizing a formal, standardized, and semantically enriched representation using domain-specific taxonomies. Wu et al. [
24] proposed an audit information knowledge graph specific to a particular market, which limits generalizability. Our work uses a domain-specific taxonomy as the backbone, providing a formal and consistent representation regardless of market.
In the domain of temporal financial data representation, previous work has explored various temporal graph-based techniques. Messner et al. [
25] introduced BoxTE for temporal knowledge graph completion (TKGC) using box embeddings. Xu et al. [
26] proposed TEA-GNN with time-aware attention for TKGs. However, these approaches do not comprehensively represent temporal financial data. Our approach combines Relational Graph Convolutional Networks (RGCNs) [
27] with Long Short-Term Memory (LSTM) to capture temporal patterns, providing a more nuanced representation.
Graph learning methods have seen applications in healthcare, particularly brain analysis for disease detection [
28]. Bi et al. [
29] developed a structure-adaptive graph neural network with temporal representation (TR-SAGNN) that addresses limitations of existing methods by incorporating a temporal attention learning module, which is similar to our temporal RGCN’s ability to capture temporal dynamics in financial data.
To evaluate our FinTechKG, we adopt the task of financial performance prediction as a benchmark task. In the domain of financial performance prediction, Tao et al. [
30] utilized ConvLSTM networks for extracting stock price features and incorporating mutation points with graph convolutional networks (GCNs). Lam et al. [
31] explored neural networks to integrate fundamental and technical analysis for financial performance prediction. Although effective, these approaches did not consider real-time trends from social information such as news or tweets, which can significantly impact financial entity performance.
Our approach uses tweets as social embeddings to capture real-time trends and demonstrates improved prediction accuracy by incorporating temporal features from social embeddings. The VGC-GAN model [
32], an advanced adversarial framework utilizing multi-graph convolution for stock price forecasting, stands out by creating dynamic correlation graphs and integrating a GAN architecture with Multi-GCN and GRU. This methodology significantly improves prediction accuracy through a detailed analysis of inter-stock relationships and temporal dependencies, as demonstrated on various datasets.
While some prior work, like that from Elhammadi et al. [
33], has focused on financial knowledge graph construction and semantic relationship discovery, it often neglects the temporal sequence of events. The lack of temporal representation may lead to outdated or irrelevant information in the knowledge graph, limiting its relevance and reliability in dynamic financial markets.
Zakhidov (2024) underscores the role of economic indicators like GDP, inflation, and employment in predicting market trends, advocating for a combination of quantitative and qualitative data for better analysis [
34]. Olorunsola et al. (2024) link governance scores and financial metrics, such as GOPPAR, to corporate emission performance, offering insights into financial–environmental dynamics in the tourism industry [
35]. Munir et al. (2024) highlight the influence of dividend-related metrics and financial indicators on stock price dynamics in Pakistan’s non-financial sectors, emphasizing localized financial decisions [
36].
Our paper presents a Relational Graph Convolutional Network (RGCN) [
27] and LSTM [
37] approach to enhance financial performance prediction. Further aggregating the temporal information into the LSTM [
37] enables a more accurate prediction of financial entity performance, by integrating the comprehensive financial knowledge graph into the RGCNs [
27] and training it at different timesteps.
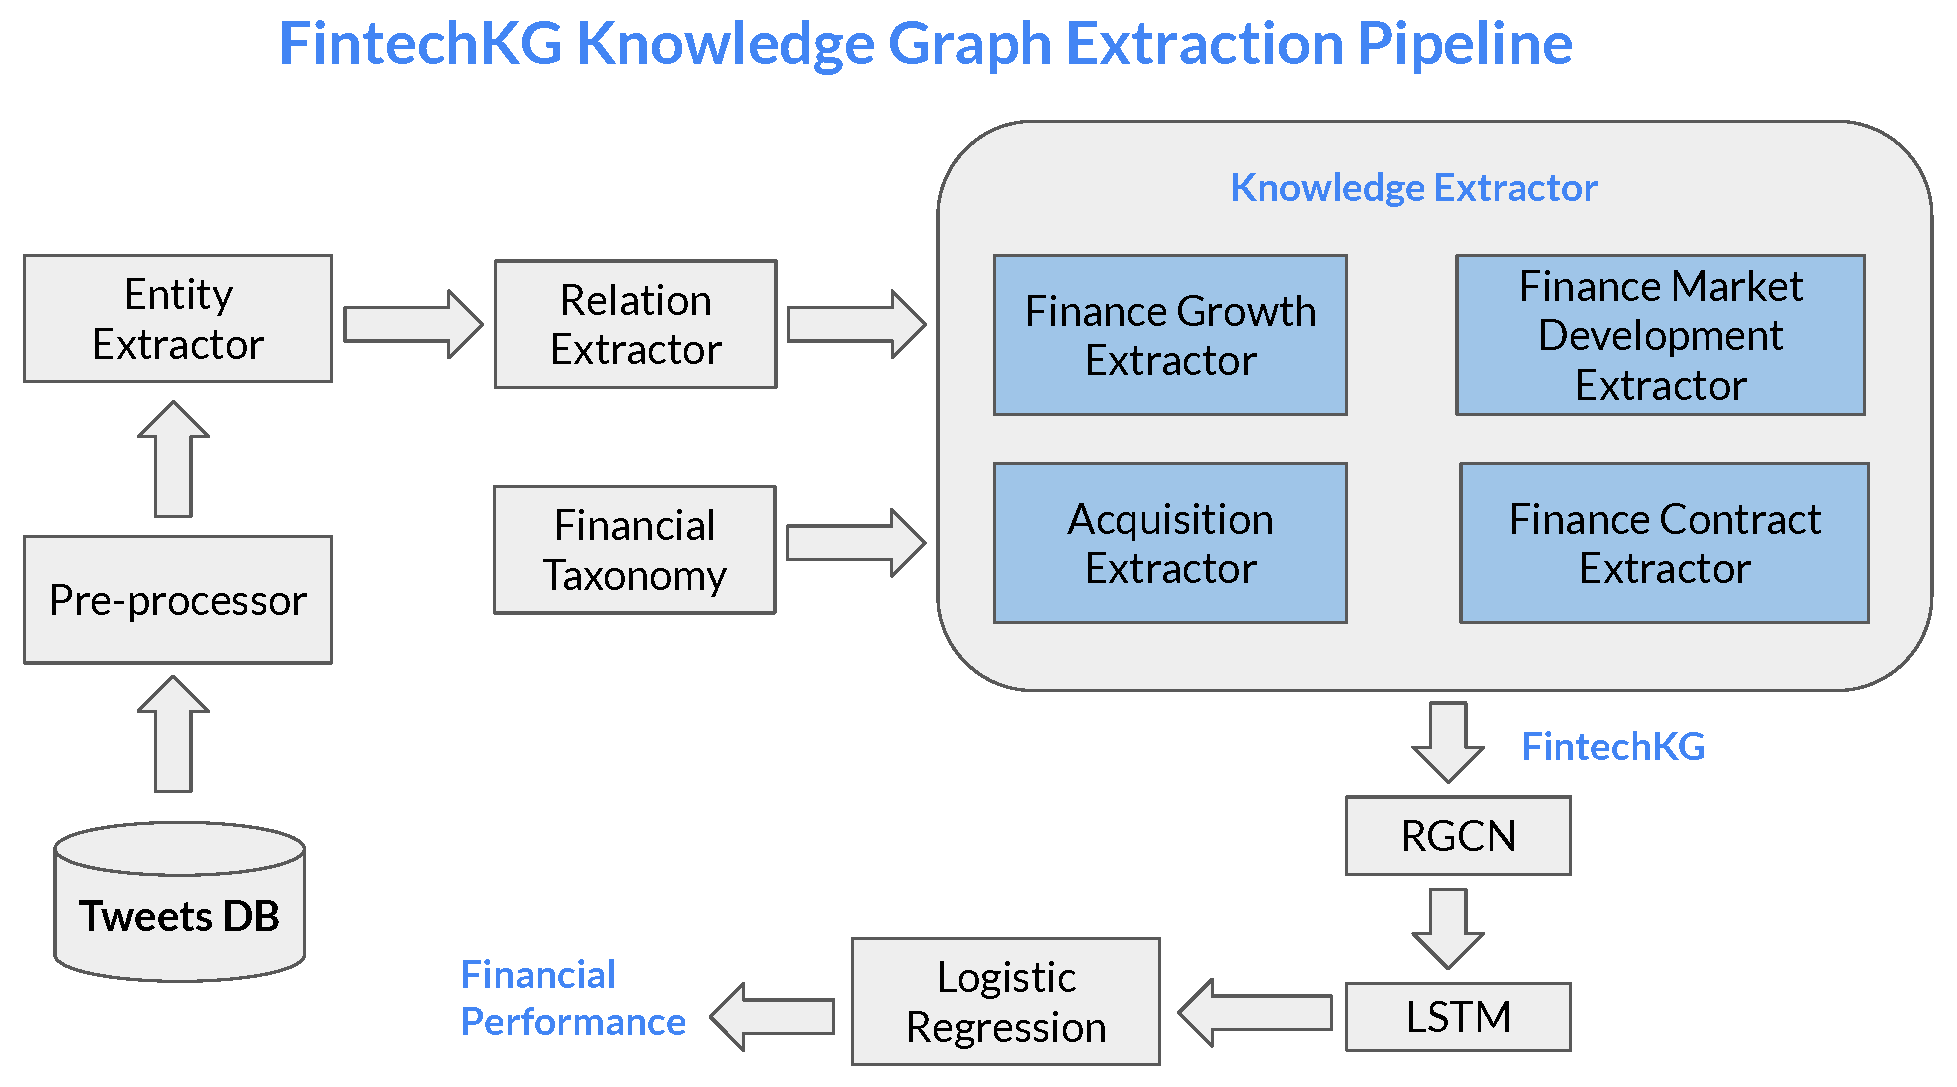
The FintechKG knowledge graph extraction pipeline is shown in
Figure 1. It comprises a reusable methodology that can be used to generate knowledge graphs on other textual data. (By identifying the taxonomy/concept entities for the domain).
The proposed approach, FintechKG, overcomes various challenges in financial knowledge graph construction and financial performance prediction by employing a systematic and comprehensive methodology as follows:
Enriched Domain Knowledge: FintechKG captures the taxonomy of financial concepts from various financial statements such as income statements, balance sheets, and cash flow statements. This enriched domain knowledge provides a comprehensive understanding of financial concepts and relationships between entities.
Effective Integration of Information: The proposed approach integrates textual embeddings (FinBERT) [
38] with graph-based embeddings (RGCN) to exploit both textual knowledge and relational information encoded in the knowledge graph. This integration enhances the accuracy of financial entity performance predictions by mapping both embeddings into a shared latent space.
Temporal Pattern Learning: The RGCN [
27] embeddings from different time steps are used as input to an LSTM [
37] (Long Short-Term Memory) model, capturing temporal dependencies and trends in financial data. This leads to more accurate predictions of financial performance. Our focus is to present an example of predicting whether a financial organization’s revenue will increase or decrease. The same approach can be applied to predicting other financial indicators as well.
Overall, FintechKG offers a scalable and adaptable approach to constructing financial knowledge graphs, addressing challenges representing complex relationships through RGCN [
27]. Its temporal awareness, enriched domain knowledge, and effective integration of textual and graph-based information make it a valuable framework for financial decision-making and analysis.
3. FintechKG Construction Phase
The pipeline follows a systematic process for extracting Concept Entities, Commercial Entities, and Relations from textual data. The input to the pipeline consists of sentences or paragraphs of text. The text undergoes pre-processing, including the removal of stop words and invalid characters. The pre-processed text is then fed into the BERT (Bidirectional Encoder Representations from Transformers) NER (Named Entity Recognition) Model [
39] to extract entities. A rule-based algorithm is used to extract relations in the form of <subject, predicate, object> triples from the textual data.
Furthermore, we employ a Scenario-Based Knowledge Extractor that encompasses several extractors such as the Financial Growth Extractor, Finance Market Development Extractor, Finance Contract Extractor, and Acquisition Extractor. These extractors utilize specific scenarios to extract relevant financial information. The output of the Scenario-Based Knowledge Extractor contributes to the generation of the financial knowledge graph(FinTechKG).
The combination of these steps forms a comprehensive approach for constructing the FintechKG, enabling the extraction and organization of valuable financial information into a structured knowledge graph.
In this section, we define the key concepts in our methodology, where financial knowledge is extracted in three dimensions: Commercial Entity (ComE), Financial or Concept Entity (ConE), and temporal information (TI).
3.1. Commercial Entity (ComE)
The commercial entity refers to organizations’ names. We use pre-defined ticker symbols to match with the tokens in the text and identify the occurrence of ticker symbols in the tweet. Ticker symbols are commonly used in financial text to refer to the performance of financial entities.
3.2. Financial or Concept Entity (ConE)
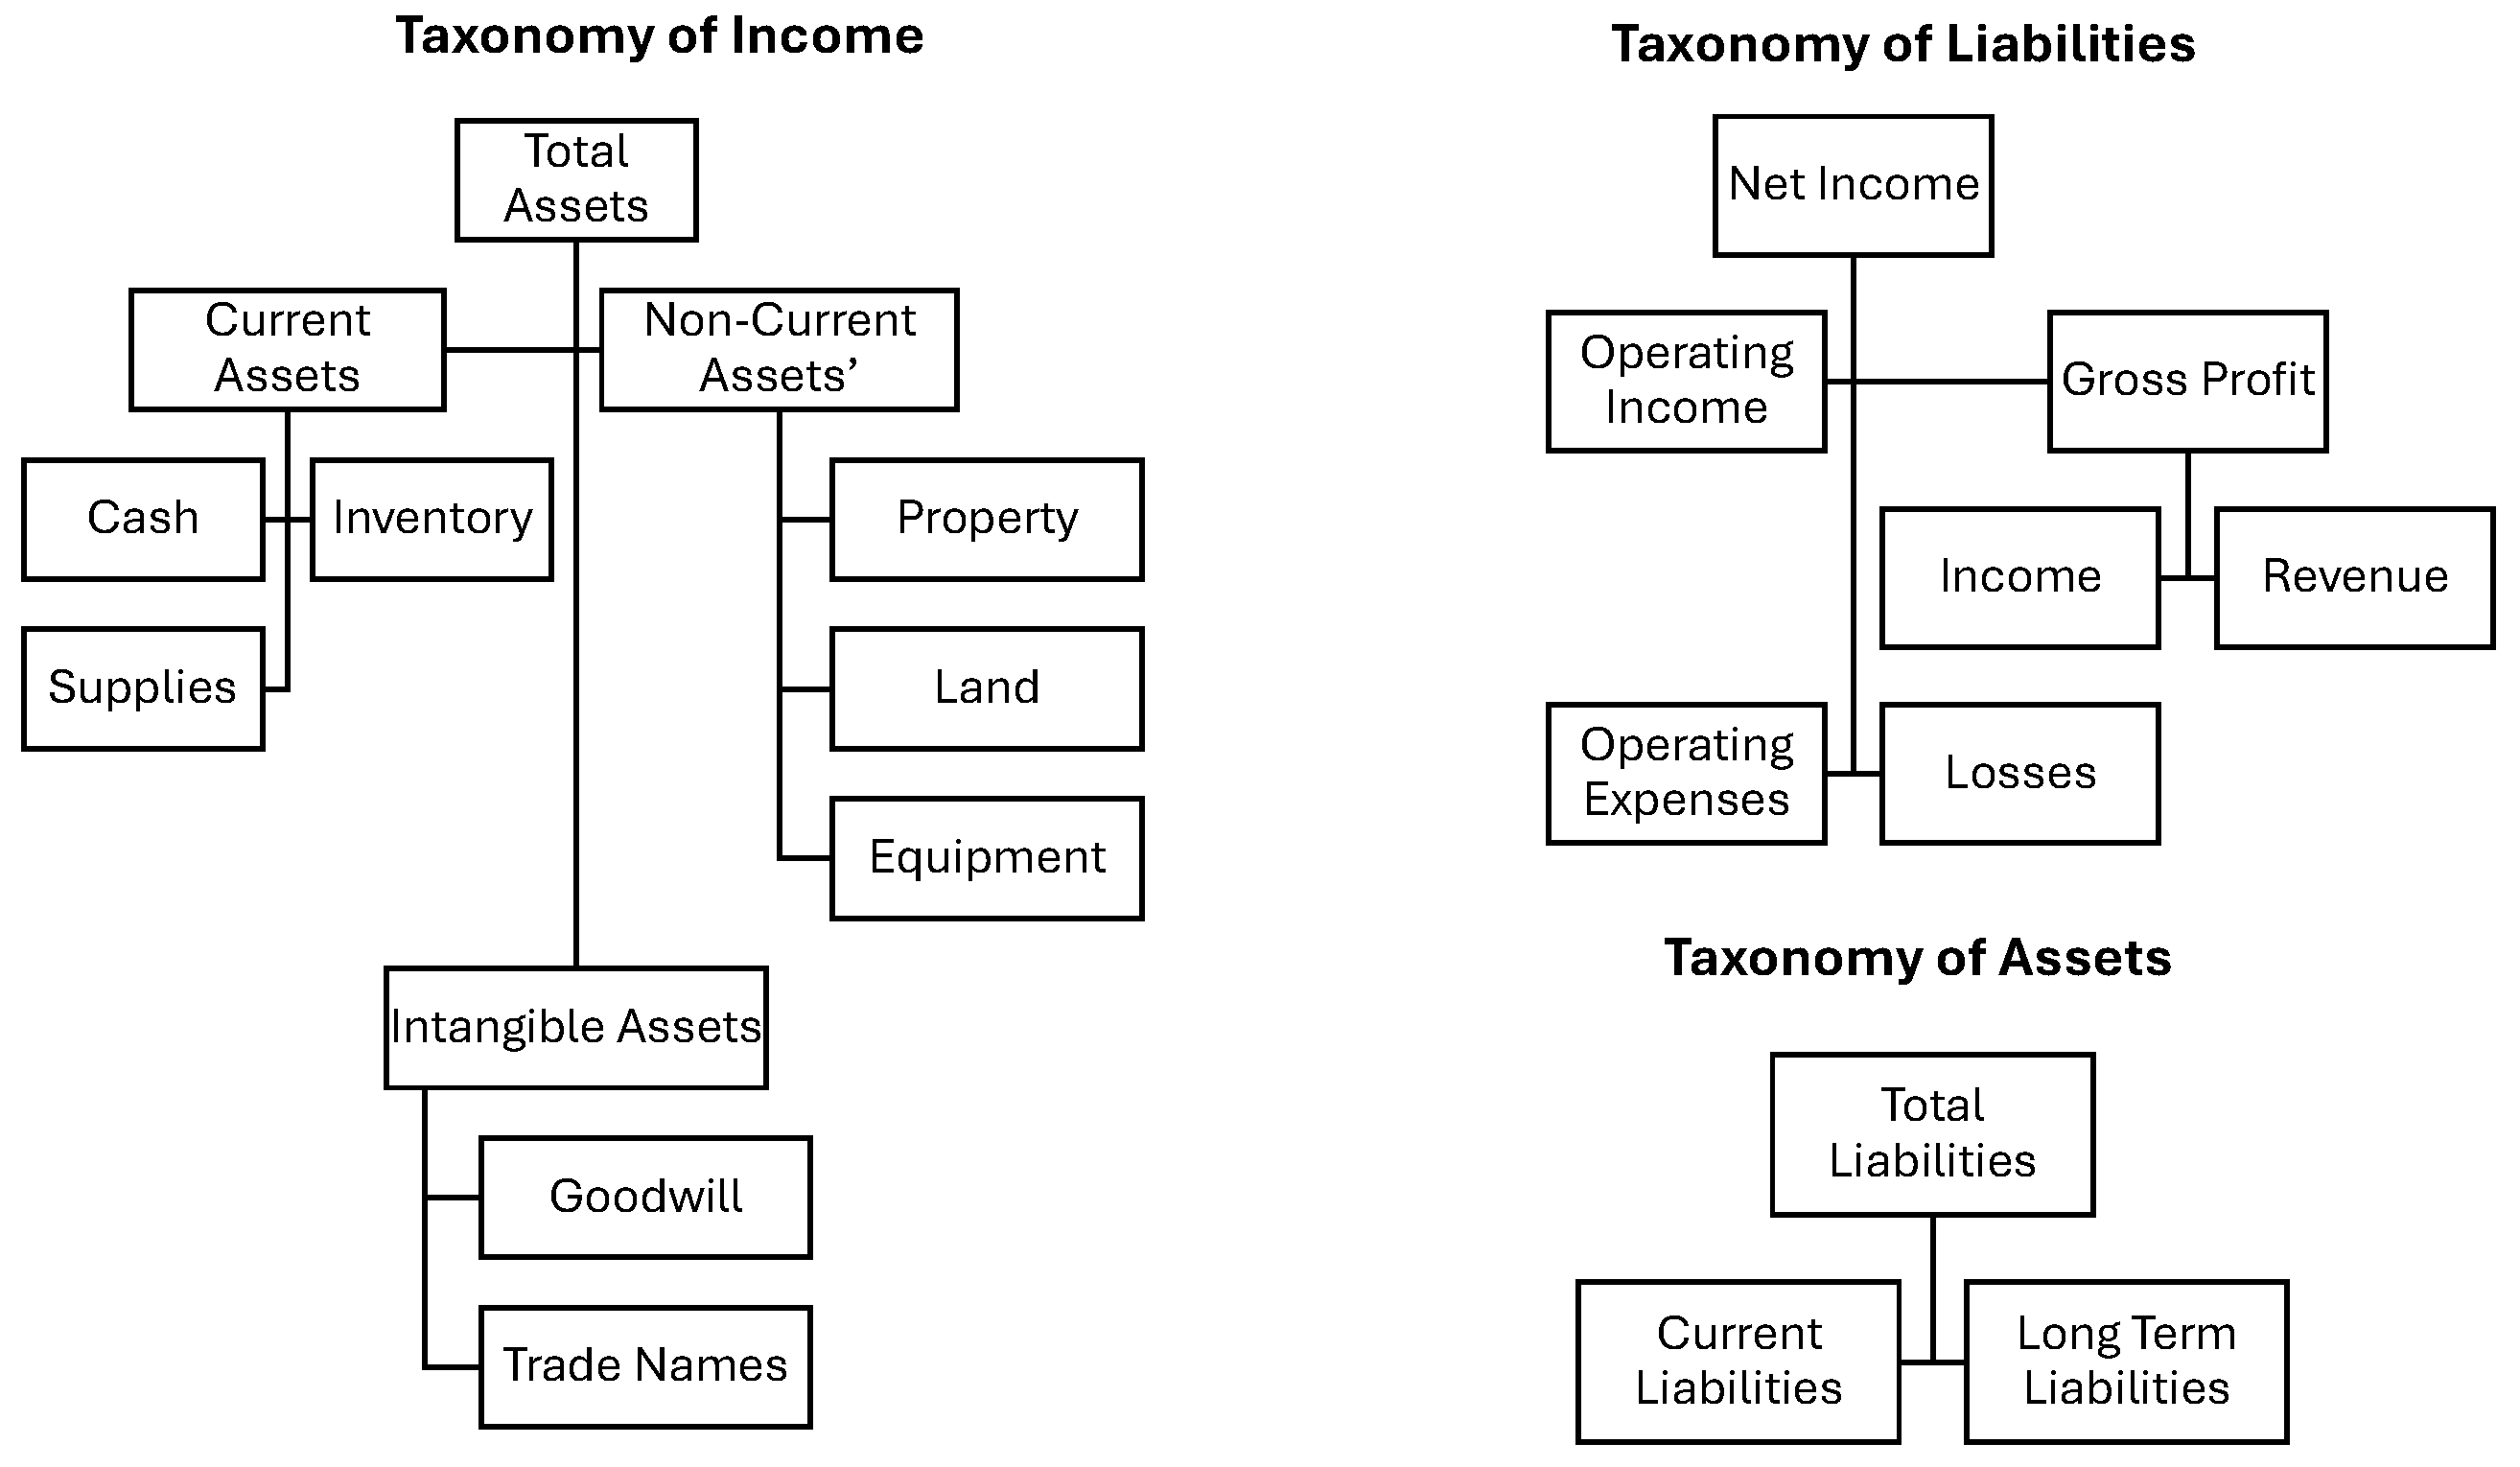
To create a taxonomy of financial concepts, we studied the structure of annual reports, balance sheets, and income statements, resulting in the identification of various financial concept entities. Examples of these entities include loss, operating profit, net sales, net profit, profit, earnings, operating loss, sales, net loss, pretax profit, cashflow, fair value, transaction, market share, diluted earnings, net interest, income, and total value. The taxonomy is illustrated in
Figure 2.
3.3. Temporal Information (TI)
Temporal information is represented in various forms, such as date, first quarter, last quarter, year, recent quarter, second quarter, third quarter, fourth quarter, consecutive quarter, quarters, and last quarter.
There are different types of relations between the three dimensions. They are as follows:
Relation Type 1a: The source node can be a ComE, and the destination can be a ConE. The edge represents the relation, such as “increase” or “decrease”.
Relation Type 1b: The source node can be a ComE, and the destination can be a TI (Temporal Node). The edge represents the ConE concatenated with its relation, for example, “profit increase in”.
Relation Type 2: The source node can be a ComE, and the destination can also be another ComE. The edge represents the relation, such as “acquire” or “owns”. This relation is referred to as a subset relation. The relation types are shown in
Figure 3.
The pre-processor is an essential initial step in the extraction of the knowledge graph components [
17,
33]. It consists of a sequence of steps, including the removal of URLs, hashtags, mentions, Twitter handles, emojis, smileys, stop-word removal, punctuation removal, lemmatization, and stemming.
3.4. Entity Extraction
The entity extraction process involves identifying various types of entities, including Commercial Entities (ComE), Concept Entities (ConE), time entities, ticker symbols, currencies, percentages, countries, and persons.
3.5. Extraction Using BERT Model
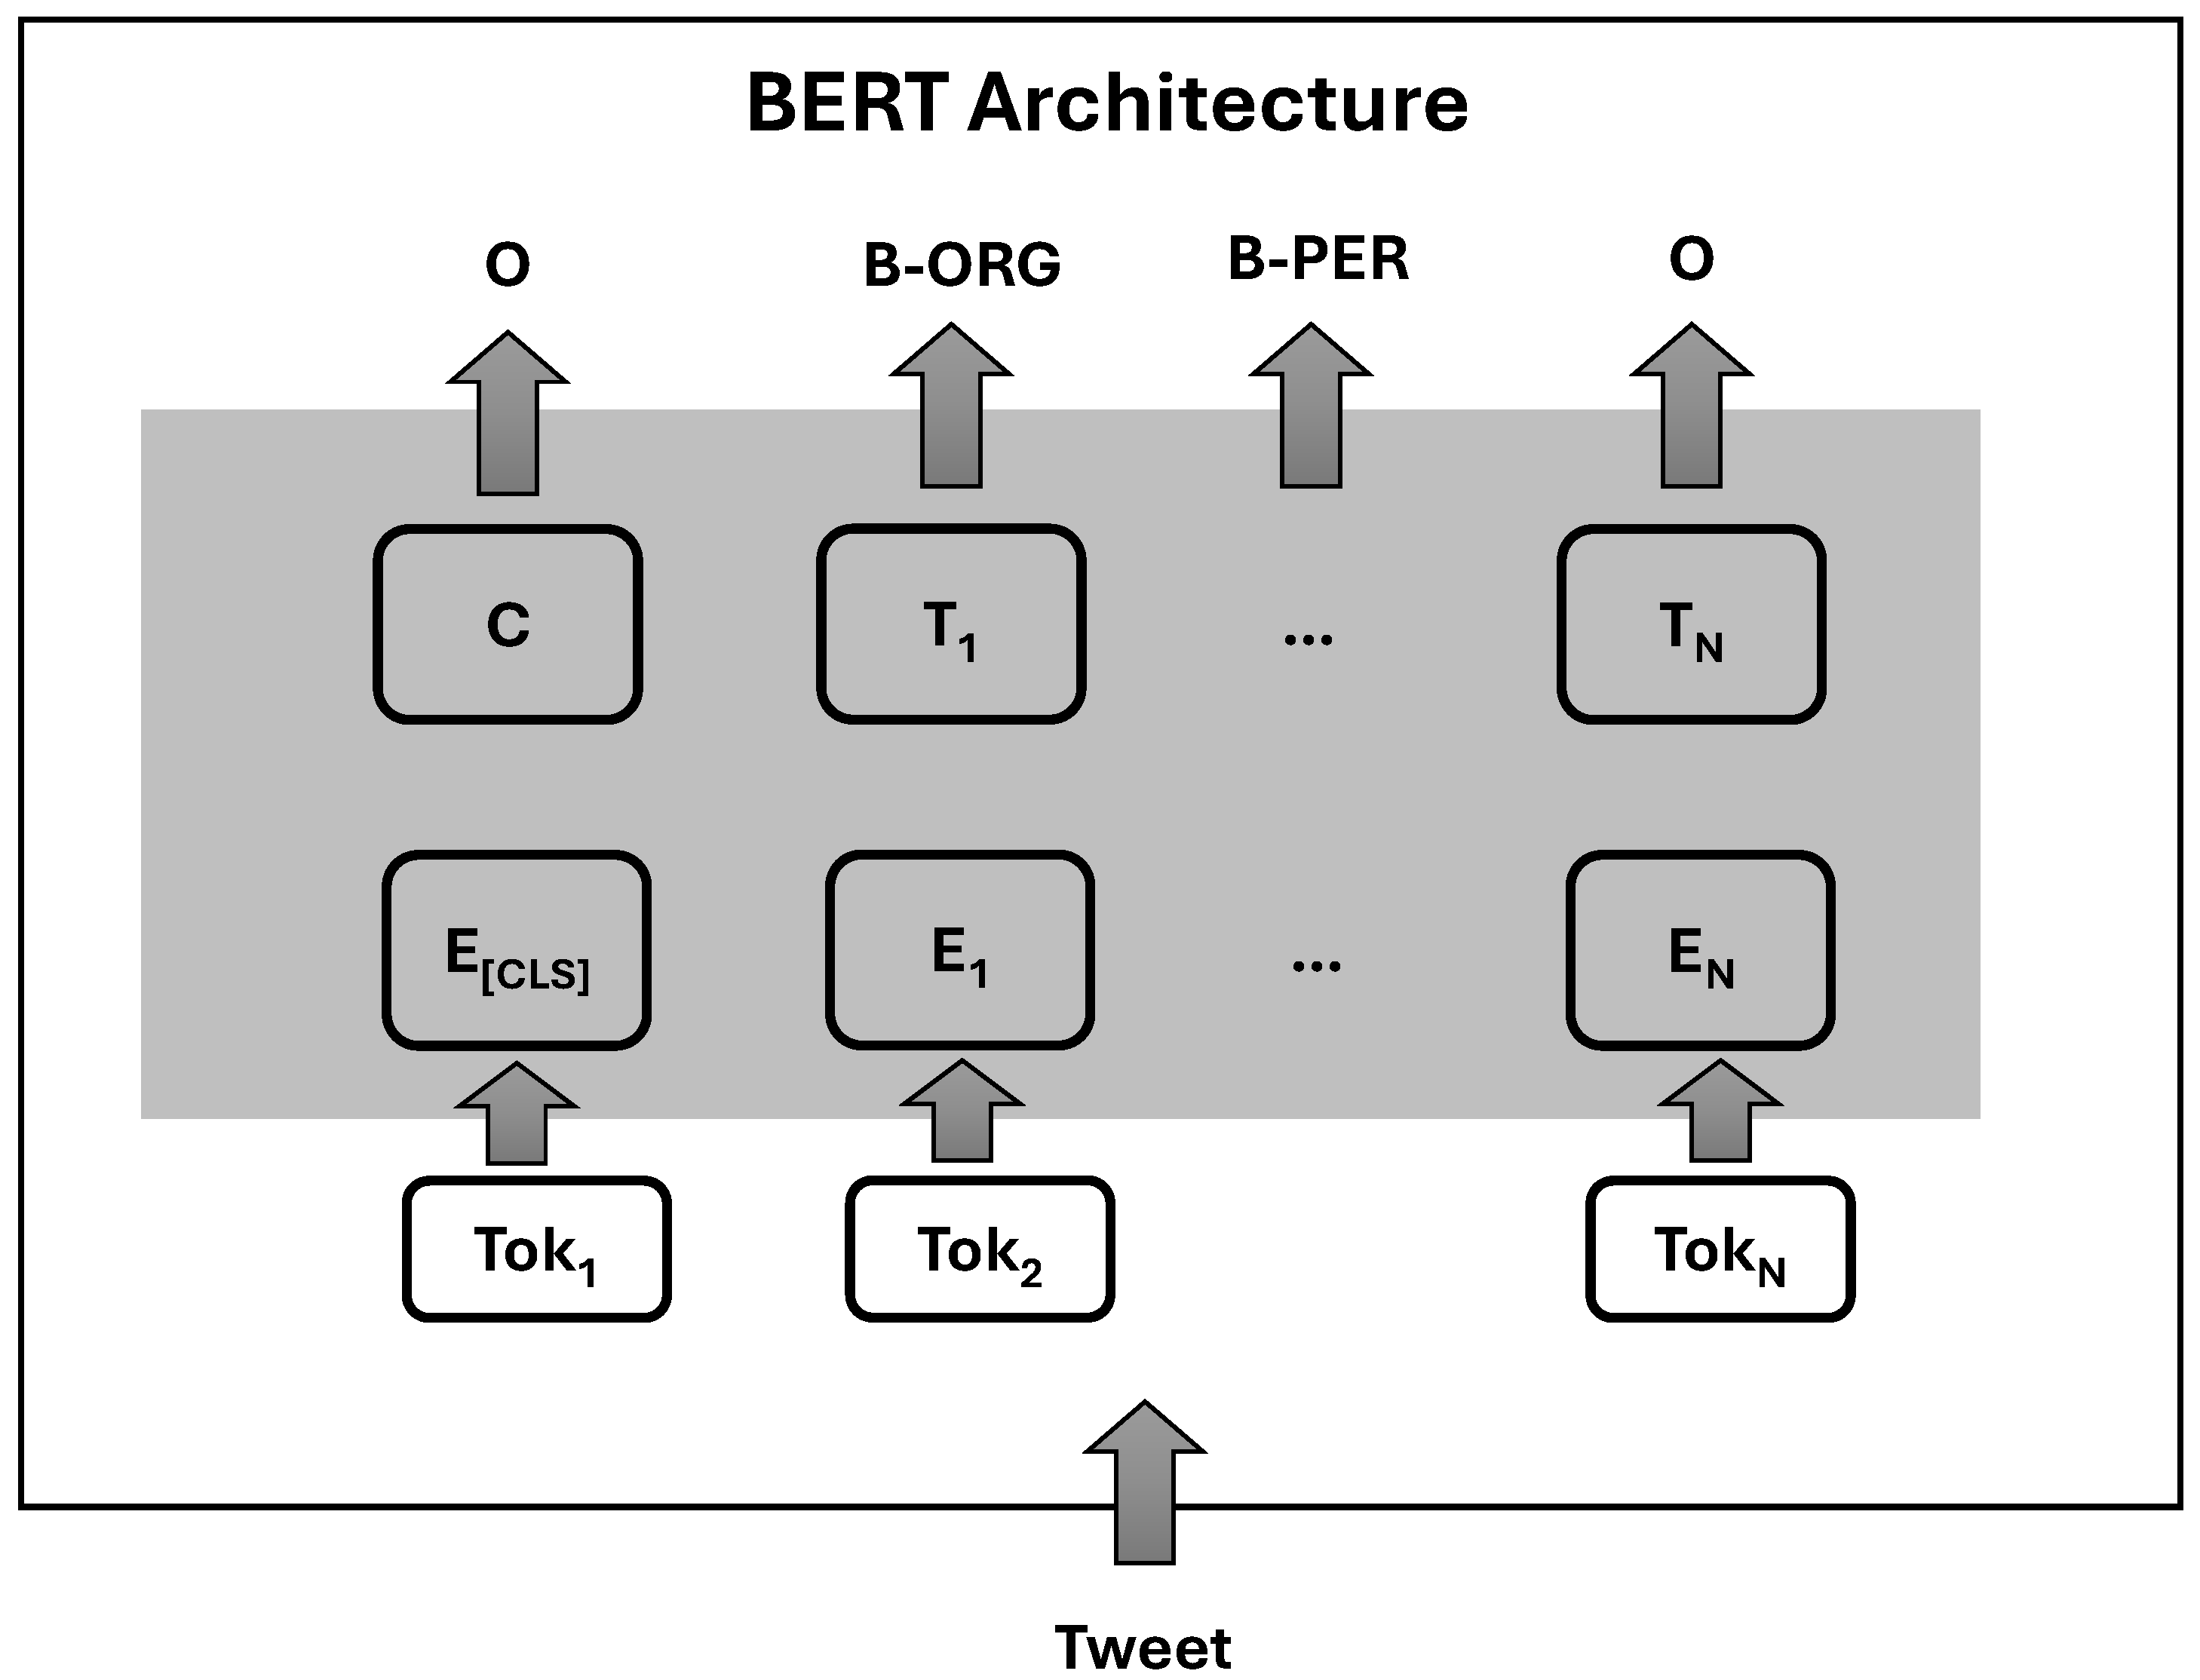
To extract entities from tweets, we utilize the BERT NER (Named Entity Recognition) model. The input to the model is the text from tweets, which is tokenized. The model classifies tokens into different entity types such as “DATE”, “PERCENT”, “ORG”, “CARDINAL”, “PERSON”, “NORP”, “GPE”, and “MONEY”. By analyzing the output of the model, we can identify Commercial Entities (ComE) from the entity type “ORG”. Additionally, ticker symbols of financial organizations are identified from the tweets using this approach.
Figure 4 illustrates the architecture of the BERT model applied for Named Entity Recognition (NER). The model processes a tweet as input, tokenizing the text into individual tokens (
,
, …,
). Each token is fed into BERT, which generates embeddings (E(CLS),
, …,
) for each token. The output of BERT is then passed to classification layers that assign tags to each token, identifying named entities such as organizations (B-ORG), persons (B-PER), and non-entity tokens (O). This structure allows the model to effectively classify and recognize named entities within the unstructured textual data of the tweet. The following are the steps:
Input: A tokenized sequence (e.g., a tweet),
where
represents each token.
Embeddings: For each token
, the embedding is as follows:
BERT Encoding: BERT processes the embeddings through self-attention, producing contextual embeddings:
Self-Attention: The self-attention mechanism calculates relationships between tokens:
NER Classification: For each token
, BERT applies a linear layer:
Softmax: The logits
are transformed into class probabilities:
Output: The model predicts the entity label for each token
, selecting the class with the highest probability:
3.6. Extraction of Concept Entities
Concept Entities (ConE) are domain-specific in nature. In the case of tweets, we leverage financial reports such as income statements, balance sheets, and cash flow statements to identify a taxonomy of financial concepts, as illustrated in
Figure 2. Pre-defined concepts from this taxonomy are then identified as Concept Entities (ConE).
This entity extraction pipeline can be applied to new domains by defining a relevant taxonomy and creating a list of pre-defined concept entities. This flexibility enables the FintechKG Extraction pipeline to accurately identify concepts and construct the knowledge graph for different domains.
3.7. Extraction of Temporal Entities
Temporal entities are extracted in the form of dates, months, weekdays, years, and quarters. We also perform extrapolation based on time by converting references to time, such as “last quarter”, “previous quarter”, “last year”, “yesterday”, and “last year”, to the corresponding time entity derived from the current timestamp of the tweet.
Tweets often contain informal representations of text, including currencies and percentages. To accurately extract currency values, we employ a custom Currency Extractor that matches informal representations of currencies and retrieves more precise currency values. For example, “3.9 mn” and “12.1 mln” both refer to “million”. Similarly, a Percentage Extractor matches informal representations of percentages in tweets, such as “14 percent increase in operating profit”.
3.8. Relation Extractor
The relation extraction process involves identifying relations between entities in the knowledge graph.
The first step is a rule-based approach using the Spacy NLP pipeline. The pipeline includes various components like tokenizer, tagger, parser, ner, etc., and enables POS tagging and dependency parsing. By defining rules to match the structure of the sentence, we can extract the “ROOT”, “PREP”, and “ADJ” components from the sentence structure. These components are used to generate a list of relations. The frequency of these relations is calculated, and the top-N relations, representative of the domain, are selected.
For the financial tweet dataset, some of the pre-defined relations identified are increase, decrease, plan, develop, report, start, grow, sell, acquire, expand, own, announce, sign, agree, issue, and fell.
The second step involves using BERT to perform similarity matching of new relations with the pre-defined set of relations obtained from the rule-based approach. By obtaining the relation embeddings from the BERT model and applying mean pooling, we create a single vector encoding for the sentence embedding. We calculate the cosine similarity between the new relation and the pre-defined relations. If the similarity score exceeds a threshold, we replace the new relation with the corresponding relation from the pre-defined set. This ensures consistency and avoids redundancies in the representation of relations in the knowledge graph.
3.9. Knowledge Extractor
The Financial Growth Extractor module focuses on extracting relations related to financial growth, such as “Increase”, “Decrease”, “Rose to”, “Totalled”, “Fell”, “Jumped”, and “Dropped To”. This module aims to identify instances where there is a change or movement in financial indicators.
Table 1 presents a sample of the extraction process. In the first example, the Commercial Entity extracted is “Orion Pharma”, the Concept Entity is “Operating Profit”, and the relation is “increase”. The date “2004” and the percentage “42.5%” are also extracted and populated in the FintechKG.
The Financial Market Development Extractor identifies relations related to market development activities, including “Plan”, “Develop”, “Reported”, “Start”, “Grow”, “Sell”, “Includes”, “Published”, “Sold”, “Won”, “Issued”, “Proposed”, “Declined By”, and “Forecasts”. This module can capture various market-related events and actions such as a company’s sales growth or plans to enter new markets.
The Acquisition Extractor focuses on extracting relations related to acquisitions, including “Acquire”, “Expand”, “Rose to”, “Own”, “Announced”, “Signed”, and “Bought”. This module aims to identify instances where a company acquires or expands its ownership of another entity, such as acquiring shares or announcing a new acquisition.
The Financial Contract Extractor extracts relations related to financial contracts, including “Contracted”, “Awarded”, “Sign”, and "Agree”. This module can identify instances where financial agreements, contracts, or awards are mentioned, such as signing a contract or being awarded a financial agreement.
These modules play a crucial role in extracting relevant information from financial tweets and populating the FintechKG with accurate and structured data, enabling a comprehensive understanding of financial events, trends, and relationships.
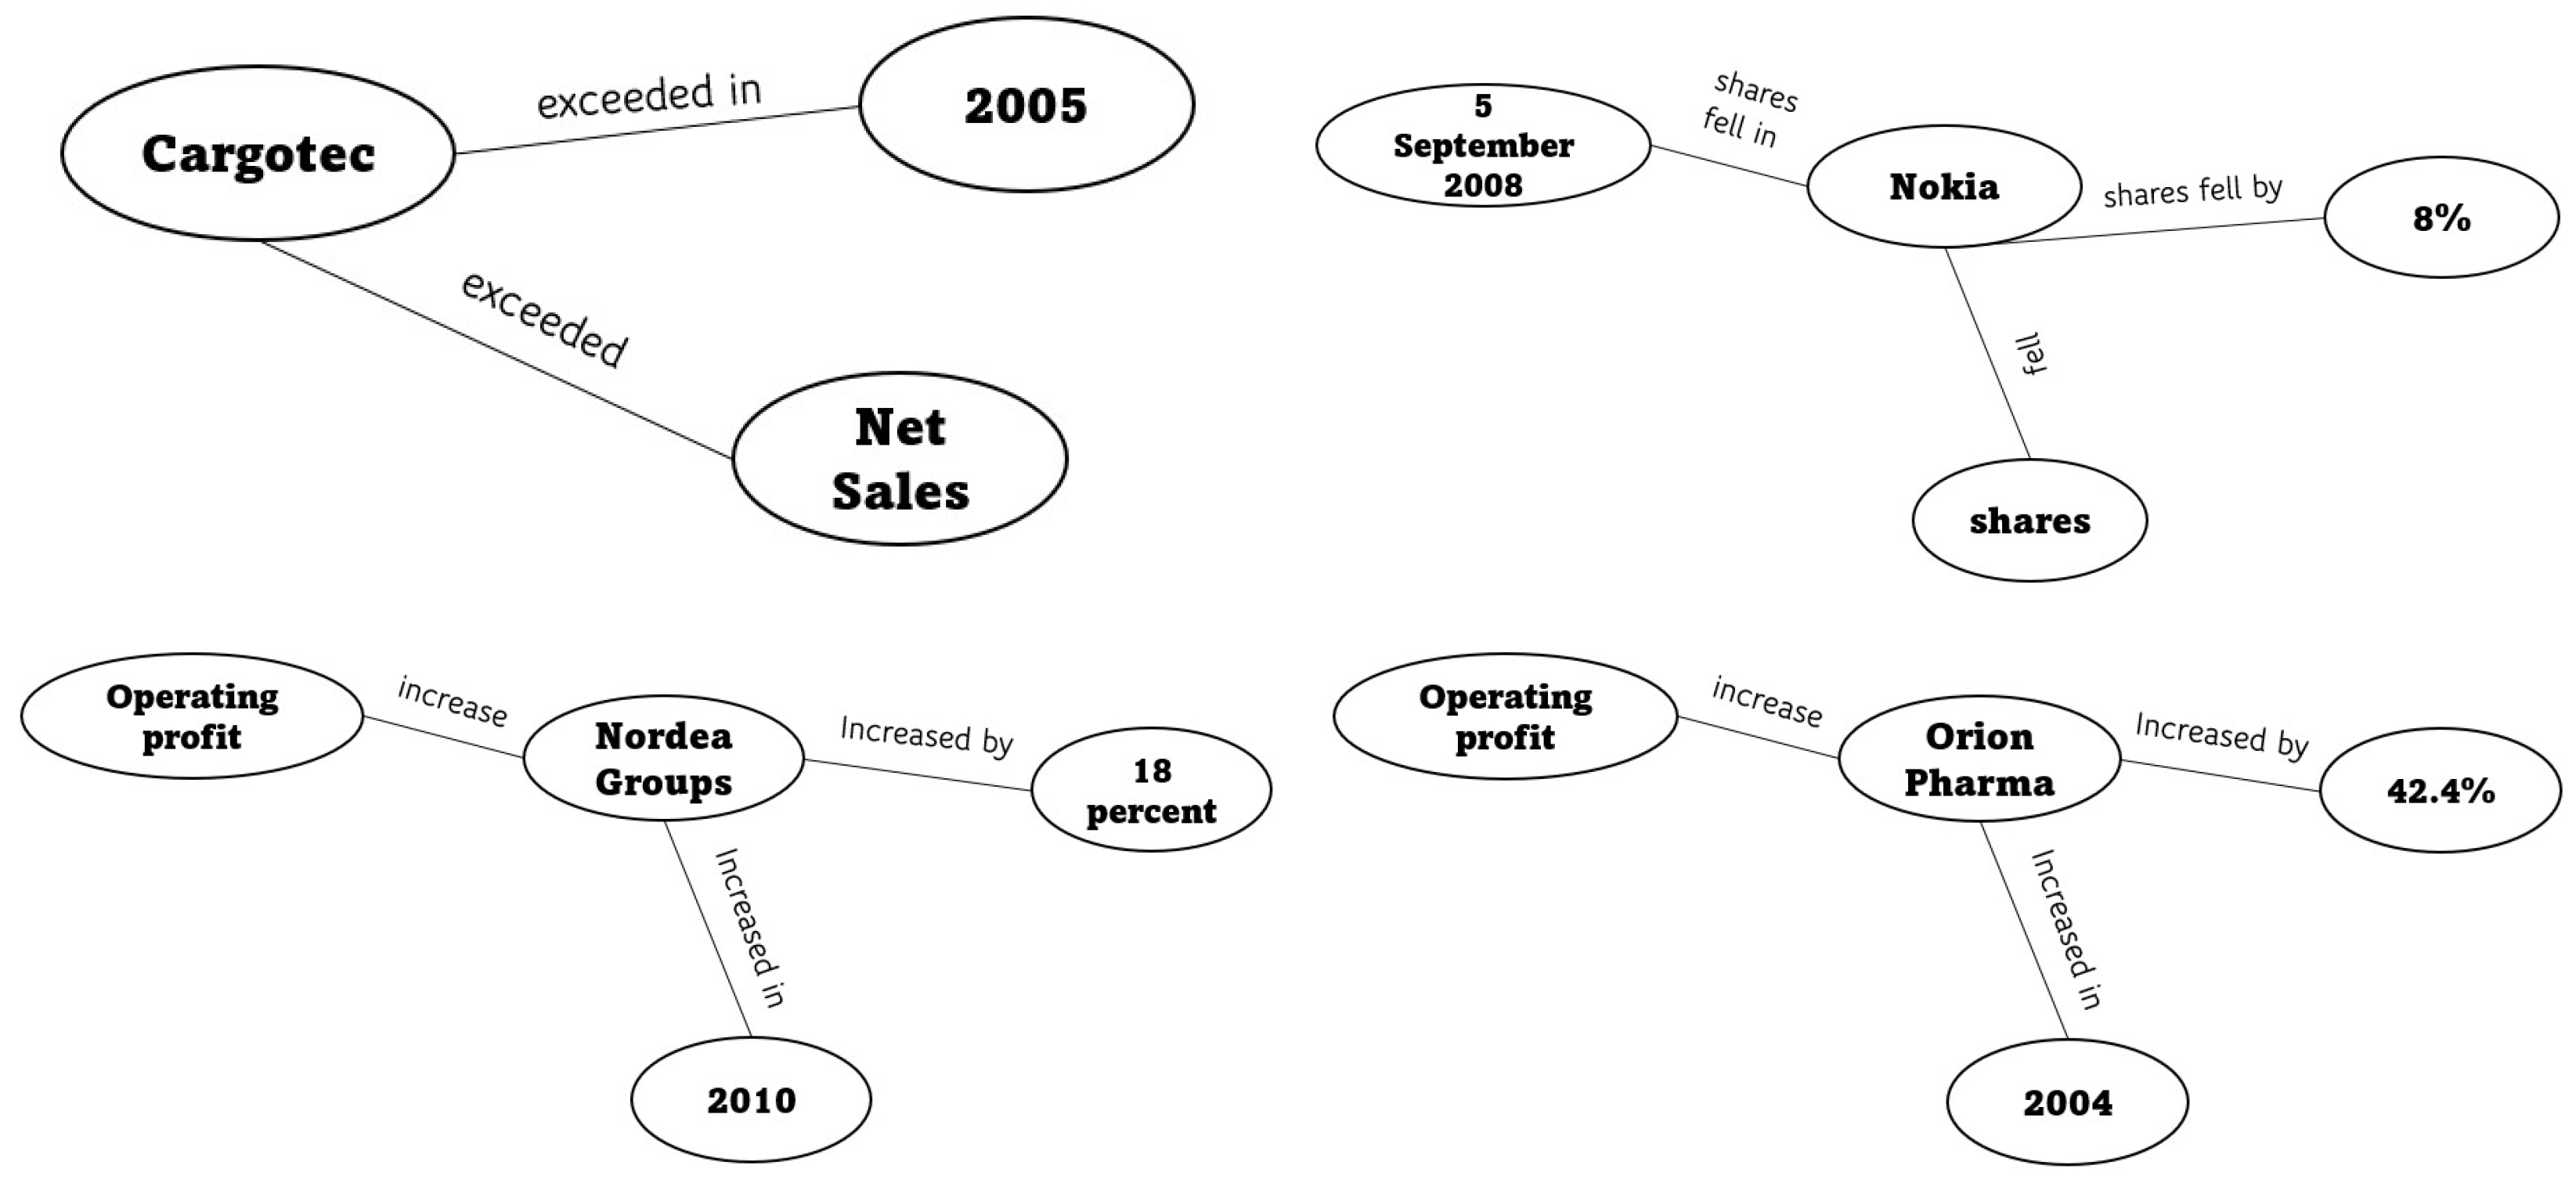
Figure 5 represents a knowledge graph generated from the information extracted from tweets. It shows relationships between various financial entities and events over time. For instance, Cargotec’s net sales exceeded EUR 2.3 billion in 2005, and on 5 September 2008, Nokia’s American Depositary shares fell by 8%. Orion Pharma’s operating profit increased by 42.5% in 2004, and Nordea Group’s operating profit increased by 18% in 2010. The knowledge graph links these financial entities (e.g., Cargotec, Nokia, Orion Pharma, Nordea Group) with relevant actions or events (e.g., exceeded, shares fell, increased), showcasing a structured representation of financial data extracted from textual sources.
4. Temporal Relational Model
4.1. RGCN Model for Multiple Timesteps
In our methodology, a Relational Graph Convolutional Network (RGCN) model [
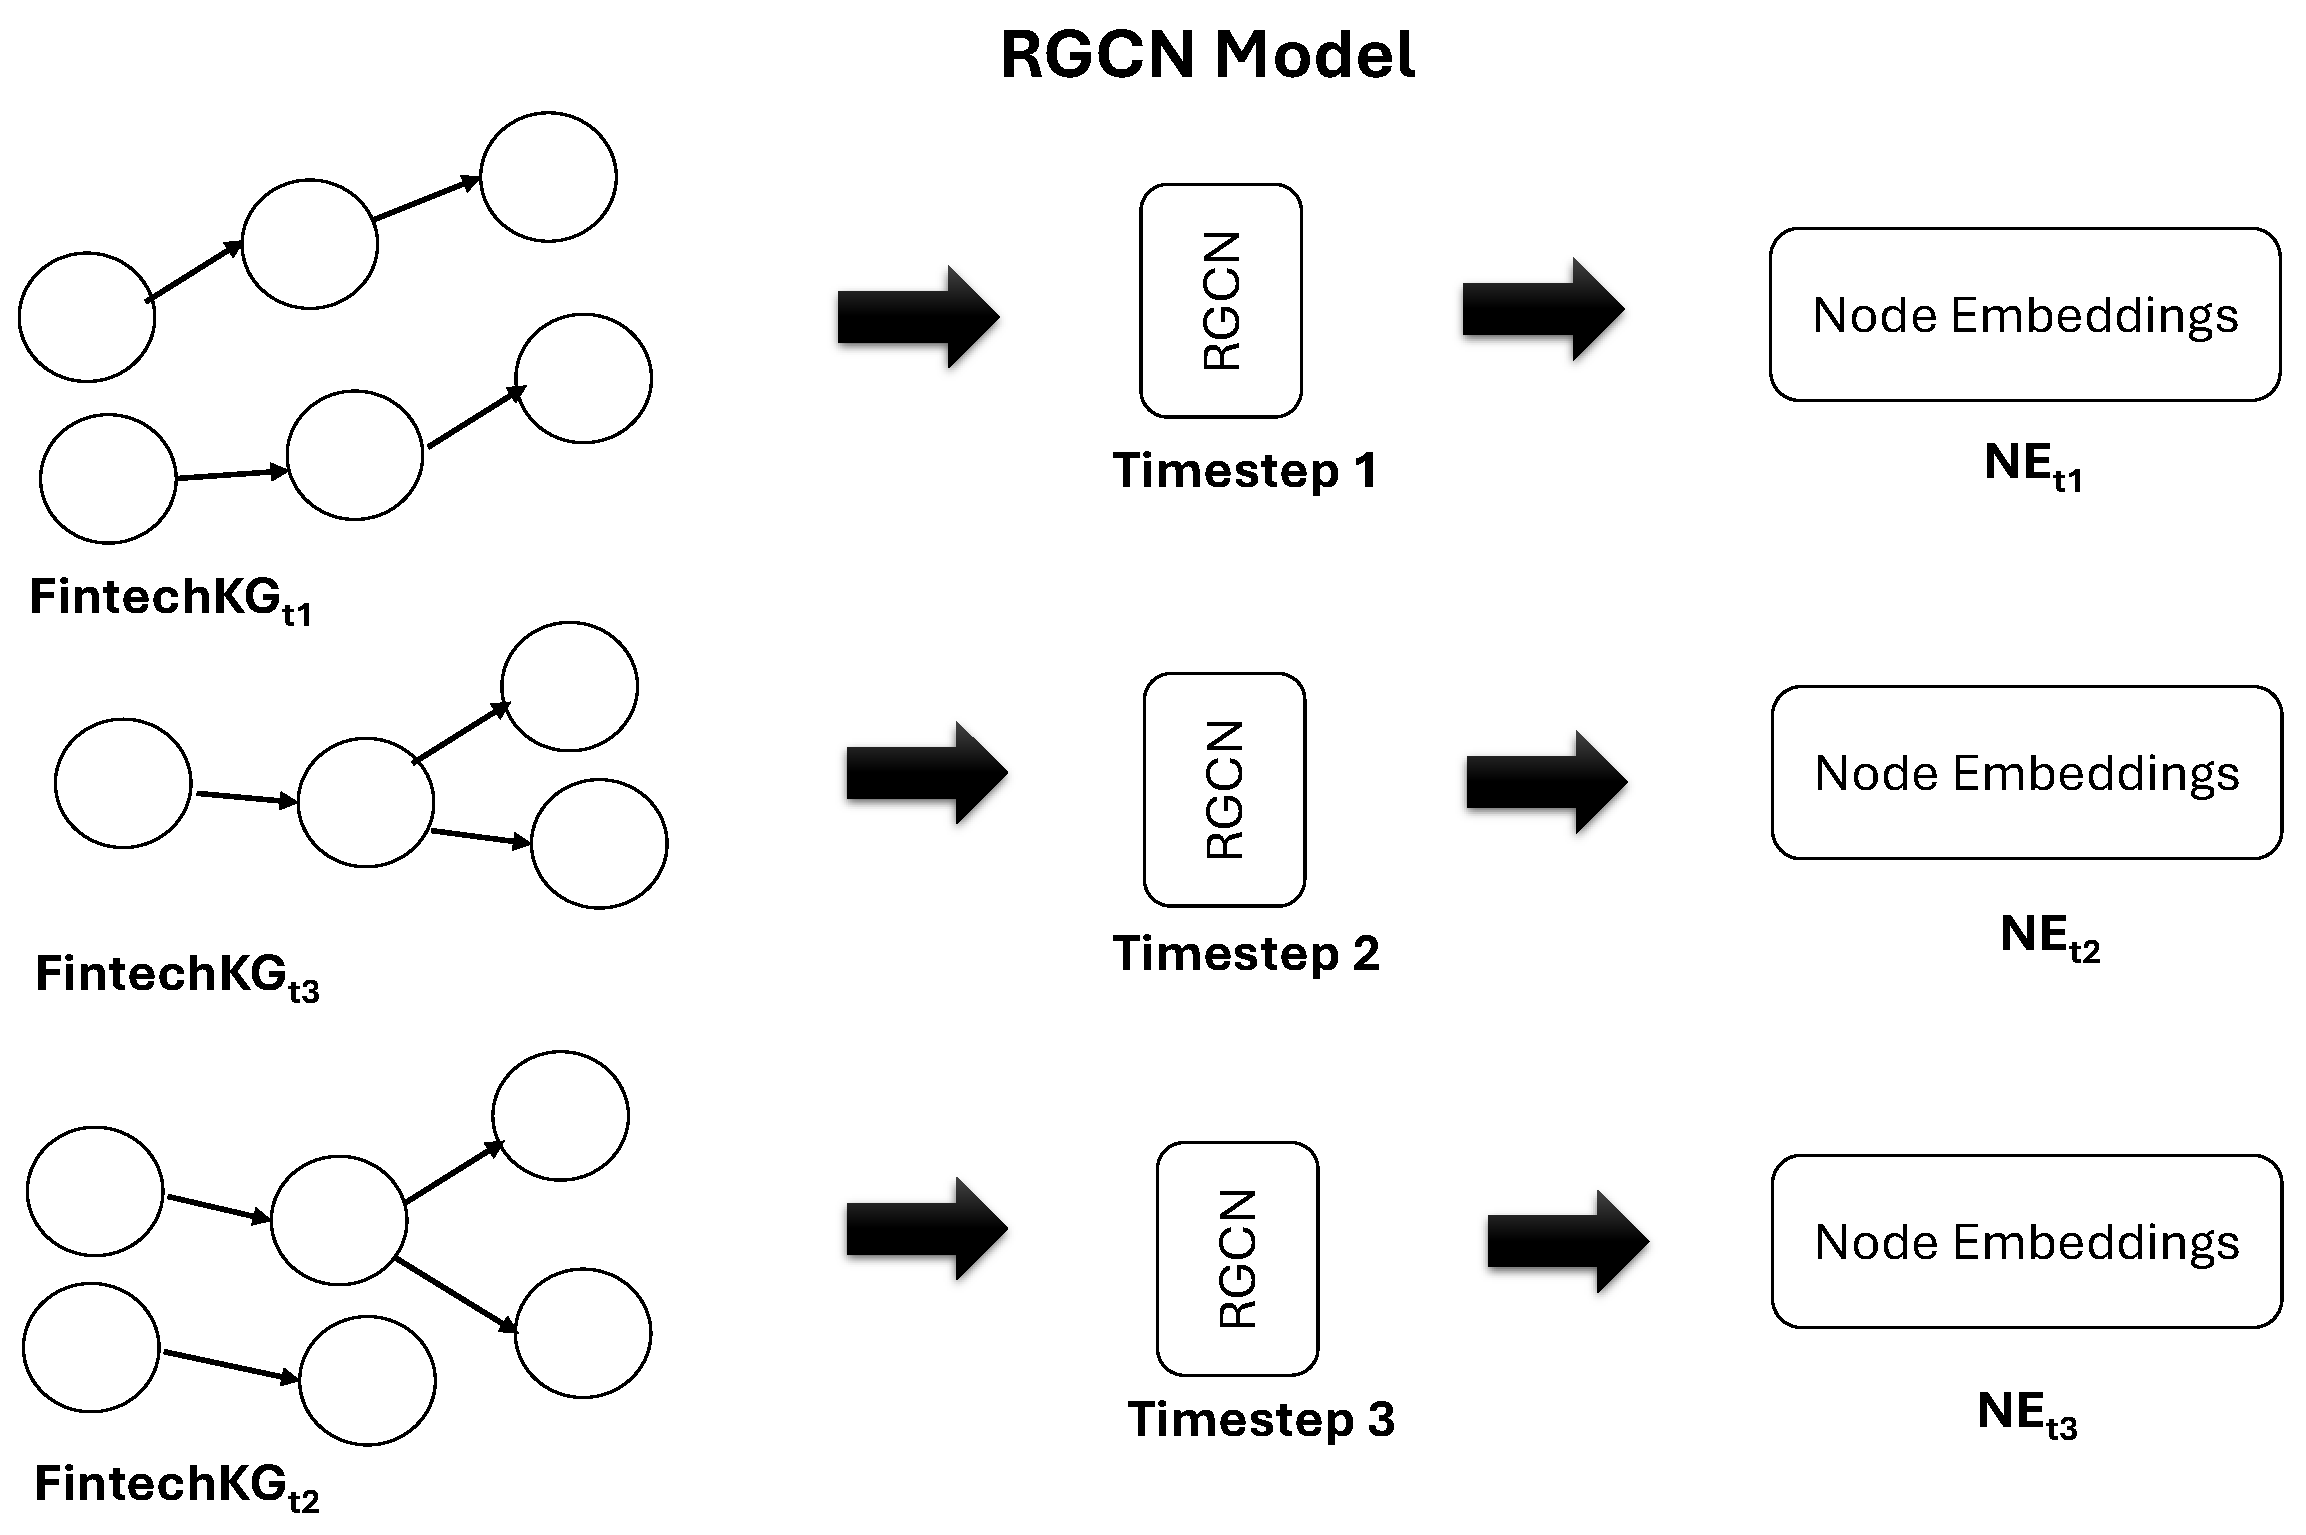
27] is used. The constructed FintechKG is passed into the RGCN model at different timesteps. The RGCN model plays an important role in capturing the complex relationships between entities in the knowledge graph. It is illustrated in
Figure 6.
The RGCN model is specifically designed to handle graph-structured data. Using FintechKG graph data, nodes represent commercial entities, and edges represent relations extracted from financial tweets, such as increase, decrease, sell, and acquire. Therefore, we can effectively capture the relational dependencies between commercial entities and exploit the contextual information encoded in the graph structure, which helps to improve the accuracy of financial performance predictions. The above RGCN model is designed to capture temporal information by considering graph data at three different time steps.
Architecture
The RGCN (Relational Graph Convolutional Network) model takes graph data with node features and edge features at three time steps and applies graph convolutions to learn node representations that incorporate temporal information. The model then uses these representations to make predictions on relations. Given a graph with node features and edge features at three time steps, the RGCN model can be mathematically formulated as follows:
Source Nodes (Commercial Entities): each commercial entity node is associated with a node feature vector . Destination Nodes (Concept Entities): each concept entity node is associated with a node feature vector .
Edge Labels (Relations): each edge (between a source and destination) is associated with an edge feature vector e that represents the relation between the commercial entity and concept entity.
The relational convolution operation updates the node representations based on the source nodes, edge labels, and destination nodes.
The update rule for the source node
s connected to the destination node
d through edge
e is given by:
represents the set of destination nodes connected to source node s through relation r.
and are relation-specific weight matrices for the source node and edge, respectively.
⊕ denotes concatenation.
is an activation function, such as ReLU or sigmoid, applied element-wise.
Stacked Convolutional Layers:
The RGCN typically consists of multiple stacked relational convolutional layers. Each layer refines the node representations by incorporating information from different levels of relational connections.
The update rule for the source node
s in the (
)th layer is given by:
where
denotes the destination node representation in the
l-th layer.
After the convolutional layers, a readout function is applied to aggregate the final node representations into a fixed-length graph representation. This graph representation can then be used for predicting the relations between commercial entities and concept entities.
The prediction for the relation between source node
s and destination node
d is given by the following:
where
L is the number of convolutional layers
The node features at various timesteps are passed through an LSTM to further predict the performance of the entities.
The FinBERT [
38] embeddings extracted from the FinBERT model are concatenated with the knowledge graph embeddings in different ways. Using the embeddings generated by the RGCN model, three variations are explored: RGCN Type 1, RGCN Type 2, and RGCN Type 3, each employing different embedding configurations.
In RGCN Type 1, the concatenation of FinBERT embeddings, source embeddings, relation embeddings, and destination embeddings obtained from the RGCN results in a combined embedding size of 1168. This configuration integrates both textual and graph-based information, allowing for a more comprehensive representation.
Similarly, RGCN Type 2 follows a similar approach by concatenating the FinBERT embeddings with the RGCN embeddings. However, in this case, the total embedding size is reduced to 1068, providing a more compact representation.
In RGCN Type 3, the embedding representation is simplified through the dot product of the source embedding, relation embedding, and destination embedding from the RGCN. This simplification yields a total embedding size of 868.
By incorporating the FinBERT [
38] embeddings with the RGCN embeddings in these different configurations, the aim is to leverage both textual knowledge and relational information encoded in the knowledge graph. This integration enhances the accuracy of financial entity performance predictions.
4.2. Architecture of LSTM Model
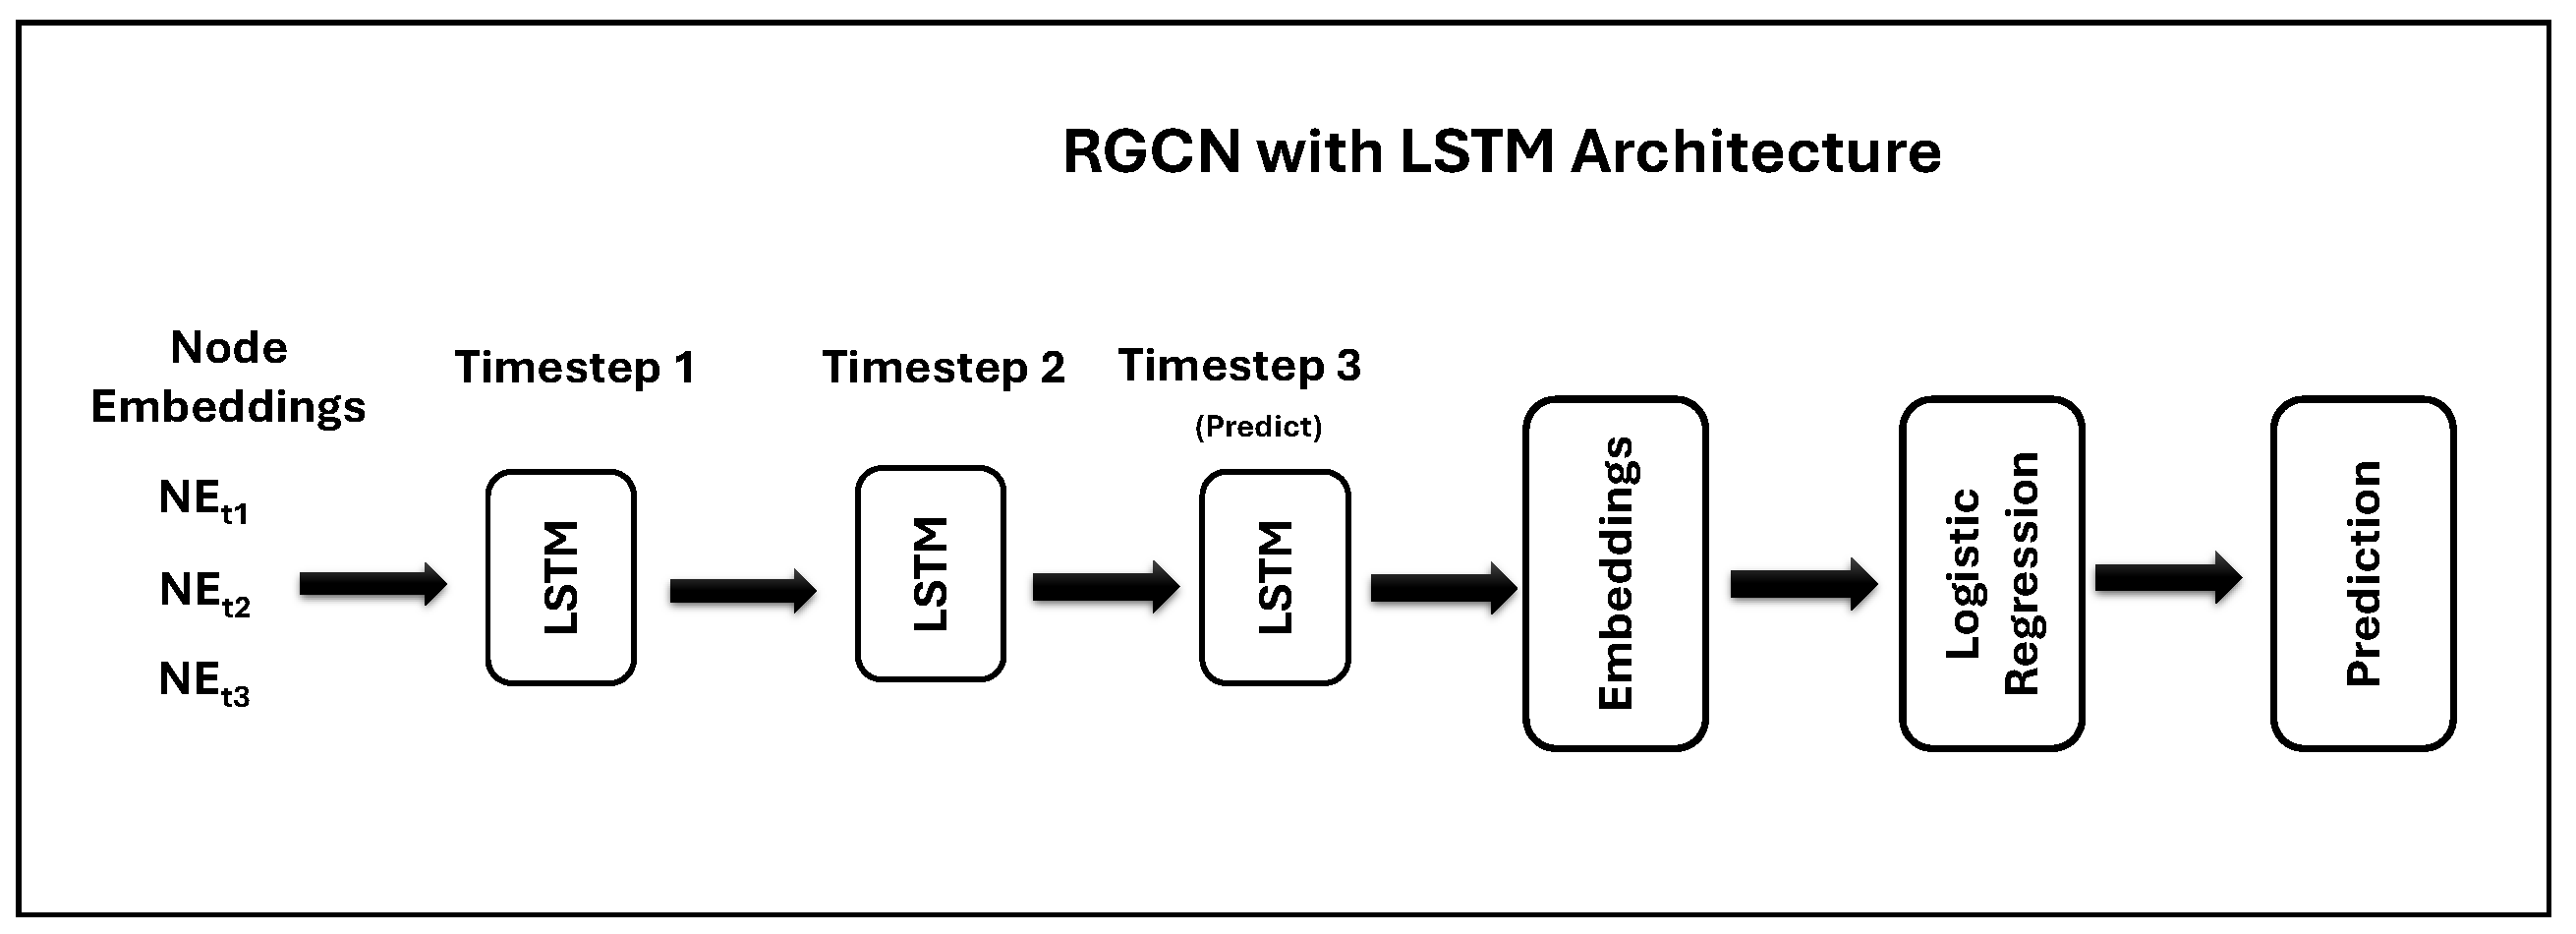
Our LSTM model introduces an approach to financial entity performance prediction by intricately combining RGCN embeddings with temporal pattern recognition. The LSTM architecture is specifically designed to process sequences of RGCN embeddings (NEt1, NEt2, and NEt3), corresponding to distinct quarterly financial periods, to capture the temporal dependencies critical for understanding market trends and entity behavior over time. This temporal granularity, aligned with the financial quarters, allows our model to account for seasonal fluctuations and other time-sensitive factors affecting financial performance.
By integrating RGCN embeddings, which encapsulate the relational dynamics within the financial knowledge graph, our LSTM model leverages both the spatial structure and temporal evolution of financial entities. This dual-focus architecture marks a significant advancement over traditional models that either neglect the temporal aspect or fail to incorporate complex inter-entity relationships.
The LSTM (Long Short-Term Memory) model consists of an LSTM layer followed by a fully connected layer for prediction. The LSTM model is designed to process sequences of RGCN embeddings and make predictions based on the learned temporal patterns. The LSTM layer takes input sequences of RGCN embeddings and captures the temporal dependencies within the sequence. The hidden state at the last time step is then passed through the fully connected layer to generate the final predictions.
The LSTM model architecture for predicting the performance of financial entities based on the embeddings from RGCN at timestep 1, timestep 2, and timestep 3 (NEt1, NEt2, and NEt3) are shown in
Figure 7. The data are split into three time frames. NEt1 corresponds to tweets from Jan to Apr, NEt2 corresponds to May-Aug, and NEt3 corresponds to Sept-Dec. The update step of the LSTM performs the LSTM Cell Updates. At timestep
t, the LSTM cell update formulas are as follows:
In the above formulas, represents the previous hidden state (output) of the LSTM cell, represents the input at timestep t, which includes the embeddings NEt1, NEt2, and NEt3 for a single financial entity, are the weight matrices for the input, forget, candidate, and output gates, respectively, are the bias vectors for the input, forget, candidate, and output gates, respectively, represents the sigmoid activation function and tanh represents the hyperbolic tangent activation function.
The LSTM model architecture includes the LSTM layers and an output layer. The input sequence (embeddings at timestep1) is passed through the LSTM layers, and the final hidden state is fed into the output layer for performance prediction.
5. Experiment Setup
The tweets dataset (
https://www.kaggle.com/datasets/omermetinn/tweets-about-the-top-companies-from-2015-to-2020?select=Tweet.csv, accessed on 1 September 2024) contains over 3 million unique tweets and includes the following information for each tweet: Tweet ID, Author, Post Date, Text Body, Number of Comments, Likes, Retweets for the year 2015 to 2020. The tweets are related to five major companies: Amazon, Apple, Google, Microsoft, and Tesla, and each tweet is matched with the appropriate share ticker of the respective company. We have used tweets for the year 2016 and 2018 for our experiments. The sample tweets are shown in
Table 2.
For the Named Entity Recognition (NER) task, the BERT model “dslim/bert-large-NER” is used to identify entities. For the Relation Graph Convolutional Network (RGCN) model, the FintechKG extraction pipeline is employed to generate triplets for the data from tweets in Dataset 3, specifically for the year 2016. These triplets, in the form of (source, relation, destination), are used as input to train the RGCN model for relation prediction. The RGCN model is trained with hyperparameters, such as a graph-split-size of 0.5, epoch of 30, dropout rate of 0.2, regularization of , and a gradient norm of 1. The learning rate is set to . The RGCN model is trained using data representing three timesteps.
The LSTM model used in the experiment consists of three layers. The first two layers correspond to the RGCN embeddings for timestep 1 and 2, respectively, while the third layer corresponds to the RGCN embedding for timestep 3. The data are split into three time frames. Timestep 1 corresponds to tweets from Jan to Apr, Timestep 2 corresponds to May-Aug, and Timestep 3 corresponds to Sept-Dec.
The LSTM embeddings obtained from the trained model for each entity are then passed to a logistic regression model to make a prediction of the financial performance of the entity. Two types of embeddings: LSTM Type 1 and LSTM Type 2 are used by the regression model as shown in
Table 3.
Additionally, logistic regression models are trained using both FinBERT embeddings [
38] and RGCN embeddings. Four types of inputs are used for the logistic regression model, as indicated in
Table 3. The FinBERT embeddings are obtained by passing the tweet as input to the FinBERT model, resulting in embeddings of size 768. The RGCN embeddings are obtained by passing the triplets (s, r, o) as input to train the RGCN model. From the trained model, the entity embedding is retrieved with a size of 100, and the relation embedding is also retrieved with a size of 100.
The hybrid embeddings used by the logistic regression model to perform financial prediction are shown in
Table 4. To effectively combine RGCN and FinBERT embeddings for prediction, FintechKG employs a projection layer that maps both embeddings into a shared latent space. This allows the model to leverage the strengths of both information sources for improved performance. The two projection techniques used are the following:
Linear Projection: A simple linear transformation projects both embeddings into a common space. This is computationally efficient but may not capture complex relationships between the features.
Non-linear Projection: Techniques like autoencoders or multi-layer perceptrons (MLPs) can learn a more complex non-linear mapping for better representation alignment, potentially improving prediction accuracy.
The prediction problem involves performing financial performance prediction for companies using data from our dataset (
https://www.kaggle.com/datasets/omermetinn/tweets-about-the-top-companies-from-2015-to-2020?select=Tweet.csv, accessed on 1 September 2024) from the year 2016 and predicting their financial performance for the subsequent year, 2017 and using data from the year 2018 and predicting their financial performance for the subsequent year, 2019. The companies of interest for the prediction are AAPL (Apple Inc.), GOOG (Google Inc.), GOOGL (Google Inc.), AMZN (Amazon.com), TSLA (Tesla Inc.), and MSFT (Microsoft Corporation).
We are using evaluation metrics such as overall accuracy, refers to the proportion of correct predictions (both true positives and true negatives) among all predictions, F1 Score, the harmonic mean of precision and recall and Macro Avg (Precision, Recall, F1 Score), the average precision, recall, or F1 score across all classes, treating each class equally.
6. Results
The Fintech knowledge graph (FintechKG) statistics for the year 2016, shown in
Table 5, present a comprehensive overview of the dataset used for financial analysis. The dataset comprises 892,840 total rows, which indicates the volume of data collected. Within this dataset, there are 22,514 concept entities and 17,682 triplets, highlighting the rich relational information captured. Additionally, the dataset includes 2462 unique entities and 2177 unique relations, demonstrating its complexity and the diversity of financial concepts and relationships it encompasses.
Table 6 details the data used for training the Relational Graph Convolutional Network (RGCN) model. The training dataset consists of 10,682 data points, which provides a robust foundation for model training. To ensure the model’s performance is accurately assessed, the dataset also includes 3500 data points each for testing and validation. This division allows for thorough evaluation and fine-tuning of the model, ensuring its accuracy and reliability in predicting financial performance.
The robustness of the proposed approach was evaluated through a series of experiments. These included hyperparameter tuning, where key parameters such as learning rate, batch size, and number of epochs were varied to assess sensitivity. Additionally, graph embedding variations were tested, utilizing different Relational Graph Convolutional Network (RGCN) variants in combination with FinBERT embeddings. The results indicated stable model performance, with a standard deviation of 0.11–0.16%, demonstrating the robustness of the approach across different configurations.
The financial performance prediction results for 2016 and 2018, as shown in
Table 7 and
Table 8, highlight the effectiveness of different hybrid embeddings. In 2016, the FinBERT + Graph 1 achieved the highest accuracy, reaching 94.09% with 40 epochs and 94.62% with 60 epochs. This method also had the best F1 scores for predicting both decreases and increases in financial performance, showing its strong capability in handling financial data. Other methods like the FinBERT [
38] and FinBERT + Graph 3 combinations also performed well, with accuracies above 92%, but slightly lower than FinBERT + Graph 1.
For the 2018 results, the FinBERT + Graph 1 + Temporal 1 showed the highest overall accuracy at 95.01% and had the best F1 scores for predicting decreases (48.36%) and increases (97.38%). This indicates that FinBERT + Graph 1 + Temporal 1 is very good at analyzing financial data and predicting performance changes. The FinBERT + Temporal 1 configuration also demonstrated strong performance, with a 94.66% accuracy and competitive F1 scores.
Overall, these results demonstrate that using graph-aware embeddings like FinBERT + Graph 1 and FinBERT + Graph 1 + Temporal 1 can significantly improve the accuracy and reliability of financial performance predictions. These methods are effective in capturing complex financial trends and relationships, making them valuable tools for financial forecasting. The findings suggest that incorporating relational and contextual information from financial data leads to better prediction outcomes, which is beneficial for making informed financial decisions.
Table 9 presents a comparison of linear and non-linear projection methods for financial performance prediction. The baseline model, without any projection, achieved recall scores of 0.9151 for the “Increase” class and 0.9459 for the “Decrease” class with an embedding size of 868. Applying non-linear projection at an embedding size of 1024 improved recall to 0.9279 and 0.9475, respectively, and further increasing the embedding size to 2048 resulted in recall scores of 0.9250 and 0.9421. Linear projection methods outperformed non-linear ones, with the best performance observed at an embedding size of 2048, yielding recall scores of 0.9350 for the “Increase” class and 0.9521 for the “Decrease” class. Even with a larger embedding size of 4082, linear projection maintained high recall scores of 0.9260 and 0.9521. These results indicate that linear projection techniques, particularly with an optimal embedding size, significantly enhance the accuracy of financial performance prediction models.
7. Conclusions
The proposed FintechKG framework systematically extracts and organizes financial knowledge from textual data, incorporating temporal information, taxonomies, and customized extractors to enhance analysis. The extraction pipeline, which includes entity and relation extraction, generates a detailed FintechKG that captures complex financial information. By integrating FintechKG into the Relational Graph Convolutional Network (RGCN) model and Long Short-Term Memory (LSTM) networks, the framework significantly improves financial performance predictions, achieving an accuracy of up to 95% when combining embeddings.
The results of this study demonstrate the effectiveness of the FintechKG framework in understanding financial events, trends, and relationships. The integration of temporal information and contextual knowledge within the framework allows for more accurate and reliable predictions of financial performance. This comprehensive approach addresses key challenges in financial knowledge graph construction and performance prediction, offering a scalable and adaptable solution for various financial applications.
Financial institutions, investors, and analysts can utilize the FintechKG framework to enhance decision-making across several real-world applications:
Improved Forecasting: By integrating diverse data sources like social media and industry knowledge, institutions can make more accurate decisions in asset management, investment strategies, and risk management.
Real-Time Monitoring: Investors can track financial performance in real-time, enabling better portfolio management and quicker responses to market shifts.
Fraud Detection: The scalable FintechKG framework supports fraud detection and compliance by identifying anomalies through additional data sources, ensuring regulatory adherence.
Further research could apply FintechKG to sectors like insurance or real estate and expand its predictive capability by integrating unstructured data such as news and market reports.
