1. Introduction
Artificial Intelligence (AI) informed decision-making is claimed to lead to faster and better decision outcomes. It has been increasingly used in our society from decision-making of daily lives such as recommending movies and books to making more critical decisions such as medical diagnosis, credit risk prediction, and shortlisting talents in recruitment. In 2020, the EU proposed the European approach to excellence and trust with their White Paper on AI [
1]. They stated that AI will change lives by improving not only healthcare but also increasing the efficiency of farming and contributing to climate change mitigation. Thus, their approach is to improve lives, while respecting rights. Among such AI-informed decision-making tasks, trust and perception of fairness have been found to be critical factors driving human behaviour in human–machine interactions [
2,
3]. The black-box nature of AI models makes it hard for users to understand why a decision is made or how the data are processed for the decision-making [
4,
5,
6]. Thus, trustworthy AI has experienced a significant surge in interest from the research community in various application domains, especially in high stake domains which usually require testing and verification for reasonability by domain experts not only for safety but also for legal reasons [
7,
8,
9,
10,
11].
1.1. AI Explanation
Explanation and trust are common partners in everyday life, and extensive research has investigated the relations between AI explanations and trust from different perspectives ranging from philosophical to qualitative and quantitative dimensions [
12]. For instance, Zhou et al. [
13] showed that the explanation of influences of training data points on predictions significantly increased the user trust in predictions. Alam and Mueller [
14] investigated the roles of explanations in AI-informed decision-making in medical diagnosis scenarios. The results show that visual and example-based explanations integrated with rationales had a significantly better impact on patient satisfaction and trust than no explanations, or with text-based rationales alone. The previous studies that empirically tested the importance of explanations to users, in various fields, consistently showed that explanations significantly increase user trust. Furthermore, with the advancement of AI explanation research, different explanation approaches such as local and global explanations, as well as feature importance-based and example-based explanations are proposed [
6]. As a result, besides the explanation presentation styles such as visualisation and text [
14,
15], it is also critical to understand how different explanation approaches affect user trust in AI-informed decision-making. In addition, Edwards [
16] stated that the main challenge for AI-informed decision-making is to know whether an explanation that seems valid is accurate. This information is also needed to ensure transparency and accountability of the decision.
1.2. AI Fairness
The data used to train machine learning models are often historical records or samples of events. They are usually not a precise description of events and conceal discrimination with sparse details which are very difficult to identify. AI models are also imperfect abstractions of reality because of their statistical nature. All these lead to imminent imprecision and discrimination (bias) associated with AI. As a result, the investigation of fairness in AI has been becoming an indispensable component for responsible socio-technical AI systems in various decision-making tasks [
17,
18]. In addition, extensive research focuses on fairness definitions and unfairness quantification. Furthermore, human’s perceived fairness (perception of fairness) plays an important role in AI-informed decision-making since AI is often used by humans and/or for human-related decision-making [
19].
Duan et al. [
20] argue that AI-informed decision-making can help users make better decisions. Furthermore, the authors propose that AI-informed decisions will be mostly accepted by humans when used as a support tool. Thus, it is crucial to consider the human perception of AI in general, and to what extent users would be willing to use such systems [
21]. Considerable research on perceived fairness has evidenced its links to trust such as in management and organizations [
22,
23].
1.3. Aims
Dodge et al. [
24] argued that AI explanations can also provide an effective interface for the human-in-the-loop, enabling people to identify and address fairness issues. They also demonstrated the need of providing different explanation types for different fairness issues. All of these demonstrate the inter-connection relations between explanation and fairness in AI-informed decision-making. Despite the proliferation of investigations of the effects of AI explanation on trust and perception of fairness, or effects of introduced fairness on trust and perception of fairness, it is crucial to understand how AI explanation and introduced fairness concurrently affect user trust and perception of fairness since AI explanation and fairness are common partners in AI-informed decision-making.
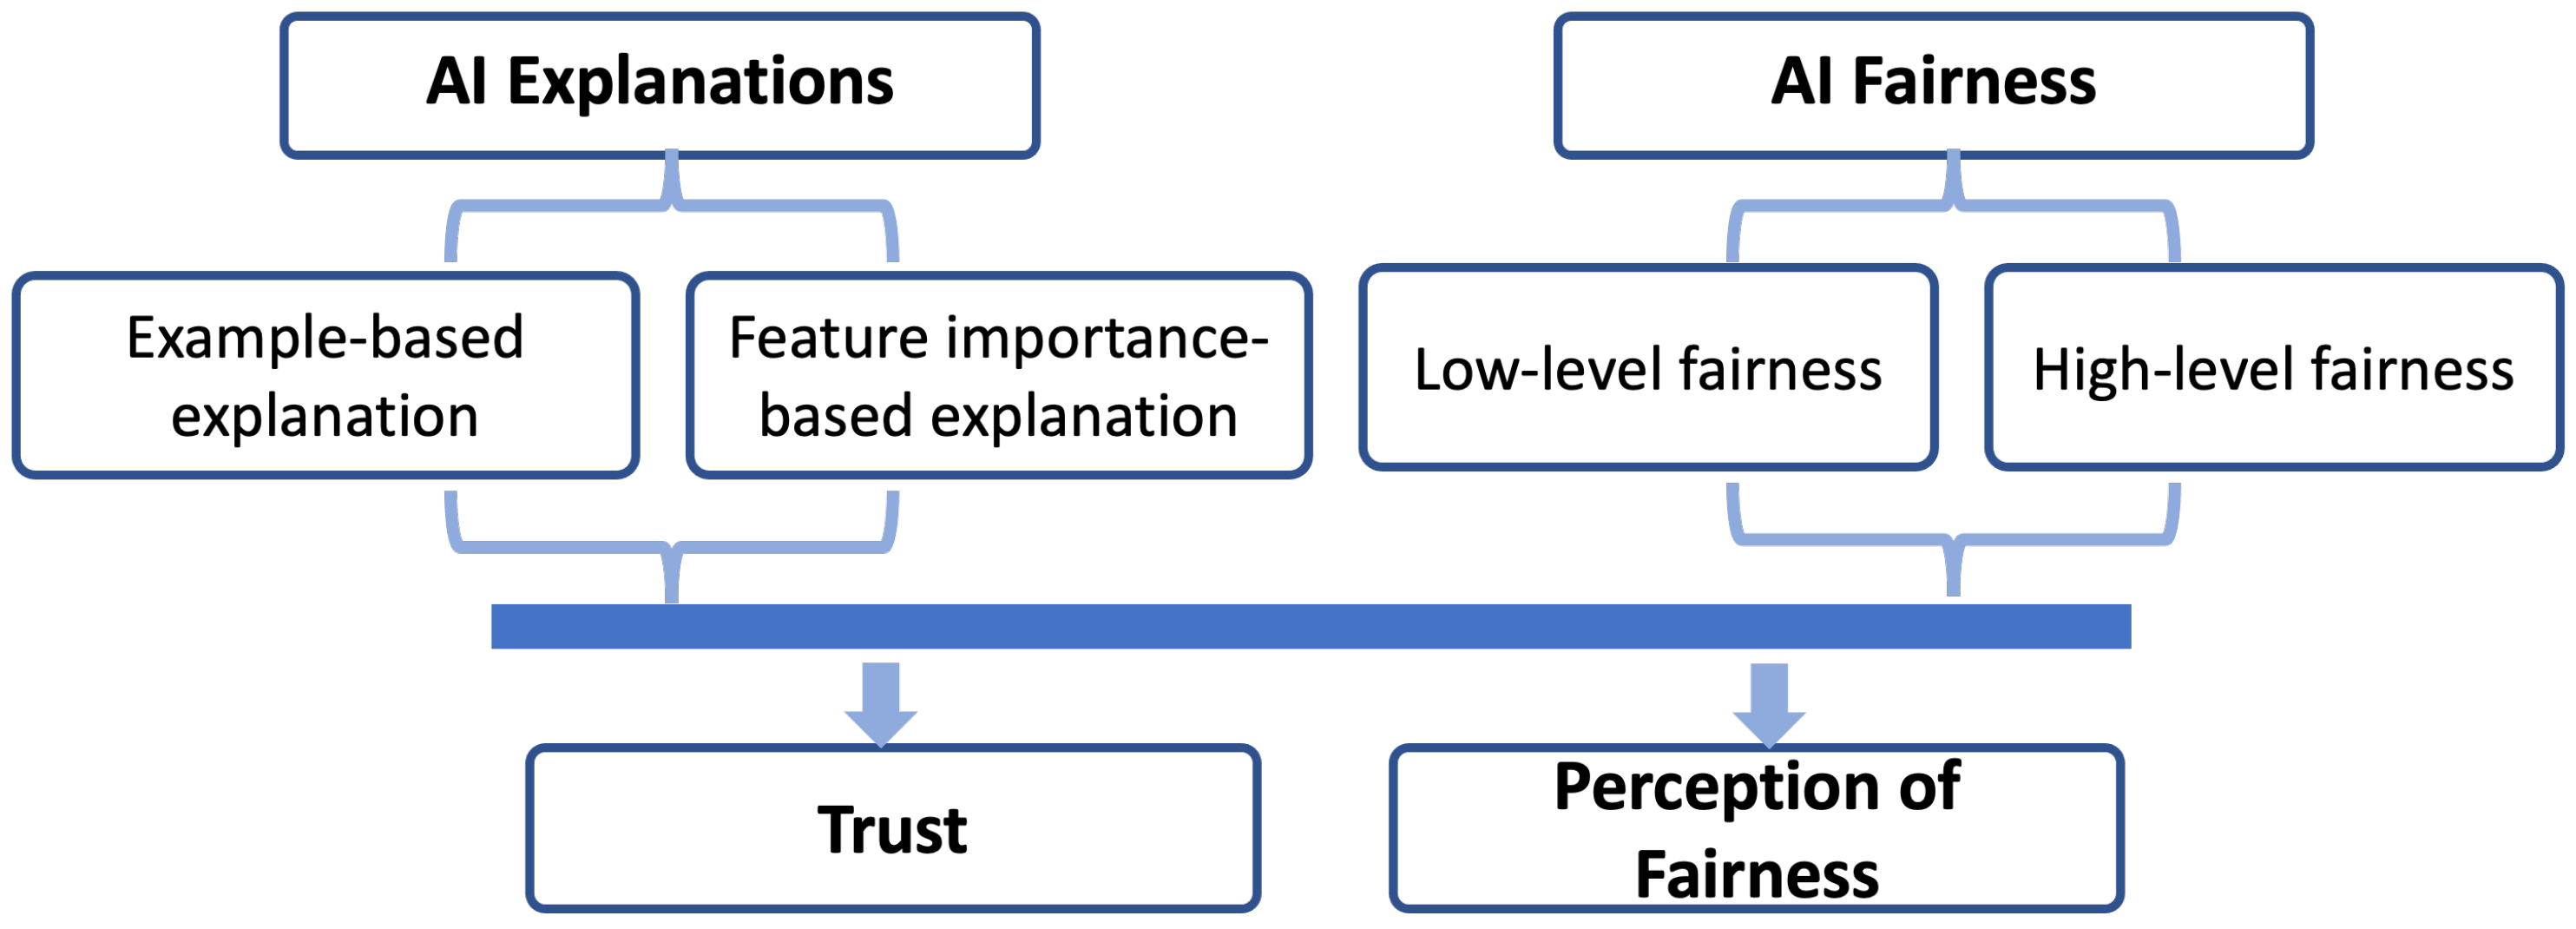
Our aim in this paper is to understand user trust under both different types of AI explanations and different levels of introduced fairness. This paper also aims to understand the perception of fairness by humans under both AI explanations and introduced fairness (see
Figure 1). In particular, two commonly used explanation approaches example-based explanations and feature importance-based explanations are introduced into the AI-informed decision-making pipeline under different levels of introduced fairness. We aim to discover whether AI explanations and introduced fairness benefit human’s trust and perceived fairness respectively and, if so, which explanation type or fairness level benefits more than others. An online user study with 25 participants is conducted by simulating AI-informed decision-making in two scenarios of health insurance decision-making and medical treatment decision-making through manipulating AI explanations and introduced fairness levels. Statistical analyses are performed to understand the effects of AI explanations and introduced fairness on trust and perception of fairness.
In summary, our study demonstrates important findings:
The introduced fairness and explanations affect user trust in AI-informed decision-making. Different fairness levels and explanation types affect user trust differently.
Similarly, the introduced fairness and explanations affect human’s perceived fairness in AI-informed decision-making. However, the effects of fairness levels and explanation types on the perception of fairness are different from their effects on user trust.
The application scenarios affect user responses of trust and perception of fairness under different explanation types and introduced fairness levels in AI-informed decision-making.
3. Materials and Methods
3.1. Scenarios
This research selected two application contexts for AI-informed decision-making: health insurance decision-making and medical treatment decision-making.
3.1.1. Decision-Making of Health Insurance Payment
The decision on the monthly payment rate is a significant step in the health insurance decision-making process. It is often based on information about the age and lifestyle of applicants. For example, a 20-year old applicant, who neither smokes nor drinks and works out frequently, is less likely to require extensive medical care. Therefore, the insurance company most likely decides to put this applicant into the lower payment class with a lower monthly rate for insurance. The insurance will increase with the age of the applicant and pre-known illnesses or previous hospital admissions. AI is used to obtaining faster results for these decisions while enhancing customer experience since AI allows the automatic calculation of key factors and guarantees an equal procedure for every applicant [
55]. This decision-making process is simulated in the study by creating fake personas with different attributes and showing their prediction of a monthly insurance rate. The simulation determines the monthly rate based on the factors of age, gender, physical activities, as well as drinking and smoking habits.
The advisory organ of the EU on GDPR, Article 29 Working Party, added a guideline [
56] with detailed descriptions and requirements for profiling and automated decision-making. They also state that transparency is a fundamental requirement for the GDPR. Two explanation approaches of example-based explanation and feature importance-based explanation with fairness conditions are introduced into the decision-making process to meet requirements for AI-informed decision-making by GDPR [
57] and other EU regulations and guidelines [
58,
59].
3.1.2. Decision-Making of Medical Treatment
The decision-making of medical treatment belongs to high-stake decisions and needs physicians to comprehensively evaluate the relevant data concerning the current status of the patient for the corresponding treatment, either alone or together with the patient [
60]. Physicians also need to inform the patient about the relevant factors which influence the treatment decision. AI can improve this process by providing a predicted decision to the physician and the patient, which could potentially reduce the extensive human errors in medical practices [
61]. In this study, this AI-informed decision-making process is simulated by showing predicted medical treatment decisions with different simulated patients based on factors of gender, age, past medical expenses and pre-existing illnesses of first and second-degree family members. Although past medical expenses do not seem like a relevant factor, Obermeyer et al. [
62] showed that this was used as a proxy for the seriousness of a medical condition. The decisions from the simulated AI include two options: immediate treatment or waiting for the next free appointment. These help to prioritize and order the patients according to their urgency, similar to the algorithm proposed by Pourhomayoun and Shakibi [
63].
Two types of AI explanations and two levels of introduced fairness are introduced into this decision scenario and manipulated to understand their effects on trust and perception of fairness, respectively.
3.2. Explanations
This study aims to understand how AI explanations affect the perception of fairness and user trust in decision-making. Two types of explanations are investigated in the experiment:
Example-based explanation. Example-based explanation methods select particular instances of the dataset as similar or adverse examples to explain the behaviour of AI models. Examples are commonly used as effective explanations between humans to explain complex concepts [
64]. Example-based AI explanations have been used to help users gain an intuition for AI that are otherwise difficult to explain through algorithms [
65]. In this study, both similar and adverse examples are introduced into tasks to investigate user responses.
Feature importance-based explanation. Feature importance is one of the most common AI explanations [
8]. It is a measure of the individual contribution of a feature to AI outcomes. For example, a feature is “important” if changing its values increases the model error, as the model relied on the feature for the prediction. A feature is “unimportant” if changing its values leaves the model error unchanged. In this study, the importance of each feature on a specific AI prediction is presented to analyse user responses.
In addition, tasks without any specific explanations (called control condition in this study) are also introduced to see if the explanation is indeed helpful or provides a better understanding of the decision-making process.
3.3. Fairness
In this study, gender is used as a protected attribute in fairness investigations. Hence, fairness represents the topic of gender discrimination in this study. Two levels of introduced fairness are used in the study:
Low fairness. At this level, the decisions are completely biased toward one gender. In this study, statements such as “male and female customers having a similar personal profile did receive a different insurance rate: male customers pay 30 Euros more than female customers.” are used to show the least fairness of the AI system.
High fairness. At this level, both males and females are fairly treated in the decision-making. In this study, statements such as “male and female having a similar personal profile were treated similarly” are used to show the most fairness of the AI system.
In addition, tasks without any fairness information (called control condition in this study) are also introduced to investigate the difference in user responses in decision-making with and without the fairness information.
3.4. Task Design and Experiment Setup
According to application scenarios as described above, we investigated the decisions made by participants under both explanation and fairness conditions (3 explanation conditions by 3 fairness conditions, see
Table 1). All together, each participant conducts 18 tasks (3 explanation conditions × 3 fairness conditions × 2 scenarios = 18 tasks). The orders of tasks are randomised to avoid any bias introduced. In addition, 2 training tasks are conducted by each participant before formal tasks.
During the experiment, each participant firstly signed the consent form and agreed to conduct the experiment. Two training tasks were then conducted by the participant to become familiar with the experiment before formal tasks. In each formal task, an application scenario was firstly presented to the participants. AI models then automatically recommended a decision based on the use case. The participant was asked to accept or reject this decision under the presentation of different explanation and fairness conditions.
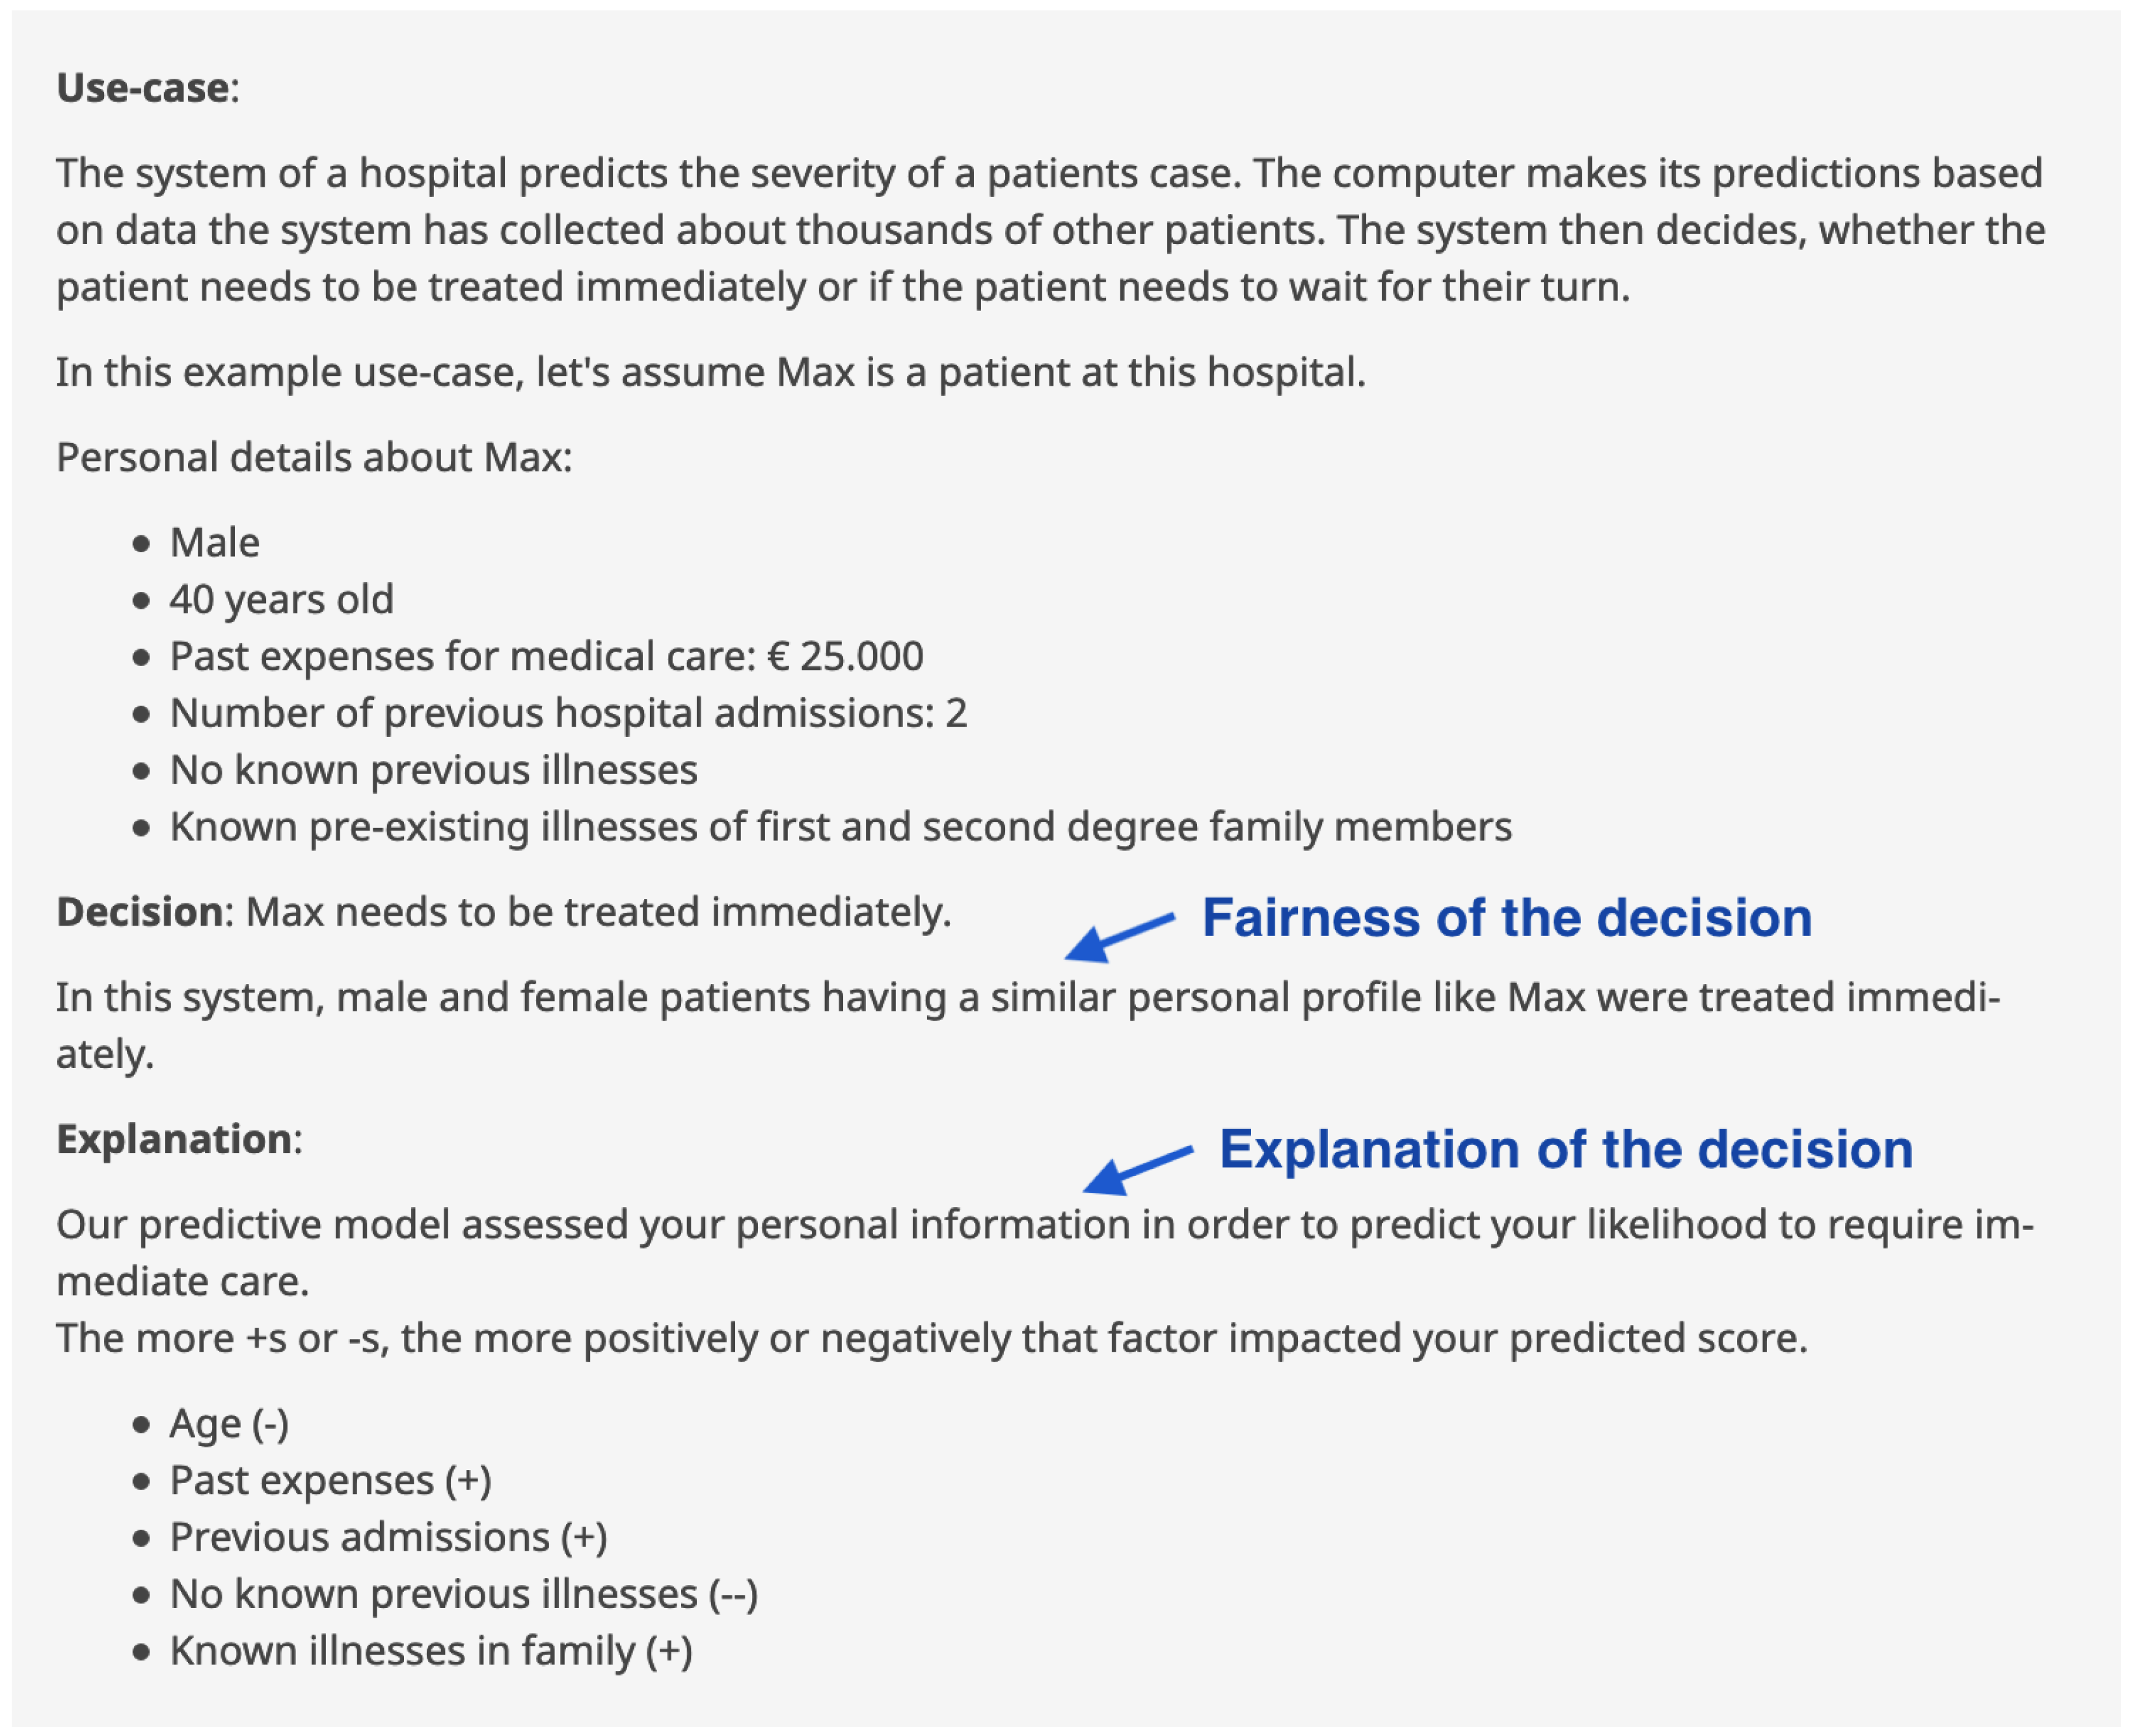
Figure 2 shows an example of the use case statement, the decision recommended by AI models, as well as the presentation of fairness and explanation conditions. After the decision-making, different questions were asked to rate users’ trust in AI models and perception of fairness in decision-making.
Due to social distancing restrictions and lockdown policies during the COVID-19 pandemic, this experiment was implemented and deployed on a cloud server online in Medical University Graz, Austria. The deployed application link was then shared with participants through emails and social networks to invite them to participate in the experiment.
3.5. Trust and Perception of Fairness Scales
In this study, trust is assessed with six items using self-report scales following approaches in [
66]. The scale is on a 4-point Likert-type response scale ranging from 1 (strongly disagree), 2 (disagree), 3 (agree), to 4 (strongly agree):
I believe the system is a competent performer;
I trust the system;
I have confidence in the advice given by the system;
I can depend on the system;
I can rely on the system to behave in consistent ways;
I can rely on the system to do its best every time I take its advice.
Furthermore, this study measures the perception of fairness with a single scale that focuses on the global perception of appropriateness [
67]. The questionnaire on fairness is “Overall, female and male applicants are treated fairly by the system”. The scale is on a 4-point Likert-type response scale ranging from 1 (strongly disagree), 2 (disagree), 3 (agree), to 4 (strongly agree).
3.6. Participants and Data Collection
In this study, 25 participants were recruited to conduct experimental tasks via various means of communication such as emails and social media posts. They were university students with an average age of 26 and 10 of them were females. After each task was displayed on the screen, the participants were asked to answer ten questions based on the task on the perception of fairness, trust, and satisfaction in the AI-informed decision-making, respectively.
3.7. Analysis Methods
Since two independent factors of explanation and fairness were introduced to investigate their effects on user trust and perception of fairness, respectively, in this study, two-way ANOVA tests were first conducted to examine whether there were interactions between explanation and introduced fairness on trust or perception of fairness. We then performed one-way ANOVA tests, followed by a post-hoc analysis using t-tests (with a Bonferroni correction) to analyse differences in participant responses of trust or perception of fairness under different conditions. The study aims to understand:
Before statistical analysis, trust and perception of fairness values were normalised with respect to each subject to minimize individual differences in rating behavior (see Equation (
1)):
where
and
are the original and normalised trust or perception of fairness rating values, respectively, from the participant
i,
and
are the minimum and maximum of trust or perception of fairness rating values respectively from the participant
i in all of his/her tasks.
4. Results
This section explores the results of the user study. The analysis of the effects of fairness conditions and explanations on trust and the perception of fairness are firstly presented. The results from two scenarios are also compared in order to gain further insight into the relationship between explanations and fairness conditions.
4.1. Trust
This subsection analyses the effects of explanation and fairness on trust in AI-informed decision-making.
4.1.1. Effects of Fairness on Trust
Figure 3a shows normalised trust values over the introduced fairness conditions. A one-way ANOVA test was performed to compare the effect of introduced fairness on user trust. The one-way ANOVA test found that there were statistically significant differences in user trust among three introduced fairness conditions
. A further post-hoc comparison with
t-tests (with a Bonferroni correction under a significance level set at
) was conducted to find pair-wise differences in user trust between three fairness conditions. The adjusted significance alpha level of 0.017 was calculated by dividing the original alpha of 0.05 by 3, based on the fact that we had three fairness conditions. It was found that participants had a statistically significant high level of trust under the control condition of fairness (no fairness information presented) compared to the low fairness condition (
). Moreover, it was found that participants also had a statistically significant higher level of trust under the high fairness condition compared to that under the low fairness condition (
). However, there was not a statistically significant difference found in user trust between the introduced high fairness condition and the control condition (
).
These findings imply that the introduced fairness condition did affect user trust in AI-information decision-making only under the low fairness condition, where introduced fairness decreased user trust in AI-informed decision-making.
4.1.2. Effects of Explanation on Trust
Figure 3b shows normalised trust values over various explanation conditions. A one-way ANOVA test revealed statistically significant differences in user trust under different explanation types
. Then, post-hoc tests with the aforementioned Bonferroni correction were conducted. It was found that participants had a statistically significant lower level of trust under the control condition (no explanation presented) than that under the feature importance-based explanation (
0.000) and example-based explanation (
), respectively. There was not a significant difference in user trust between feature importance-based explanation and example-based explanation (
).
The results showed that explanations did help users increase their trust significantly in AI-informed decision-making, but different explanation types did not show differences in affecting user trust.
4.1.3. Effects of Fairness and Explanation on Trust
A two-way ANOVA test was performed to analyse the effect of introduced fairness and explanation types on user trust in AI-informed decision-making. The two-way ANOVA test showed that there were no statistically significant interactions between fairness conditions and explanation types on trust, . This subsection further analyses the effects of fairness on trust under different given explanation types and the effects of explanation on trust under different given fairness levels.
Effects of Fairness on Trust under Example-Based Explanations
Figure 4a shows normalised trust values over various fairness conditions under the example-based explanation condition. A one-way ANOVA test was conducted to compare the effect of introduced fairness on user trust under the example-based explanation. The test found a statistically significant difference in trust between introduced fairness levels,
. Further post-hoc
t-tests (with Bonferroni correction) were then conducted to find differences in trust among different fairness levels. Participants showed a significant higher trust level under high introduced fairness than that under the low introduced fairness level (
). Moreover, user trust was significantly higher under the control condition (no fairness information presented) than that under the low introduced fairness level (
). However, there was not a significant difference in trust between the high introduced fairness and the control condition (
).
The results showed that, under the example-based explanation condition, the low level of fairness statement significantly decreased the user trust in decision-making, but the high level of fairness statement did not affect user trust.
Effects of Fairness on Trust under Feature Importance-Based Explanations
Figure 4b shows the normalized trust levels for introduced fairness levels under feature importance-based explanation. A one-way ANOVA test found significant differences in trust in different introduced fairness levels under the feature importance-based explanation,
. The further post-hoc
t-tests found that user trust was statistically significant lower under the low introduced fairness level than that under the high introduced fairness level (
) and the control condition (no fairness information presented) (
), respectively (considering only two actual introduced fairness conditions (high and low), the adjusted alpha can be re-adjusted to
). However, no significant difference was found between the control condition and the high level of introduced fairness (
).
From the results, we can see that, under the feature importance-based explanation condition, the low level of fairness statement significantly decreased the user trust in decision-making, but the high level of fairness statement did not affect user trust. This is similar to the conclusion under the example-based explanation condition we obtained previously.
Effects of Explanation on Trust under Low Level Introduced Fairness
Figure 5a shows the normalized trust values with different explanation types under low-level introduced fairness. A one-way ANOVA test found statistical significant differences in trust among explanation types under the low level of introduced fairness,
. The further
t-test found that participants showed a significantly higher level of trust under feature importance-based explanation than that under the control condition (no explanation presented) (
). However, there were no significant differences found in user trust between the control condition and example-based explanation (
). There was also no significant difference in user trust between the two explanation types (
).
Therefore, we can say that, under the low level of introduced fairness, the feature importance-based explanation significantly increased user trust in decision-making, but the example-based explanation did not.
Effects of Explanation on Trust under High Level of Introduced Fairness
Figure 5b shows the normalised trust values in different explanation types under the high level of introduced fairness. A one-way ANOVA test revealed statistical significant differences in user trust among explanation types under the high level of introduced fairness,
. The further post-hoc
t-tests showed that user trust was significantly higher under feature importance-based explanation than that under the control condition (no explanation presented) (
). However, there was neither a significant difference in user trust between the control condition and example-based explanation (
), nor between example-based and feature importance-based explanation (
).
The high level of introduced fairness showed similar effects on user trust as the low level of introduced fairness: the feature importance-based explanation significantly increased user trust, while the example-based explanation did not.
4.2. Perception of Fairness
This subsection analyses the effects of explanation and introduced fairness on the perception of fairness.
4.2.1. Effects of Introduced Fairness on Perception of Fairness
Figure 6a shows normalised values of perception of fairness under different introduced fairness conditions. There were statistically significant differences found in the perception of fairness under different introduced fairness conditions with a one-way ANOVA test,
. The further post-hoc
t-tests with Bonferroni correction as described previously (with a significance level
) were applied. The results showed that the low-level introduced fairness condition resulted in a statistically significant lower level of perception of fairness than that under the high level of introduced fairness (
). In addition, participants had a statistically significant lower level of perception of fairness under the low introduced fairness condition compared to the control condition (no fairness information presented) (
). There was no significant difference in the perception of fairness between the high-level introduced fairness and the control condition (
). However, considering only two actual introduced fairness conditions (high and low), the adjusted alpha can be re-adjusted to
. Therefore, the post-hoc test indicated a statistically significant higher level of the perception of fairness under the high-level introduced fairness than that under the control condition (
).
The results indicated that the introduced fairness did affect the user’s perception of fairness, where the lower level of introduced fairness decreased the user’s perception of fairness, while the higher level of introduced fairness increased the user’s perception of fairness.
4.2.2. Effects of Explanation on Perception of Fairness
Figure 6b shows normalised values of perception of fairness under different explanation types. A one-way ANOVA test revealed statistically significant differences in the perception of fairness under different explanation types,
. Then, post-hoc
t-tests were applied to find pair-wise differences in the perception of fairness among explanation conditions. It was found that participants showed a statistically significant higher level of perception of fairness under example-based explanations (
) and feature importance-based explanations (
) respectively than that under control condition (no explanation presented). There were no significant differences found in the perception of fairness between example-based explanations and feature importance-based explanations (
).
The results implied that explanations did benefit and increase the perception of fairness as we expected in AI-informed decision-making. However, different explanation types investigated in the study did not show differences in affecting the perception of fairness.
4.2.3. Effects of Explanation and Introduced Fairness on Perception of Fairness
A two-way ANOVA test did not find significant interactions between fairness levels and explanation types on the perception of fairness, . This subsection further analyses the effects of introduced fairness on the perception of fairness under different given explanation types, and the effects of explanation on perception of fairness under different given introduced fairness levels.
Effects of Fairness on Perception of Fairness under Example-Based Explanations
Figure 7a shows the normalised values of perception of fairness with different introduced fairness under example-based explanations. A statistically significant difference in perceived fairness among different fairness conditions was found by performing a one-way ANOVA test,
. The further post-hoc
t-tests showed that high introduced fairness resulted in a statistically significant higher level of perception of fairness than that under the low introduced fairness (
). Moreover, the analysis showed that the control condition (no fairness information presented) resulted in a higher perception of fairness than that under the low introduced fairness (
). However, there was not a significant difference in perceived fairness found between the high introduced fairness and control condition (
).
The results indicated that, under example-based explanations, the low level of introduced fairness decreased perception of fairness significantly, while the high level of introduced fairness did not.
Effects of Fairness on Perceived Fairness under Feature Importance-Based Explanations
The same procedure was carried out for the feature importance-based explanation.
Figure 7b shows the normalised values of perception of fairness with different introduced fairness under feature importance-based explanations. A one-way ANOVA test found statistically significant differences in perceived fairness among different introduced fairness conditions,
. The further post-hoc
t-tests found that participants had a higher level of perception of fairness under the high-level introduced fairness, compared to the low level introduced fairness (
). Moreover, the tests found a significantly higher level of perception of fairness under the control condition (no fairness information presented) than that under the low-level introduced fairness (
). However, there were no significant differences in perception of fairness between the high level and control groups of introduced fairness (
).
Therefore, similar conclusions were obtained for the perception of fairness under feature importance-based explanations as that under example-based explanations: the low level of introduced fairness decreased the perception of fairness significantly, while the high level of introduced fairness did not.
Effects of Explanation on Perceived Fairness under Low Level of Introduced Fairness
Figure 8a shows the normalised perception of fairness with different explanation types under the low level of introduced fairness. A one-way ANOVA test found that there were statistically significant differences in perception of fairness among three explanation types,
. The further post-hoc
t-tests showed that participants’ perception of fairness was significantly higher under feature importance-based explanations than that under the control condition (no explanation presented) (
). However, there were no significant differences in the perception of fairness between example-based and feature importance-based explanations (
). Moreover, there was no significant difference in the perception of fairness between the control condition (no explanation presented) and the example-based explanation (
).
The results showed that, under the low level of introduced fairness, feature importance-based explanations significantly increased participants’ perception of fairness, while example-based explanations did not.
Effects of Explanation on Perceived Fairness under High-Level Introduced Fairness
Figure 8b shows the normalised values of perception of fairness with different explanation types under the high level of introduced fairness. A one-way ANOVA test revealed that there were no statistically significant differences found in the perception of fairness among different explanation types under the high level of introduced fairness,
.
The results indicated that different explanation types did not benefit a human’s perception of fairness under the high level of introduced fairness.
4.3. Trust and Perception of Fairness in Different Scenarios
This subsection investigates the effect of scenarios (health insurance decision-making and medical treatment decision-making) on user trust and perception of fairness. Moreover, we also explore whether the scenarios combined with introduced fairness levels and explanation types affect user trust and perception of fairness.
A one-way ANOVA test did not find any statistically significant differences in user trust between two scenarios . A one-way ANOVA test also did not find any statistically significant differences in perception of fairness between two scenarios .
4.3.1. Explanation Types and Scenarios on Trust
To further investigate the effect of explanation types and scenarios on user trust, a two-way ANOVA test was performed, which did not find significant interactions in trust between introduced fairness and scenario .
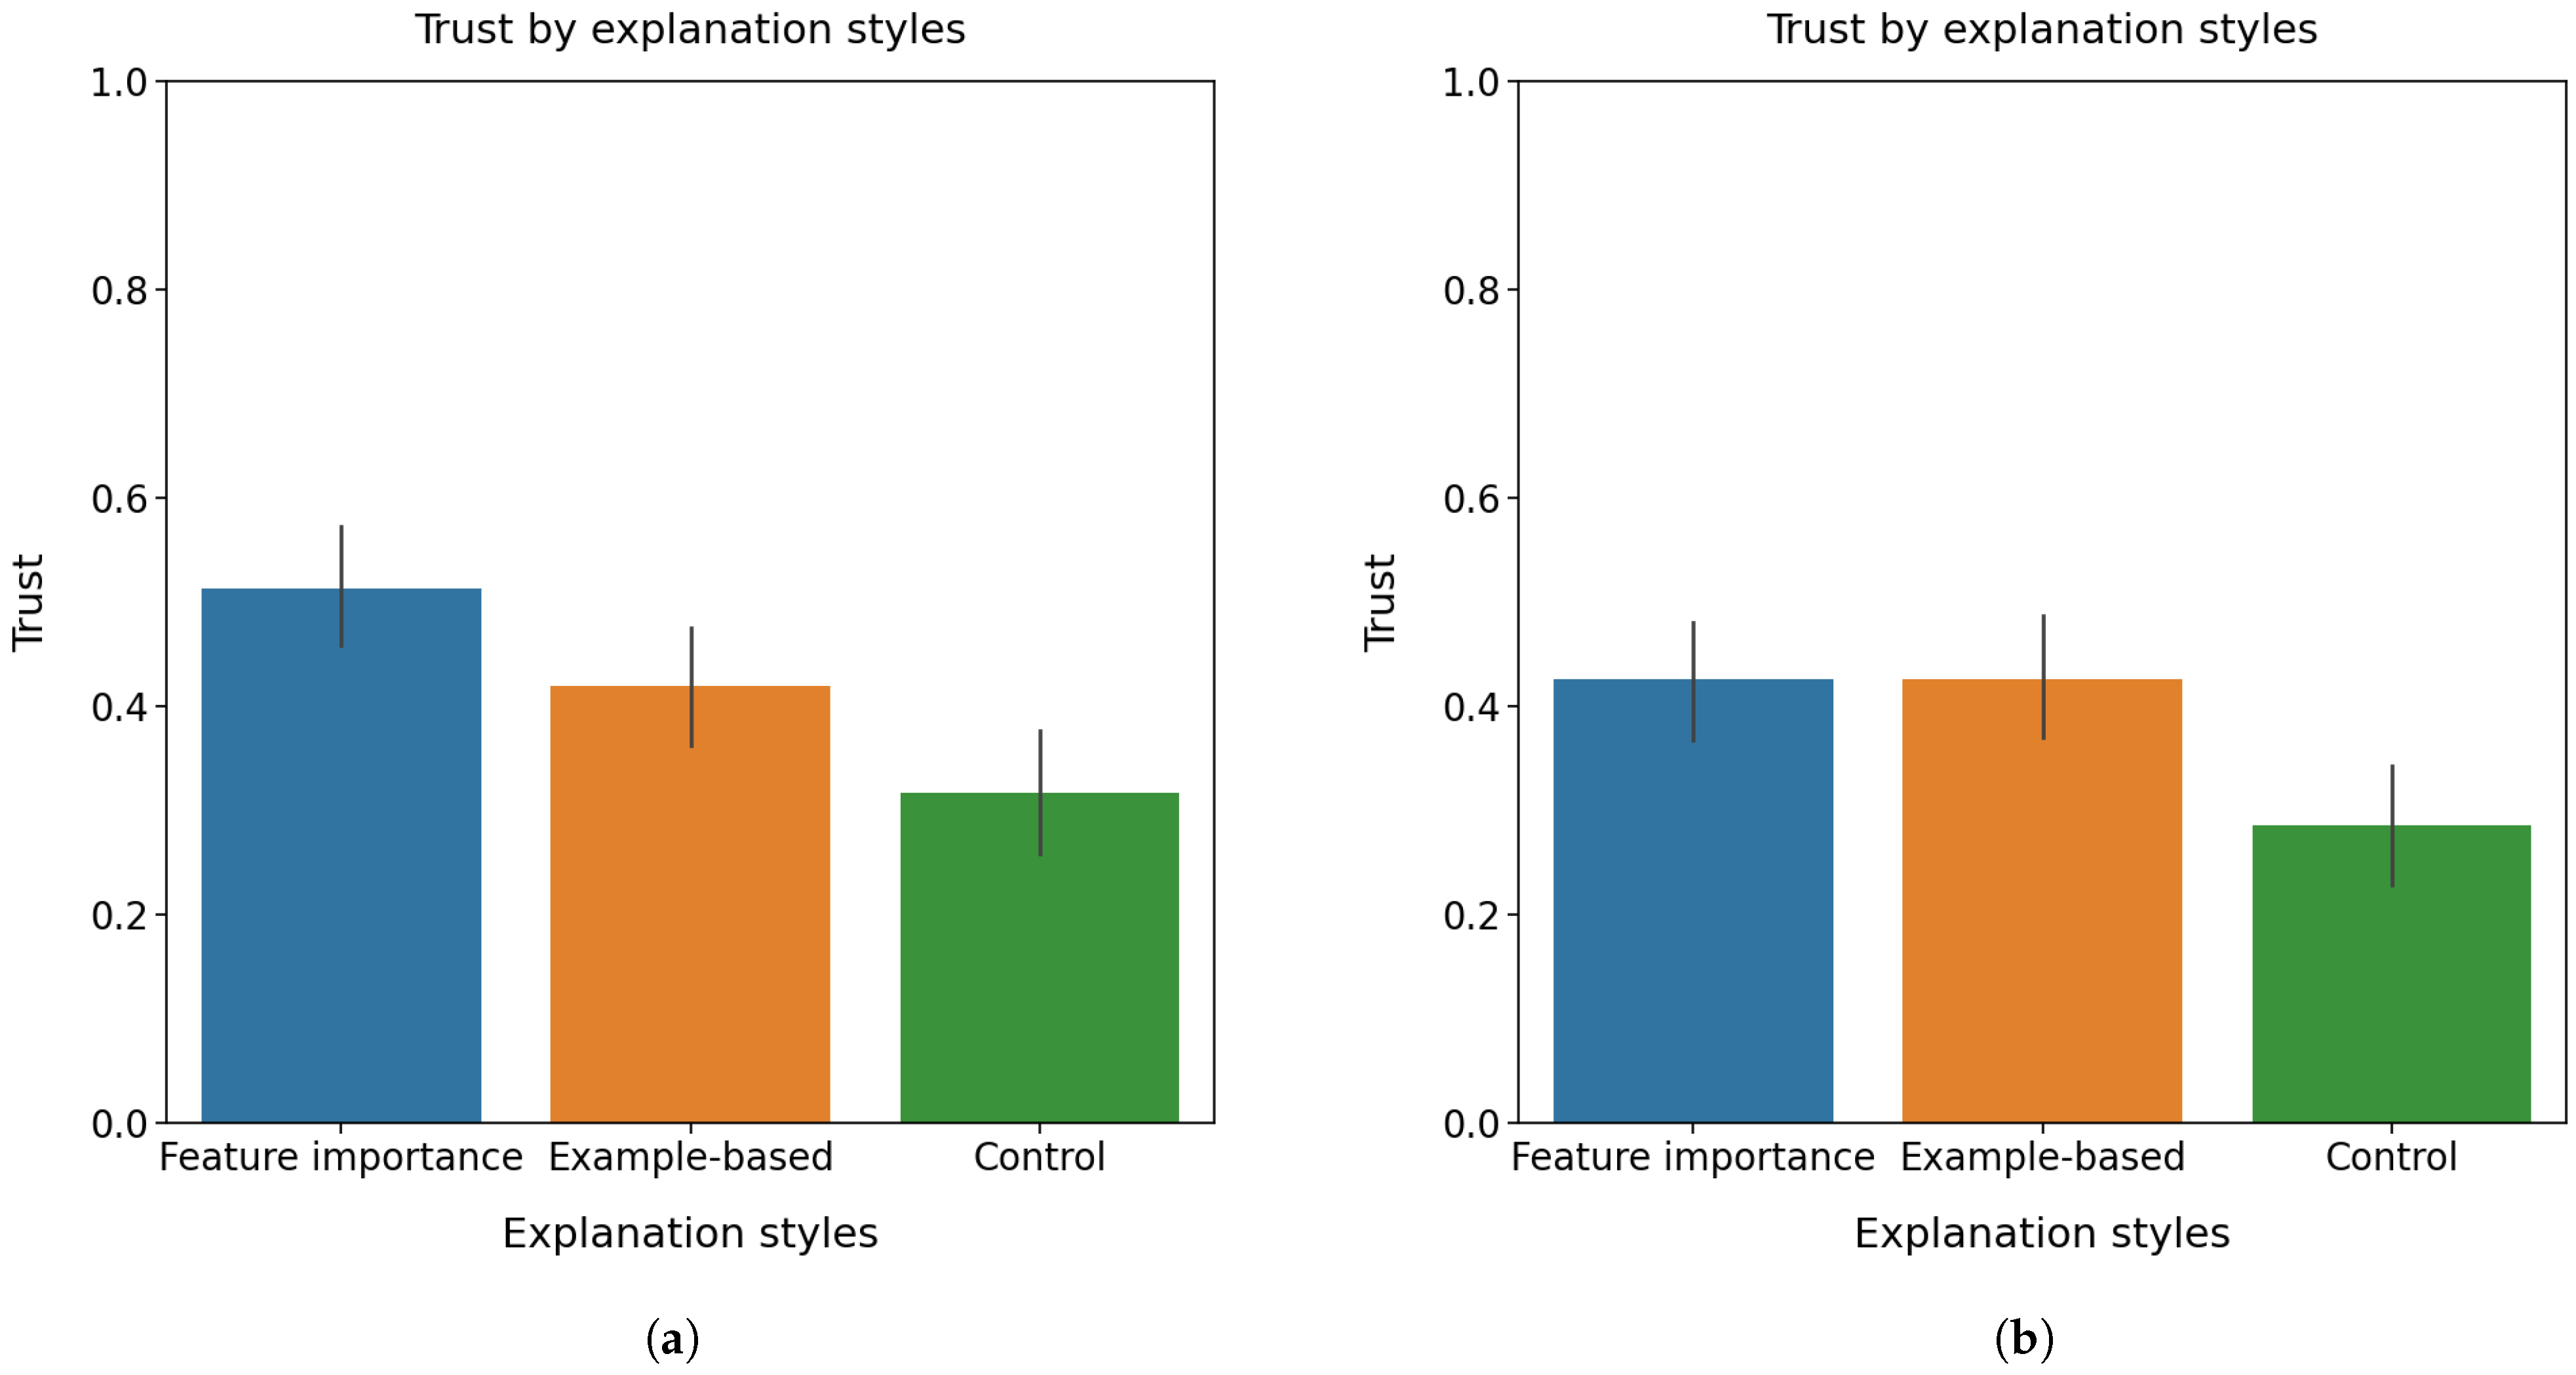
A further one-way ANOVA test revealed that explanation types in connection with the scenario of health insurance decision-making had a significant effect on user trust,
.
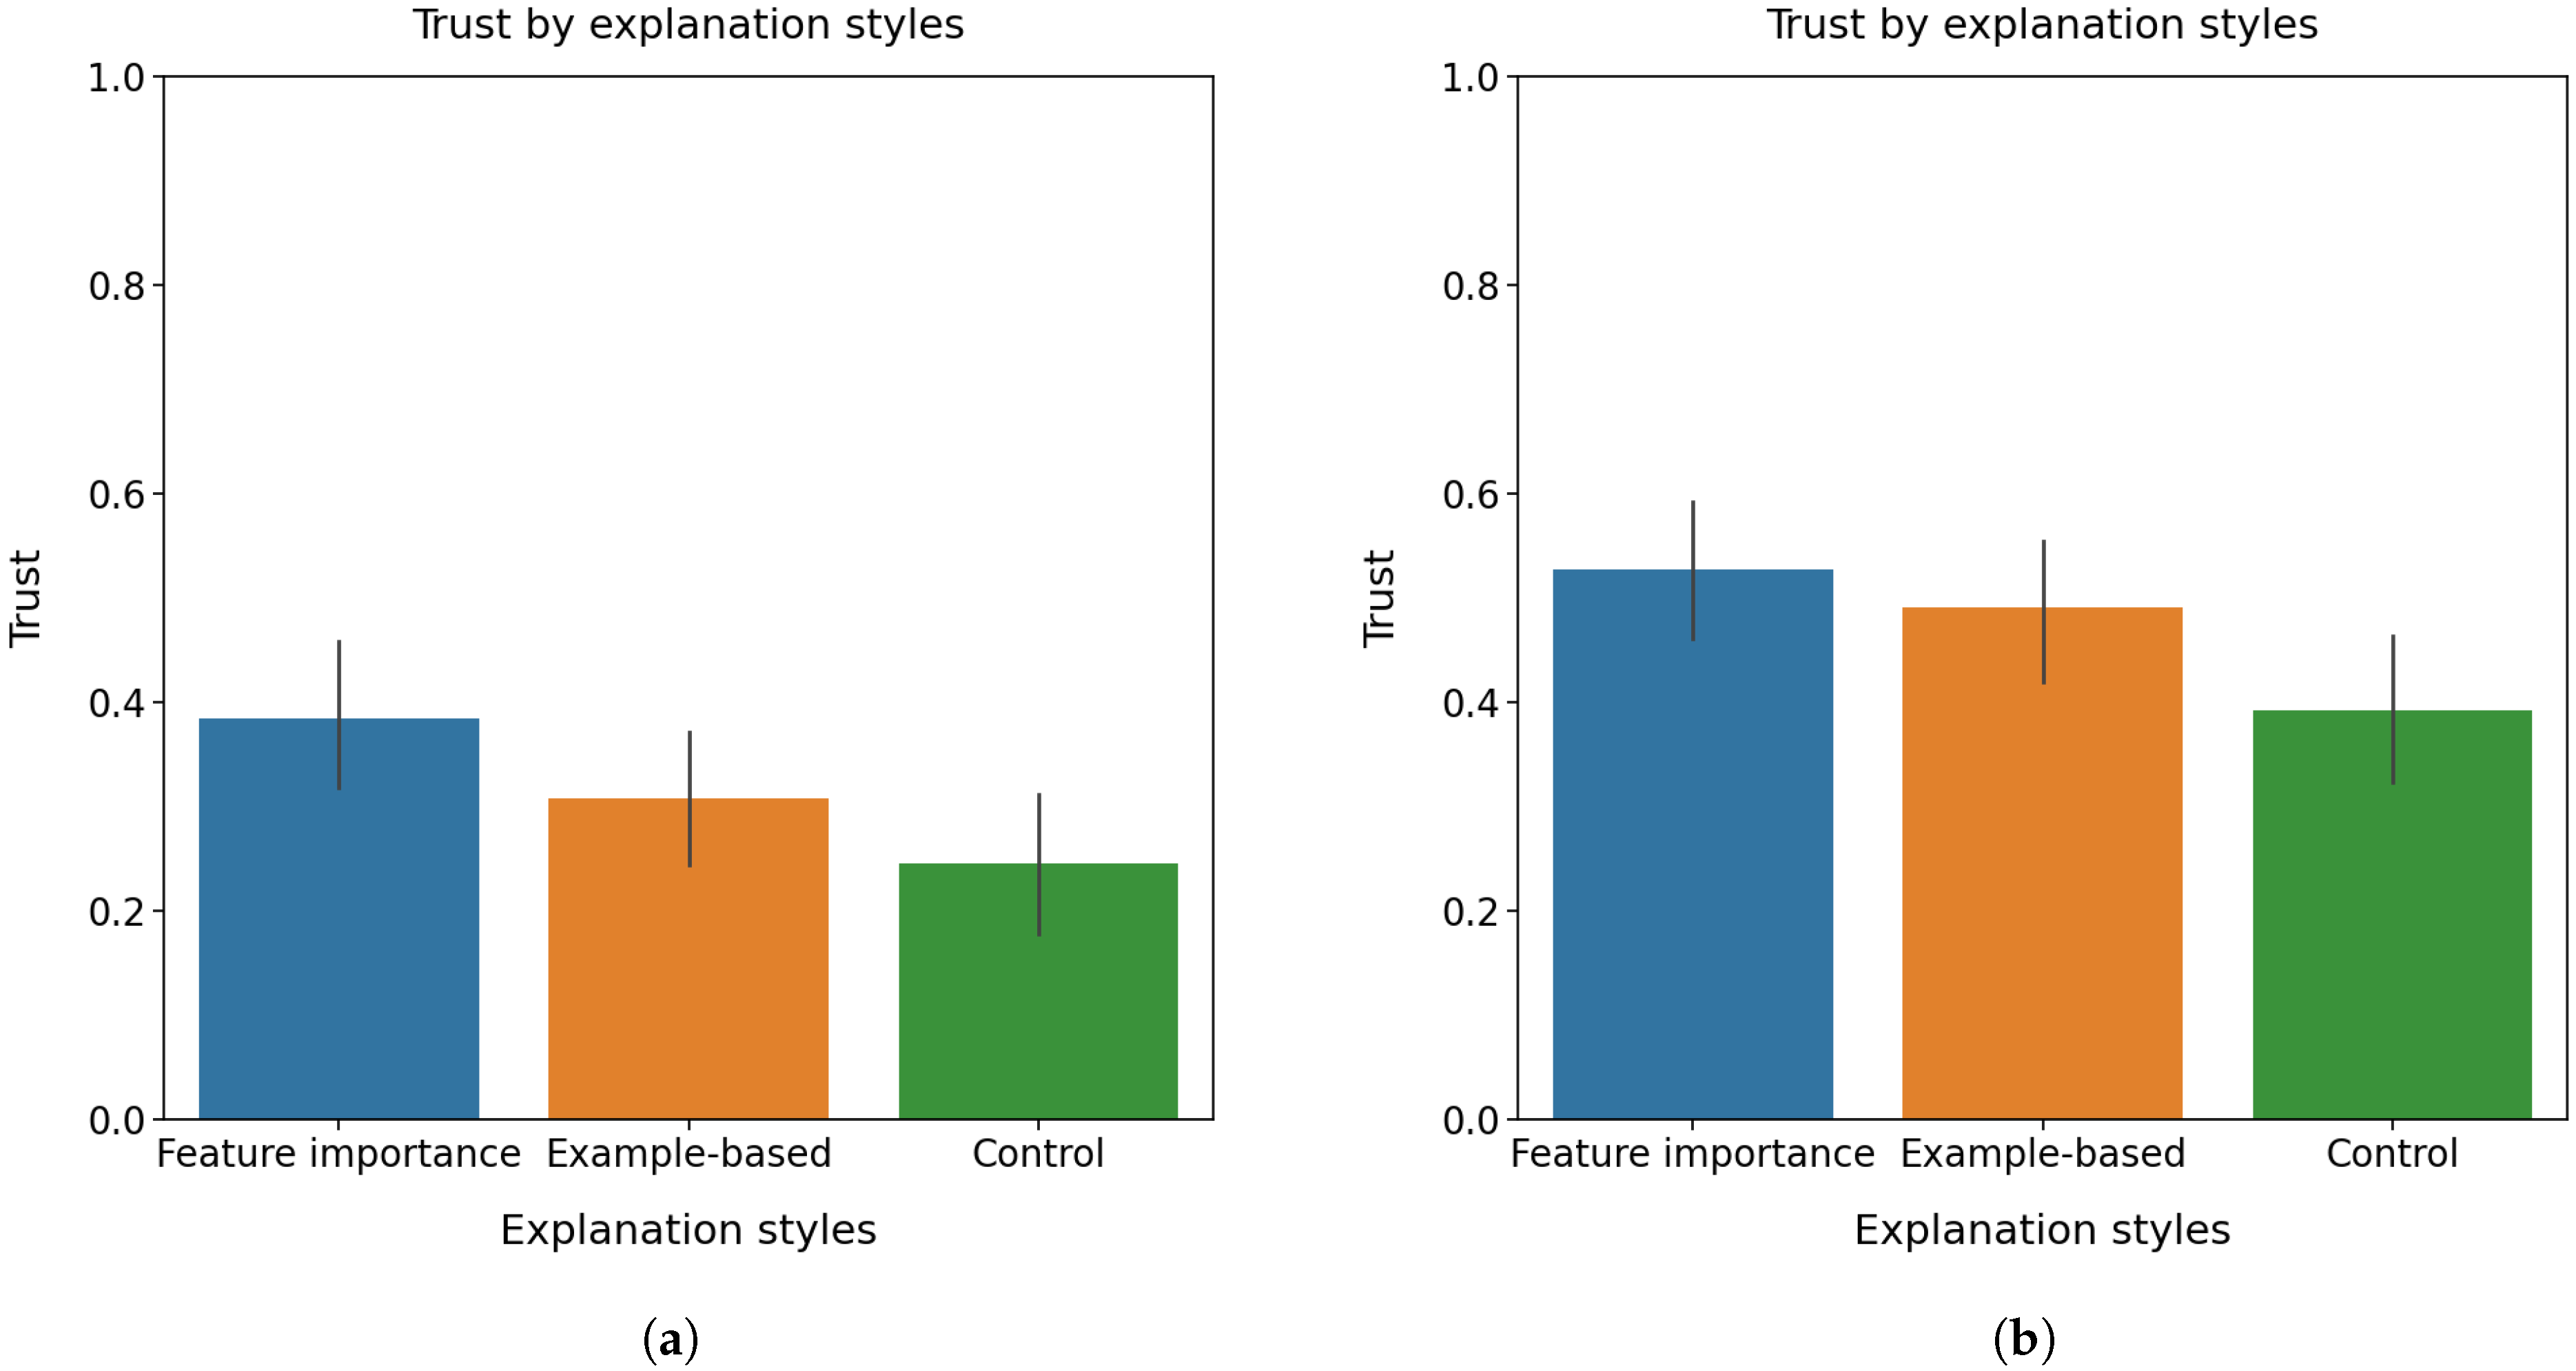
Figure 9a shows the normalised values of user trust for the scenario of health insurance decision-making. The post-hoc
t-tests showed a statistically significant higher level of user trust under feature importance-based explanations than that under example-based explanations (
). Moreover, participants showed significantly higher user trust under example-based explanation (
) and feature importance-based explanation (
) than under the control condition (no explanation presented), respectively.
Figure 9b shows the normalised trust values per explanation types in the scenario of medical treatment decision-making. A one-way ANOVA test found that explanation types in connection with the medical treatment decision-making had a significant effect on user trust
. The further post-hoc
t-tests found that participants showed significantly higher trust under example-based explanation (
) and feature importance-based explanation (
) than that under the control condition (no explanation presented), respectively. However, there were no significant differences in user trust found between both explanation types (
).
The results indicated that the effect of explanations on user trust was slightly different in two scenarios of health insurance decision-making and medical treatment decision-making despite explanations increasing user trust in both scenarios.
4.3.2. Introduced Fairness and Scenarios on Trust
To further investigate the effect of introduced fairness and scenarios on user trust, a two-way ANOVA test did not find any significant interactions in trust between introduced fairness levels and scenarios .
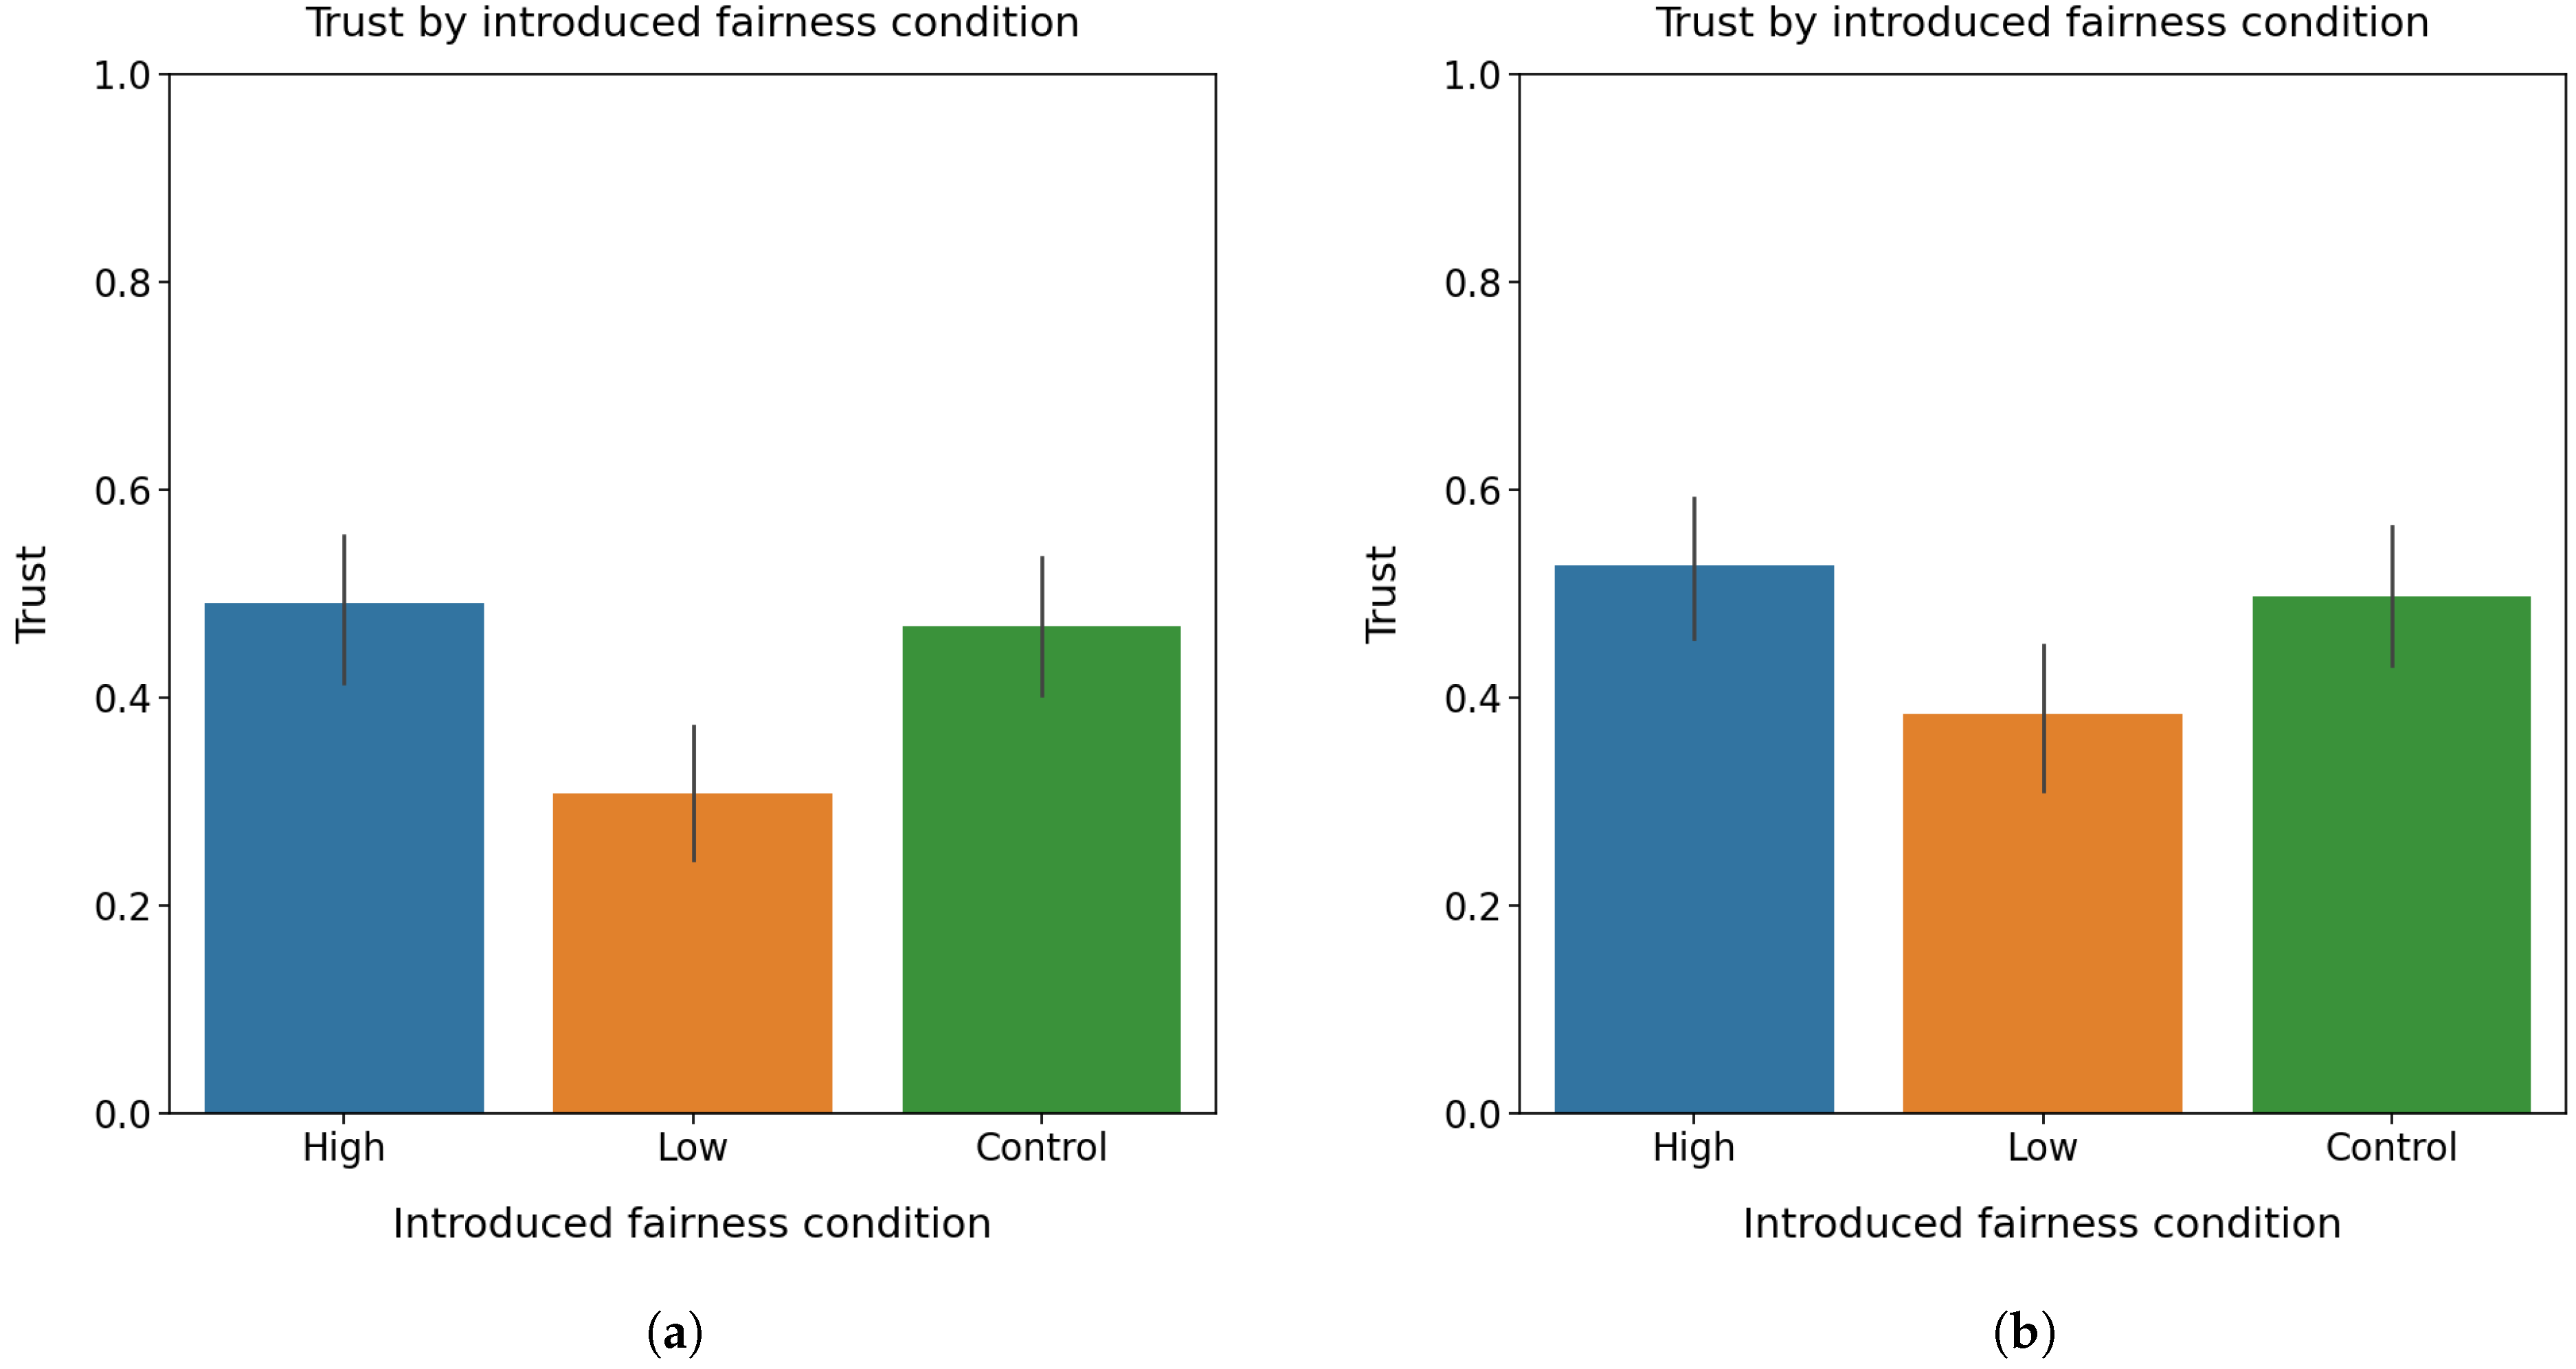
Figure 10a shows the normalised trust values over introduced fairness levels in the scenario of health insurance decision-making. A one-way ANOVA test revealed that the introduced fairness condition in connection with the scenario of health insurance decision-making showed a significant influence on user trust
. The post-hoc
t-tests found that participants had significantly higher user trust under the high level of introduced fairness than that under the low level of introduced fairness (
). Moreover, participants also had significantly higher user trust under the control condition (no fairness information presented) than that under the low-level introduced fairness (
).
Figure 10b shows the normalised values of trust over introduced fairness conditions in the scenario of medical treatment decision-making. A one-way ANOVA test found that introduced fairness in connection with the scenario of medical treatment decision-making had a significant influence on user trust
. The post-hoc
t-tests showed that user trust was significantly higher under the high level of introduced fairness than that under the low level of introduced fairness (
). However, there was neither a significant difference in user trust between the control condition and the high level of introduced fairness (
), nor between the control condition and the low level of introduced fairness (
).
The results showed that the effect of introduced fairness on user trust was similar in two scenarios, where the low level of introduced fairness decreased user trust while the high level of introduced fairness did not.
4.3.3. Explanation Types and Scenarios on Perception of Fairness
A two-way ANOVA test was performed to analyse the effect of explanation types and scenarios on the perception of fairness. There were no statistically significant interactions found in a perception of fairness between explanation types and scenarios , .
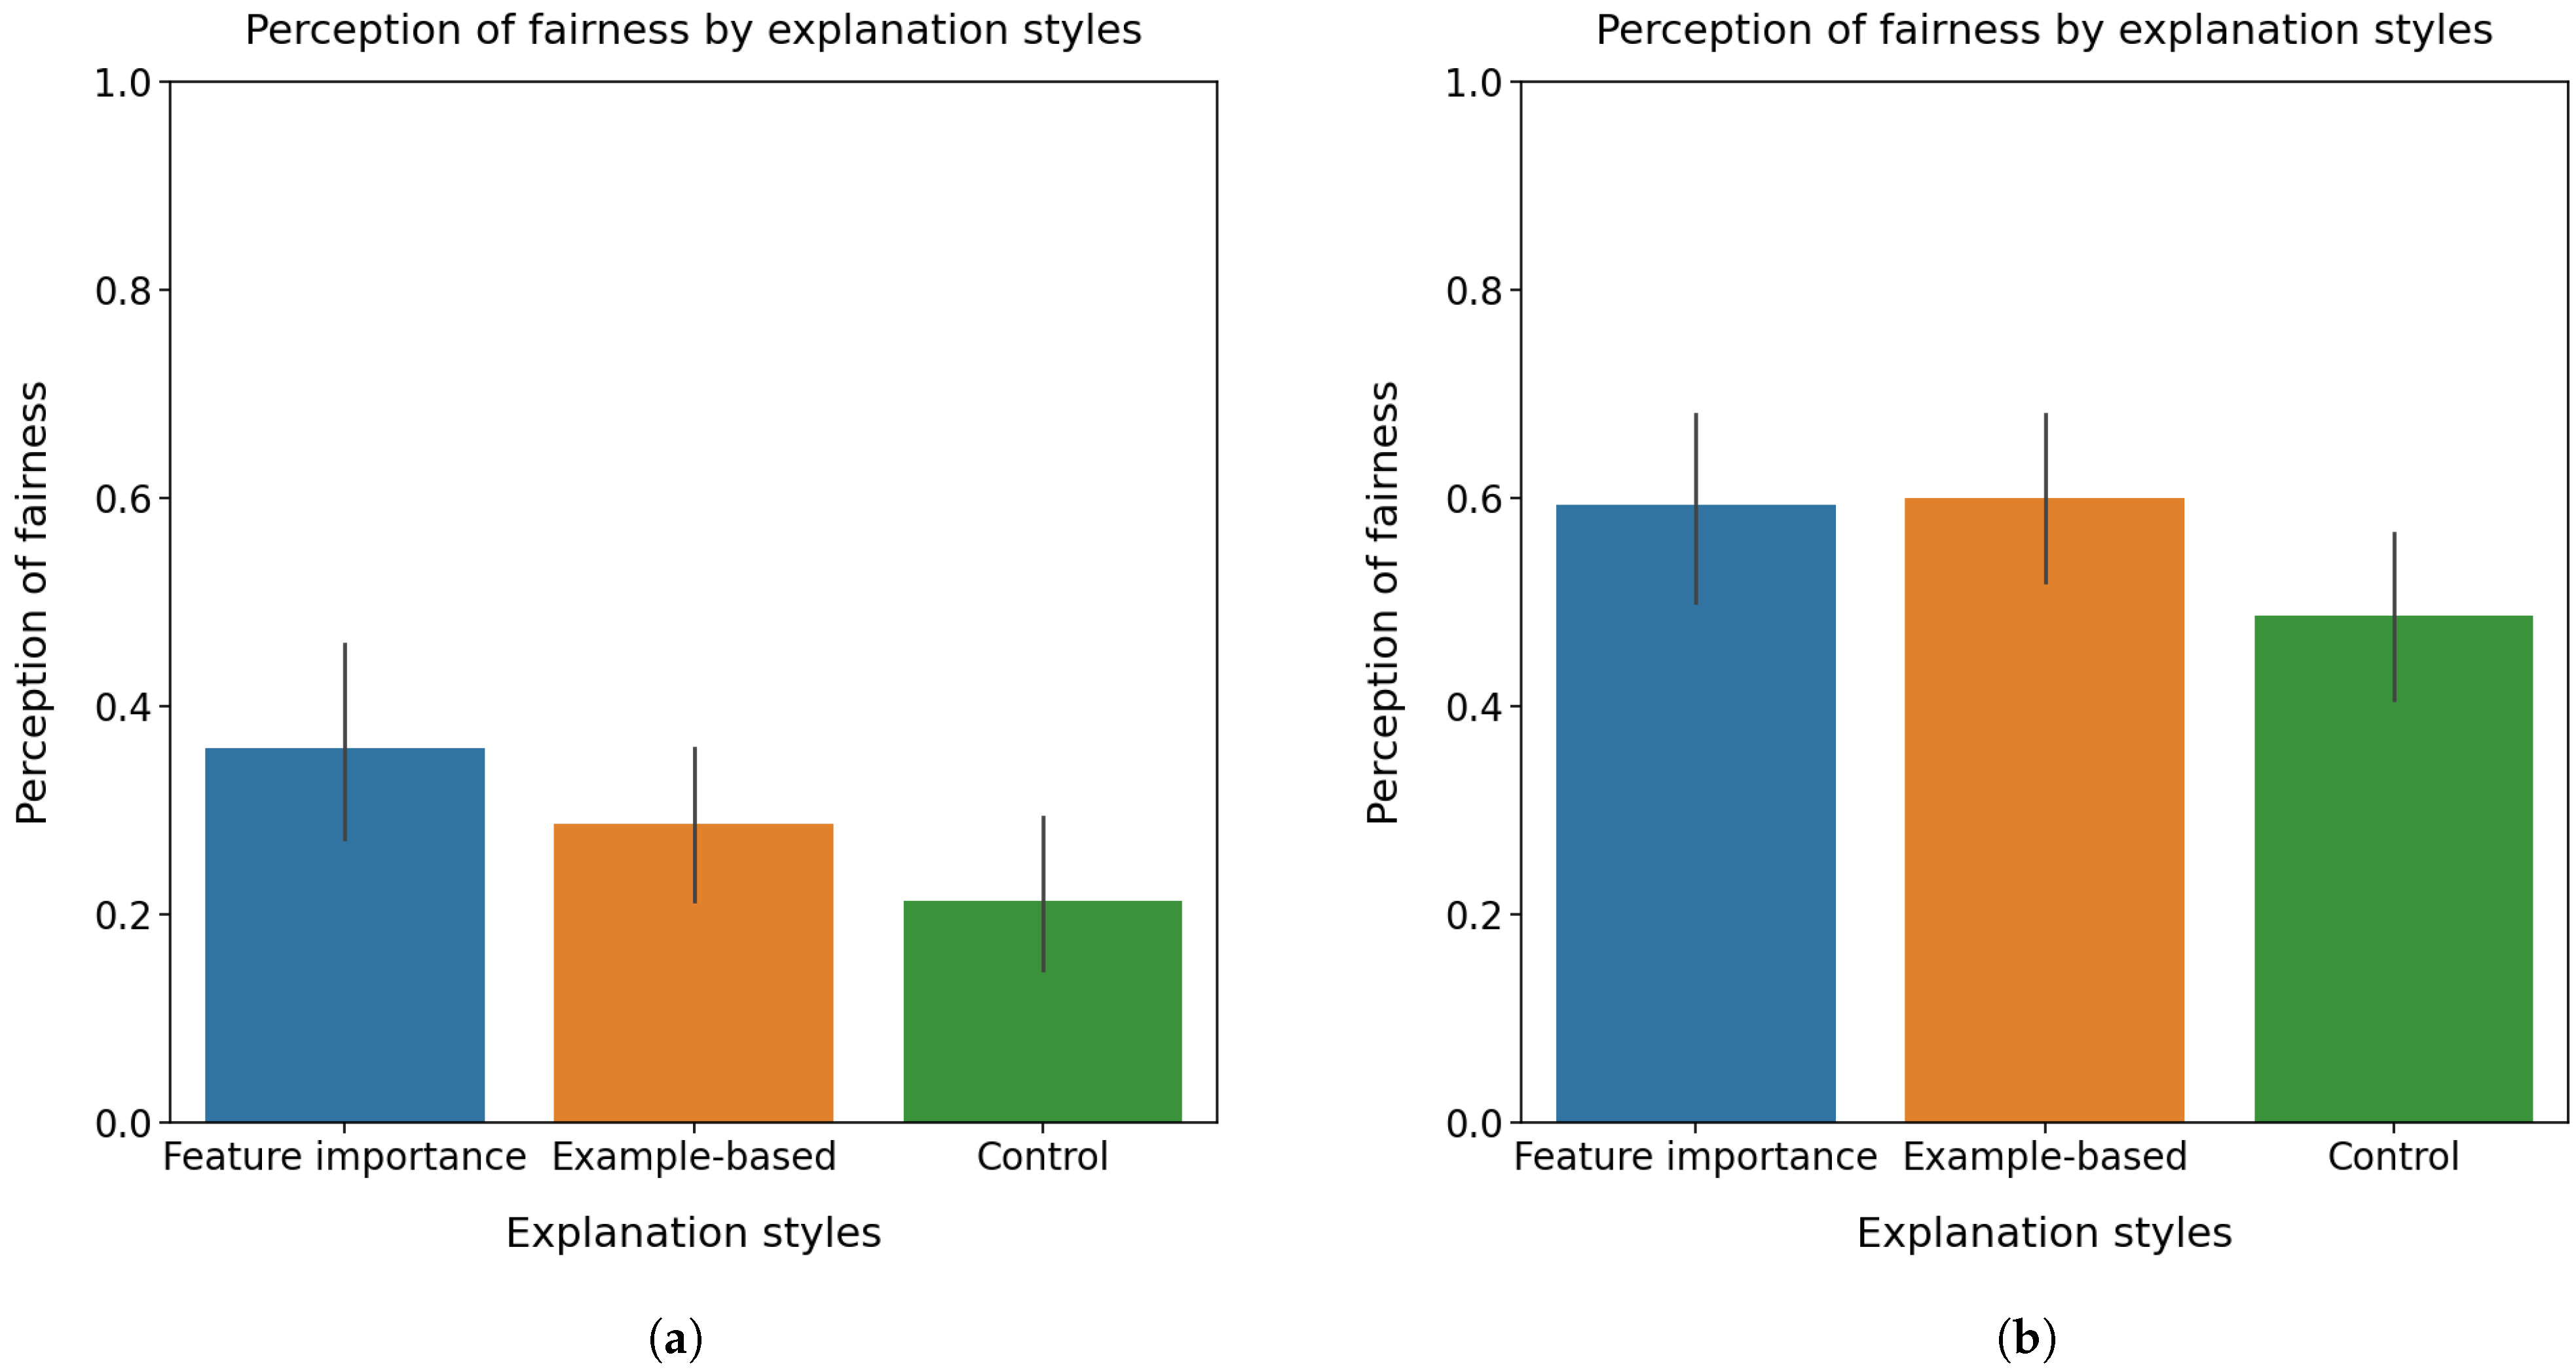
Figure 11a shows the normalised values of perception of fairness under different explanation types in the scenario of health insurance decision-making. A one-way ANOVA test showed a statistically significant difference in perceived fairness,
,
. The further post-hoc
t-tests found that participants had significantly higher perception of fairness under feature importance-based explanations than that under the control condition (no explanation presented),
. However, there was neither a significant difference in perception of fairness between example-based explanation and control condition (
) nor between the two explanation types (
).
Figure 11b shows the normalised values of perception of fairness under different explanation types in the scenario of medical treatment decision-making. A one-way ANOVA test found a statistically significant difference in perceived fairness among explanation conditions,
. The further post-hoc
t-tests found that the perception of fairness was significantly higher under example-based explanation (
) and feature importance-based explanation (
), respectively, than that under the control condition (no explanation presented). However, there were no significant differences in perceived fairness found between the two explanation types (
).
The results revealed that participants showed slightly different behaviours of perception of fairness in two studied scenarios, where example-based explanations increased perception of fairness in the medical treatment decision-making but not in the health insurance decision-making despite feature importance-based explanations increased perception of fairness in both scenarios.
4.3.4. Introduced Fairness and Scenario on Perception of Fairness
A two-way ANOVA test was performed to investigate the effect of explanation types and scenarios on the perception of fairness. There were no statistically significant interactions in the perception of fairness between introduced fairness conditions and scenarios, .
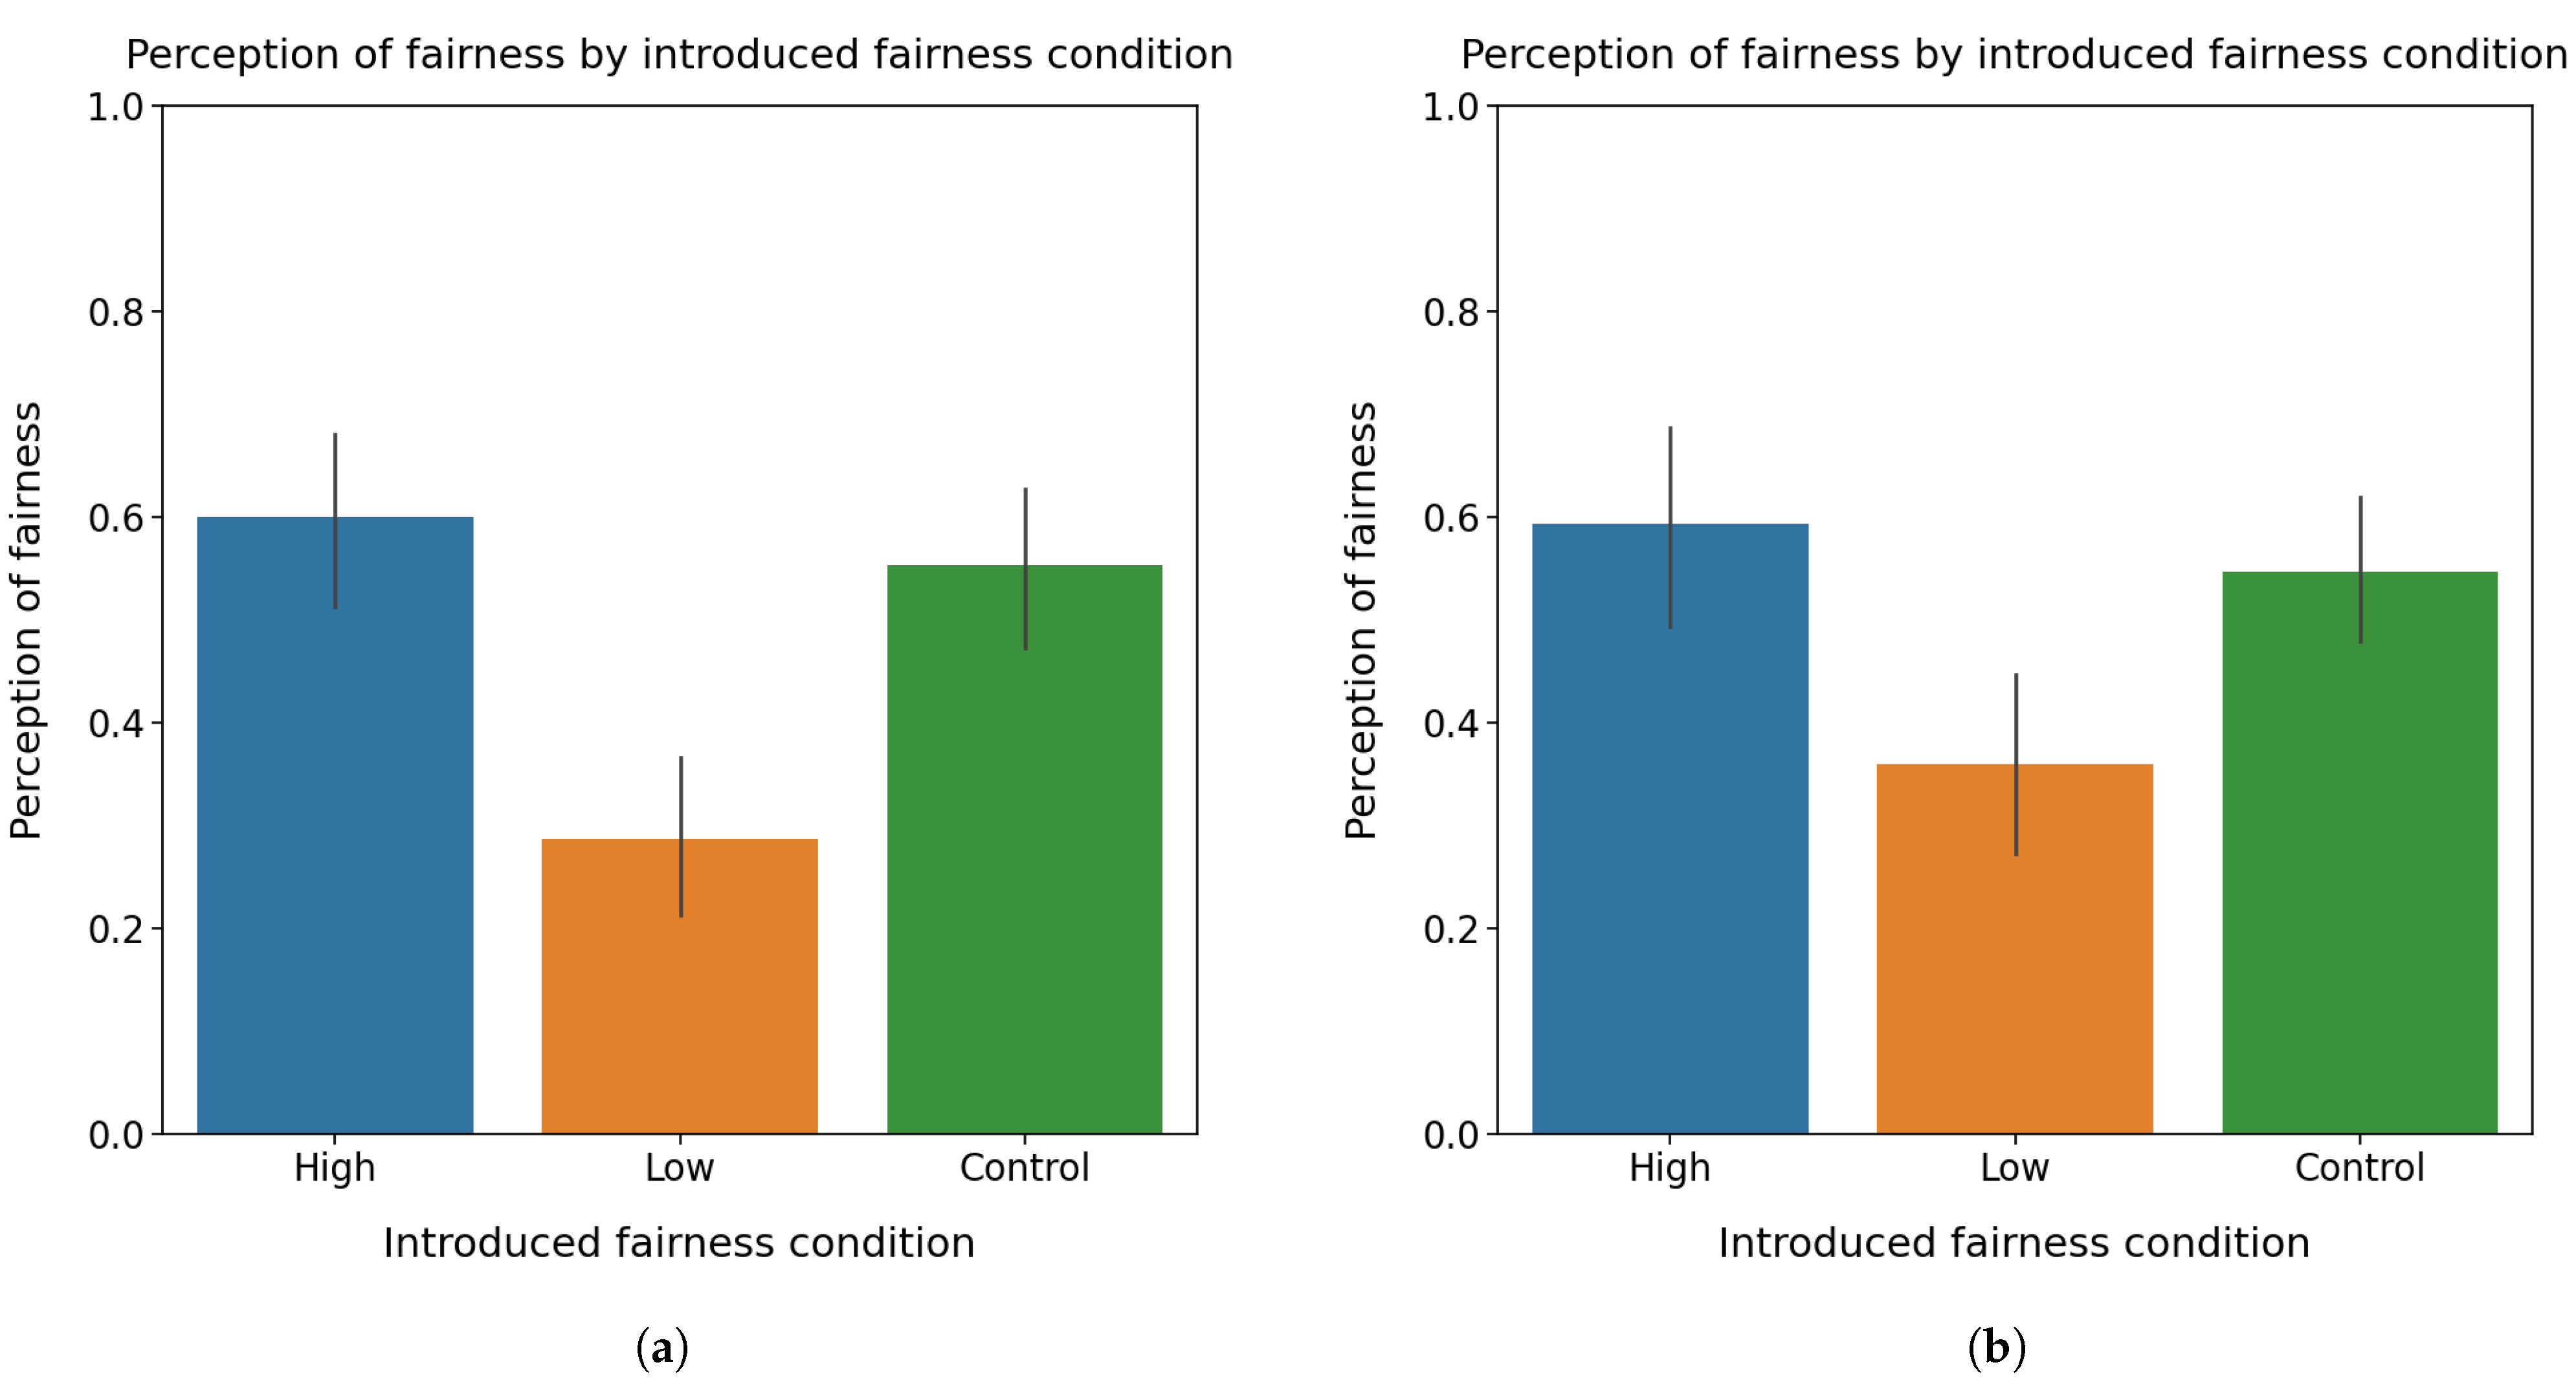
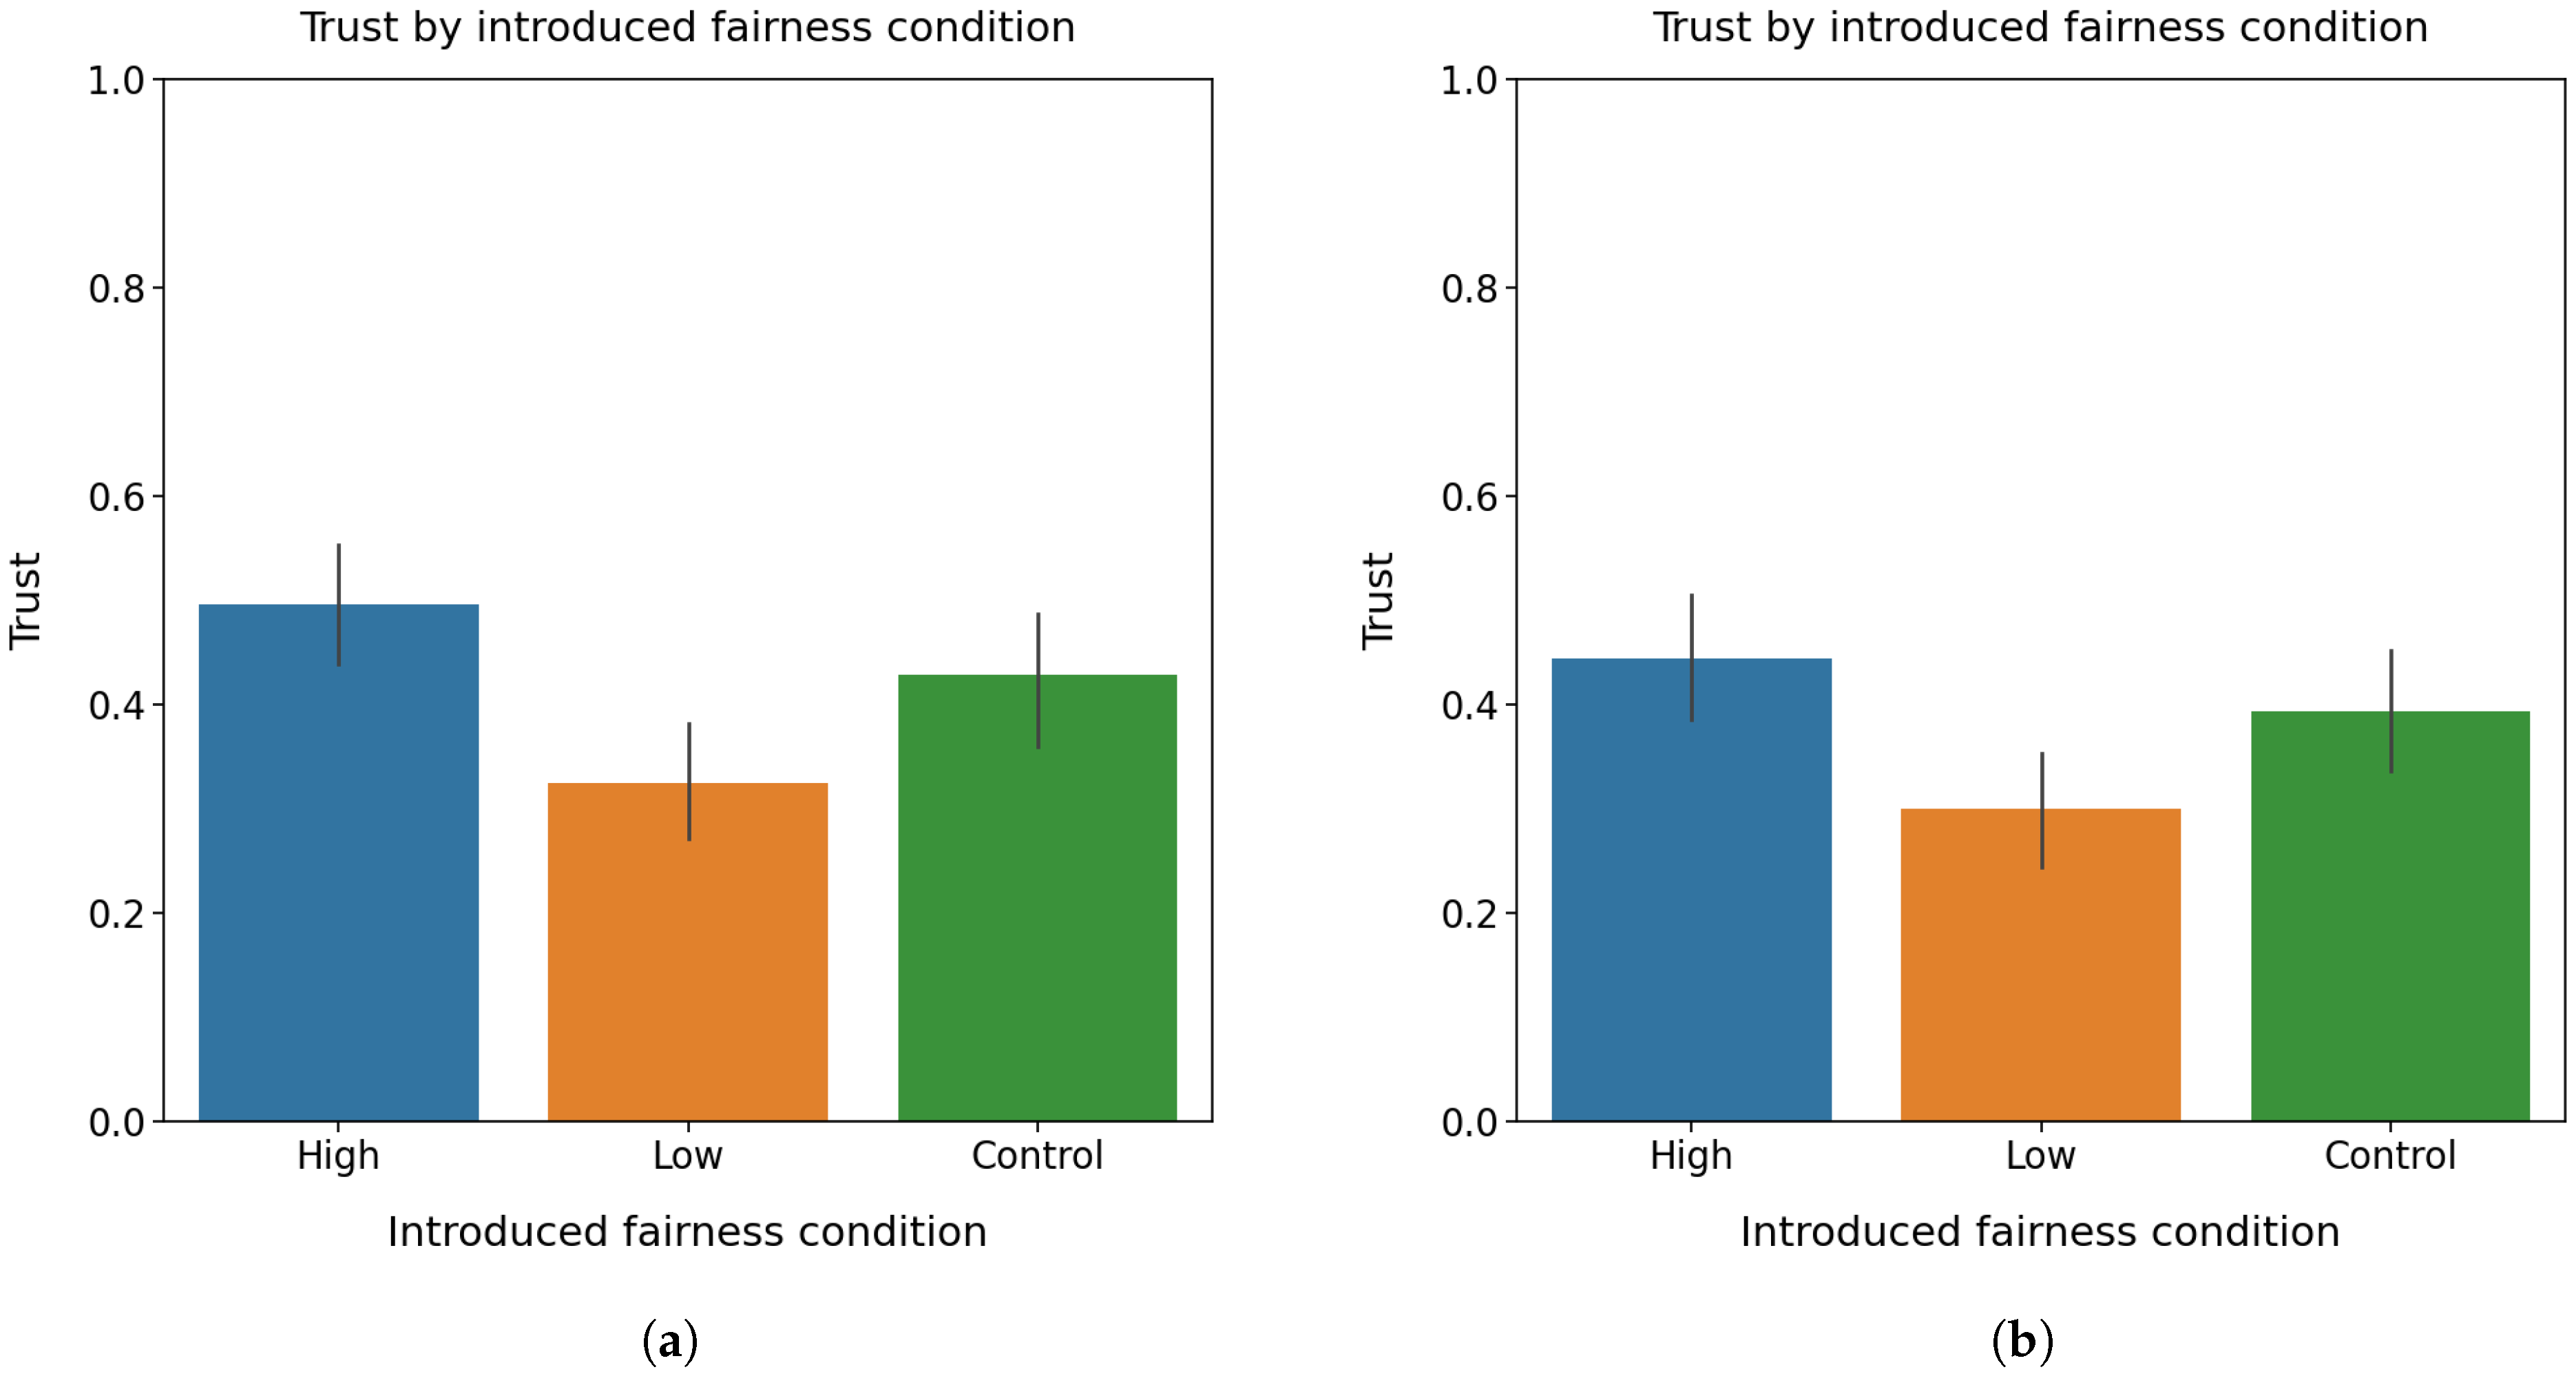
Figure 12a shows the normalised perception of fairness under introduced fairness conditions in the scenario of health insurance decision-making. A one-way ANOVA test revealed a statistically significant difference in perception of fairness among introduced fairness conditions,
. The further post-hoc
t-tests found that the perception of fairness was significantly higher under the high level of introduced fairness (
) and the control condition (no fairness information presented) (
), respectively, than that under the low level of introduced fairness. However, there were no significant differences in perceived fairness found between high-level introduced fairness and the control condition (
).
Figure 12b shows the normalised values of perception of fairness under introduced fairness conditions in the scenario of medical treatment decision-making. A one-way ANOVA test found a statistically significant difference in perceived fairness among introduced fairness conditions,
. The further post-hoc
t-tests found that the perception of fairness was significantly higher under the high level of introduced fairness (
) and the control condition (
), respectively, than that under the low level of introduced fairness. However, there were no significant differences in perceived fairness found between high level introduced fairness and the control condition (
).
The results indicated that participants showed similar behaviours of perception of fairness in two studied scenarios, where the low level of introduced fairness decreased perceived fairness while the high level of introduced fairness did not.
5. Discussion
As discussed in earlier sections, explanation and fairness are two indispensable components in AI-informed decision-making for trustworthy AI. AI-informed decision-making and automated aids have been becoming much more popular with the advent of new AI-based intelligent applications. Therefore, we opted to study the effects of both AI explanations and fairness on human-AI trust and human perception of fairness, respectively, in specialised AI-informed decision-making scenarios.
From the trust’s perspective, this study found that the fairness statement in the scenario did affect user trust in AI-information decision-making only under the low level of fairness condition, where the low-level fairness statement decreased user trust in AI-informed decision-making. However, the addition of explanations helped users increase their trust significantly in AI-informed decision-making, and different explanation types did not show differences in affecting user trust. We then drilled down into the effects on trust under specific conditions. From the explanation’s perspective, it was found that, under the example-based explanation condition, the low level of fairness statement significantly decreased the user trust in decision-making, but the high level of fairness statement did not affect user trust. Similar conclusions for user trust were obtained under the feature importance-based explanation condition. Furthermore, from the introduced fairness’ perspective, it revealed that, under the low level of introduced fairness, the feature importance-based explanation significantly increased user trust in decision-making, but the example-based explanation did not. The high level of introduced fairness showed similar effects on user trust as the low level of introduced fairness. It also implies that the introduced fairness levels did not affect user trust too much.
From the perceived fairness’ perspective, this study found that the fairness statement in the scenario did affect the user’s perception of fairness, where the low level of introduced fairness decreased the user’s perception of fairness, while the high level of introduced fairness increased the user’s perception of fairness. Moreover, the addition of explanations benefited the perception of fairness, and different explanation types did not show differences in affecting the perception of fairness. We also drilled down into the effects on perceived fairness under specific conditions. From the explanation’s perspective, it was found that, under example-based explanations, the low level of introduced fairness decreased the perception of fairness, while the high level of introduced fairness did not. Similar conclusions were obtained for the perception of fairness under feature importance-based explanations. From the introduced fairness’ perspective, the results showed that, under the low level of introduced fairness, feature importance-based explanations significantly increased participants’ perception of fairness, while example-based explanations did not. However, different explanation types did not benefit a human’s perception of fairness under the high level of introduced fairness. It shows that the effects of fairness levels and explanation types are different from their effects on user trust.
We also compared participants’ responses of trust and perception of fairness under different application scenarios of health insurance decision-making and medical treatment decision-making. It was found that the effect of explanations on user trust was slightly different in the two scenarios despite explanations increasing user trust in both scenarios. The effect of introduced fairness on user trust was similar in two scenarios, where the low level of introduced fairness decreased user trust while the high level of introduced fairness did not. From the perceived fairness’ perspectives, participants showed slightly different responses to the perception of fairness under different explanation types in two studied scenarios, where example-based explanations increased user trust in the medical treatment decision-making but not in the health insurance decision-making despite feature importance-based explanations increased user trust in both scenarios. While participants showed similar behaviours of perception of fairness in two studied scenarios, where the low level of introduced fairness decreased perceived fairness and the high level of introduced fairness did not.
Compared with previous studies [
68] which only focus on the analysis of explanations on human’s perception of fairness and trust, this study investigated the effects of both AI explanations and introduced fairness on perceived fairness and trust in AI-informed decision-making. Such analysis helps to have a more comprehensive understanding of interrelations between explanations and fairness in AI-informed decision-making.
These findings suggest that the deployment of AI explanation and fairness statements in real-world applications is complex: we need to not only consider explanation types and levels of introduced fairness but also consider the scenarios that AI-informed decision-making is used for. In order to maximise user trust and perception of fairness in AI-informed decision-making, the explanation types and the level of fairness statement can be adjusted in the user interface of intelligent applications.


 ,
, 


